1. Introduction
Power systems have become more complex than in the past, caused by the integration of numerous Distributed Generation Resources (DGRs) and the rapidly growing power electronic converter (PEC) based technologies. The modern power system faces complex transformation in all levels, such as generation, transmission, distribution, and utilization [
1]. With this rapid transformation, the modern power system faces significant changes in the power system dynamics; one of the main reasons behind this is reduction of system inertia because of these PEC-based technologies [
2]. In the conventional power system, most of the power generators were of the synchronous type; they are characterized as the source of rotational inertia in a power system, whereas in a modern power system, the proportion of synchronous generators is at a decreasing rate [
3]. Moreover, the PEC-based technologies adopted in the generation (e.g., kinetic energy less solar PV and doubly-fed induction generator based wind turbines), transmission line (e.g., HVDC), distribution system (e.g., controllers), and utilization level (e.g., controller based equipment) do not contribute to the system inertia, which results in a drop of system inertia in the modern power system, resulting in drastic changes in the system dynamics [
4]. Not only these but the transient stability of the DGR integrated power system is also highly sensitive to the proportion of the penetration level, fault location and its severity [
5]. Titlens et al. presented a detailed study on the relevance of inertia in the operation and control of a power system, which shows that the decreasing system inertia results in the high Rate of Change of Frequency (RoCoF) values and frequency deviation, which may increase the system instability [
6]. The DGRs are integrated into the distribution lines at a low voltage level, which increases the amount of fault current [
7]. Hence the penetration of DGRs on a considerable scale can lead to problems in overall frequency response, transient stability, fault rid-through capability, voltage response, load-following capability and system regulation [
8].
Impact assessment is an important task from the planning and operation prospects since an unidentified proportion of parameters may create system instability and even system blackouts, especially after a fault within that system. Some studies had been conducted to assess system performance and their sensitivity under a different mode of operations. Jorge performed an assessment on the frequency and transient stability of the RESs penetrated grid, in which the author focused on the transient instability in the power system by considering the grid parameters [
9]. A study [
10], proposed a systematic approach to analyzing the transient stability of the 39-bus New England power system, where the authors considered the generator-based threshold as a limit function. Similarly, Perilla et al. investigated the degree of the transient stability enhancement in the wind turbine integrated power system via parametric sensitivity and sophisticated approaches [
11]. Sajadi et al. presented a comprehensive study on established transient stability indicators including rotor angle difference, rate of machine acceleration, and transient potential and kinetic energies [
12]. Tamimi et al. investigated the impact of penetration levels of solar PV through small-signal stability for the real data of Ontario power system and its neighboring system, which concluded that the distributed solar systems are more advantageous than the single solar farm considering the stability of a power system [
13]. However, the eigenvalue analysis showed that the DGR penetration has no significant impacts on small-signal stability [
13]. On the other hand, Pieter Tielens concluded that the eigenvalues move toward the negative of the real part with poor damping with the decreasing inertia, and the system stability becomes sensitive with the generation plant’s location [
14]. Wang et al. conducted a study on the CCTs for a micro-grid system under fault conditions, which concluded that the CCTs are highly sensitive to the DGR penetration level and the wind turbine crowbar protection insertion time [
15]. Sadhana et al. conducted the small signal stability analysis for the grid-tied DGR with the effect of uncertain wind turbine penetration by using Lyapunov’s stability criteria and concluded that the wind penetration has no effects on the low-frequency oscillation at a remote area [
16].
Studies conducted for a variety of case studies present different results and conclusions, which may mislead the audience. The same factors that have been found to be sensitive for a case have not been found to be sensitive for other cases. However, the parametric sensitivity analysis is very important to analyze the power system dynamics, which can help to reduce the potential effects on a specific case system. Hence, this paper is conducted to analyze the parametric sensitivity of the rotor angle stability indicators of a multi-machine power system. The major contributions of this paper are as follows:
Transient stability assessment and small-signal stability assessment are conducted to calculate the indicators considering the three scenarios and six sub-cases. The DIgSILENT Programming Language (DPL) is used as the scripting tool for the execution task, and the case study of 39 Bus New England power system is taken for this study. Statistical analysis has been performed to analyze and visualize the characteristics of the indicators in different cases and sub-cases.
The assessments have been conducted for both the transmission lines and the bus systems. Different DPL has been implemented to evaluate the indicators for both systems.
The area-wise impact of reduced inertia has been discussed within a multi-machine power system. For this, the inertia of an area is reduced, and its impacts on overall system have been observed. From this analysis, it is found that the reduced inertia affects the local area significantly, whereas the neighboring areas have been less affected.
The authors of this paper aim to present the parametric sensitivity analysis of the rotor angle stability indicators with the power system inertia, which may help to analyze the dynamics of that system under its normal operation as well as in contingency. This paper first discussed the stability problems that occur in the power system by DGR penetration via previously published works.
Section 2 presents the adopted methodology and the assumptions made during the analysis. The obtained results are discussed in
Section 3, based on which conclusions have been drawn and discussed in
Section 4.
2. Method and Assumptions
CCT is the time interval up to which the occurred fault must be cleared so that the system retains its stability, and it is important to analyze the performance evaluation that can be depended on various factors such as inertia constant of a machine, system frequency, critical clearing angle and the initial power angle [
17]. CCT has an important role in the power system since the system must restore its original state within that time. A lower value of CCT leads to system instability if the system is unable to retain its original state within that value of time. Similarly, the eigenvalue is the next indicator used in the rotor angle stability analysis. The eigenvalues are the system modes (or value of the system property) that provide the status of a system in a linear invariant system. It must require to be stable of all modes for a stable power system; all of the conjugated eigenvalues (
α ±
jω) must have the negative valued real part. For a stable power system, it is also desired that the oscillations of electromechanical machines must be damped out as soon as possible. For simplicity, the outcomes of the eigenvalue analysis are presented in the form of damped frequency and damping for each system mode. During the analysis, the system is considered as the classic one; hence, there are 2*n modes for n number of generators (e.g., 20 modes for 10 generators). The small-signal stability analysis should be conducted for the obtained modes.
The parametric sensitivity analysis is the study of uncertainty; how a parameter within a function differs from the changes in other values. It has an important role in the system performance assessment from the planning prospects. The main objective of this paper is to present the parametric sensitivity analysis of the rotor angle stability indicators with the power system inertia (i.e.,
TCCT,
λ,
ω and
ζ). However, the rotor angle stability analysis is highly dimensioned and non-linear from the mathematical point of view, and is presented by a set of differential-algebraic equations as given in Equation (1) [
14]:
Here,
F is the function,
X (X ϵ ) is the vector state variables,
Y (
Y ϵ ) is the vector of algebraic variables, and
P (
P ϵ ) is the vector of parameters, for the electromechanical dynamics within a power system. Equation (1) presents the dynamics of the power system network, static loads and the generator’s stator equation. The dynamics of a synchronous machine can be described by the following differential equation (i.e., swing equation):
Here
H is the inertia constant in MJ/MVA,
Srated is the rating of that machines in MVA,
Pm and
Pe are the mechanical and electrical power in MW, and
ωs is the angular frequency. The simplified swing equation for a multi-machine system can be written as follows:
However, if the small signal approximation is considered for a multi-machine power system, the dynamic behaviour of an equivalent system can be expressed as Equation (4), where
KD is the damping constant for the equivalent system, and
δ0 is the initial power angle.
Equations (5)–(7) present the mathematical expressions for the CCT, overall system frequency and the damping for a power system. From the Equations, the indicators are found to be dependent on the system inertia.
In this paper, the parametric sensitivity analysis of such indicators has been conducted with respect to the inertia constants. From these mathematical expressions, it can be concluded that the rotor angle stability indicators are dependent on the system inertia constant, and the stability analysis of such indicators can be conducted concerning system inertia for a specific case, which further helps to analyze the system dynamics under different operating conditions.
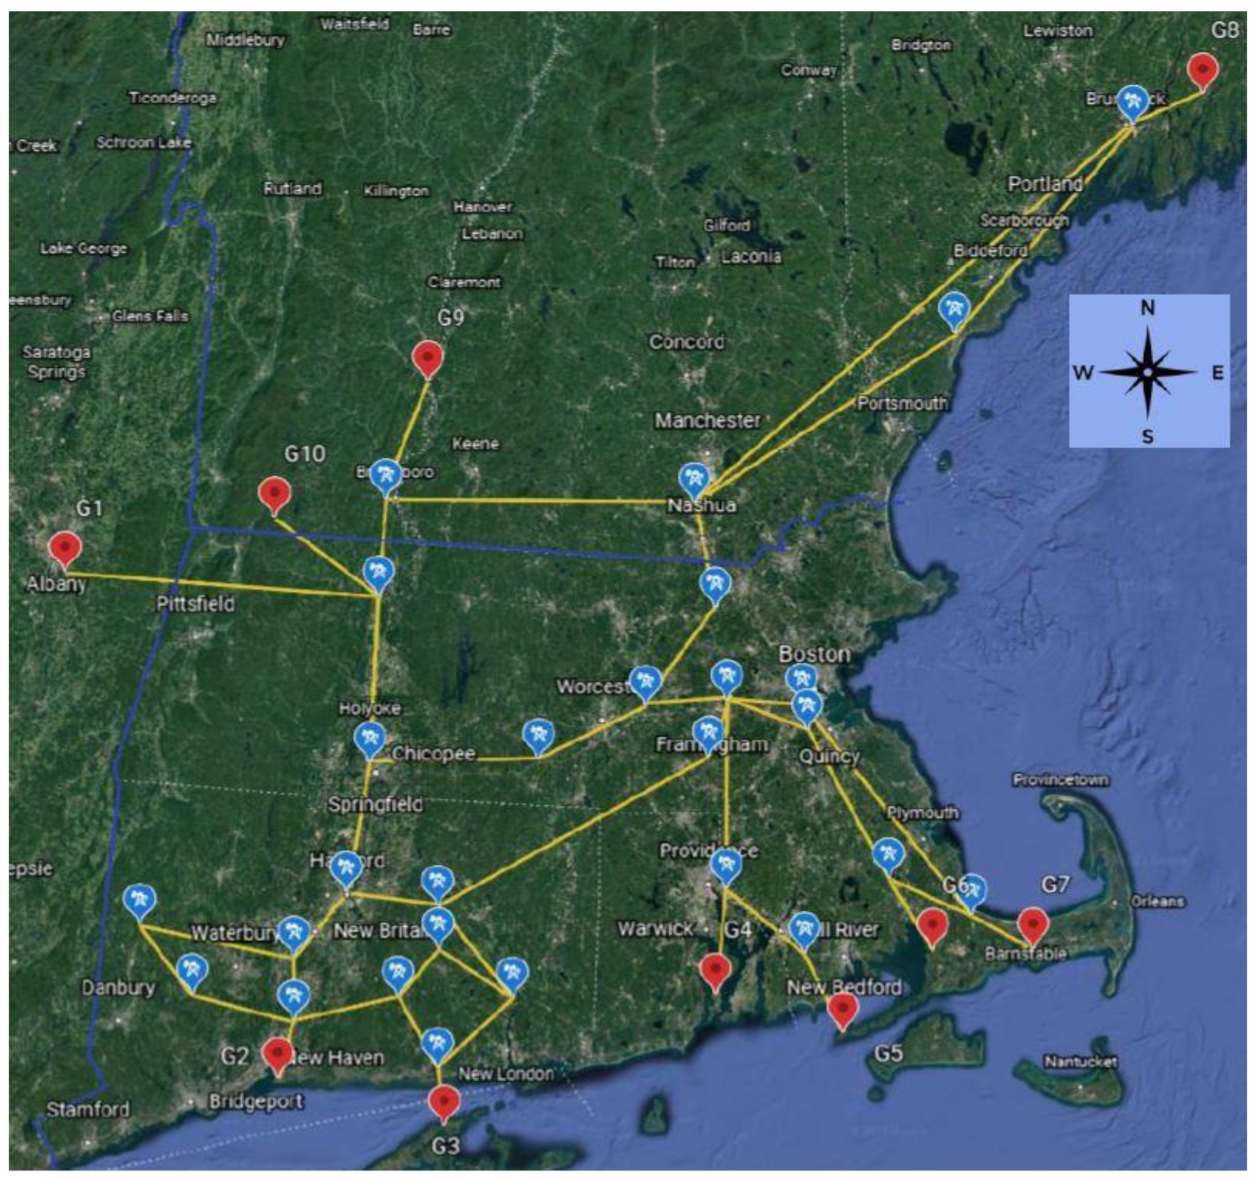
This paper takes the IEEE 39 Bus New England power system as the case study that contains ten generators, 39 buses and 33 connecting lines as shown in
Figure 1. The total system is divided into three parts (i.e., West, North and South) based on their geographical structure and separated by the blue lines as shown in
Figure 1. The West area is considered as a single generator for the aggregated power system containing multi-machines (i.e., G1), whereas the North area contains three generators (i.e., G8, G9, and G10) and the South area contains six generators (i.e., G2, G3, G4, G5, G6, and G7). All of the components of the power system are modelled in a powerful tool called DIgSILENT PowerFactory for the analysis, and the DIgSILENT Programming Language (DPL) is used as the scripting tool for the execution task. The DPL files created to evaluate the CCTs for transmission lines and Bus systems can be found in [
18,
19]. Similarly, the information of the components is referred to from a paper [
20]. After the interfacing of DPLs with the network in DIgSILENT PowerFactory, the transient stability assessment is conducted to evaluate the values of CCTs and the small-signal stability assessment for the eigenvalues, damping, and damped frequency.
For the sensitivity analysis of the inertia constant, three scenarios and six sub-cases for each scenario have been considered in this study. As shown in
Table 1, in the first scenario, the inertia level of the West and South areas was taken as normal and that of the North area is considered as low. Similarly, the inertia level of the South area is taken as low in the second scenario, whereas both areas (North and South) are considered with low inertia levels in the third scenario. The nominal values of the inertia constants are considered as the original value taken from the source [
20], whereas for low inertia value, five steps (i.e., 50, 60, 70, 80, and 90% of nominal inertia value) have been implemented and analyzed with six sub-cases (i.e., base case H, 0.9H, 0.8H, 0.7H, 0.6H, and 0.5H). The important indicators of the power system stability such as CCTs, eigenvalue points, damping, and damped frequency are identified for these three scenarios and the sub-cases, and the conclusions have been drawn from the observed results.
3. Simulation Outcomes
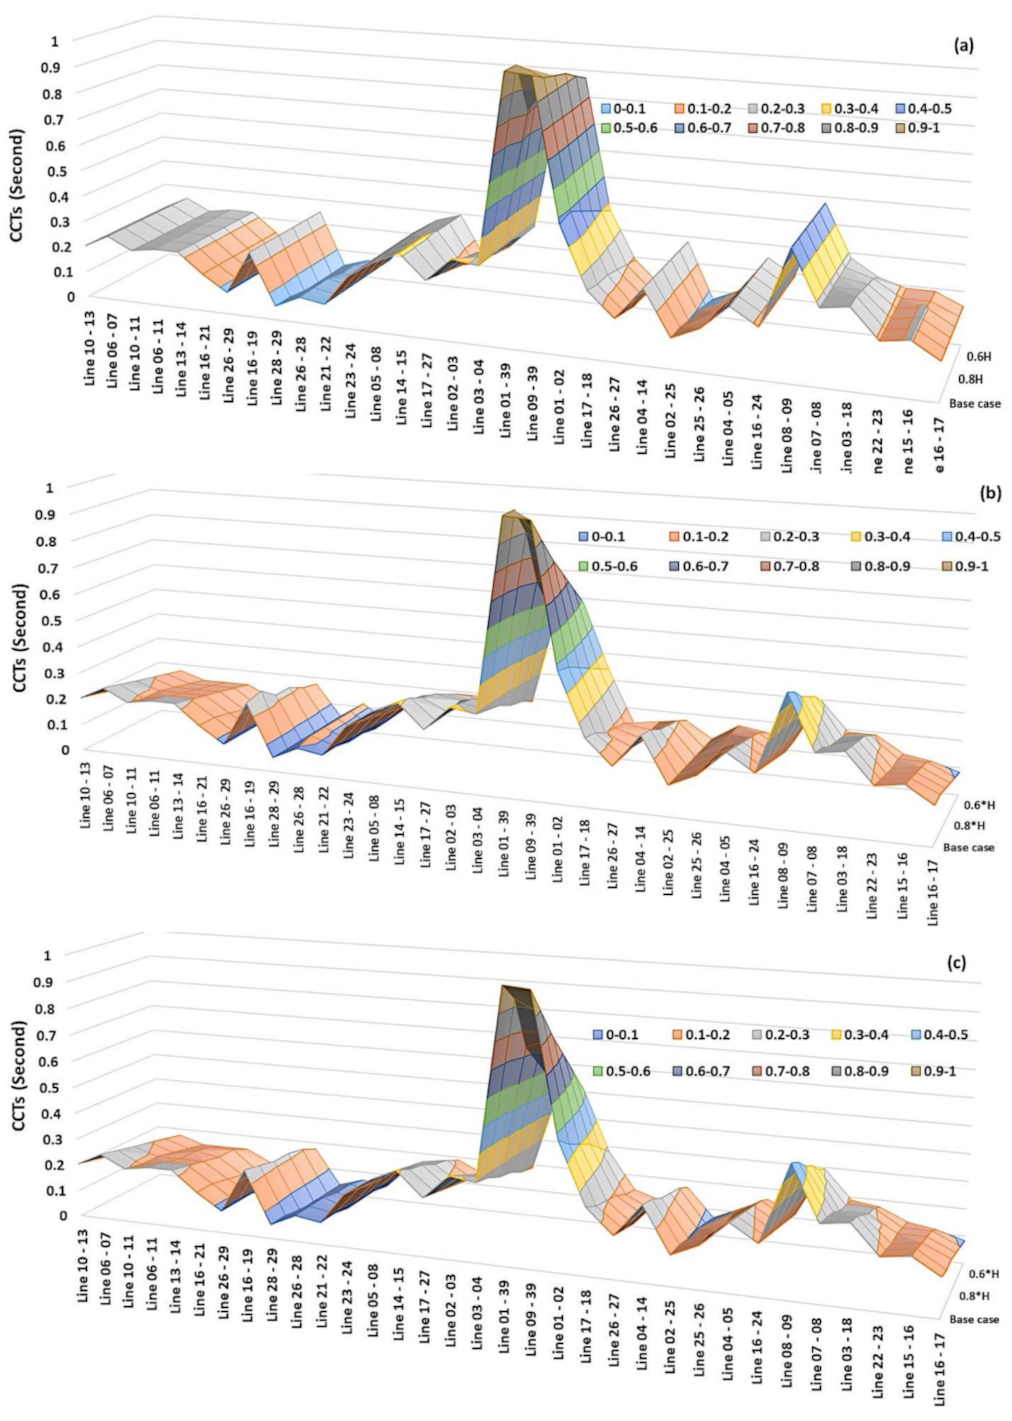
For the case study of 39 Bus New England power system, the CCTs at each transmission line have been identified by considering the three scenarios and six sub-cases. During the analysis, at first, a fault is created in a line, and the DPL is used to identify the CCTs for each transmission line. The results obtained from the simulation have been visualized and presented in
Figure 2.
Figure 2a–c presents the CCTs obtained at each transmission line at different values of inertia constant (i.e., H, 0.9H, 0.8H, 0.7H, 0.6H, and 0.5H), and categorized for the three scenarios as given in
Table 1. In most of the transmission lines, the CCTs decrease with the decrease in inertia constant, which can be seen in the figure clearly. In comparison to scenario ‘a’, scenario ‘b’ has more difference rate, while scenario ‘c’ has more difference rate than the other two scenarios since the overall system inertia is decreased in the same way (i.e.,
Ha >
Hb >
Hc). In
Figure 2, the slope of the graph indicates the difference rate of the CCTs for the scenarios, where it is found to be higher in scenario ‘c’ in comparison to the other two scenarios. In all of the scenarios, the CCTs for the transmission lines near the G1 (i.e., Line 03–04, Line 01–39, Line 09–39, and Line 01–02) are observed to be quite higher than compared to others. To investigate the reason behind this, the CCTs at separate areas of the power system have been identified in different scenarios with all sub-cases. The detailed information on the CCTs is listed in
Table 2.
As given in
Table 2, in all of the cases, the values of CCTs are decreasing from top to down and left to right, since the inertia constant is decreasing in the same order. In scenario ‘a’, only the inertia of the North area is reduced, but
Table 2 shows that the decreased inertia affects the CCTs at all the power systems. However, the difference rate is observed to be higher in the North area and lower in the other two scenarios. Similarly, in scenario ‘b’, the difference rate is higher in the South area, since the inertia of the South area is reduced in this scenario. Significant effects can be observed in scenario ‘c’, since the decreased inertia in that scenario is higher in comparison to other scenarios (decreased inertia in the North and South area). From this, it is clear that the CCTs depend on the location. Not only that, the CCTs for all of the components are observed to be reduced with a certain difference rate with the change in inertia at a place. From this data, it is clearly shown that the CCTs of all components decrease with the decrease in inertia at any section of the multi-machine power system, although the effect is higher in the local area and less in the neighboring areas.
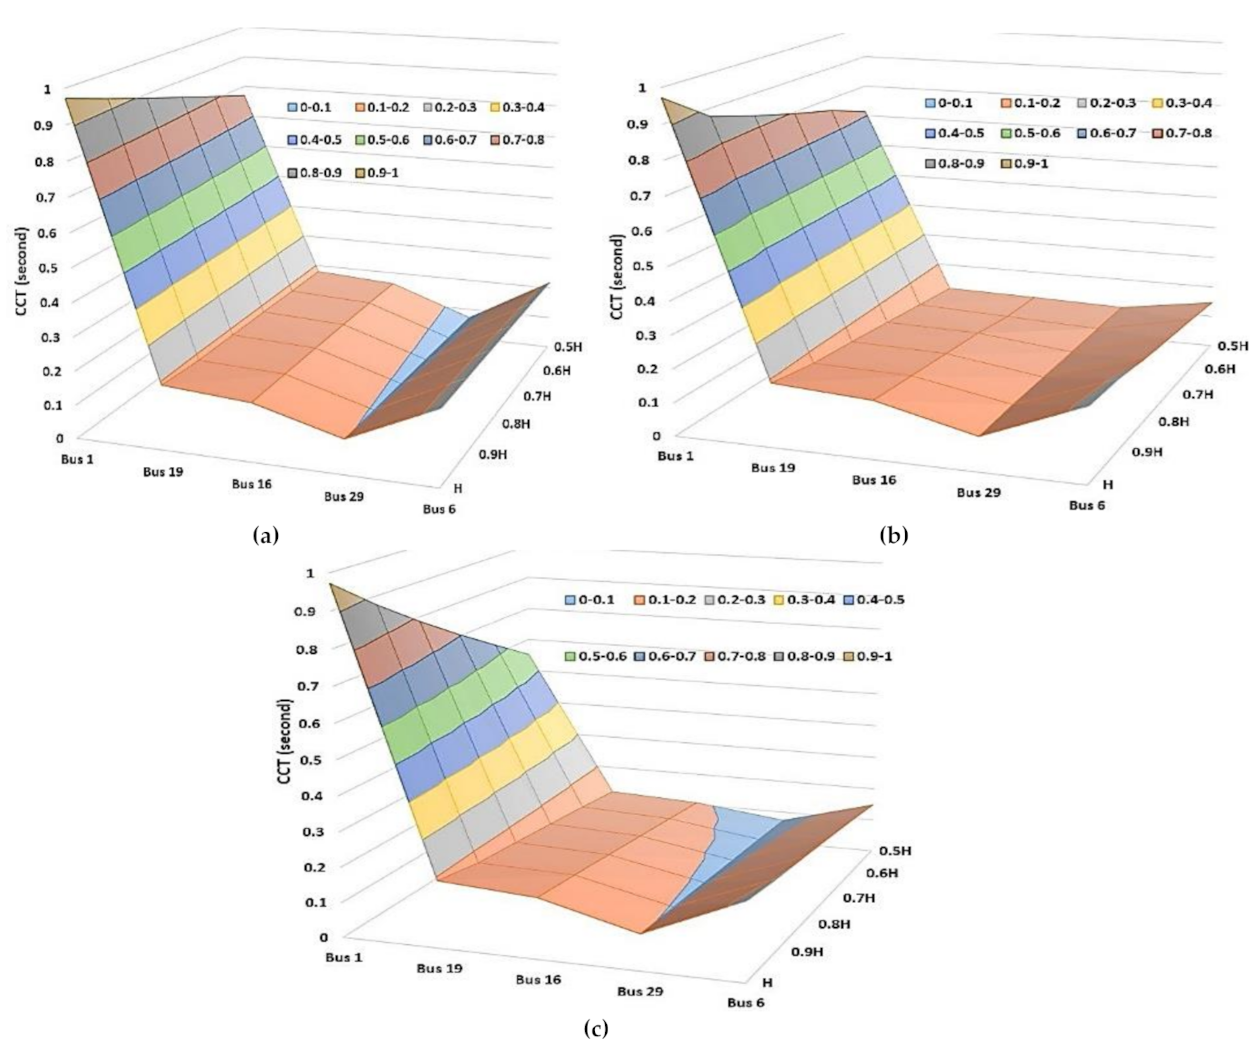
On the other side,
Figure 3 presents the characteristics of the CCTs for the bus system after disturbance. A similar process to transmission line has been applied to analyze the CCTs at the bus system by creating a fault at a specified bus bar. Like
Figure 2,
Figure 3a–c presents the CCTs obtained at different bus bars at different values of inertia constant (i.e., H, 0.9H, 0.8H, 0.7H, 0.6H, and 0.5H), but in this stage, the authors have selected a sampled number of buses (i.e., Bus 1, Bus 6, Bus 16, Bus 19, and Bus 29). There is no reason behind the selection of the specified buses; it is just a collection of buses from diverse areas for the purpose of analyzing their nature. From this analysis, it is observed that the CCTs for the buses show the same nature as for the transmission lines: decrease with the decreasing system inertia. The decreasing rate of CCTs in scenario ‘a’ is lower than that of scenario ‘b’, and that in scenario ‘b’ is lower than that of scenario ‘c’.
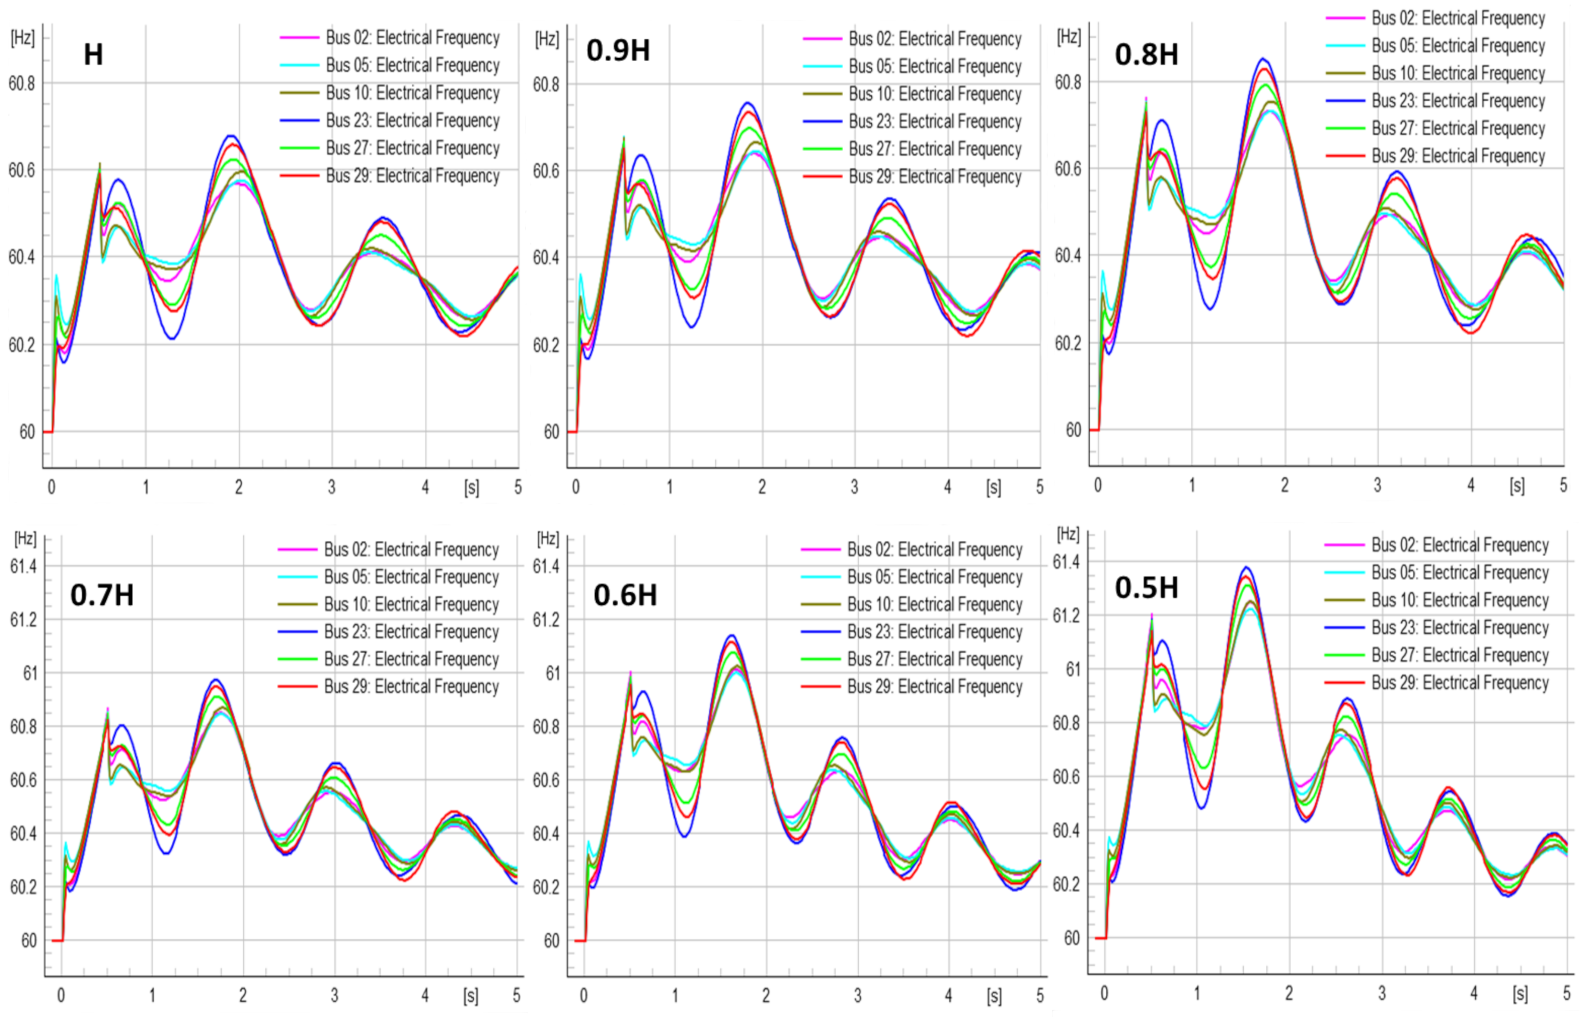
Similarly,
Figure 4 presents the frequency dynamics at the buses, when the system inertia of all systems differs. At this stage, the inertia of all generators has been changed, and the frequency dynamics are analyzed. As shown in
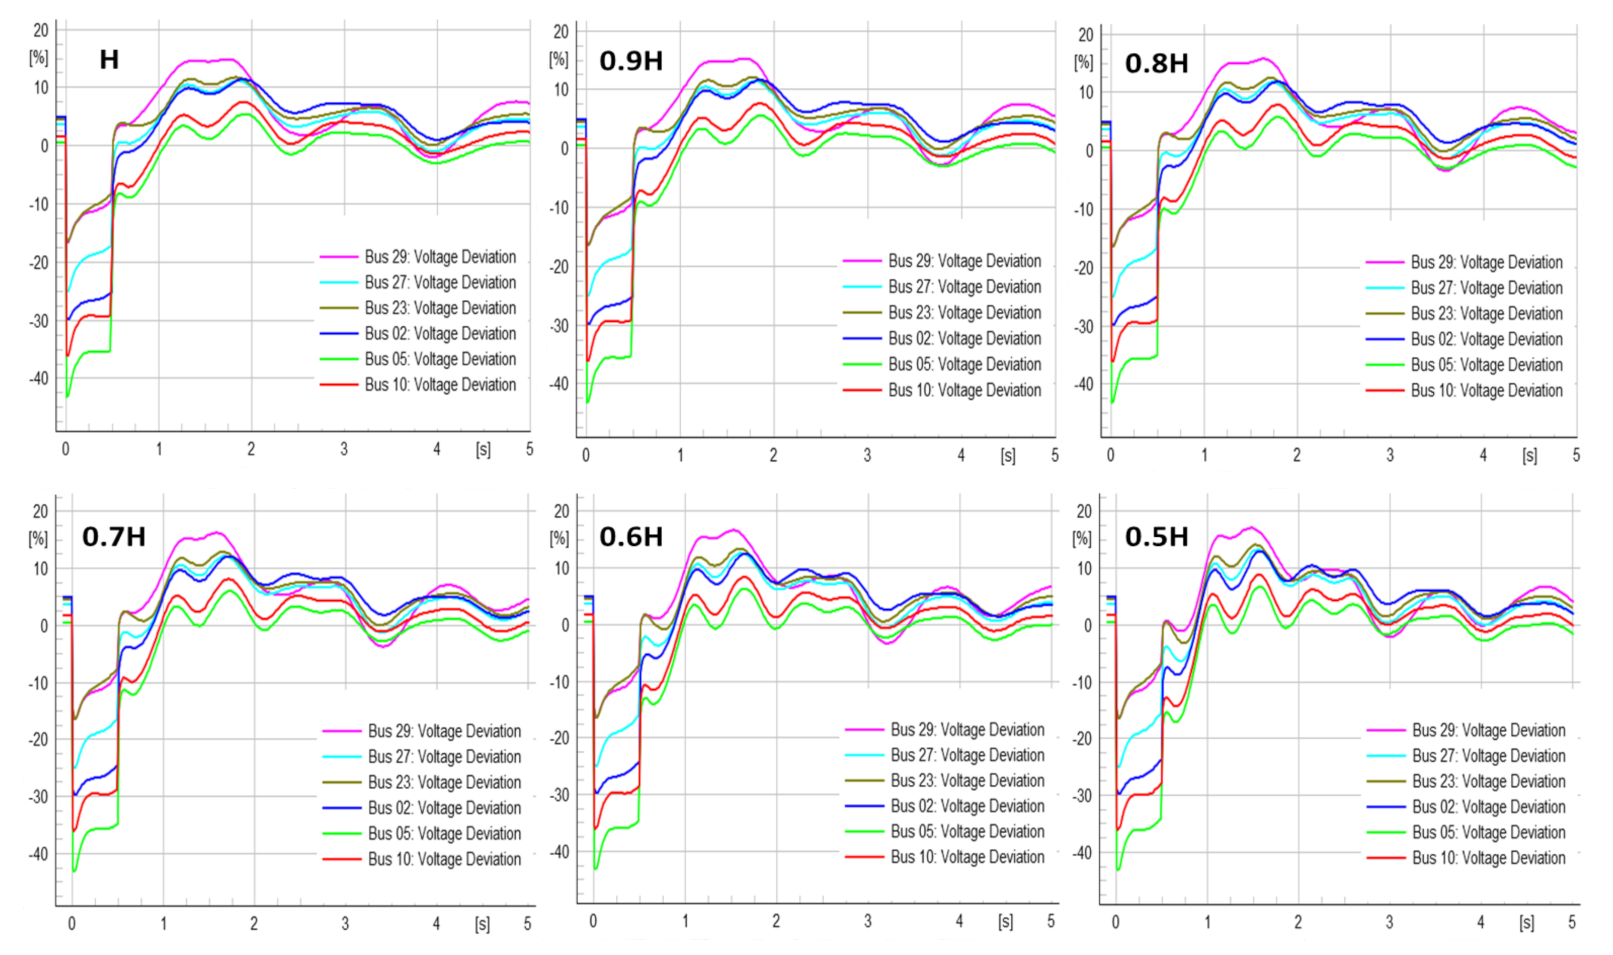
Figure 4, the first spike just after the fault is similar in all cases, but the magnitude of other spikes increases with the decreasing system inertia, although the natures of the spikes are similar. At the original system inertia, the peak frequency is calculated to be 60.68 Hz, whereas the value is calculated to be 61.39 Hz when the system inertia is set to 50%. The number of wave cycle is also increasing for a constant time period of 5 s with the decreasing order of system inertia. A similar effect can be shown in the voltage deviation: higher swing nature with reduced system inertia, as shown in
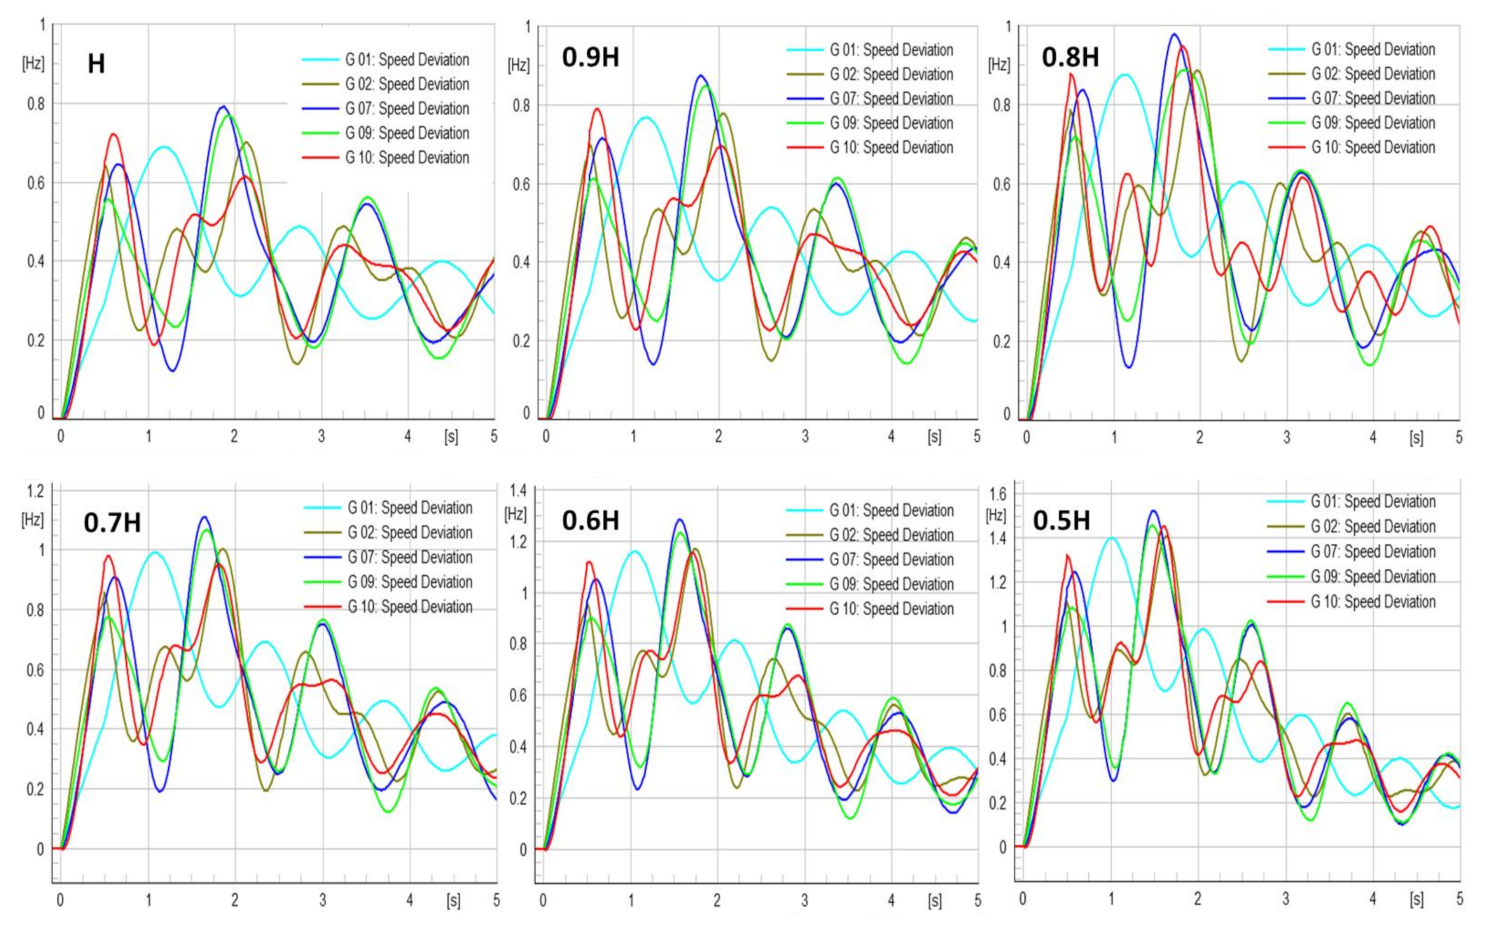
Figure 5. Similarly, the speed deviation of the generators is also affected with the system inertia. As shown in
Figure 6, the speed deviation of the generator increases with the decreases in system inertia. The maximum speed deviation is observed in the Generator 7, which is calculated to be 0.8Hz at original system inertia and 1.5 Hz at 0.5H. From all these characteristics, it is observed that the indicators of the power system stability are dependent on the system inertia.
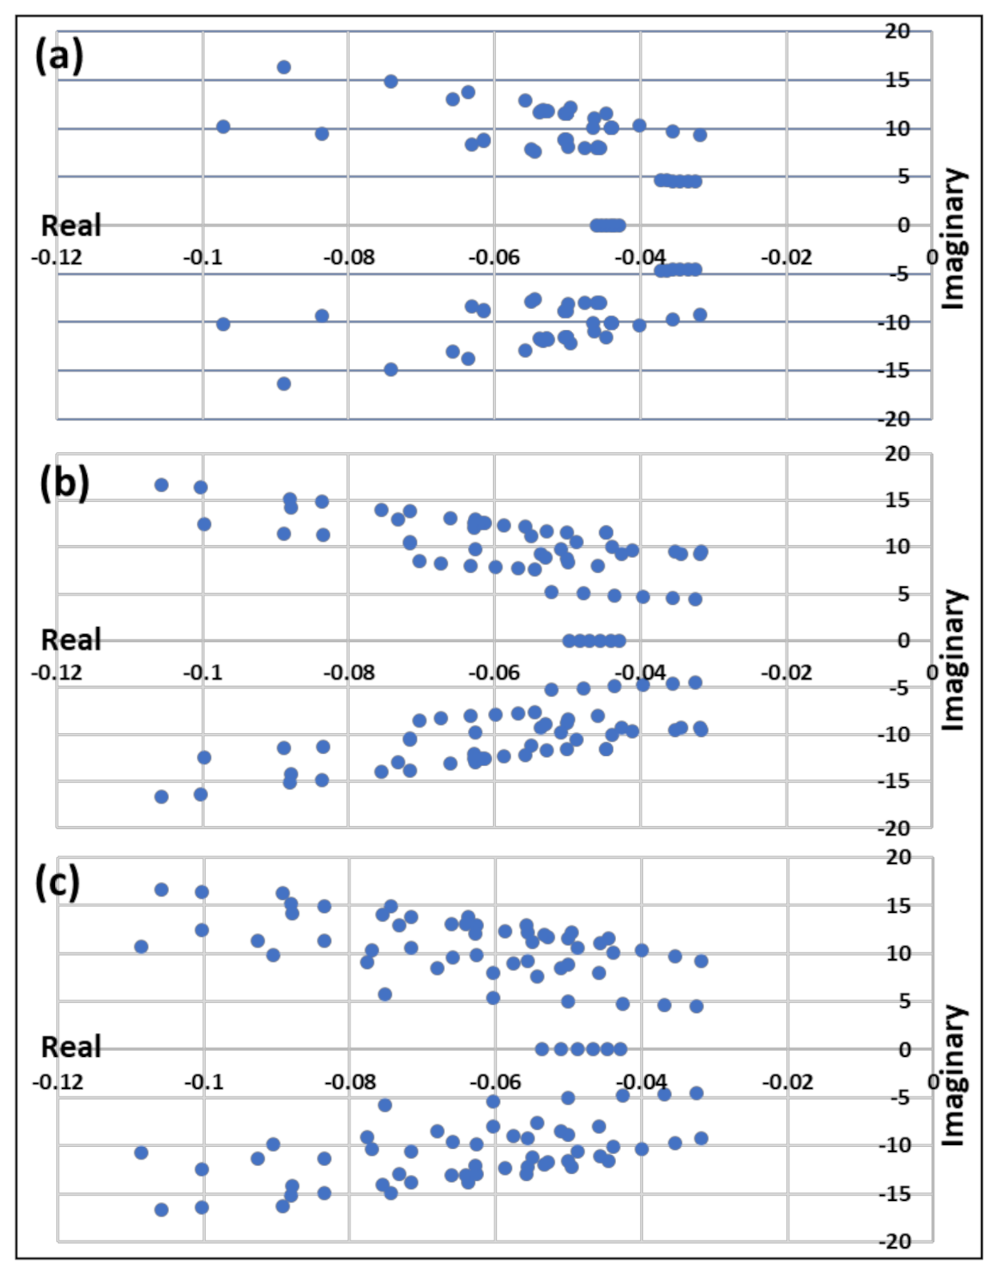
On the other side, the small-signal stability analysis is conducted to analyze the stability of the case study with the decreasing system inertia constants. The small-signal stability analysis is conducted through the eigenvalue analysis, and the results are shown in
Figure 7.
Figure 7a–c is the graphs that show the nature of real and imaginary values of eigenvalue points for the three scenarios. It is clearly shown that all of the eigenvalue points lie on negative real parts, which means the system is stable for all of the scenarios. However, the eigenvalue locus can be easily traced for scenario ‘a’, in comparison to the other two scenarios. From the figures, it is observed that the eigenvalue points scatter more with the decrease in inertia constant.
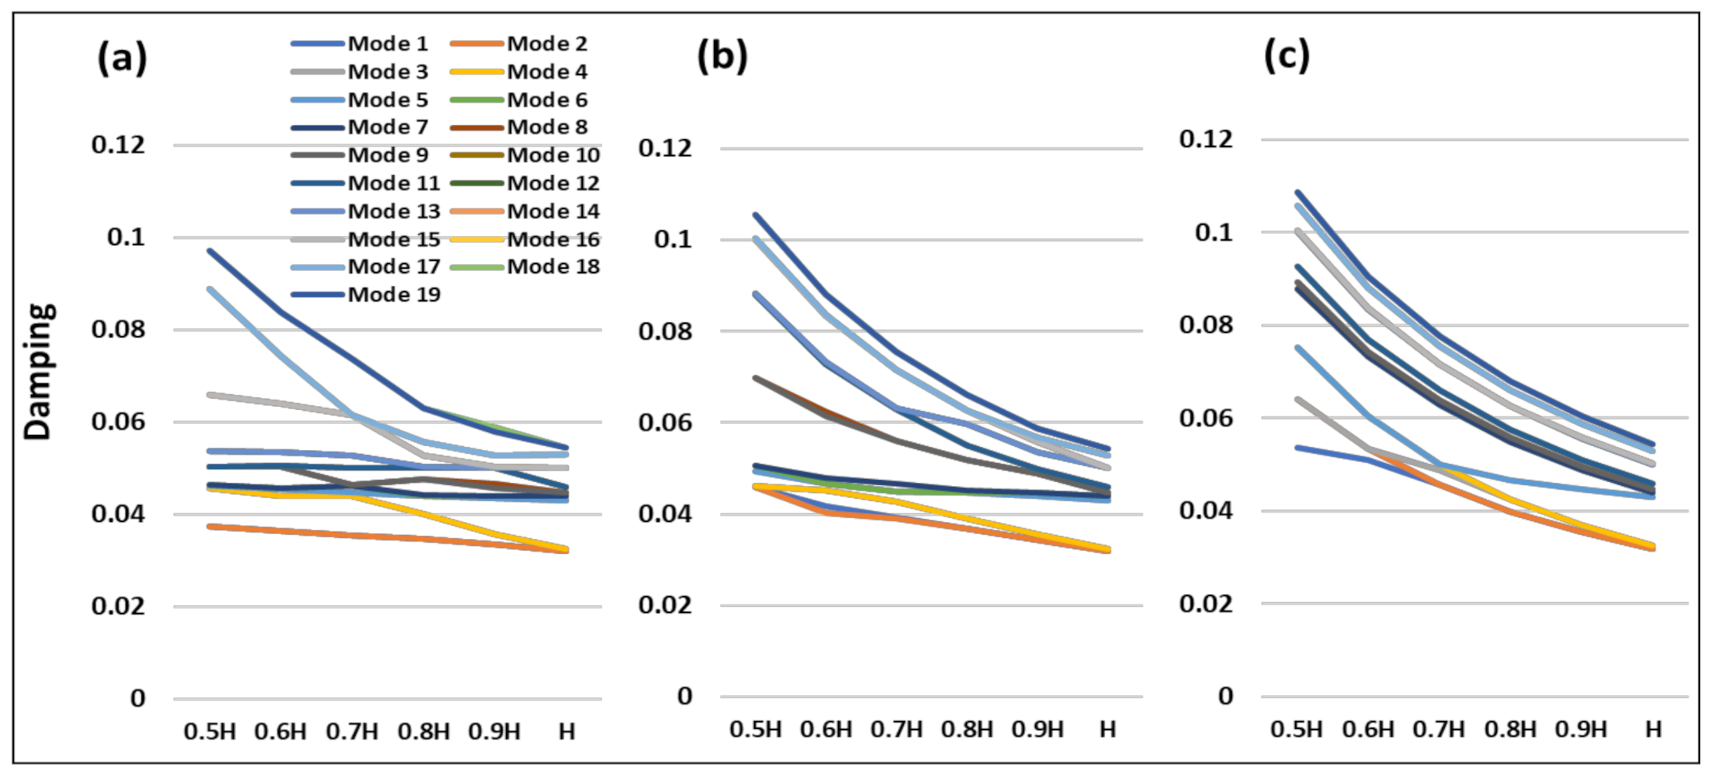
Similarly,
Figure 8 presents the sensitivity of the damping with the inertia constant for the assumed scenarios. The results show that the damping decreases with the increase in the inertia constant. Moreover, it is observed that the slope of the drop is higher in scenario ‘b’ than that in scenario ‘a’, and also scenario ‘c’ has a higher drop than the others. For the first scenario, the peak value of damping for Mode 19 is 0.097143 at 0.5H inertia constant and reached 0.05441 at the base case. In contrast, the peak values for Mode 19 in the second and third scenarios are 0.10565 and 0.108539. From these figures, it is clear that the damping is highly sensitive to the inertia constant.
4. Discussion and Conclusions
With the increasing concern on renewable energy generation and the rapid development in power electronic converter-based technologies, modern power systems are adopting a new form of architecture and operational strategies. The whole power system is getting into massive transformation including generation, transmission, and distribution as well as in utilization level. Most of the modern power generators are renewable types like solar PV, wind turbine, hydropower, bioenergy, and so on, among which the proportion of solar and wind energy generators are in increasing order. A similar transformation can be observed in the transmission line in the forms of HVDC, in distribution line in the forms of various controllers, and in utilization level in the forms of electronic devices. Overall, the proportion of synchronous generators is at decreasing rate in the modern power system, which is also considered as the source of inertia. Moreover, the PEC based technologies adopted all around the modern power system contain zero or less system inertia. These transformations introduce various issues as the result of distinct changes in the power system dynamics and their characteristics. The unpredictable RESs like solar and wind with low inertia and stochastic demand have a higher potentiality of vulnerability since unpredictable power unbalance can create frequent frequency deviation and lead to system instability. To address the problem, we must understand the dynamics of the system and their dependencies on various parameters.
A number of studies have been conducted to analyze the performance of the modern power system and evaluate the sensitivity under different operational statuses. However, the same factor was found to be sensitive for a case study and not sensitive for others, which creates confusion on the dependency of the system on the system’s parameters. Hence, parametric sensitivity analysis is very important to analyze the power system dynamics that can help to minimize the potential impacts.
This paper presents the parametric sensitivity analysis of the rotor angle stability indicators for the case study of the 39-bus New England power system. Two power system analysis studies are used in this assessment: transient and small-signal stability analysis. The studies have been used to identify and analyze the values of indicators (i.e., CCTs, eigenvalue points, damping ratio, frequency deviation, voltage deviation and generator’s speed deviation). The sensitivity analysis of the inertia constant with respect to the indicators has been performed by considering three scenarios and six sub-cases. Besides that, the nature of system frequency, speed of the generators, and the voltage profile of the buses are also analyzed as the performance matrixes.
From this study, it is shown that the CCT values are highly dependent on the inertia constant within the power system and decrease significantly with the decreases in the inertia constant. Furthermore, the CCTs of all components decrease with the decrease in inertia at any section of the multi-machine power system, although the effect is higher in the local area and less in the neighboring areas. Among the considered scenarios, the third scenario has significant performance deviations in comparison to the other two scenarios since the third scenario has a significant drop in system inertia. Although all of the scenarios and sub-cases are found to be stable, the decreasing inertia constant affects all of the rotor angle stability indicators significantly. With the decreasing inertia constant, the voltage, frequency, and generator speed are observed to highly deviate. Hence, this study concluded that the power system stability is highly sensitive to the system inertia.


