Concept Paper

Real Driving Emissions—Conception of a Data-Driven Calibration Methodology for Hybrid Powertrains Combining Statistical Analysis and Virtual Calibration Platforms

Institute for Combustion Engines, RWTH Aachen University, 52074 Aachen, Germany
*
Author to whom correspondence should be addressed.
Energies 2021, 14(16), 4747; https://doi.org/10.3390/en14164747
Submission received: 29 June 2021 / Revised: 23 July 2021 / Accepted: 30 July 2021 / Published: 4 August 2021
(This article belongs to the Special Issue Fuel Consumption of Hybrid Vehicles)

Abstract

:
The combination of different propulsion and energy storage systems for hybrid vehicles is changing the focus in the field of powertrain calibration. Shorter time-to-market as well as stricter legal requirements regarding the validation of Real Driving Emissions (RDE) require the adaptation of current procedures and the implementation of new technologies in the powertrain development process. In order to achieve highest efficiencies and lowest pollutant emissions at the same time, the layout and calibration of the control strategies for the powertrain and the exhaust gas aftertreatment system must be precisely matched. An optimal operating strategy must take into account possible trade-offs in fuel consumption and emission levels, both under highly dynamic engine operation and under extended environmental operating conditions. To achieve this with a high degree of statistical certainty, the combination of advanced methods and the use of virtual test benches offers significant potential. An approach for such a combination is presented in this paper. Together with a Hardware-in-the-Loop (HiL) test bench, the novel methodology enables a targeted calibration process, specifically designed to address calibration challenges of hybridized powertrains. Virtual tests executed on a HiL test bench are used to efficiently generate data characterizing the behavior of the system under various conditions with a statistically based evaluation identifying white spots in measurement data, used for calibration and emission validation. In addition, critical sequences are identified in terms of emission intensity, fuel consumption or component conditions. Dedicated test scenarios are generated and applied on the HiL test bench, which take into account the state of the system and are adjusted depending on it. The example of one emission calibration use case is used to illustrate the benefits of using a HiL platform, which achieves approximately 20% reduction in calibration time by only showing differences of less than 2% for fuel consumption and emission levels compared to real vehicle tests.

1. Introduction

The contribution of direct and indirect vehicle emissions to air pollution and increasing greenhouse gases (GHG) in the atmosphere has led to increasingly stringent emission standards being imposed by legislators worldwide. In addition, emission limits are being added for previously unlimited exhaust components [1,2,3].
In addition to the adjustment of the emission limits themselves, the procedures and methodologies for the conduction of the relevant emissions and fuel economy tests are being adapted. The introduction of the “Worldwide harmonized Light vehicles Test Procedure” (WLTP) including the “Worldwide harmonized Light vehicles Test Cycle” (WLTC) and the Real Driving Emissions (RDE) tests required for legislative vehicle testing under EU6d-TEMP [4] has led to a milestone in vehicle and exhaust gas aftertreatment development [5]. Following the RDE introduction for European legislation, RDE also becomes a new challenge for the Chinese market, allowing the transfer of lessons learned from the previously developed approaches for EU6d [6].
Regarding CO2 emissions emitted by road vehicles (accounting for 25% of total GHG emissions in the European Union in 2018 [7]), a 37.5% reduction in CO2 fleet levels is required by 2030, compared to the previously set limit of 95 g/km for 2021 [8].
With the potential of increasing the system efficiency and reducing the fuel consumption [9], one of the most common approaches for GHG reduction of passenger vehicles is the hybridization of the powertrains. For the operating strategy of hybrid vehicles, a good compromise between optimum fuel consumption, system efficiency, emission behavior and drivability is required [10]. Repeated engine starts and low engine operating times can lead to an increased emission intensity caused by higher start emissions especially in cold conditions [11] and thus to a low conversion efficiency of the exhaust aftertreatment system (EATS) [12]. Current approaches for the definition of vehicle-specific test scenarios for the calibration and validation process are mainly focusing on the characteristics of conventional internal combustion engines.
This paper presents the conception for a novel methodology that aims to provide a calibration procedure for robust system layout of conventional and hybrid powertrains with focus on GHG and pollutant emission reduction. After pointing out explicit challenges and backgrounds of the emission calibration process with focus on RDE specifications, current methodologies for RDE validation and virtual calibration are presented.
Then, the general framework, data analysis, statistical security and the implementation and generation of relevant test scenarios for the new concept are presented. An example of a campaign for the reduction of gaseous emissions during catalyst purging on a Hardware-in-the-Loop (HiL) test bench is presented as well. Demonstrating the accuracy of the results against real-world measurements and showing the effects of changes to the engine control unit (ECU) calibration in the virtual environment show the suitability of this type of test benches.
Finally, an outlook towards the use of virtual test benches using the presented concept for optimization and validation of emissions and operating strategies of hybrid powertrains is given.

2. Challenges and Approaches for RDE Specific Calibration

2.1. Challenges Posed by RDE

Compared to the formerly applied “New European Driving Cycle” (NEDC), the currently used test cycles reflect a more real-world operating behavior. Instead of static accelerations and speed levels, the WLTC describes a more dynamic test profile used for standard tests on the chassis dynamometer [13,14]. RDE tests per definition must be conducted on public roads under real world conditions. Although providing a high degree of freedom, some limitations regarding operating behavior and boundary conditions are defined to keep the single tests on a comparable level.
These limitations restrict the cycle dynamics by means of a minimum limit for the relative positive acceleration (RPA) and a maximum limit for the 95th percentile of all products of speed and positive acceleration (v∙apos95) for each phase of the test (urban, rural, motorway) as well as the total test duration [4,15].
Requirements for the distance shares for urban, rural, motorway as well as the geodetic profile of the traveled road with respect to the positive cumulated elevation gain as well as the absolute difference between the start and end of the trip define the general conditions of the route [4]. Looking forward to planned adjustments by the EU7 standard, potential restrictions and ranges for these limitations can be omitted or extended [16,17,18,19].
For tests on public roads, portable emission measurement systems (PEMS) are required. A sufficient accuracy of these systems requires a detailed logging and capturing of the emissions to gain legally required information about the absolute level during on-road tests. However, with accuracy levels below that of the measurement equipment in a laboratory environment, PEMS measurements do not provide the best conditions for calibration tasks [20,21,22,23,24]. Tolerances might falsify the time continuous results to a level that causes insurmountable challenges for the calibration engineer when it comes to root cause analyses and validation of optimization success.
Currently, not all relevant pollutants can be measured with a PEMS device. For RDE tests, only NOX and PN need to be measured on-road, CO needs to be monitored. Other exhaust components are to be validated in WLTC tests on the chassis dynamometer only.
For the expected future EU7 legislation, an extension of the relevant components to be measured with PEMS is discussed. This possibly concerns HC, NH3, N2O and PN10 (particles larger than 10 nm). Although the current measurement systems are being optimized with regard to accuracy [25], the use of further optimized measuring instruments will be necessary to measure also these components in an adequate way with high accuracy.
Besides requirements with regard to measurement equipment, the RDE legislation has put major challenges onto the calibration and validation process itself [26]. With a highly dynamic range of operating points, the potential area in the engine map experienced in a legislative RDE test is practically unlimited [27,28]. As demonstrated in Figure 1 (left), the range of operating points applied during the WLTC test is slightly higher with regard to engine speed and engine load compared to the NEDC test. A representative RDE cycle driven with the same vehicle as for the shown NEDC and WLTC extends the used range even further, in theory only restricted by the engine limits itself.
The trace of potential RDE operating points is unlimited. In addition, the environmental influences in on-road tests can vary greatly between individual tests [29]. With not only temperature and humidity but also traffic and driver behavior [30] being uncontrollable, a reproduction of one test to another is nearly impossible [31,32]. However, an unquestionable test reproducibility is one of the main prerequisites for successful powertrain calibration.
In addition, increasing vehicle variants with different powertrain modifications lead to an exponential growth of test cases to be considered [33]. As demonstrated on the right chart in Figure 1, this puts challenges onto the available test resources [16]. The introduction of new test facilities is required to keep up with the exponential growth in tests to be carried out. The introduction of RDE has not only motivated the extensive use of virtual test capacities—such as Engine-in-the-Loop (EiL) testing on highly dynamic engine test benches—but also to the development of new validation processes [34,35,36]. Limiting the required number of tests to a reasonable number with sufficient resources, data-driven approaches are required to identify the status quo of a certain system and to make as much use as possible of the information contained in the data collected during the development process.

2.2. Existing Approaches for RDE Validation

To meet the challenges posed by the introduction of RDE in the EU6d legislation, different approaches are being pursued. In addition to the mandatory road tests, these include the intensive use of chassis dynamometers and the virtualization of testing activities. However, individual methods focus primarily on one test environment. The idea of the currently used approaches can be divided into the categories of
  • Fleet-generic test cycles [15,37];
  • Worst-case cycles obtained by simulation and Design of Experiments (DoE)—in combination with engine dynamometer testing [28,38,39,40,41];
  • Representation of statistical driving styles [42,43,44];
  • Retracing of real-world driving routes considered as relevant [45,46,47,48].
Fleet-generic test cycles are frequently used by the Original Equipment Manufacturers (OEM) to validate many different vehicles with the same test profile. The profiles are usually based on speed sequences that are supposed to be highly critical for the OEM’s vehicles and especially to the performance of the EATS. These are either defined by investigations of several emission tests carried out with different vehicles, by theoretical technical analyses of critical maneuvers (such as full load acceleration with cold engine and EATS) or based on characteristic values such as maximization of v∙apos95 or RPA. These cycles are often considered as worst-case for validation purposes [15].
Worst-case cycles can be created for specific vehicles as well. The generation of such test scenarios is often associated with either simulation or engine test bench measurements. When using a modeled environment such as described in [39,49,50], many different scenarios can be evaluated in an efficient way. A DoE approach is subsequently used to evaluate the simulated emission intensity. Based on control parameters (e.g., cycle dynamics), the profile is then adjusted to define the worst-case scenario for the vehicle. Alternatively, DoE approaches for different operating points and traces on an engine test bench can be used once the real system is available [38]. Based on the results, cycles can be created for use on either dynamic engine test benches or chassis dynamometers.
In contrast to system-specific approaches, there are those that focus on real-world routes or realistic driving styles that are intended to represent real driving behavior with as little synthetic influences as possible [42,43,44,51,52,53,54,55,56]. Testing of real driving routes is often transferred to a test bench environment to increase reproducibility and to use highly accurate measurement systems. Here, the driving profiles are transferred to the chassis dynamometer or engine test bench. This requires prior recording of the driving profile or load points via the engine control unit and needs re-recording or computational adjustment of the load points if significant calibration changes occur or another vehicle is to be tested. To increase the reproduction quality, MASON et al. describe a methodology for the specific adjustment of the load points performed on the chassis dynamometer [45]. These may deviate from the theoretically resulting resistances due to numerous influences from the speed and geodetic road profiles, but are decisive for the validation of replay measurements. Especially the reproduction of altitude and road gradient influences can have a major effect on the reproduction of engine operating points and must be reproduced with a high level of accuracy, as described in [57]. In addition to real routes, recordings are made of real trips in daily operation, which are transferred to a database. As for example described in [43,56], based on Markov chains, new driving profiles are then synthetically created to represent the most probable speed and acceleration sequences. Such approaches represent typical regional driving behavior very well, but are less suitable for representing vehicle-specific weak points which are relevant for calibration.
The RDE cycle generator presented in [58] serves to combine the advantages of these individual approaches. First, it automatically detects emission-critical sequences from existing measurement data, which are then prioritized according to intensity and statistical relevance. Particularly critical and at the same time statistically representative measurement sections for real drivers are combined in a new cycle and linked by synthetic phases by means of a driver model. On the one hand, this ensures a reference to real driving behavior, and, on the other hand, it enables critical driving situations to be reproduced with the help of a targeted operating point reproduction. The calibration and validation process can thus be efficiently supported with the available amount of data. The methodology presented in the following builds on the fundamentals of this approach and extends it with an advanced reproduction of the system states as well as a targeted analysis of the data for the identification of weak points and further necessary measurement data.
While existing approaches focus on different ways to define a relevant test scenario, the use of potential information within the collected and analyzed data is limited. The described approach of the RDE cycle generator already combines the statistical analysis with focus on emission critical data. The comparison of events to other events and to real-driving data based on the calculation of a universal distance measure of a pre-defined set of signals although only allows to identify similar sequences, not to carry out an automatic root cause analysis. The prioritization of the signals to be included is left to the experience of the engineer. Furthermore, the generated cycle mainly relies on sufficient variance of the input data and is—similarly as for all the current existing approaches—fixed before the test starts. This is especially for hybrid vehicles afflicted with uncertainty concerning the reproduction of operating point traces.
The concept of the methodology described below aims at covering these weak spots. In contrast to pre-defined signal sets for comparison, a clustering approach is used to identify relevant signals, critical and uncritical traces of these and thus can highly support the engineer on a root cause analysis. Focusing on the thereby detected relevant signals, a novel approach is implemented to invert the comparison of events to real-driving data, allowing to pre-estimate the criticality with regards to emission intensity of driving routes and to identify white-spots in the variance of existing emission measurement data. Finally, a methodology is described that allows to generate a driving profile while a test or simulation is running, instead of generating a fixed profile before the test starts.

3. Methodology for Robust Calibration on Virtual Test Benches

For an efficient development and calibration process, a high level of confidence into the suitability of the system to be designed is required. Starting with the concept and design phase, future requirements onto the complete system need to be known and the technology needs to be selected accordingly. Keeping this in mind, a key criterion for vehicle development is the ability of validating single components and parts of the complete system already during early program stages. Furthermore, the consideration of gained information in early steps can bring advantages with regard to efficiency and robustness in later stages of the powertrain development.
The aimed novel methodology therefore targets on being useable already in early stages of the development process and using data of those in later stages. Figure 2 shows the criteria for the conception of the novel methodology.
The first criterion defines the testing platforms to be considered for the development process. Starting with first virtual tests in a Model-in-the-Loop (MiL) environment, the application of the procedures remains consistent for HiL and EiL or Powertrain-in-the-Loop (PiL) testing. Slight modifications to the base concept of the generation of test scenarios are required for vehicle testing on a chassis dynamometer and on-road PEMS validation.
The use of all available test data and as well as an automatic analysis and processing of these provides a major contribution for efficient and statistically safe calibration. Therefore, the second package of the methodology (“Identification of calibration optimization potentials” Figure 2) focuses on the identification of optimization potentials for the calibration of the respective control unit, for example an ECU or a hybrid control unit (HCU). The comparison of emission data with on-road fleet data supports the definition of actually relevant test cases and the quantification of the statistical certainty of the validation matrix (“Quantification of statistical certainty”, Figure 2). Finally, the test scenarios are generated by means of a “Dynamic and model predictive cycle generation” (Figure 2).

3.1. Virtual Test Benches

Vehicle development is already supported by virtual test environments in many different phases and tasks. Especially in conceptual design and technology selection as well as for On-Board Diagnostics (OBD) verifications, simulation-based test scenarios are used [59,60]. Increasing virtualization is also taking place in the area of drivability [10,61,62] and emissions calibration [63,64,65] to increase the efficiency of the development processes.
Figure 3 shows an overview of the different virtualization depths and test benches that are used within this concept to support the calibration process focusing on emissions, fuel consumption and operation strategy optimization. The white area on the right side, getting wider towards the bottom, indicates the aspects and components that are existing in real-world for the specific test facility, the gray background indicates virtual components.
While on-road testing requires a complete vehicle with all components, the first level of virtualization is already performed on the chassis dyno. Here, the driver follows a target speed trace in the real vehicle. All ambient influences and the vehicle resistances are simulated or controlled by the test bed. This allows for testing a certain vehicle with specifications of any other vehicle by adjusting the resistance coefficients that control the load that the chassis dynamometer applies to the wheels. In earlier development phases with a complete system not yet ready for deployment or to support overall vehicle testing, individual components can be operated on dedicated test benches as if they were in the complete vehicle [66,67]. For this purpose, the periphery of the component to be tested is simulated by a model environment. The scope of the real components can be varied as desired. Typical setups for example are PiL, EiL and HiL (Figure 3). In the PiL setup, electric motors are used as load machines for the drive wheels, simulating the real-world resistances
The model environment there comprises only the driving environment and the vehicle, while the engine, clutch, transmission and differentials are present as real components. In the EiL setup, the modeling is supplemented by differentials, transmission and clutches; only the engine is operated as a real component on the test bench with a load machine [68]. For the HiL setup, the entire vehicle is typically simulated, including all drive components and, if required, also the emissions. The ECU or HCU are coupled with the simulation as real components [69,70]. The highest virtualization level is used in the MiL or Software-in-the-Loop (SiL) setup. There, all components including the control units are simulated.
The early performance of dynamic tests in virtual test environments enable the pre-validation of components and functions with regard to the subsequent real operating conditions [63]. Targeted modeling of engine and system behavior on MiL and HiL setups allows conclusions to be drawn about emissions, drivability and fuel and energy consumption behavior [71]. This offers frontloading of the emissions calibration and adjusting the operating strategy for hybrid propulsion systems. The associated requirements and the suitability of virtual environments to adequately represent the real influences of calibration changes will be described. When using EiL or PiL test benches, resulting emissions and fuel or energy consumptions can be measured directly. In addition to single test bench setups, virtual shaft setups as described in [72] provide the ability of not only simulating the real hardware on a HiL with ECU and HCU but also to actually couple test benches for internal combustion engines (ICE), electric machines and batteries.
All these systems can be used to support the calibration process by being operated based on a data-driven methodology to validate and optimize existing datasets as well as to extend the database with sequences of yet unknown emission behavior to increase the statistical robustness.

3.2. Identification of Calibration Optimization Potentials

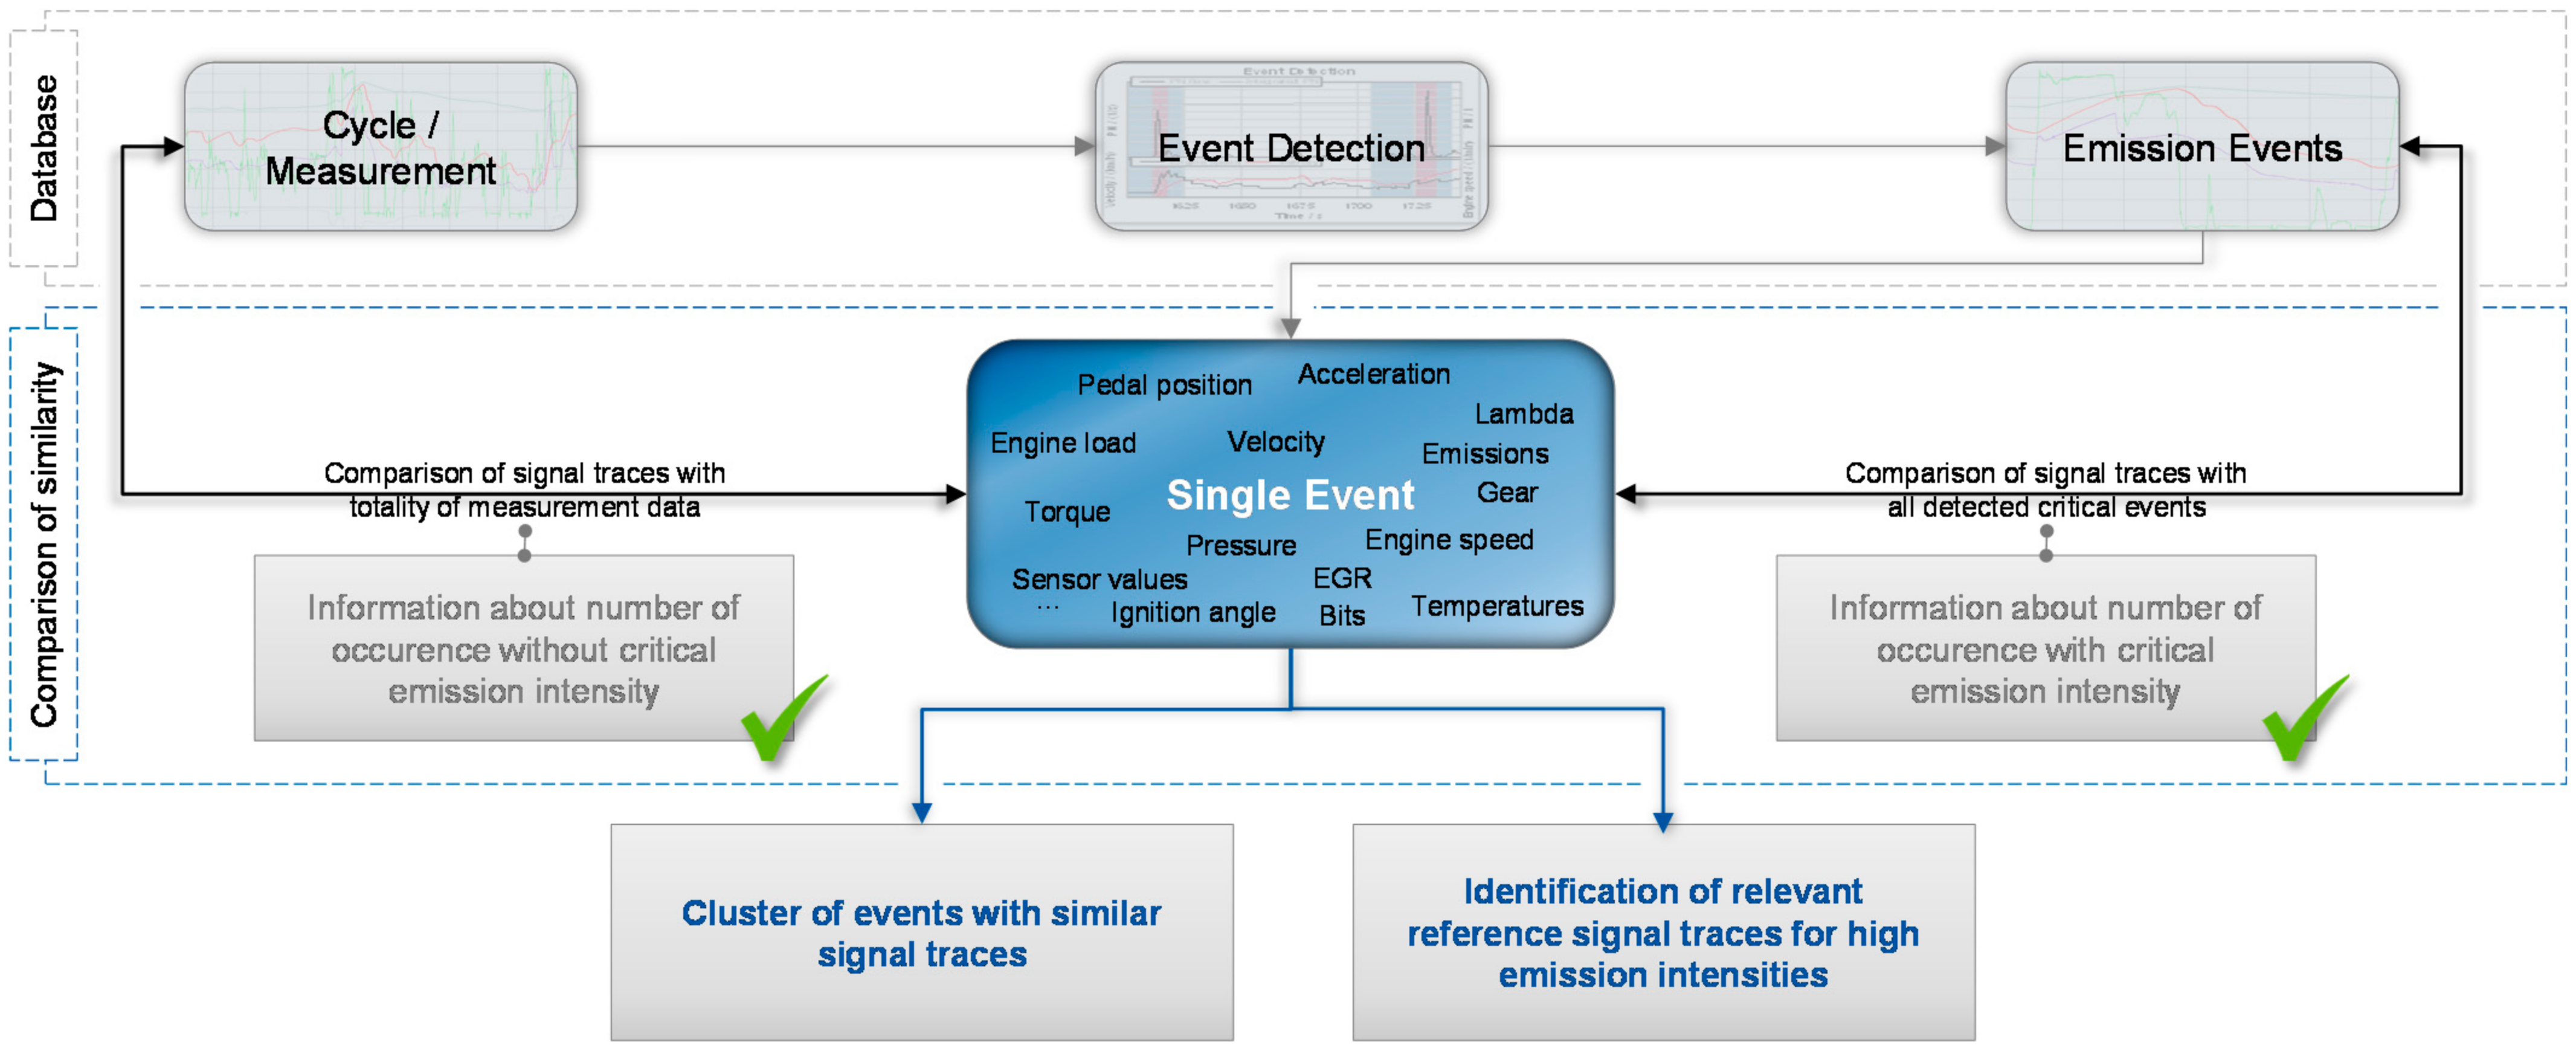
The identification of calibration optimization potentials is based on a combination of different procedures. First, critical and uncritical data need to be identified. Then, they need to be compared for the identification of similarities. Similarities in signals must be clustered to get an idea of patterns that typically represent critical sequences.
The primary data processing is described by CLAßEN et al. in [58]. An automatic event detection is used to identify critical sequences. The decision whether a sequence is considered critical or uncritical is based on the distance specific emission intensity. By means of moving average windows of different durations, the short- and long-term distance specific emission intensity is validated for each point of time of all available measurement data. The distance specific intensity per window is then compared to a threshold level, which is based on the average speed within the window.
Each window that exceeds the relevant threshold value is marked with a flag indicating the critical sequences. Thus, all critical data (“events”) per definition of the threshold value are identified automatically and marked as such. Remaining data are considered as uncritical (“non-events”). Storing the detected sequences in a common database allows their later analysis and statistical evaluation. As all signals measured by the ECU and the emission measurement equipment are stored, the focus of the analysis can be adjusted easily and different signals can be included.
A first investigation on reproducibility and statistical relevance regarding real world driving behavior is performed by means of a signal trace comparison. A set of signals or respective modifications (e.g., first or second derivations) is selected on which the comparison is based. These signals are compared for each event to each other event using a dynamic time warping approach [73] to compensate different durations, slight differences and biases in the measurements. The process is presented in Figure 4 where the vehicle speed v and the derivation of it (acceleration), the relative air charge rl and its derivation, the engine speed n and change of engine speed as well as the change of selected gear are compared.
The scalar distance measure is calculated by weighted averaging signals’ differences between the two events being compared. For this, the 2-norm is calculated for each point of time t over the difference of all features s of the reference event u and the event v compared to it, weighted by the weighting factor for each signal ws. The resulting universal distance vector dt (1) is then averaged based on its length T to receive the scalar measure D (2).
The resulting measure indicates how similar two events are considering all defined features. The lower the measure gets, the higher the similarity and vice versa.
d t = s a b s u t , s v t , s · w s 2
D = t d t 2 T
The same procedure is also performed for the comparison of each event to each non-event. By comparing the distance measures for each comparison of event to event and event to non-event to a set threshold [58], an information about the number of similar events and similar non-events can be obtained for rating of reproduction quality and relevance based on the occurrence within the conducted emission tests. The higher the ratio of similar events to similar non-events for an event is, the higher the reproduction quality, as re-driving such an event will quite likely lead to a critical event again (considering the reproduction of the signals that were defined as features for the comparison).
If an event has a high number of similar non-events compared to the number of similar events, the critical emission intensity either results from a random occurrence or the relevant signal causing the critical intensity was not considered within the selected features.
For the identification of significant patterns within the critical data, the previously developed approach is extended by a novel component, performing a cluster analysis per signal. The procedure is schematically shown in Figure 5 and is applied to detected critical events as well as to non-events.
Within this comparison, each trace of a specific signal is compared to the traces of the matching signal of all other events. The calculation of the similarity of the single signals of all events towards each other is carried out as in (1) and (2), with the adjustment that only one signal is considered and thus no averaging over multiple signals is performed. Signal-wise clusters are built in a way to identify typical patterns and comparisons. In contrast to the comparison methodology for complete event similarity with the scalar distance measure, this leads to a categorization of the event in a multitude of clusters. Here, the association of the events towards each other with regard to the single signal comparison is not focused, but remains possible as each event is clearly identified by means of an ID that is linked to the clusters of each signal. In addition, multi-signal correlations can be carried out to identify typical profile combinations of certain signals.
In contrast to the comparison of the events based on a set of features for similarity analysis, the approach of single signals has the advantage of providing an information about the statistical appearance of patterns and potential root causes for the critical behavior itself. Resulting clusters offer the opportunity to quantify the importance of specific appearances. The engineer can evaluate a huge amount of data by first judging reference profiles of signals of interest.
With the knowledge of the quantity, a prioritization of required calibration measures can be performed. As schematically indicated in Figure 6, the automated analysis based on the database of all emission measurements during a project can be used for guidance of the engineer on the identification of calibration optimization. Not only the information about how many events belong into a certain pattern of signal traces, but also automatically calculating the weight of the complete cluster with regard to its share of critical emission intensities compared to the other clusters supports focusing on relevant weak spots.
Applying the same cluster approach to the signal traces of non-events allows for a statistical evaluation of how relevant a certain group of profiles might be with regard to their root cause of critical emission intensity. After clustering, the results for non-events and events are compared. The number of identified significant groups gives a first indication whether signals might be relevant or not. Signals that cannot be clustered into a representative number of groups neither for events nor for non-events do not suggest for a clearly problematic category profile (Figure 6B). This assumes that a sufficient number of emission measurements is included in the database. Such traces can still reproducibly lead to high emission intensities, but they are rather singular appearances or are only critical in combination with characteristic behaviors of other signals.
For signals that can be divided into a reasonable number of clusters for either critical or non-critical data, an evaluation about the differences of cluster numbers and cluster sizes can be carried out. If the clustering produces significant results within only one of the two groups critical (Figure 6A) or non-critical (Figure 6B), this indicates a clear trend and a potential cause for increasing or decreasing emissions. Insofar as clustering of a signal for events and non-events is possible, a comparison of these clusters is performed. A distinction is made as to whether there is a clear difference in the number of detected clusters or whether the clusters differ significantly in their type and size.
Smaller numbers of different clusters with significant size in the critical data in contrast to many clusters with small size within the non-critical data clearly indicate relevant signals and trajectories (Figure 6A). These can be evaluated by the engineer in a targeted manner prioritized by the calculated impact of the cluster on the overall emissions. In contrast to a potential clear separation of the number and size of clusters between critical and non-critical data, the result of similar numbers of clusters requires a specific comparison between the distribution of critical and non-critical clusters. For this purpose, a reference trajectory is first calculated for each cluster, which reflects the representative behavior of the signals in the cluster.
The reference trajectories of all event clusters are first compared with the reference trajectories of the non-event clusters. In this way, identical or similar clusters are identified within the two signal groups. Based on this, the relative sizes of clusters belonging to each other are then compared to identify a shift between critical and non-critical peculiarities.
Clusters that have only a small number of associated non-events, but describe a high proportion of events, indicate relevant signal characteristics for a critical emission behavior. In contrast, proportionally small clusters of critical data compared to associated large clusters of non-critical data describe trajectories that are potentially to be associated with non-critical emission behavior.
In case the comparison of the reference trajectories indicates a similar relative size of linked clusters for critical and non-critical data, this suggests for signal traces that are not causing critical intensities or only in combination with other values.
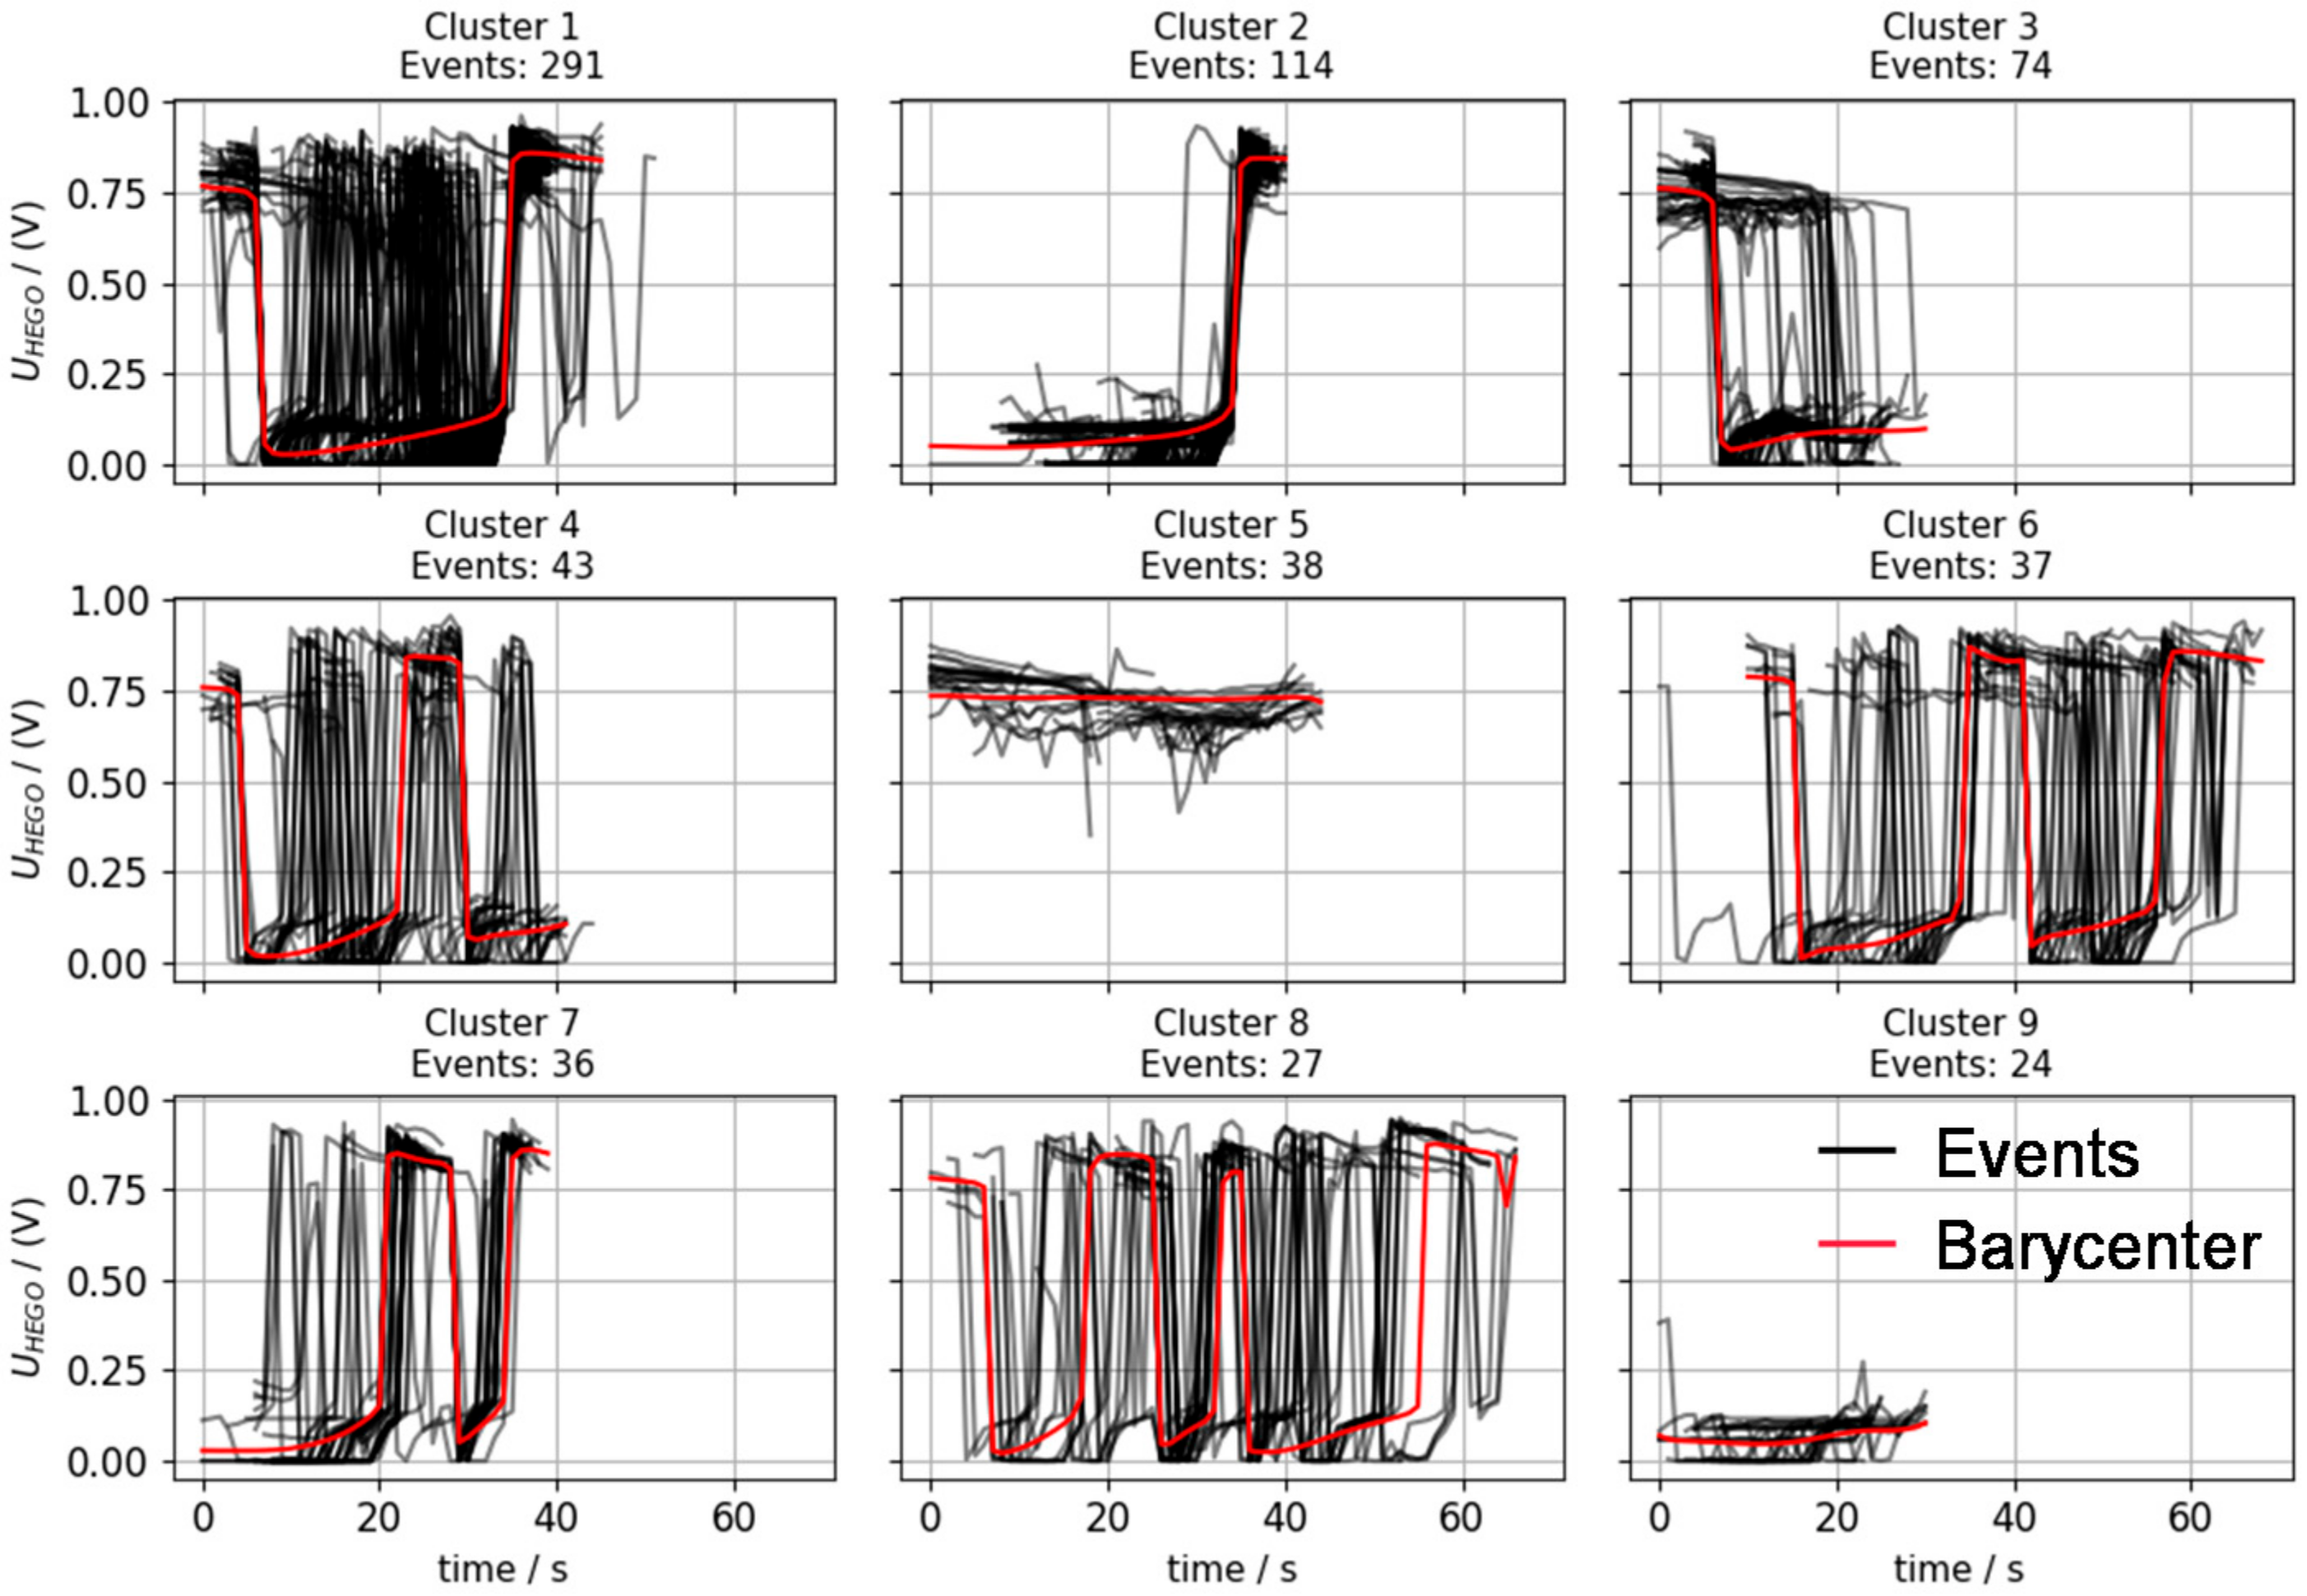
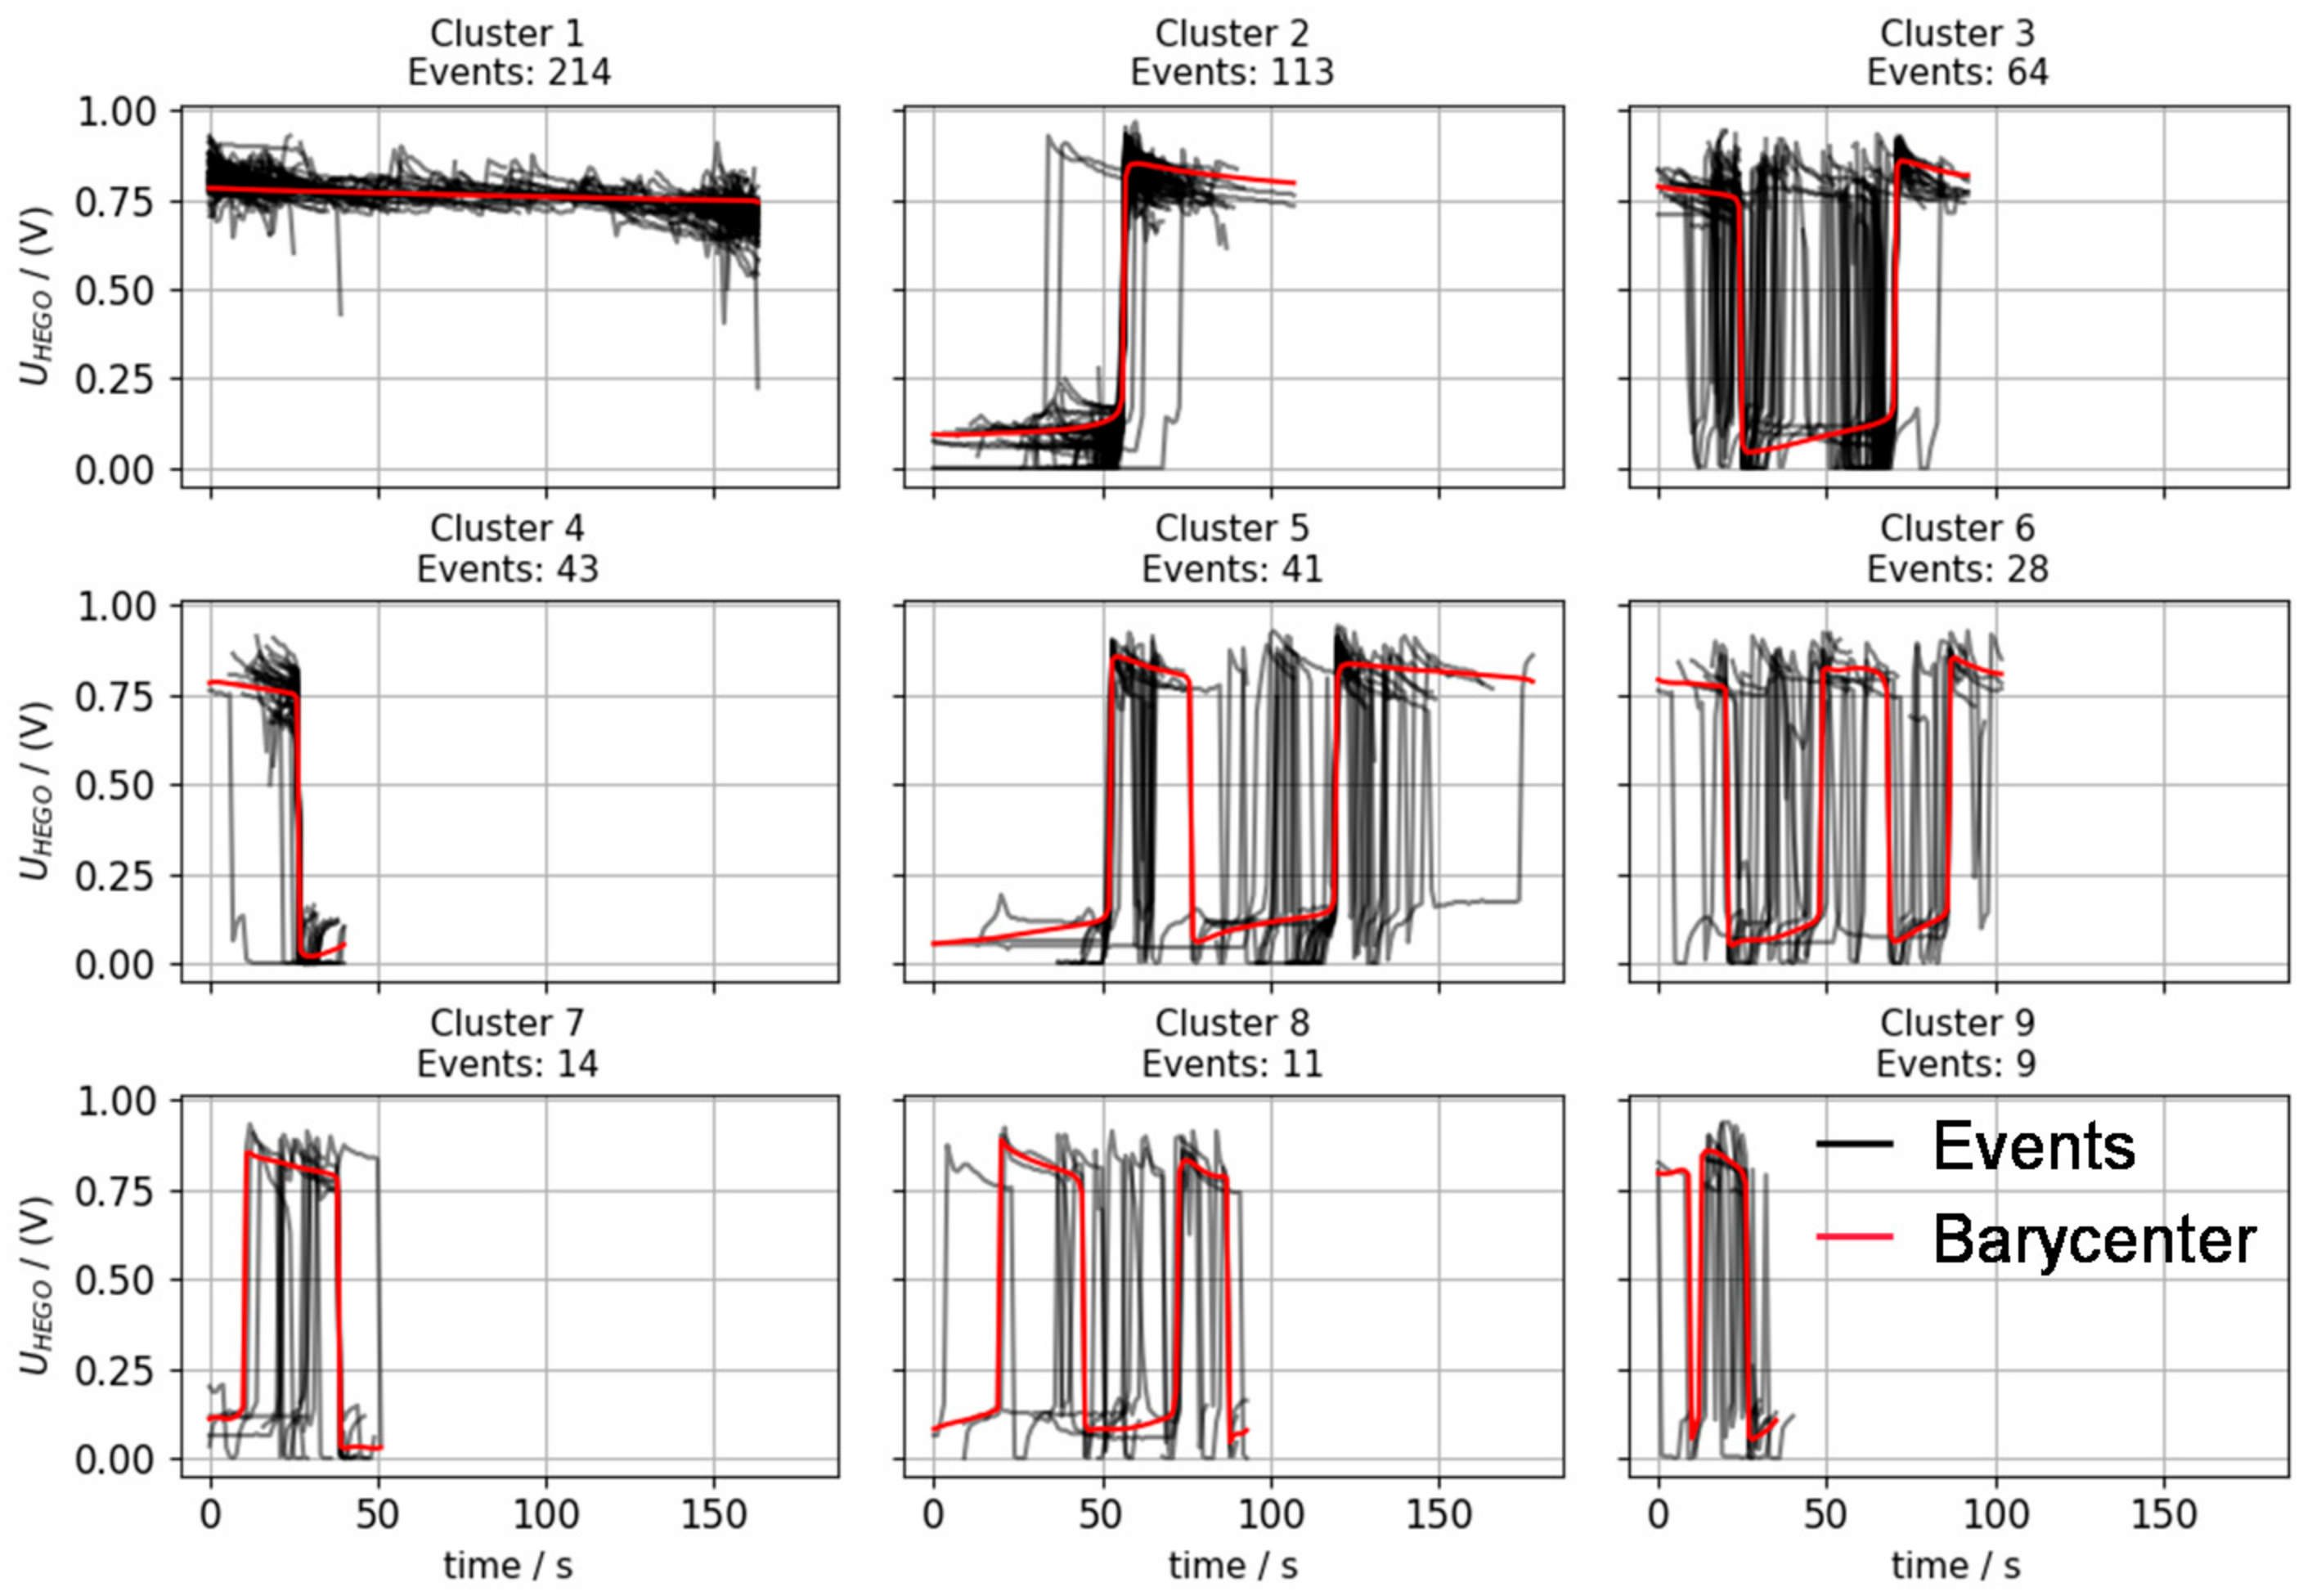
Figure 7 and Figure 8 show an extract of examples for clusters for the voltage signal of the downstream lambda sensor (UHEGO) that have been identified for 842 events (Figure 7) and 842 non-events (Figure 8) with regard to NOX emissions. Different clustering approaches are still being evaluated; the shown results are based on the HDBSCAN methodology described e.g., in [74]. This methodology so far shows the best behavior when being applied on many different types of signals without supervision of the automatic definition of relevant parameters for clustering.
While the black profiles show all single traces of the clustered events and non-events, the red profiles indicate the reference profile identified by the Barycenter approach [75]. The downstream lambda voltage is selected, as it provides a direct indication of the catalyst state and thus the sufficiency of converting NOX emissions. Here, the comparison of the number of sequences in a cluster (indicated as “Events: #” above each plot) allows the suggestion of typical critical and uncritical profiles. Being the biggest clusters, cluster 1 represents the most typical traces for events (drop of voltage for more than 20 seconds, which corresponds in fact to a lean mixture) and non-events (constantly high voltage, rich mixture). Furthermore, sequences with a higher share of the low voltage compared to high voltage shares (e.g., events cluster 2 and non-events cluster 2 with similar sizes or events cluster 3 and non-events cluster 4 with twice as many critical as uncritical sequences) promote a higher risk of increased emission intensity in terms of NOX emissions.
At the same time, a drop in the downstream lambda voltage does not necessarily lead to a critical situation with regard to the NOX emissions, as indicated by the clusters 3 and 5 to 9 for non-events. Although corresponding clusters for critical data (e.g., 6 critical to 6 uncritical) are slightly bigger. Even though increased NOX concentrations result at this state of the catalyst, the overall distance-based emission intensity (being used for the definition of events) is in addition depending on the exhaust gas mass flow and the driven speed. Still, a higher frequency of break through into the low voltage area and thus oxygen saturated state of catalyst (e.g., event cluster 8) promotes the appearance of critical sequences.
While indicating typically critical or uncritical data, the chosen example also indicates that the use of one label for an exact knowledge about relevant signals and profiles is not completely sufficient. For example, cluster 3 and 5 of the uncritical data contain events in which the engine went into stop-start mode during the event, leading to a situation in which no exhaust gasses are flowing through the catalyst while being in a bad state for conversion efficiency. Thus, a further improvement of the approach is being developed to put more focus of cross-signal correlations when identifying matching clusters of critical and uncritical data.
By linking similar clusters of critical and non-critical signal sequences, the ability to point to desired signal trajectories for the optimization process is provided. The typical profiles of non-critical events can be used as a reference that the engineer can target in the calibration optimization.
It is also possible to compare different vehicle datasets by comparing different clusters. Here, different calibration datasets of a vehicle can be compared with each other throughout the development process in order to quantify the success achieved in terms of system efficiency enhancement due to the hybrid operating strategy or the reduction of emissions.
Similarly, different vehicles can be compared in terms of the nature of their weak points and the quantitative magnitude of these. A benchmarking process based purely on comparing achieved emission or fuel consumption results can thus be extended to include a statement on the location of potential improvement areas.

3.3. Quantification of Statistical Certainty

A key challenge for RDE validation and calibration is the knowledge about the statistical certainty that can be achieved with a certain process. The potential combination of driving scenarios with operating point traces and possible ambient condition influences, the engine operation conditions during RDE testing are basically unlimited. Expected additional degrees of freedom for compliance with future emission standards, such as EU7, as described in [16], mean further challenges regarding this topic.
The approach for test scenario creation suggested in this paper refers to preliminary work describing the procedure of the RDE cycle generator developed by CLAßEN et al. [58]. Based on a recombination of actual measurement data, the cycles provide a foundation of taking the real vehicle, exhaust gas aftertreatment system and calibration influences into account. ECU recordings of robustness and fleet data are compared with emission events to identify the statistical relevance towards in-use driving behavior. With this approach, each event is compared with the available ECU data to identify sequences with matching signal traces of a pre-defined feature set. This allows to identify how often a single event occurs during real-world operation, but it is not possible to judge about the variance of available emission data. For a sufficient robustness for actual RDE validation, the knowledge about the variety and amount of available raw data is crucial.
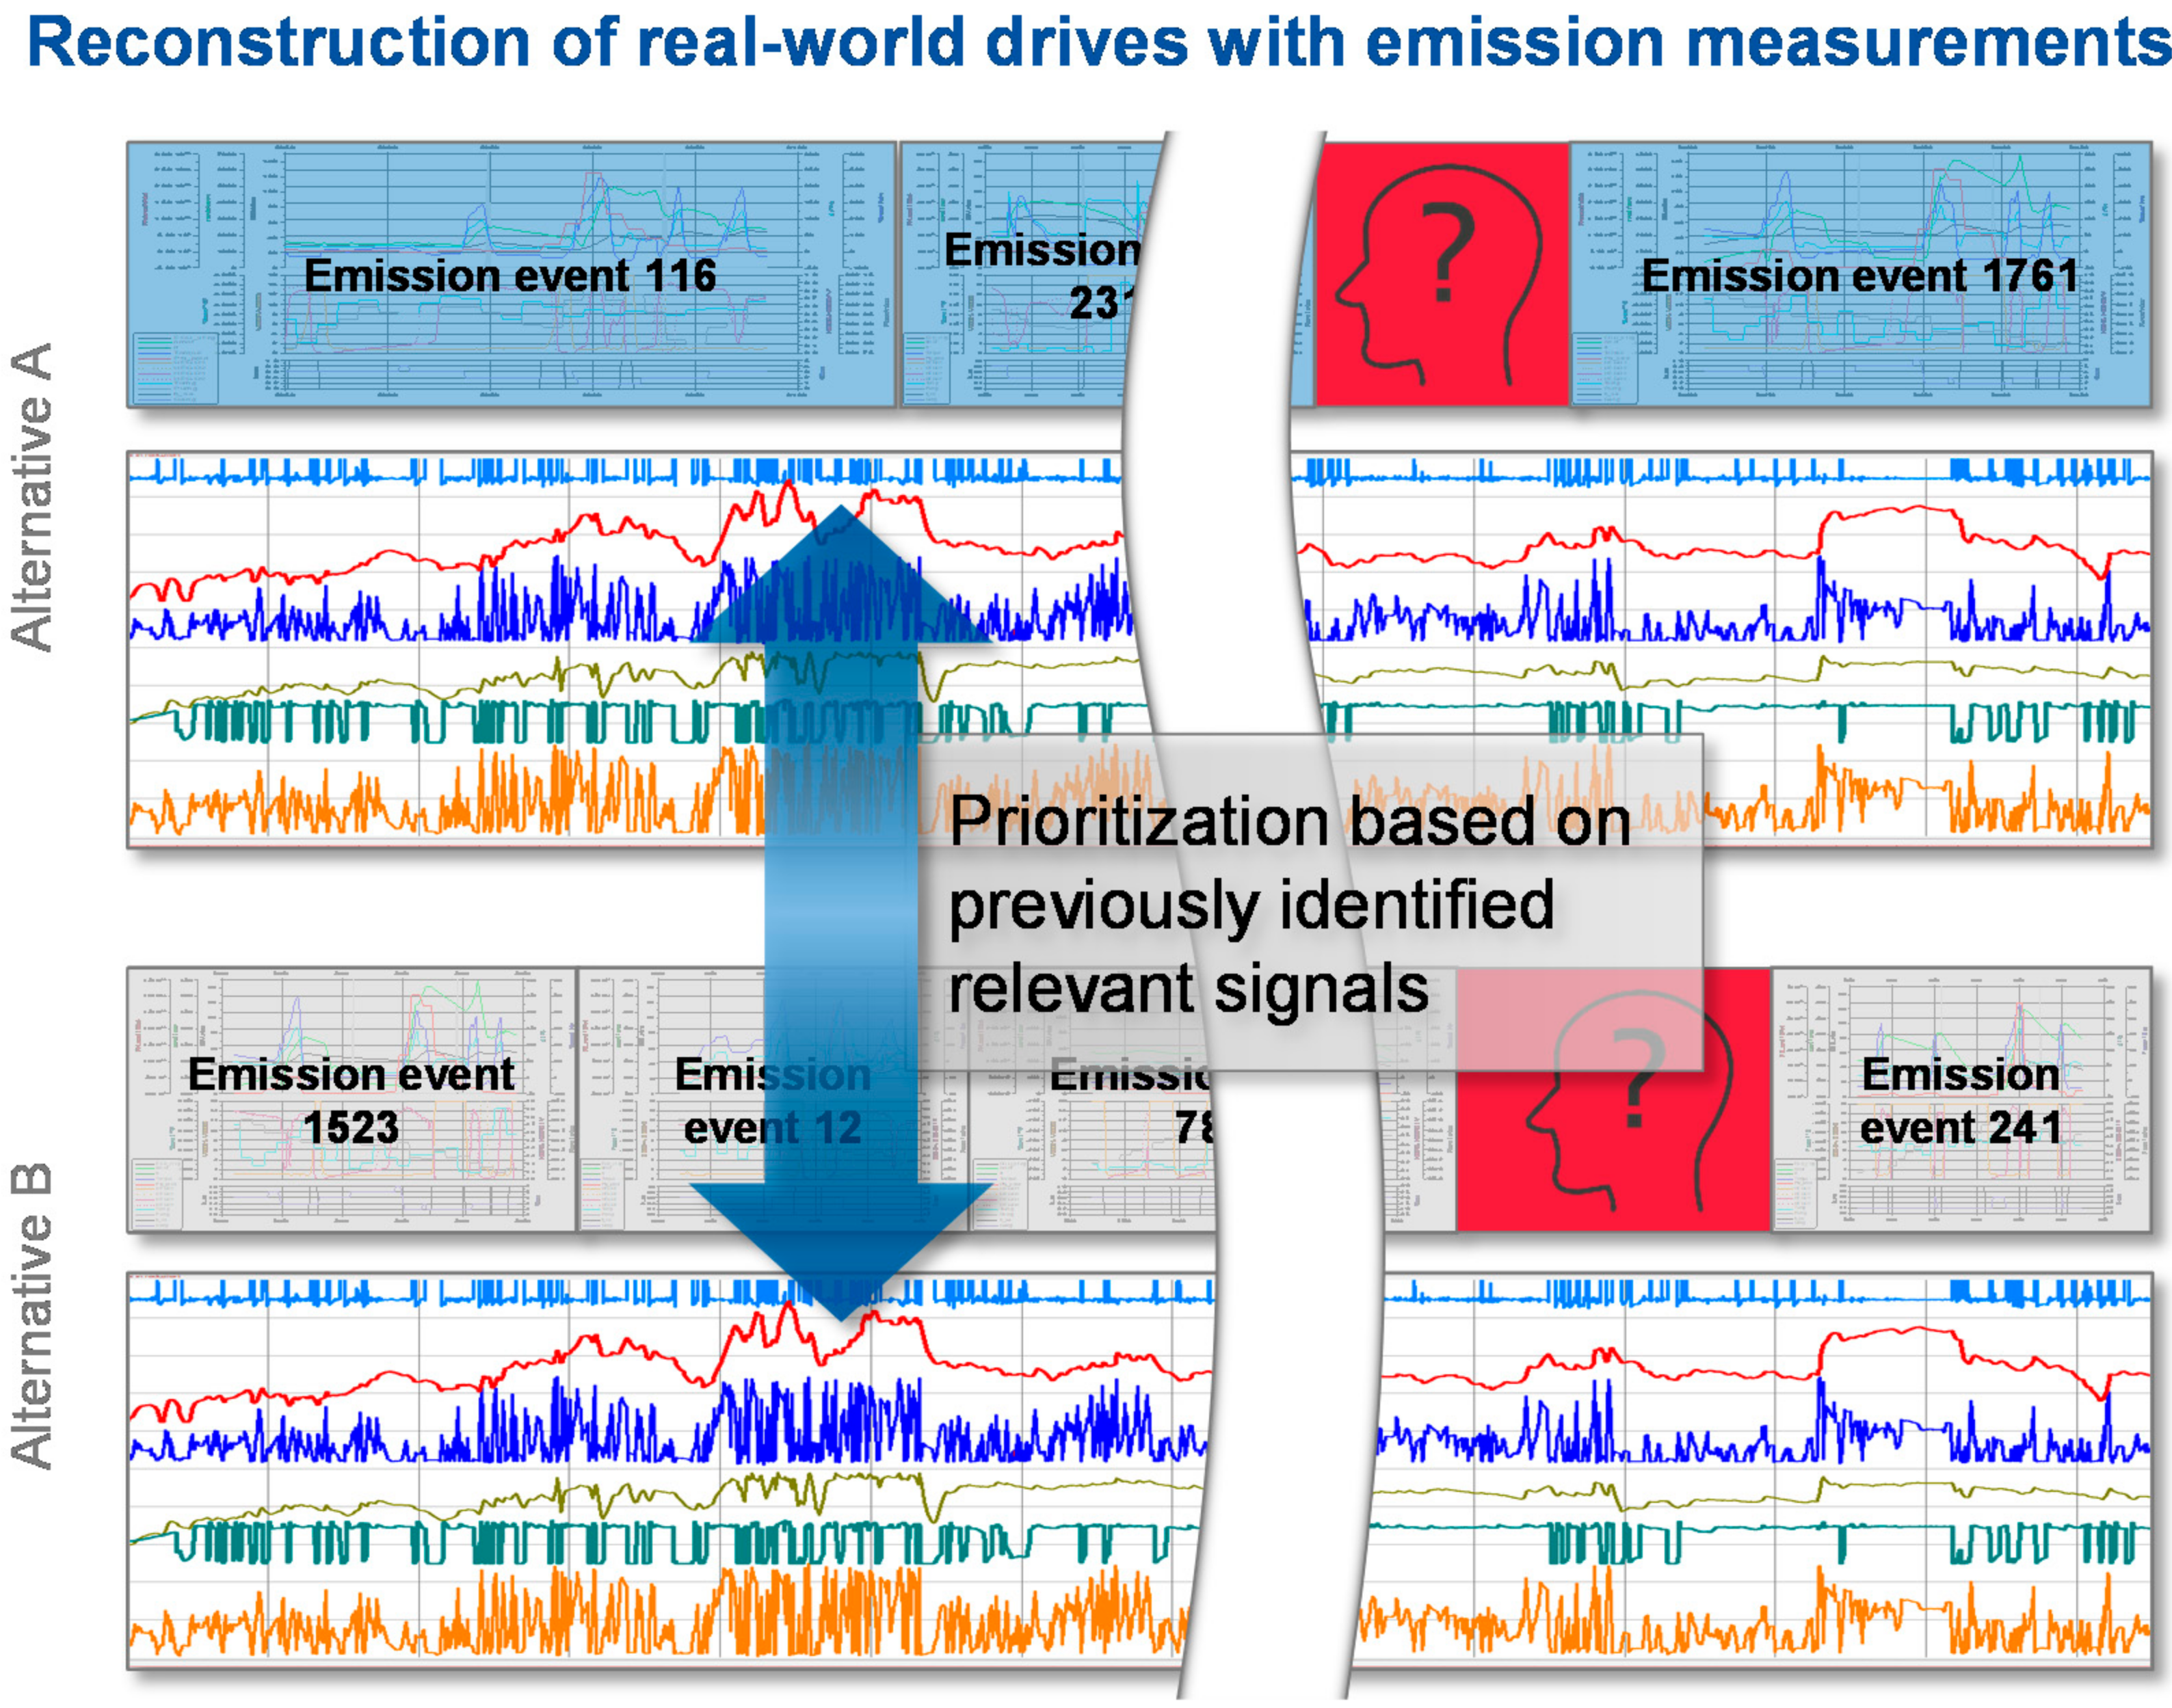
This knowledge is supplemented with a novel approach that uses a signal trace comparison for the reconstruction of actual on-road drives to not only rate the events for relevance. For obtaining the knowledge about a wide driving behavior including different styles of drivers and ambient conditions, fleet data can be used. The data may be collected within a certain project but may also be extended by previous project data of predecessors.
Figure 9 schematically describes the procedure for the quantification of statistical safety based on the available measurement data and for identifying missing measurement data. Detected events and non-events of all available emission measurements with a certain vehicle are compared to on-road measurements. These measurements only need to contain ECU data. Equipment for emission measurement is not required. Available events and non-events are then analyzed for their ability of representing specific parts of the on-road measurement. Extracts, at which an event or non-event matches the traces of the on-road reference data, are stored. In this way, the complete measurement is being reconstructed with snippets of emission measurement data of different tests. For the comparison, the signals are prioritized that have been identified as most important based on the cluster analysis previously described.
As a result, the on-road measurement may be reconstructed by several different events or non-events for local sequences. Based on the priority and distance of the signals, different alternatives are created with regard to their likelihood of representing the sequences of the reference profile.
Reconstructing real driving profiles has multiple advantages. First, the existing emission measurement data can be estimated for a sufficient variance. Events and non-events should be equally spread throughout the on-road profiles when reconstructing. Sequences that are reconstructed with many alternatives of different events guide to the information of a low variance within the emission measurement data. Such sequences suggest that already a large number of emission measurement profiles exists, representing the same vehicle operation. Testing for example many cycles with similar characteristics as the WLTC might suggest for a high certainty in different scenarios and potential routes, but could just represent the same traces and combinations of operating points and conditions in varying orders.
Simultaneously, missing sequences within the reconstruction indicate situations for which no information about the emission behavior is existing. These snippets are of high relevance for the creation of test scenarios to increase the robustness of the calibration. The behavior of the interaction of engine and exhaust gas aftertreatment system is unknown and thus also the resulting emissions. In worst-case situations, a repetition of these sequences could lead to states in which the vehicle might not be compliant with legislative emission limits while, at the same time, the dynamics might allow the creation of a compliant test cycle.
An additional advantage is the potential of predicting intensities of RDE PEMS routes. When creating routes for on-road testing, the effect on the emissions remains unclear. For a validation of the route’s legislative compliance, a vehicle with ECU measurement only can be used. For cost reduction a PEMS system might not be equipped. The presented approach allows the evaluation of the ECU measurement based on the reconstruction with already collected emission measurement data. The intensity of the used events and non-events allows for a first estimation whether the route’s profile is expected to cause rather high or low emission intensities. This estimation provides only a trend and does not claim for an explicit result. Further, the impact of adjustments within the calibration is not considered within the reconstruction.
The judgement of how much emission data is available for the reconstruction of on-road measurements and the identification of missing sequences leads to the information about the statistical certainty and the clear identification of unknown scenarios. This approach still relies on a sufficient number of on-road measurements (without emission trace) to describe a comprehensive picture. Usage of previous project and fleet data helps to tackle this challenge. Estimating the emission intensity of on-road routes provides a high benefit in cost reduction. Especially when being combined with an automatic way of route generation, the compliance of potential routes can be pre-investigated and routes with the highest likelihood of compliance can be driven without further measurement equipment. The presented reconstruction approach then helps to select the most promising routes according to the project’s demands.

3.4. Dynamic and Model Predictive Cycle Generation

RDE tests on public roads are affected by a high number of ambient influences that cannot be controlled during a test and might have an impact on the resulting operating points and system behavior. For calibration and validation purposes, the laboratory environment of test benches is beneficial as it provides controlled environmental conditions and highly accurate measurement systems. To make best use of the identification of critical sequences and weak spots as well as to this point missing knowledge about certain operation profiles, a high level of reproducibility is required when designing scenarios for test bench operation.
The approach of the current RDE cycle generator described in [58] is extended by a model predictive approach to increase the maturity of reproducing events, especially when working with hybrid propulsion systems. Here, due to the advantage of not requiring explicit vehicle models, the current approach is not capable of explicitly reproducing the operation of the ICE as e.g., influences of the state of charge (SOC) deviations of a traction battery cannot be considered.
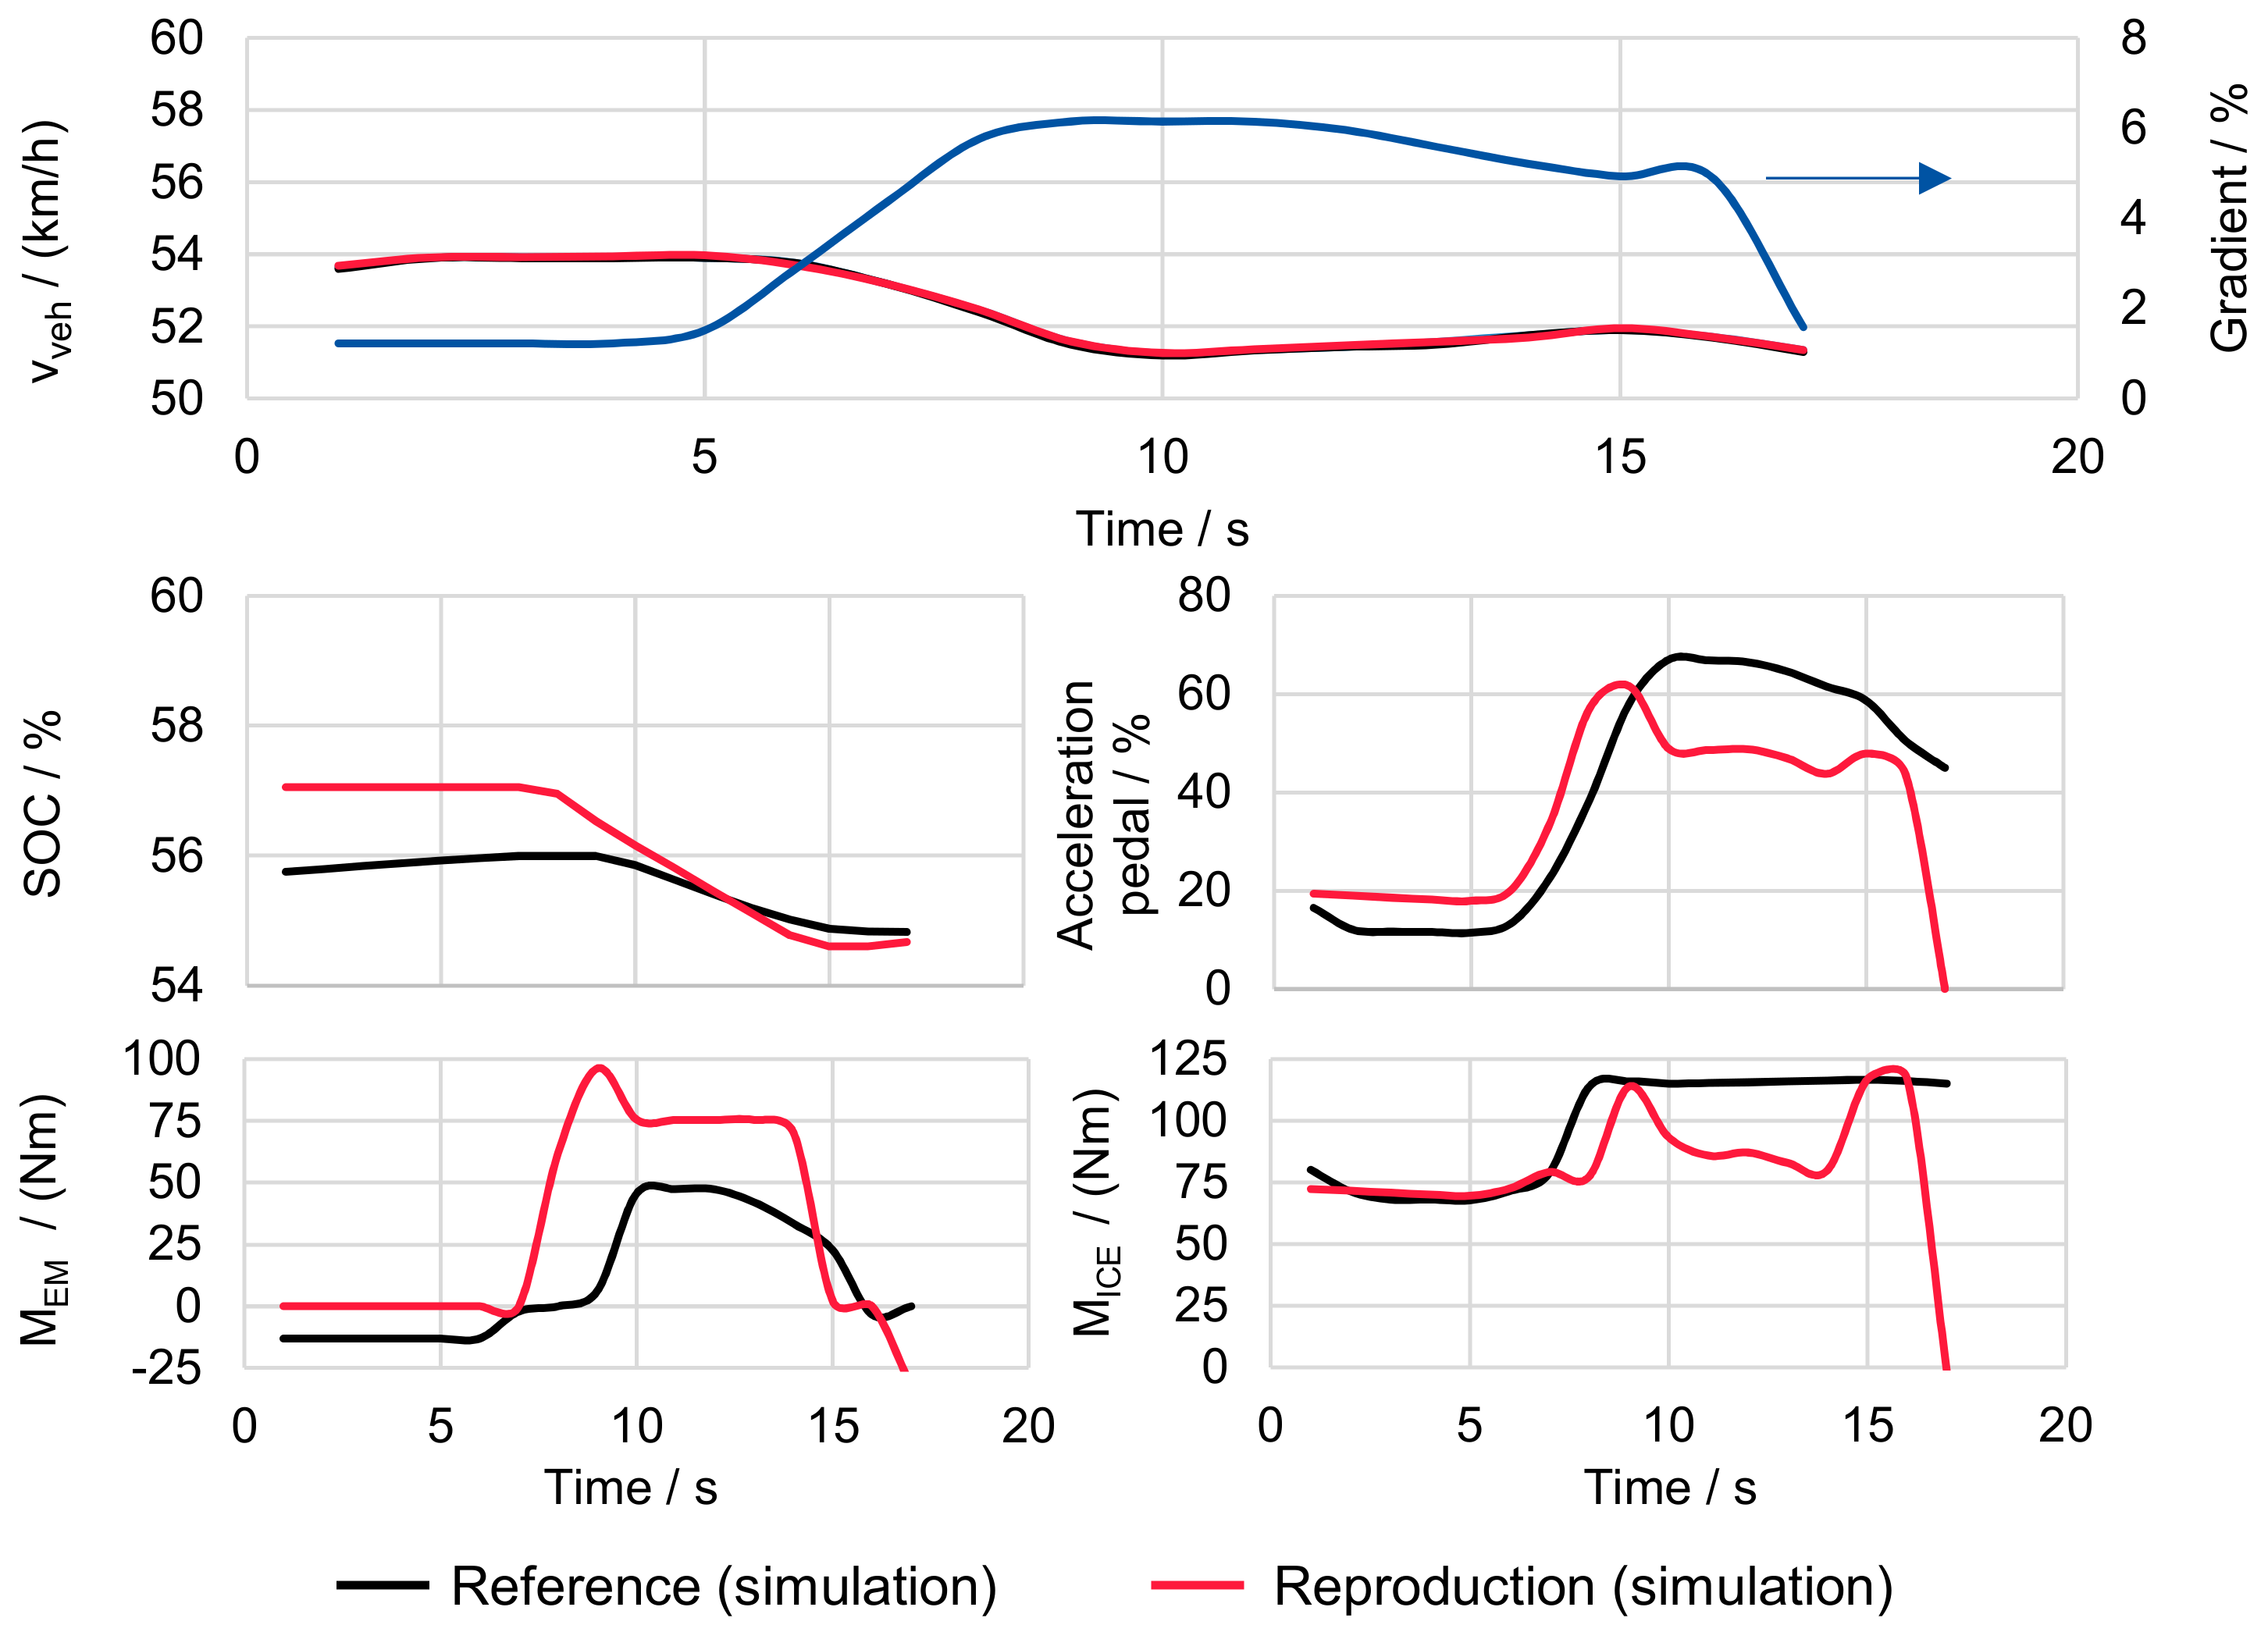
Figure 10 highlights the challenges of hybrid powertrains in the context of event reproduction. The simulation of a cycle is performed multiple times with a virtual vehicle (Table 1) in a MiL environment using the Matlab Simulink toolbox Powertrain Blockset.
The simulation and vehicle settings are kept constant, only the initial SOCs are modified slightly to investigate the system’s sensitivity towards SOC deviations. Comparing the initially driven profile (black) to the simulation for reproduction investigations (red) with a higher initial SOC of 2%, differences can be observed. While the vehicle speed is matched with a high precision, differences in the load requirements for the internal combustion engine (MICE, bottom right) and the electric machine (MEM, bottom left) result from the changes in initial SOC conditions. The increase of only 2% in combination with a slightly different acceleration pedal actuation of the simulative driver leads to deviations of up to 100 Nm for the electric machine and up to 35 Nm for the ICE.
The observed differences of the driver behavior are resulting from varying vehicle model reactions due to the state of the propulsion units. In real operation, a variance of the pedal position movement to this extend would be considered as normal and insignificant. When applied to a complete test cycle, meeting the initial states at the beginning of the test would result in high SOC deviations and system behavior at the end of the cycle. Trying to reproduce driving sequences without the estimation of these deviations over the entire cycle will therefore not lead to robust testing procedures for hybrid vehicles.
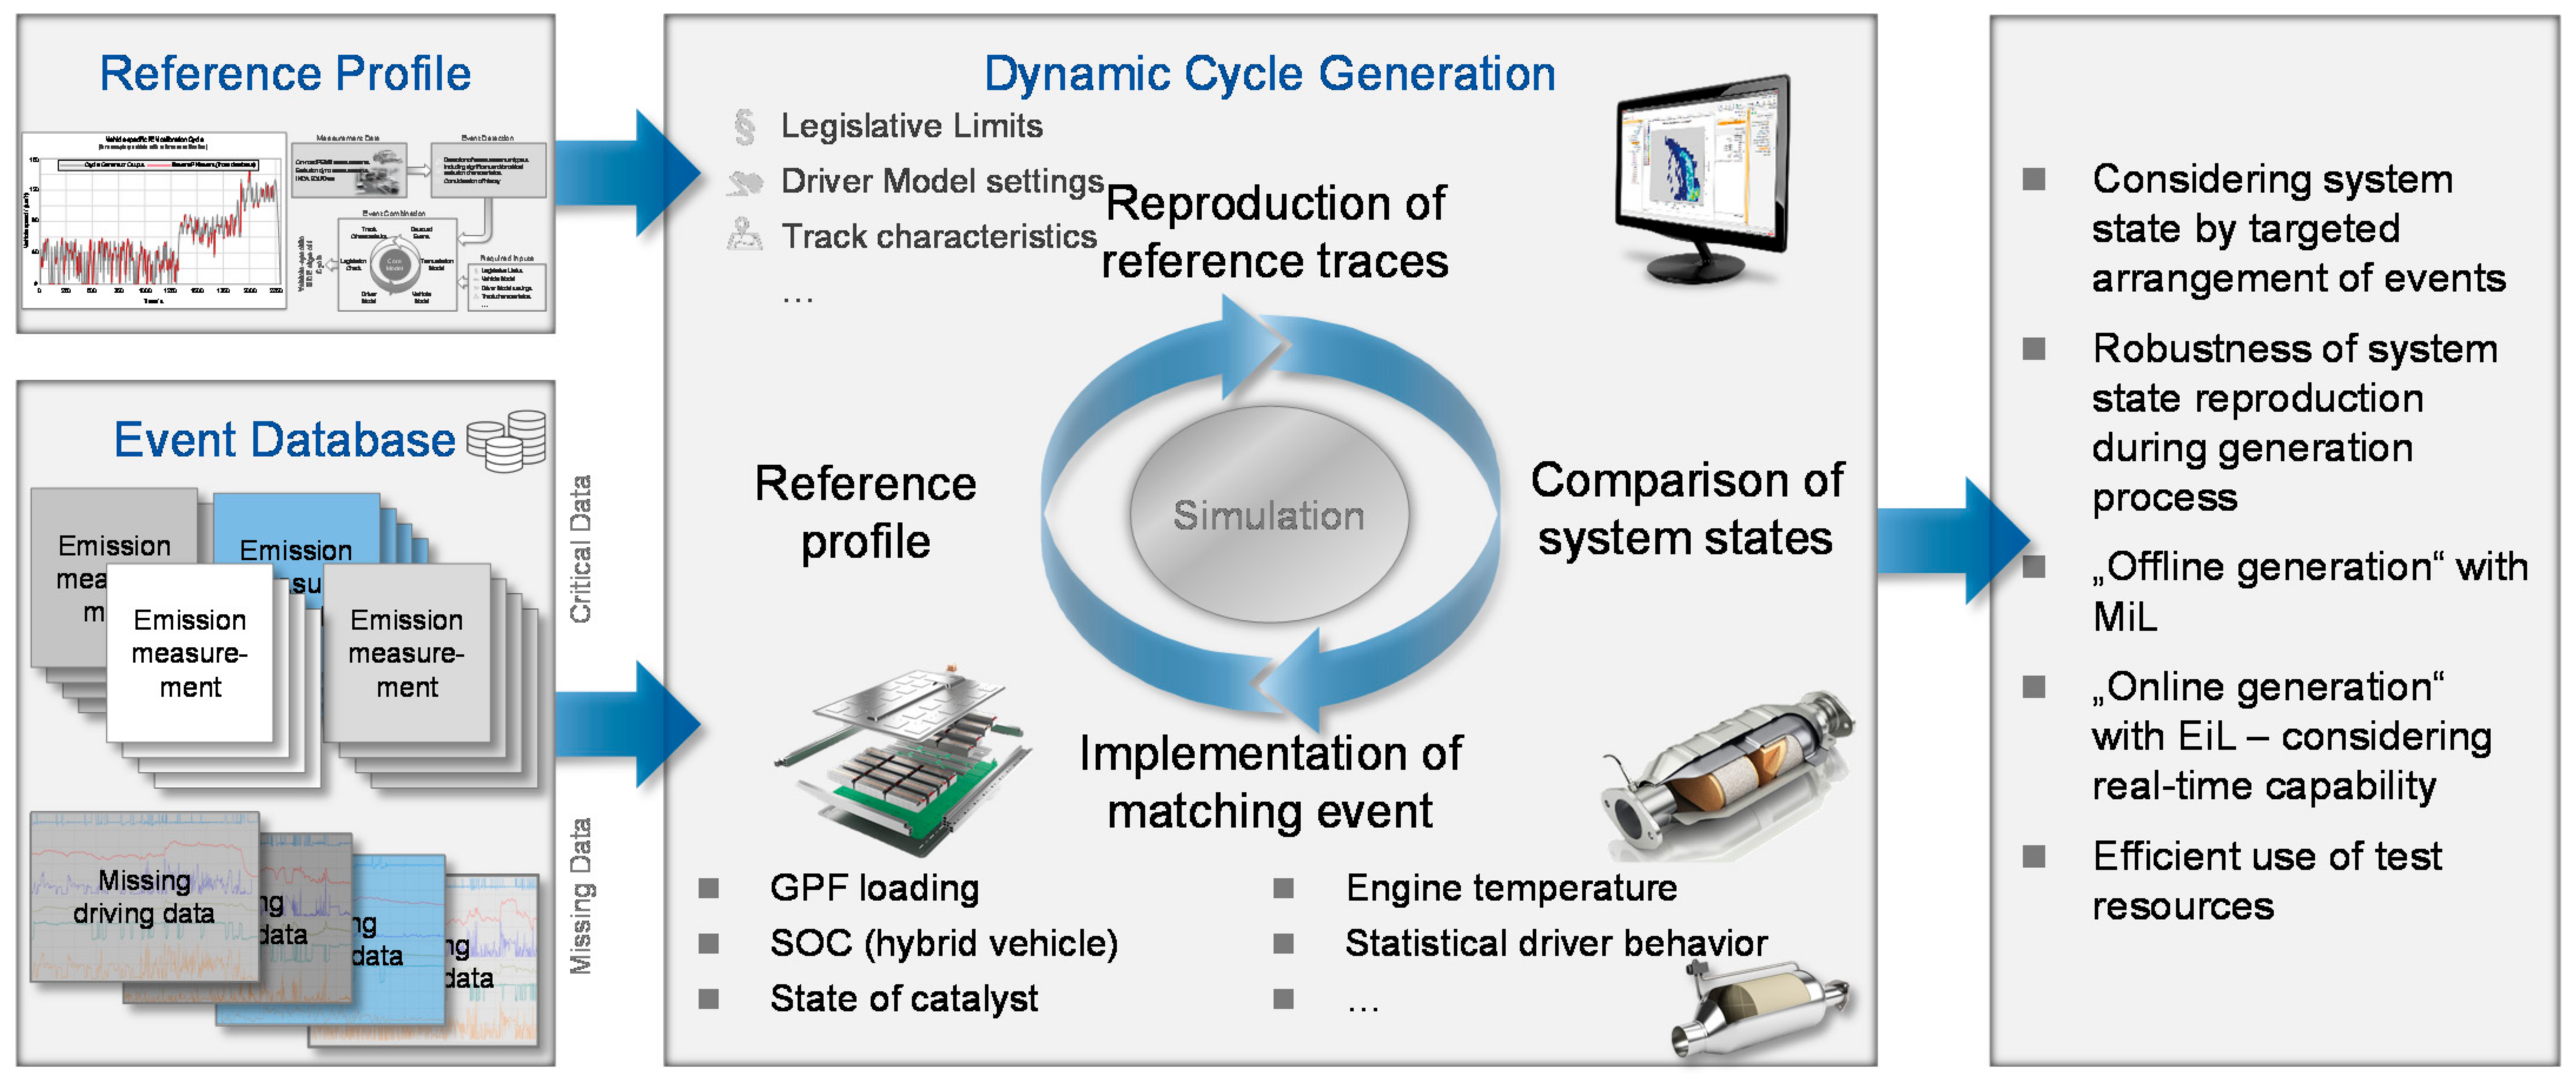
Figure 11 describes the procedure for the dynamic and model predictive cycle generation. Initially, a speed and gradient profile is generated using the existing approach. Alternatively, random profiles can also be used. This reference profile is then fed into a simulation model where a virtual driver and vehicle are used to simulate all required system states as described in [64,76,77].
The modeled component states are continuously compared to a database of potential sequences to be tested. These sequences are a collection of critical events detected from previous tests and extracts of identified profiles with unknown impact on the emissions based on the statistical evaluation of on-road measurements. Once the comparison identifies a system state that matches the initial state of the relevant signals (output of Identification of calibration optimization potentials) of any event, the upcoming speed and gradient traces of the reference cycle are replaced with the trace of the specific sequence. A filter for ramping into the speed and gradient profile is used to avoid digital jumps in the target profile for the simulated driver.
During the reproduction of such an event, the comparison is not further executed to not interrupt the current event once a different one fits. At the end of the reproduced event, the comparison is re-activated. Either a filter is ramping back into the initial reference profile or into the next event that matches the current component states with its initial states.
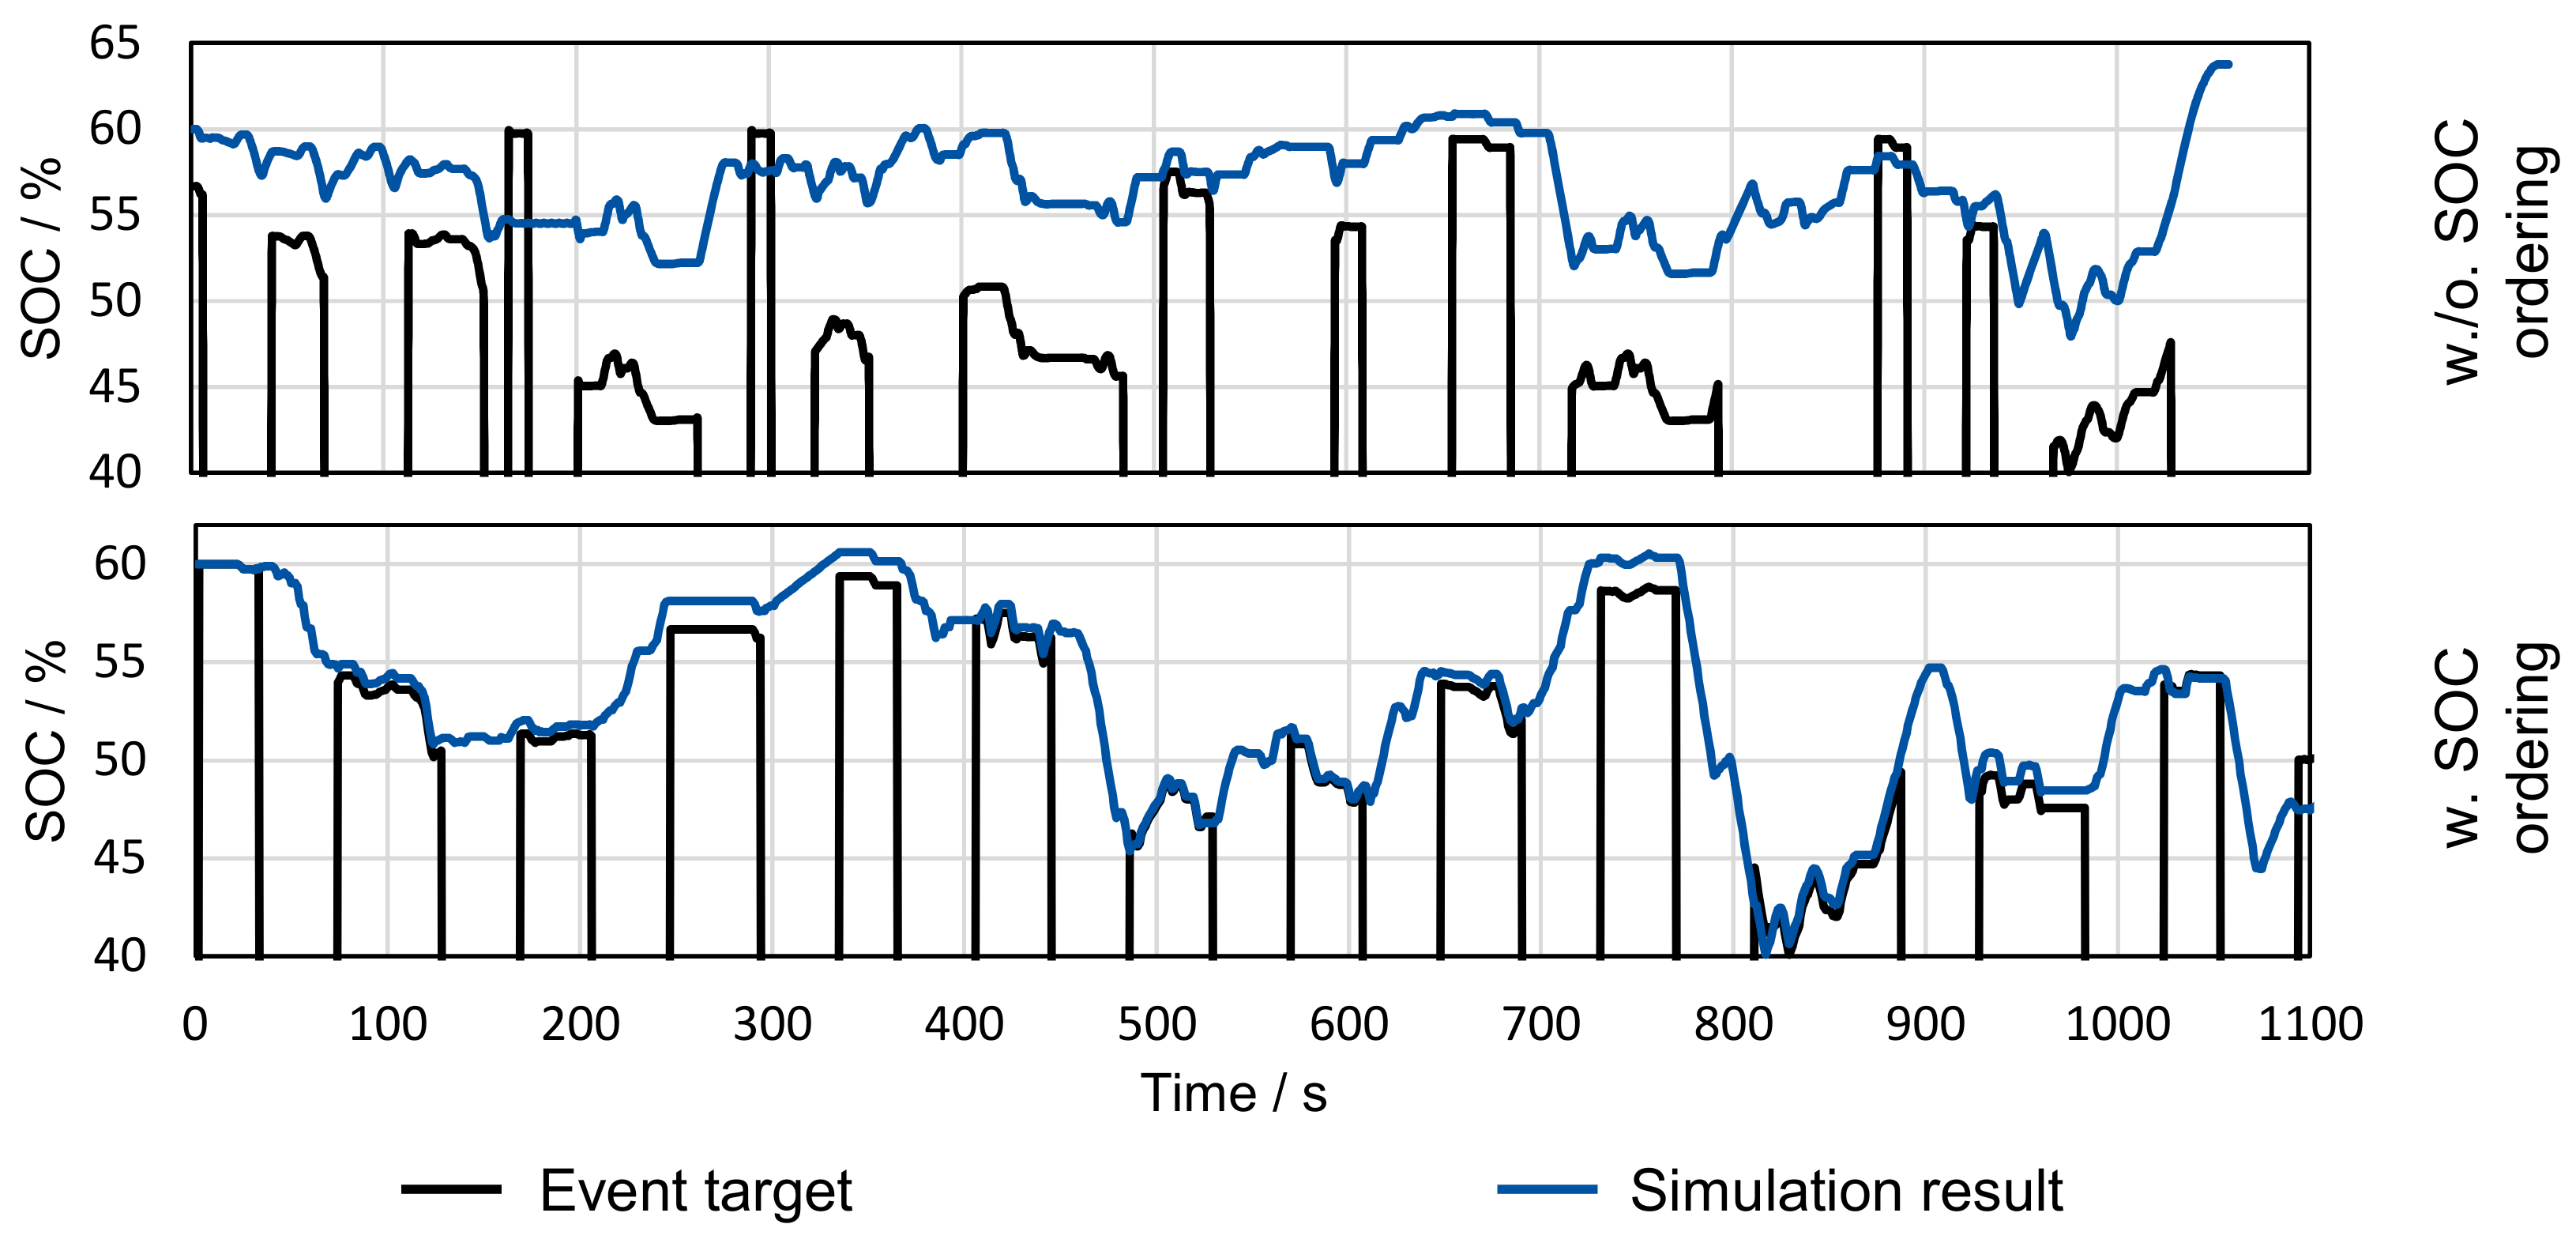
Compared to approaches without the model predictive estimation of component states, this has the advantage of targeted arrangement of critical events. While the complete and automated methodology is still in development, Figure 12 shows an example of a first attempt of a simulation-based ordering of events using a low-level open-loop model to arrange the events in a cycle. The black traces describe the target SOC states of the events selected for the test cycle. These events have been detected from simulations with the same vehicle setup in the same simulation environment, based on modeled NOX emissions. The blue trace reflects the results achieved in simulation using the same model and vehicle as described in Table 1.
In the top chart, the conventional cycle generation with an order of events only considering the RDE phases is used (without SOC ordering). Clear deviations between the target and the actual simulated SOC profile can be observed. Even though the simulated profile is close to the event target (e.g., at t = 500 s) in some occasions, the profiles move away from each other over the entire cycle.
To compensate this effect, a first investigation of the described methodology is carried out in the lower chart (with SOC ordering). Here, the described methodology is not yet used in closed loop with the simulation environment. A direct feedback of the system’s state was not given to the generation algorithm, but only a basic open-loop model was used. The open-loop battery model consists of charge–discharge/delta-SOC map based on the delivered absolute power. Thus, the prediction of the SOC change rate is only a first assumption on the open-loop profile and not yet as reliable as a closed-loop powertrain model considering SOC changes based on the provided electric torque.
Based on the predicted SOC states, the events are ordered by the cycle generation algorithm to match the initial state of SOC. Even though only the open-loop low level SOC model is used for the drive profile generation, a clear improvement in matching the event targets in the conducted simulation in the MiL environment is achieved.
The advantage in reproduction accuracy even with inaccurate open-loop models strongly motivates to couple the presented approach to a closed-loop simulation environment to further reduce the deviations and consider several signals and the complete behavior of the powertrain. The ordering is then optimized by being able to specifically place relevant events at positions where they can be reproduced, resulting from e.g., certain SOC levels, temperature conditions of electric components or conditions of the EATS in the warm-up phase.
Situations in which the components cool down or heat up towards areas with an impact on emissions (e.g., low conversion efficiency or change of engine mode for component protection), can be considered dynamically. When using PN events, the temperature and loading of the particulate filter can be taken into account as well as all influencing states of a hybrid system.
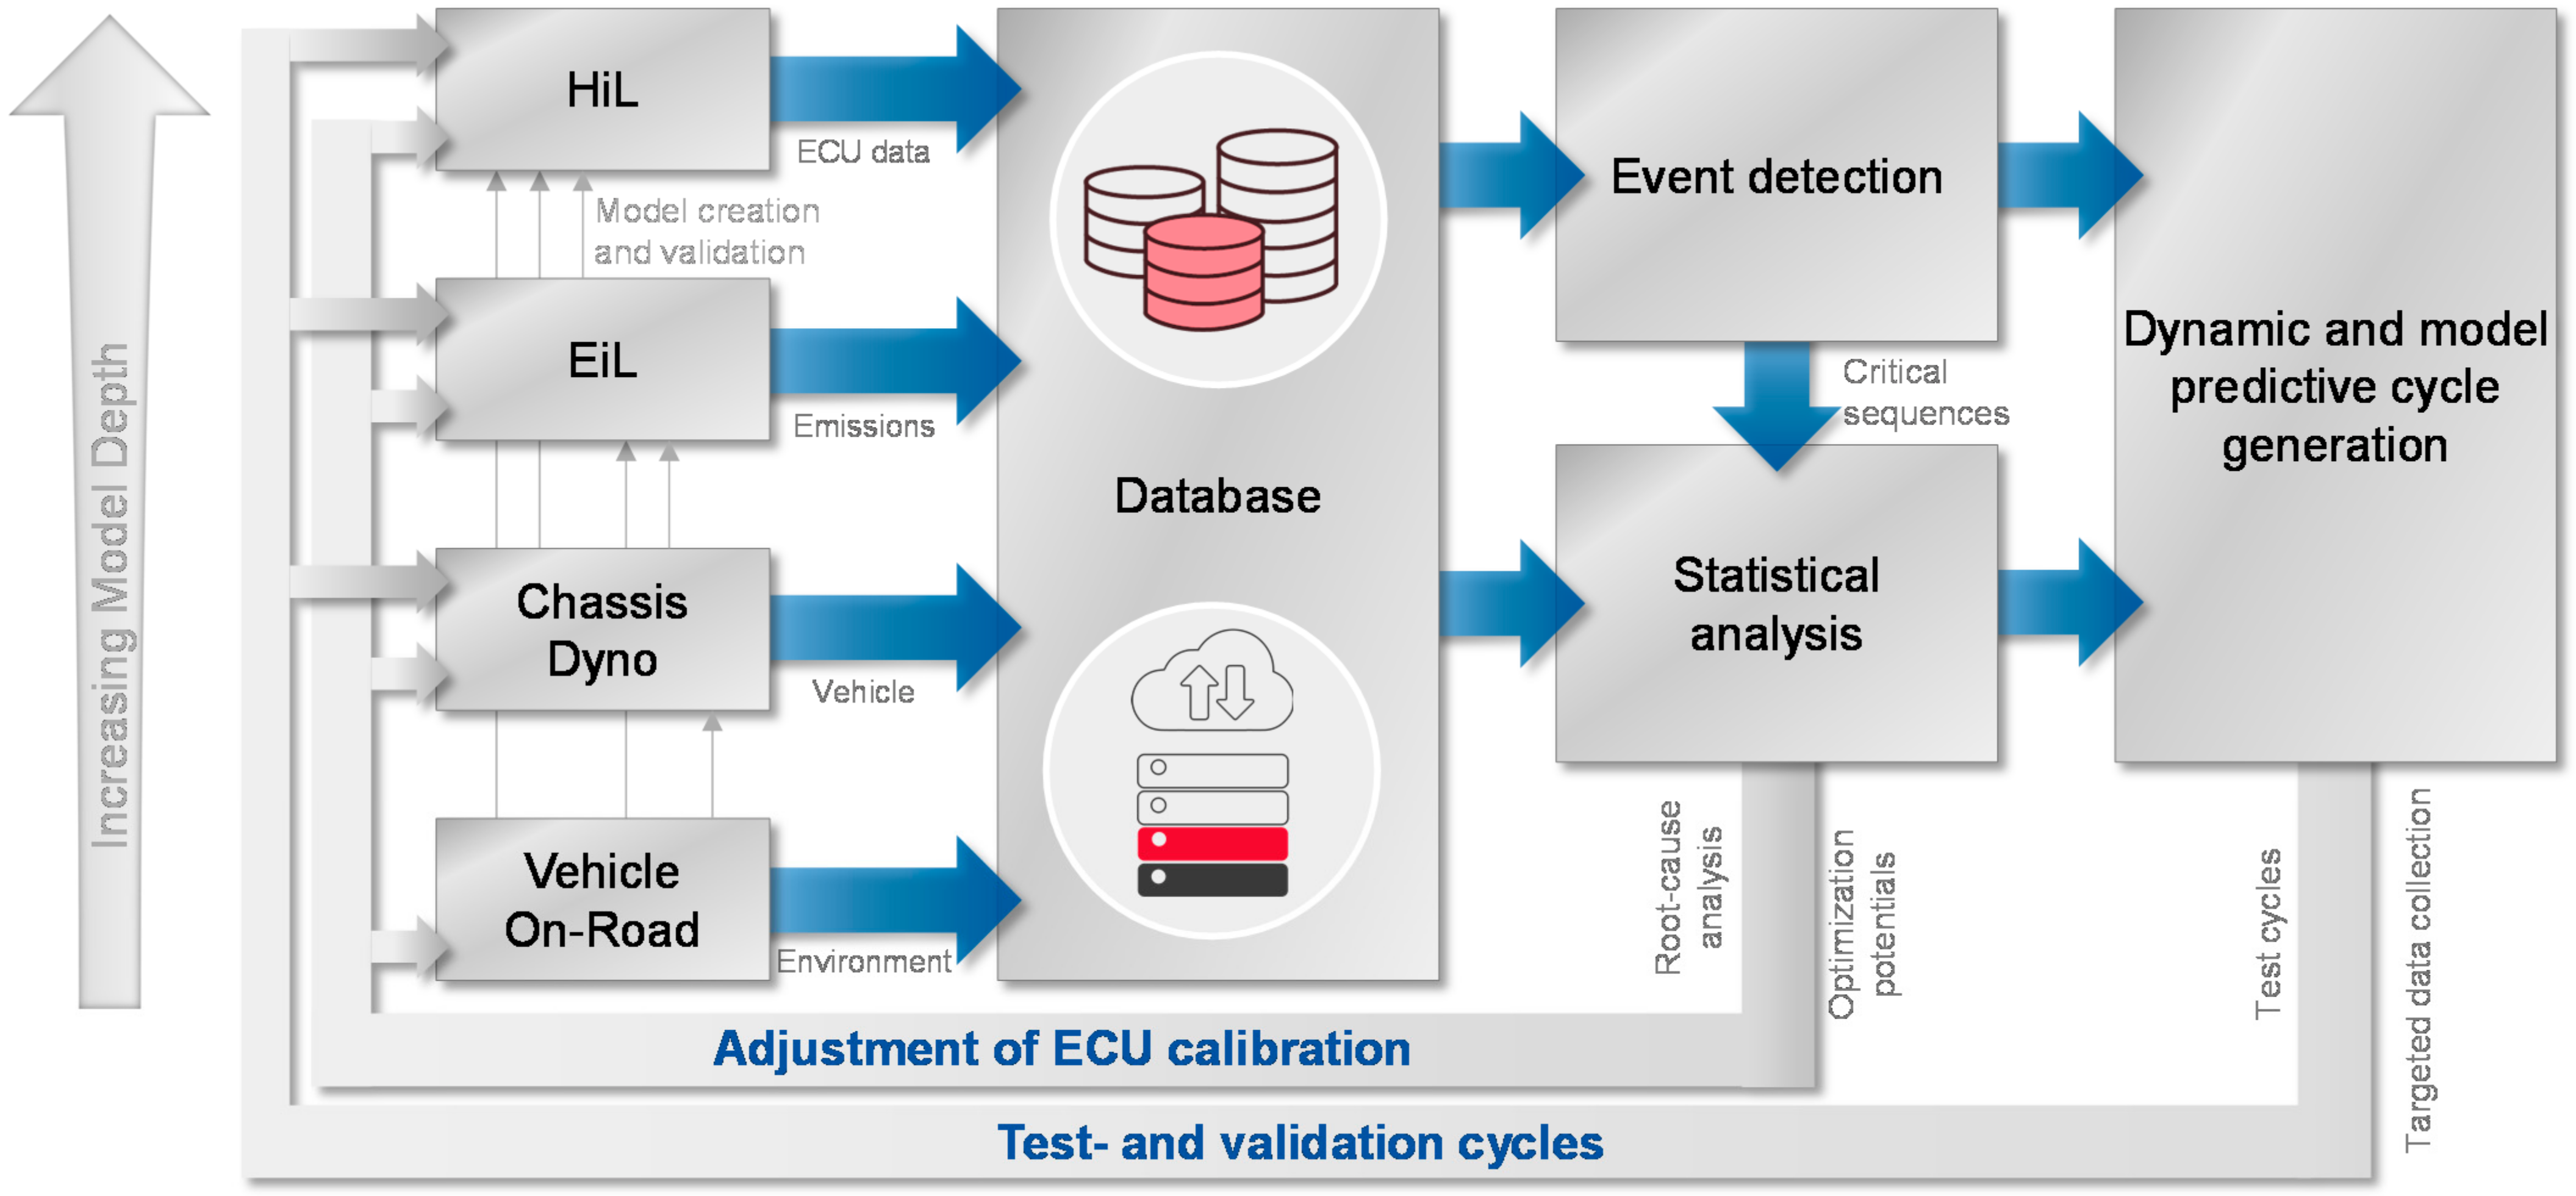
The dynamic generation of such statistically relevant scenarios can be performed for multiple environments (Figure 13). System evaluations can be carried out directly in the MiL environment, while the cycle is being created. HiL and EiL applications can be used by either first generating the cycle in the MiL environment and then feeding the static profile into the corresponding HiL and EiL control or by generating the profile dynamically during the HiL or EiL operation. For the live generation, at least a semi real-time comparison of initial event and current component states is required. For database sizes that do not allow for a real-time comparison, an approach can be used in which the comparison is performed block-wise.
The evaluation can then include a matching event with a delay of several seconds, only considering the states up to a certain point and ignoring minor changes caused by the delay between start of comparison and selection of an event. Once an event is selected, a comparison for the next event can be started by already using the known state of the current event’s end for the comparison of a fitting next event. This assumes that the event is reproduced with sufficient quality.
Adjusting the profile in real-time has the advantage that the evaluation of the system states is not completely determined by models, but actual real-time measured variables can be taken into account. A semi real-time adjustment loses accuracy, but still has the ability to be corrected by real system states. Cycles that are created in a purely simulative environment can only be implemented in the arrangement of events as good as the simulation of the relevant states is. However, compared to conventional pre-test generation without model prediction and dynamic adaptation, the certainty of reproducing desired states in the test can still be increased, thus saving costs and test resources.
Testing on chassis dynamometers or on test track roads can be performed by using the previously generated cycle as a static profile. Here, the novel approach has the advantage of enabling the reproduction of hybrid powertrain events. Being sensitive to component temperatures and SOC, a clear reproduction of the ICE operation on a chassis dyno is extremely challenging (Figure 10). With a static cycle being generated without the knowledge about the time-wise system behavior, the relevant signals cannot be controlled over the entire cycle.
As summarized in Figure 13, the concept serves for the complete calibration and validation procedure. Virtual test benches are used for dynamic testing in early stages, when the complete vehicle is not yet available. Storing all test results in a common database allows for automatic detection and statistical investigation of critical data sequences. The clustering helps to identify root causes and optimization potentials that can be implemented in the ECU calibration. At the same time, the dynamic creation of cycles provides test scenarios with a high level of relevance and reproducibility for targeted analysis and validation. While the test bench is changed during the period of a project, the use of data remains consistent.
Using the concept for all potential test benches allows a continuous loop for model validation. The data collected at a test bench with a higher level of real components can be fed back to the models for test benches with a higher degree of virtualization.

4. Setup of a Dynamic HiL Test Bench for Virtual Calibration Purposes

To actually use the suggested concept already in early stages in virtual test environments, these need to allow a high level of reproduction and representation of the system’s real-world behavior. This chapter serves to demonstrate the suitability of virtual test beds for substitution of vehicle tests. An efficient calibration process supported by closed-loop HiL simulations is presented in [64,78]. The demonstrated use of conventional application processes on a virtual test beds motivates for the coupling of the presented methodology with in-the-Loop approaches in the further development of the concept.
An overview of a closed-loop HiL platform used for virtual calibration purposes is shown in Figure 14. A co-simulation setup is used to increase model accuracy for vehicle and emission simulation, with the specification of the virtual vehicle described in Table 2.
It comprises two simulative subsystems:
  • dSPACE Scalexio HiL including the I/O board;
  • xMOD high-performance workstation.
The dSPACE platform is used to execute the driver, transmission, transmission control unit (TCU) and chassis. GT-SUITE–based real-time engine, emissions and the three-way-catalyst (TWC) models are executed on an xMOD platform. The TWC model simulates the voltage of the narrow-band oxygen sensor located downstream of the TWC. Further details on the respective models used can be found in [64]. For the validation of the platform itself, a simple scenario of a NEDC profile is used. This reduces cross-influences of potential methodology influences on the reactions of the single models. Thus, a validation of real ECU calibration influences on the model behavior becomes possible.

5. Verification of a Virtual Calibration Use Case on a HiL Test Bench

To validate the performance of the real-time models and the test bench setup during closed-loop operation, the fuel cut-off operation with subsequent catalyst purging in a transient test cycle is evaluated as an example. Different ECU calibrations are used to identify the usability of a virtual test bench for calibration use-cases.

5.1. Validation with Real World Measurements

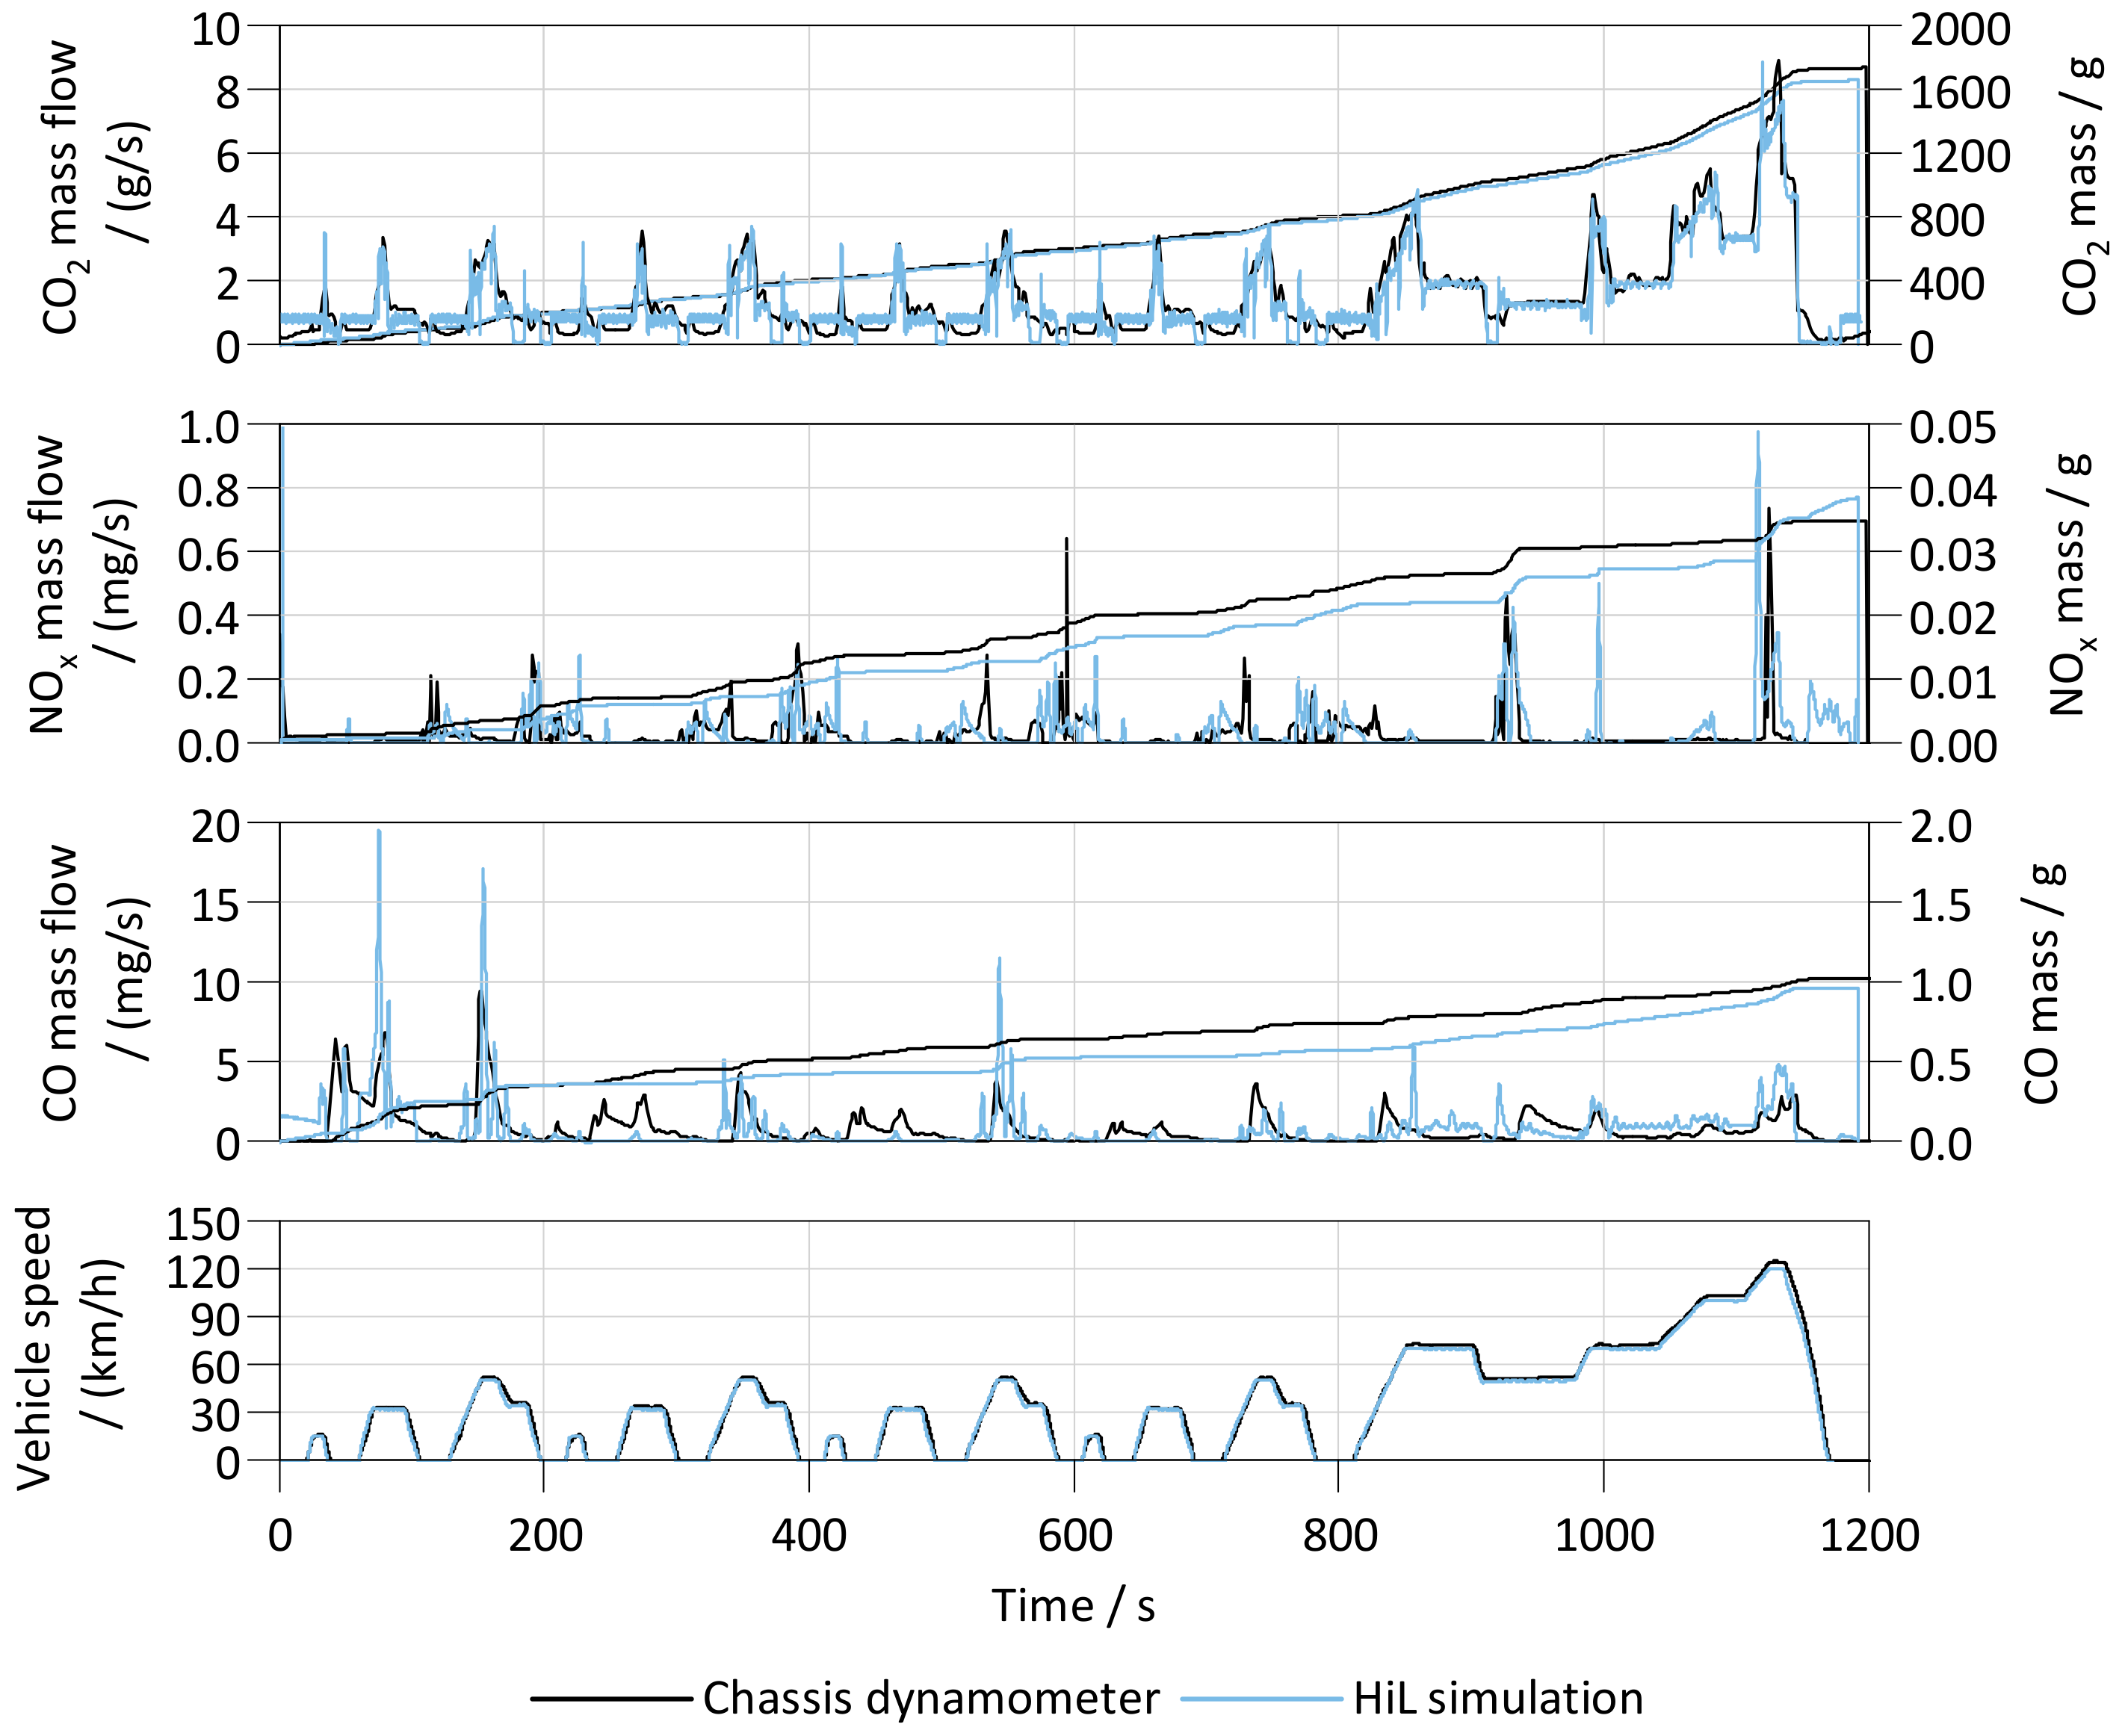
Figure 15 displays NEDC CO2, CO and NOX tailpipe emissions, comparing HiL-based measurement results of a virtual vehicle under warm engine conditions with a vehicle measurement on the chassis dynamometer.
A relative difference between the cumulative gaseous raw emissions of less than 5% is achieved. For gaseous tailpipe emissions, it is less than 10%. Comparing the emission traces time-wise, a good match between the real vehicle measurement and the HiL simulation is observed. Relevant critical events are qualitatively and quantitatively matching, which enables the analysis of optimization potentials and calibration influences for calibration purposes. The differences between simulated and real emission behavior at certain sequences are still subject of model optimization.
As map-based models for the raw emissions and conversion behavior of the EATS are used, a main point within the optimization is the extension of the area mapped with reference data. Especially when reaching border areas of mapped data, the simulation becomes inaccurate. Here, especially low exhaust gas mass flows (first part of NEDC from t = 250 s to t = 700 s) lead to a repeated underestimation of the resulting CO emission intensity. To prevent such inaccuracies when extrapolating into unmapped areas, a wider range of data conduction for building the models is required.

5.2. Virtual Emission Calibration

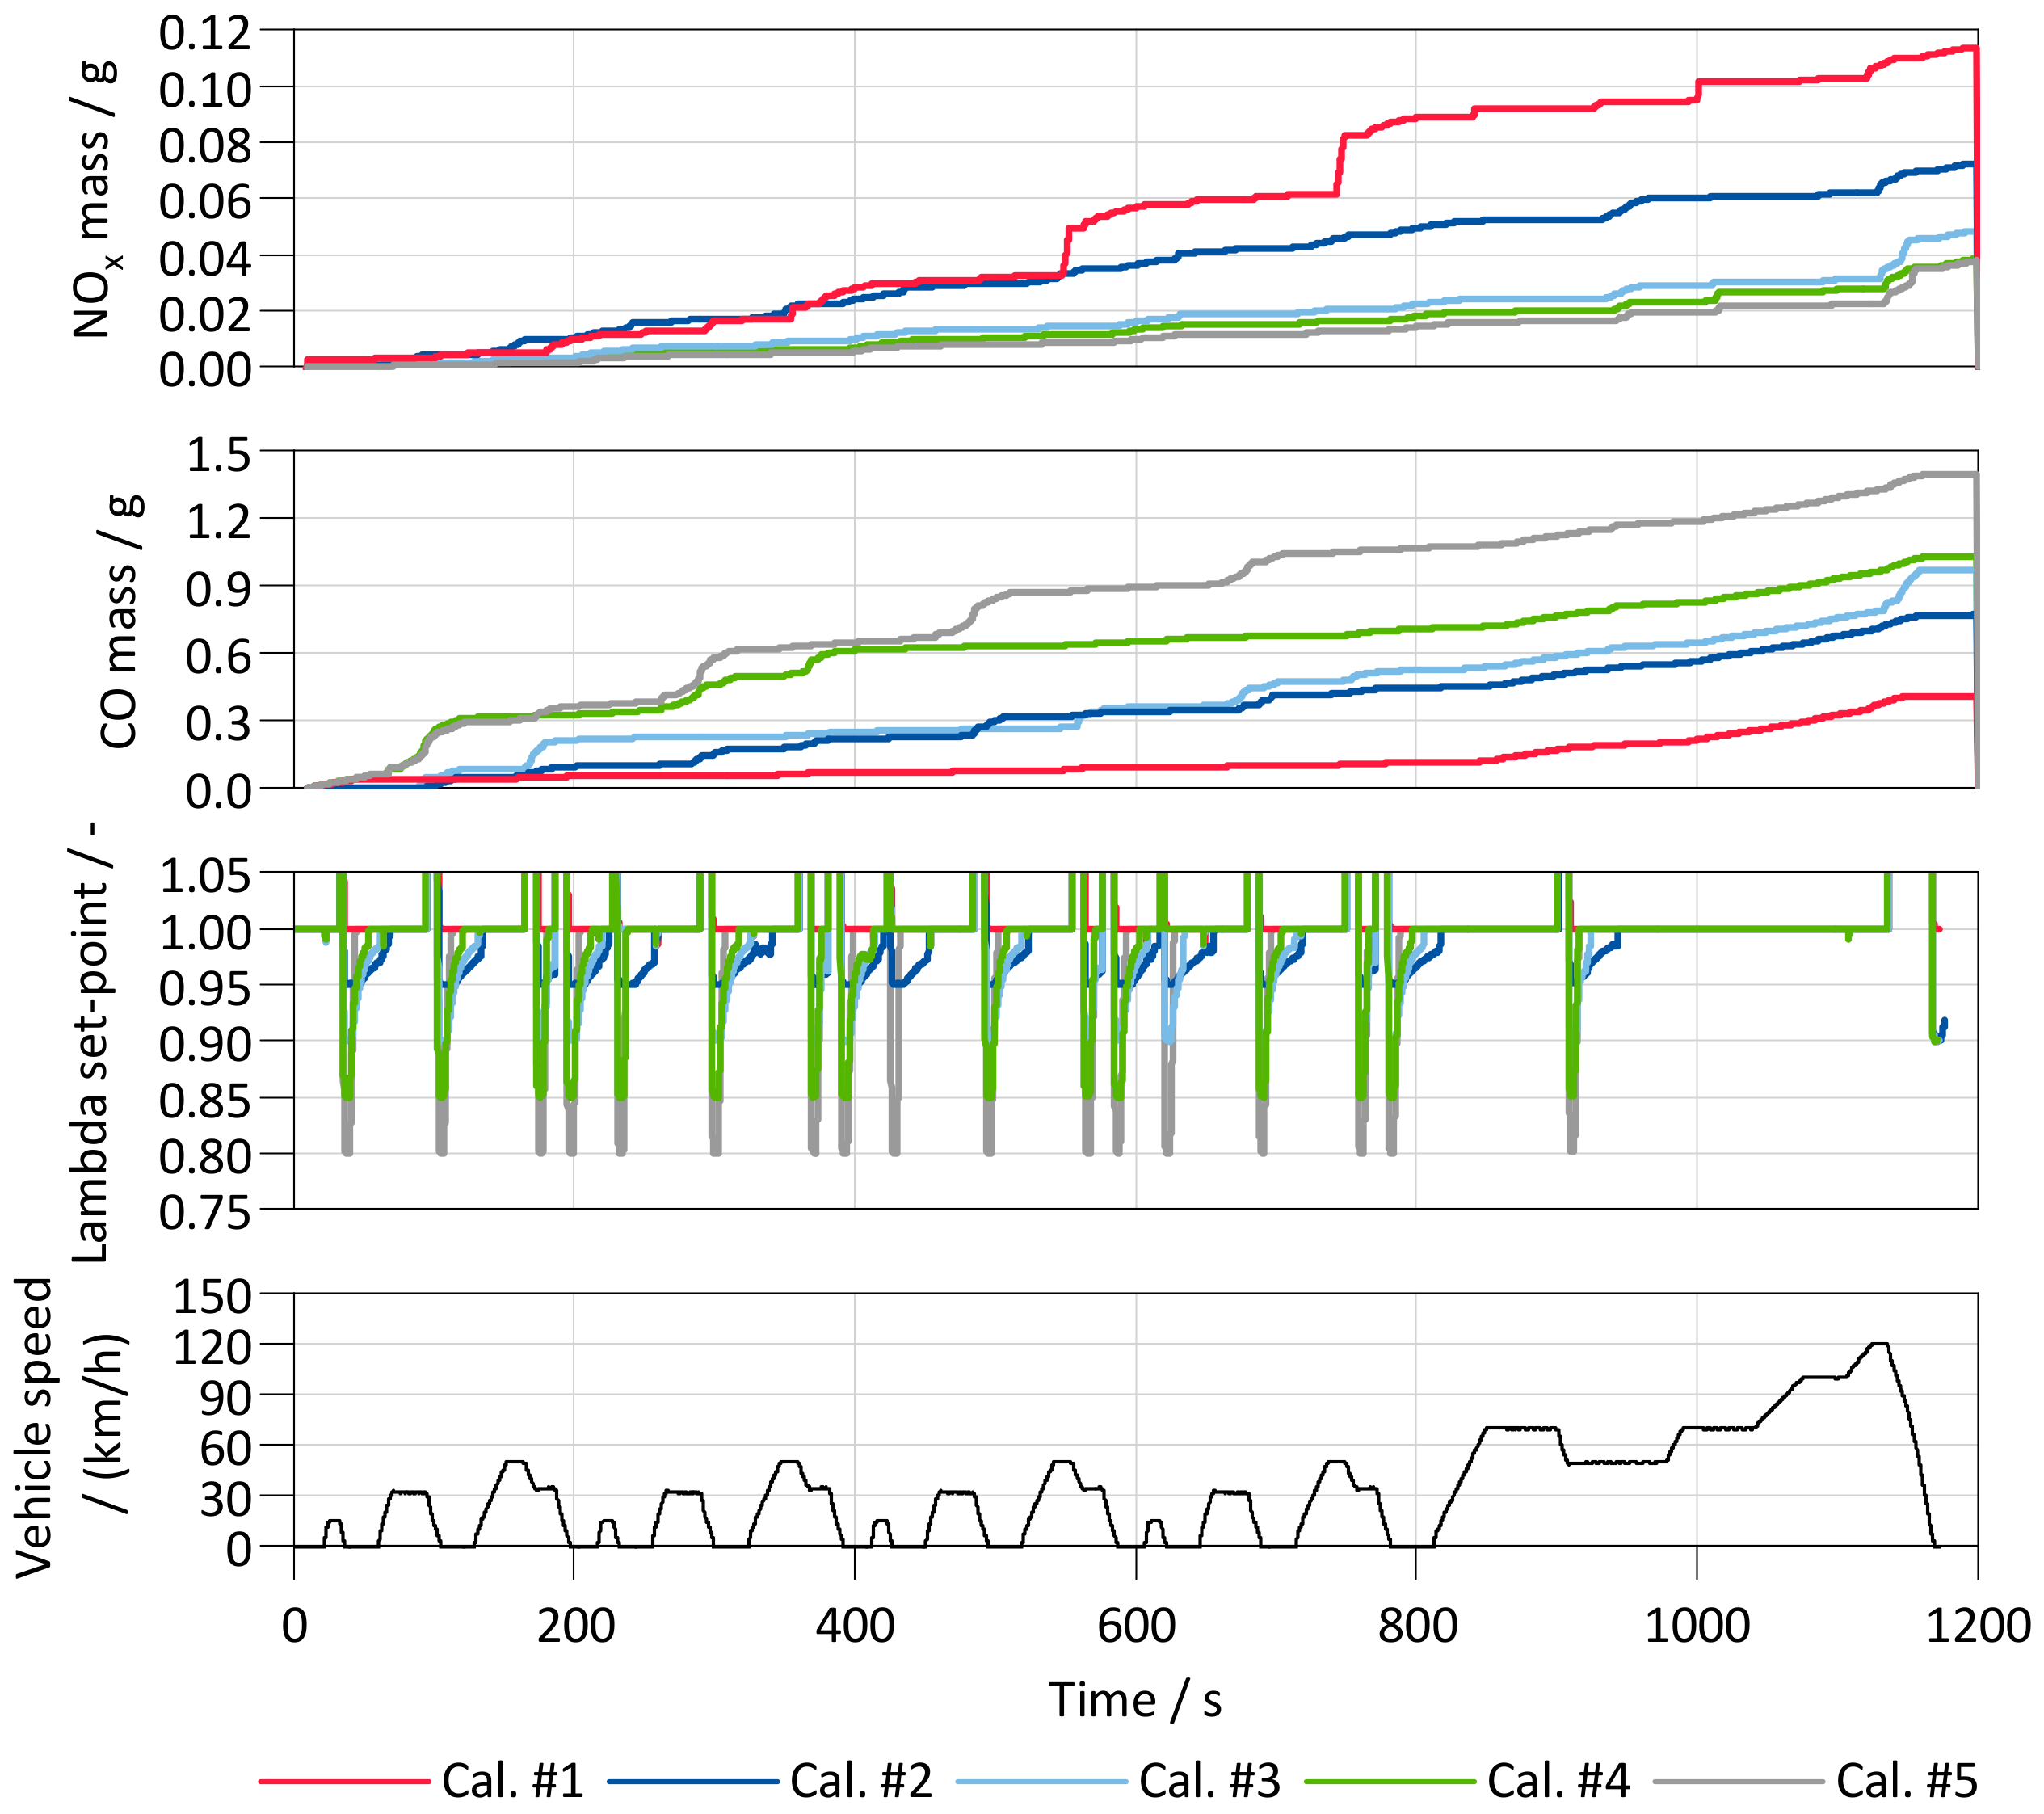
The aim of the catalyst purge functionality is the removal of excessive oxygen from the TWC to increase the catalyst conversion efficiency after fuel cut-off phases when pure air is flowing through the catalyst. To evaluate the impact of different calibrations on the effect of the model behavior on the HiL test bench, five different calibration sets for the catalyst purge functionality are tested and evaluated. Different intensities of the enrichment after a fuel cut-off are defined. Thus, the effect of trade-offs between duration required for purging and resulting emissions can be analyzed. While a more aggressive enrichment might decrease the duration for catalyst purging, it increases the fuel consumption and CO emissions. Here, the HiL platform is expected to decrease the absolute number of vehicles tests required on a chassis dynamometer to optimize the purging event.
The cumulated NEDC NOX and CO emission results are shown in Figure 16 for testing a conventional 1.6 L GDI powertrain. Different set-points for the relative air/fuel ratio (lambda) enrichment during catalyst purging are used in each simulation. With an increasing enrichment from Calibration 1 to Calibration 5, the impact can be seen in decreasing NOX and increasing CO emissions.
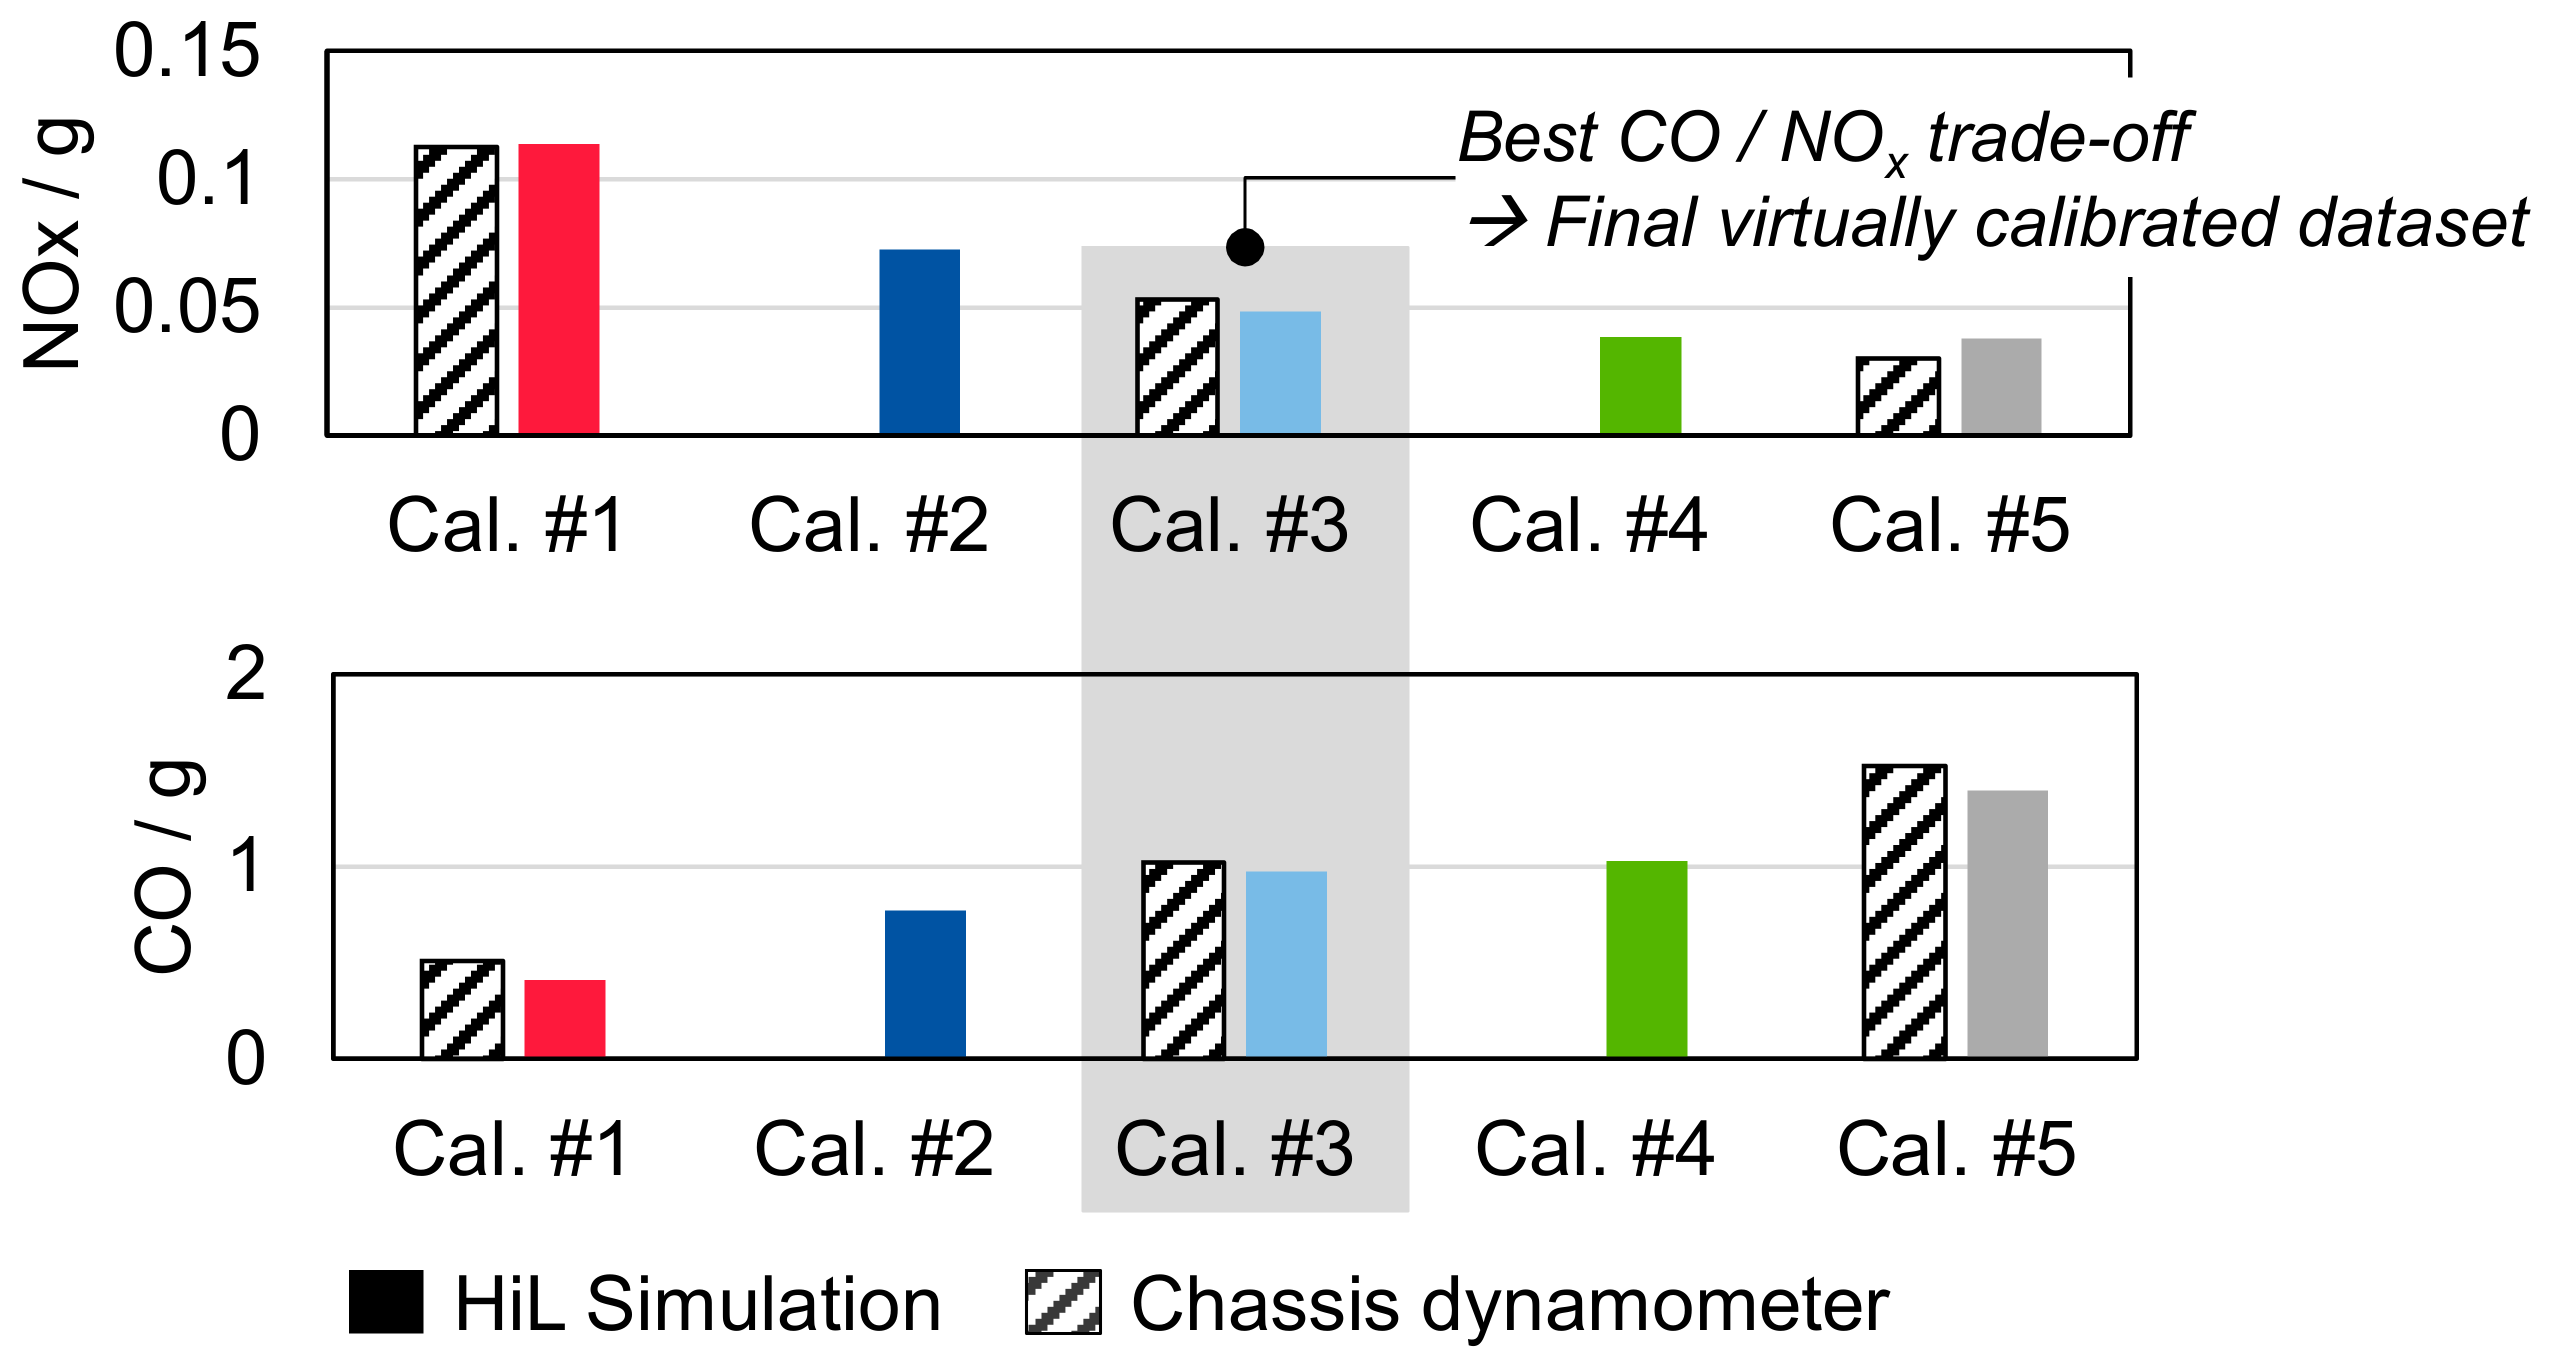
Figure 17 depicts the differences between the cumulated NOX and CO emission results for the five calibration sets used with the simulative environment and the associated real vehicle tests. With the best NOX–CO trade-off achieved with Calibration 3 and the cases of highest NOX (Calibration 1) and highest CO (Calibration 5) emissions, a comparison is performed on the chassis dynamometer to evaluate the ability to reflect the real-world behavior of the adjustments to the ECU used on the HiL test bench. A good match can be seen for all of the used calibration sets.

5.3. Outlook to Hybrid Strategy Calibration

The presented example for the calibration of different catalyst purge strategies demonstrates the ability of a HiL test bench to reproduce the effects of different application adaptations of the dataset on the operating behavior with high accuracy. This is the basic prerequisite for efficiently supporting vehicle development with virtual methods. The example of CO and NOX emissions shows the complex interaction between both engine operating behavior, modeling of raw emissions and representation of the conversion and oxygen storage characteristics of the TWC.
The targeted analysis of the measured data with the previously described methodology can equally represent the identification of areas to be optimized in terms of operating strategy and load point shifting. For this application, a highly accurate simulation of the influence on emissions, drivability and consumption behavior is required.
The performance of the presented virtual methods for the representation of the drivability is described by HEUSCH et al. in [10]. In addition to the ability to accurately describe the exhaust emission behavior, the presented approach is also very well suited for the simulation of fuel and energy consumption. The good match of CO2 emissions (Figure 15) shows that both raw emission models and conversion models of the EATS provide highly specific results. For the focus on fuel consumption, even less complex models can be used, since raw emission modeling is sufficient for this purpose; exhaust aftertreatment modeling is not a requirement.
The influences of the electrical components can be used with different degrees of precision in the selected model environment. As far as no real components are available, sub- models for electrical components of different complexities can be applied for calibration tasks of these [79]. Both simple map-based substitute models and highly complex physical models are possible. The use of the respective models depends on the focus of the application. In particular for dynamic cycle generation, high quality catalyst and battery models are necessary according to the focused component states.

6. Summary and Conclusions

With the continuously tightening pollutant emission standards and targets for the reduction of GHG emissions, the automotive industry is facing complex challenges to optimize the powertrain systems. On top of the challenges posed by RDE, the hybridization of powertrains further extends the range of influencing factors on the ICE operating points. When validating calibration optimizations on any test bench, the reproducibility of the scenarios to be tested is crucial. Especially when testing hybrid vehicles on a chassis dynamometer, the exact reproduction of operating points is almost impossible with current approaches.
The novel procedure presented here aims to support the required testing processes by making high and efficient use of the collected data during the development and to provide dedicated and statistically robust test scenarios. For this, the event detection of the existing methodology for RDE cycle generation based on emission measurements is transferred into a new framework. An analysis for identification of relevant signals by means of a clustering approach is implemented. Identified signals can then be used to check the amount of existing data for potential white-spots by comparing them to fleet data. Relevant events are then combined in a dynamic cycle generation. This does not require a complete test cycle before the tests, but builds up a relevant scenario during the ongoing test to provide a high level of reproducibility. The final elaboration of the novel concept thus promises following key benefits:
  • An existing automatic detection of critical sequences is supplemented by an approach for clustering these. This novel approach enables an automatic identification of relevant signals and signal traces for guided analysis of a big amount of data and thus supports the engineer on focusing onto relevant control signals instead of mainly considering known effects based on the engineer’s experience.
  • The here presented approach of reconstructing real-world drives with emission measurement data serves to predict potential critical driving routes and allows to judge the statistical quantity of existing emission measurement data. Thus, a higher degree of robustness can be achieved when relying on the hereby created test scenarios.
  • Identification of white-spots in the emission measurement matrices based on fleet data to gain a higher statistical certainty during the calibration and validation processes.
  • Providing test scenarios with a high level of reproducibility for efficient testing on any test bench by dynamic and model predictive cycle generation.
The presented example of the catalyst purge calibration on a HiL test bench with differences to real-world measurement results of up to 10% illustrates the quality of the available models and the suitability of virtual test benches for emission calibration purposes. Combining the presented concept with advanced virtual test benches offers a novel approach to the calibration process to efficiently use data while taking advantage of modeling the environment of components to be tested and functions to be developed.

Author Contributions

Conceptualization, S.K. and J.C.; methodology, S.K. and J.C.; validation, S.K., F.D., J.C. and M.D.; formal analysis, S.K., F.D. and J.C.; investigation, S.K., F.D., J.C. and M.D.; resources, S.P.; data curation, S.K., F.D., J.C. and M.D.; writing—original draft preparation, S.K.; writing—review and editing, F.D., J.C., M.D. and S.P.; visualization, S.K.; supervision, S.P.; project administration, S.P.; funding acquisition, S.P. All authors have read and agreed to the published version of the manuscript.

Funding

The presented research was carried out at the Center for Mobile Propulsion (CMP) of RWTH Aachen University, funded by the German Science Council “Wissenschaftsrat” (WR) and the German Research Foundation “Deutsche Forschungsgemeinschaft” (DFG).

Conflicts of Interest

The authors declare no conflict of interest. The funders had no role in the design of the study; in the collection, analyses, or interpretation of data; in the writing of the manuscript, or in the decision to publish the results.

References

  1. Delphi Technologies Worldwide Emissions Standards: Passenger Cars and Light Duty Vehicles. 2020. Available online: https://www.delphi.com/sites/default/files/2020-04/DELPHI%20booklet%20emission%20passenger%20cars%202020%20online%20complet.pdf (accessed on 12 January 2021).
  2. Dorscheidt, F.; Sterlepper, S.; Görgen, M.; Nijs, M.; Claßen, J.; Yadla, S.K.; Maurer, R.; Pischinger, S.; Krysmon, S.; Abdelkader, A. Gasoline Particulate Filter Characterization Focusing on the Filtration Efficiency of Nano-Particulates Down to 10 nm. SAE Int. 2020. [Google Scholar] [CrossRef]
  3. Rexeis, M.; Hausberger, S. Trend of vehicle emission levels until 2020Prognosis based on current vehicle measurements and future emission legislation. Atmos. Environ. 2009, 43, 4689–4698. [Google Scholar] [CrossRef]
  4. European Parliament and Council Commission Regulation (EU) 2018/1832. 2018. Available online: https://eur-lex.europa.eu/legal-content/GA/TXT/?uri=CELEX:32018R1832 (accessed on 11 September 2020).
  5. Claßen, J.; Sterlepper, S.; Dorscheidt, F.; Görgen, M.; Scharf, J.; Nijs, M.; Balazs, A.; Doucet, M.; Krysmon, S. RDE-Cycle-Generation—A Statistical Approach to Provide a Secure Base to Approve RDE Legislation Compliance. In Proceedings of the SCC Symposium for Combustion Control, Aachen, Germany, 5–6 June 2019. [Google Scholar]
  6. Wang, Z.; Wu, P.; Yu, N.; Zhang, Y.; Wang, Z. Analysis of the influence of RDE test data processing methods on the emission results of China 6 light duty vehicles. E3S Web Conf. 2021, 268, 1022. [Google Scholar] [CrossRef]
  7. Eurostat, E.U. Greenhouse Gas Emission Statistics—Emission Inventories. 2020. Available online: https://ec.europa.eu/eurostat/statistics-explained/index.php?title=Greenhouse_gas_emission_statistics_-_emission_inventories#Trends_in_greenhouse_gas_emissions (accessed on 18 June 2020).
  8. Europäischen Union Verordnung (EU) 2019/631 des Europäischen Parlaments und des Rates. 2019. Available online: https://eur-lex.europa.eu/legal-content/de/TXT/?uri=CELEX%3A32019R0631 (accessed on 10 November 2020).
  9. Millo, F.; Accurso, F.; Zanelli, A.; Rolando, L. Numerical Investigation of 48 V Electrification Potential in Terms of Fuel Economy and Vehicle Performance for a Lambda-1 Gasoline Passenger Car. Energies 2019, 12, 2998. [Google Scholar] [CrossRef] [Green Version]
  10. Heusch, C.; Guse, D.; Dorscheidt, F.; Claßen, J.; Fahrbach, T.; Pischinger, S.; Tegelkamp, S.; Görgen, M.; Nijs, M.; Scharf, J. Analysis of Drivability Influence on Tailpipe Emissions in Early Stages of a Vehicle Development Program by Means of Engine-in-the-Loop Test Benches; SAE Technical Paper Series; WCX SAE World Congress Experience, APR. 21, 2020; SAE International400 Commonwealth Drive: Warrendale, PA, USA, 2020. [Google Scholar] [CrossRef]
  11. Yan, F.; Xie, N.; Wang, Y.; Li, J. Research on cold start and new data evaluation method influence on RDE test for light-duty vehicles. E3S Web Conf. 2021, 268, 1048. [Google Scholar] [CrossRef]
  12. Lenz, M.; Cremer, M.; Guse, D.; Röhrich, H.; Pischinger, S. A case study on particulate emissions from a gasoline plug-in hybrid electric vehicle during engine warm-up, taking into account start–stop operation. Proc. Inst. Mech. Eng. Part D J. Automob. Eng. 2020, 234, 2907–2922. [Google Scholar] [CrossRef]
  13. Tutuianu, M.; Bonnel, P.; Ciuffo, B.; Haniu, T.; Ichikawa, N.; Marotta, A.; Pavlovic, J.; Steven, H. Development of the World-wide harmonized Light duty Test Cycle (WLTC) and a possible pathway for its introduction in the European legislation. Transp. Res. Part D Transp. Environ. 2015, 40, 61–75. [Google Scholar] [CrossRef]
  14. Kooijman, D.G.; Balau, A.E.; Wilkins, S.; Ligterink, N.; Cuelenaere, R. WLTP Random Cycle Generator. In Proceedings of the 2015 IEEE Vehicle Power and Propulsion Conference (VPPC), Montreal, QC, Canada, 19–22 October 2015; pp. 1–6, ISBN 978-1-4673-7637-2. [Google Scholar] [CrossRef]
  15. Claßen, J.; Sterlepper, S.; Dorscheidt, F.; Görgen, M.; Scharf, J.; Nijs, M.; Alt, N.; Balazs, A.; Böhmer, M.; Doucet, M.; et al. RDE cycle generationA statistical approach to cut down testing effort and provide a secure base to approve RDE legislation compliance. Int. Mot. 2019, 76, 37–56. [Google Scholar] [CrossRef]
  16. Claßen, J.; Krysmon, S.; Dorscheidt, F.; Sterlepper, S.; Pischinger, S. Real Driving Emission Calibration—Review of Current Validation Methods against the Background of Future Emission Legislation. Appl. Sci. 2021, 11, 5429. [Google Scholar] [CrossRef]
  17. CLOVE Consortium Study on Post EURO 6/VI Emission Standards in Europe: Presentation to the Advisory Group on Vehicle Emission Standards (AGVES). 2019. Available online: https://circabc.europa.eu/sd/a/a108e064-c487-4bf6-bb46-7faac76f8205/ (accessed on 1 April 2021).
  18. CLOVE Consortium Study on Post EURO 6/VI emission standards in Europe (Part B): Presentation to the Advisory Group on Vehicle Emission Standards (AGVES). 2020. Available online: https://circabc.europa.eu/webdav/CircaBC/GROW/AGVES/Library/3%20meeting%204%20February%202020/Part%20B%20slides%20for%20AGVES%2020200131%20v4.pdf (accessed on 3 March 2021).
  19. CLOVE Consortium Study on Post-EURO 6/VI Emission Standards in Europe (Part A): Presentation to the Advisory Group on Vehicle Emission Standards (AGVES). 2020. Available online: https://circabc.europa.eu/webdav/CircaBC/GROW/AGVES/Library/3%20meeting%204%20February%202020/Part%20A%20slides%20for%20AGVES%2020200131%20v3.pdf (accessed on 10 March 2021).
  20. Huang, Y.; Surawski, N.C.; Organ, B.; Zhou, J.L.; Tang, O.H.H.; Chan, E.F.C. Fuel consumption and emissions performance under real driving: Comparison between hybrid and conventional vehicles. Sci. Total Environ. 2019, 659, 275–282. [Google Scholar] [CrossRef]
  21. May, J.; Bosteels, D.; Favre, C. A comparison of light-duty vehicle emissions over different test cycles and in real driving conditions. In Proceedings of the FISITA Conference 2014, Maastricht, The Netherlands, 2–6 June 2014. [Google Scholar]
  22. Johnson, T.V. Review of Vehicular Emissions Trends. SAE Int. J. Engines 2015, 8, 1152–1167. [Google Scholar] [CrossRef] [Green Version]
  23. Thompson, G.J.; Carder, D.K.; Besch, M.C.; Thiruvengadam, A.; Kappanna, H.K. In-Use Emissions Testing of Light-Duty Diesel Vehicles in the United States. Int. Counc. Clean Transp. 2014. Available online: https://theicct.org/publications/use-emissions-testing-light-duty-diesel-vehicles-us (accessed on 18 October 2020).
  24. Giechaskiel, B.; Bonnel, P.; Perujo, A.; Dilara, P. Solid Particle Number (SPN) Portable Emissions Measurement Systems (PEMS) in the European Legislation: A Review. Int. J. Environ. Res. Public Health 2019, 16, 4819. [Google Scholar] [CrossRef] [Green Version]
  25. Giechaskiel, B.; Valverde, V.; Clairotte, M. Real Driving Emissions (RDE): 2020 assessment of Portable Emisions Measurement Systems (PEMS) measurement uncertainty, EUR 30591 EN. Luxemb. Publ. Off. Eur. Union 2021. [Google Scholar] [CrossRef]
  26. Maschmeyer, H.; Beidl, C.; Düser, T.; Schick, B. RDE-HomologationHerausforderungen, Lösungen und Chancen. MTZ Mot. Z 2016, 77, 84–91. [Google Scholar] [CrossRef]
  27. Fraidl, G.; Kapus, P.; Vidmar, K. The gasoline engine and RDE challenges and prospects. In Internationales Stuttgarter Symposium; Bargende, M., Reuss, H.-C., Wiedemann, J., Eds.; Springer Fachmedien Wiesbaden: Wiesbaden, Germany, 2016; pp. 257–283. ISBN 978-3-658-13254-5. [Google Scholar] [CrossRef]
  28. Maschmeyer, H. Systematische Bewertung Verbrennungsmotorischer Antriebssysteme Hinsichtlich Ihrer Realfahrtemissionen Am Motorenprüfstand, Dissertation; TU Darmstadt: Darmstadt, Germany, 2017. [Google Scholar]
  29. Wang, W.; Dai, Z.; Bao, M.; Chen, J.; Huang, W.; Liu, Y. A Research on the RDE and WLTC Cycle Emission Characteristics of Hybrid Electric Vehicle. In Proceedings of the 2021 IEEE 4th International Conference on Electronics Technology (ICET), Chengdu, China, 7–10 May 2021; pp. 574–579, ISBN 978-1-7281-7673-4. [Google Scholar] [CrossRef]
  30. Guse, D.; Roehrich, H.; Lenz, M.; Pischinger, S. Influence of Vehicle Operators and Fuel Grades on Particulate Emissions of an SI Engine in Dynamic Cycles. WCX World Congr. Exp. 2018. [Google Scholar] [CrossRef]
  31. Gerstenberg, J.; Hartlief, H.; Tafel, S. Introducing a method to evaluate RDE demands at the engine test bench. In 16. Internationales Stuttgarter Symposium; Springer: Wiesbaden, Germany, 2016; pp. 549–563. [Google Scholar] [CrossRef]
  32. Donateo, T.; Giovinazzi, M. Some Repeatability and Reproducibility Issues in Real Driving Emission Tests, SAE Technical Paper Series. In SAE Technical Paper Series, Automotive Technical Papers; SAE International 400 Commonwealth Drive: Warrendale, PA, USA, 2017. [Google Scholar] [CrossRef]
  33. Bodisco, T.; Zare, A. Practicalities and Driving Dynamics of a Real Driving Emissions (RDE) Euro 6 Regulation Homologation Test. Energies 2019, 12, 2306. [Google Scholar] [CrossRef] [Green Version]
  34. Donn, C.; Zulehner, W.; Pfister, F. Realfahrtests für die Antriebsentwicklung mithilfe des virtuellen Fahrversuchs. ATZ Extra 2019, 24, 44–49. [Google Scholar] [CrossRef]
  35. Hipp, J.; Schmidt, D.; Bauer, S.; Steinhaus, T.; Beidl, C. Methodikbaukasten zur effizienten, zielgerichteten RDE-EntwicklungPotenziale und Perspektiven. In Simulation und Test 2018; Liebl, J., Ed.; Springer Fachmedien Wiesbaden: Wiesbaden, Germany, 2019; ISBN 978-3-658-25293-9. [Google Scholar] [CrossRef]
  36. Neumann, D.; Steinbach, M.; Kutzner, T.; Lehmann, A.; Kassem, V.; Dreiser, M. Model supported calibration process for future RDE requirements. In 16. Internationales Stuttgarter Symposium; Bargende, M., Reuss, H.-C., Wiedemann, J., Eds.; Springer Fachmedien Wiesbaden: Wiesbaden, Germany, 2016; pp. 565–579. ISBN 978-3-658-13254-5. [Google Scholar] [CrossRef]
  37. Kim, K.; Chung, W.; Kim, M.; Kim, C.; Myung, C.-L.; Park, S. Inspection of PN, CO2, and Regulated Gaseous Emissions Characteristics from a GDI Vehicle under Various Real-World Vehicle Test Modes. Energies 2020, 13, 2581. [Google Scholar] [CrossRef]
  38. Nies, H.; Beidl, C.; Hüners, H.; Fischer, K. Systematische Entwicklungsmethodik Für Eine Robuste Motorkalibrierung unter RDE-Randbedingungen; Springer: Wiesbaden, Germany, 2019; Volume 76, pp. 50–62. [Google Scholar] [CrossRef]
  39. Baumgarten, H.; Scharf, J.; Thewes, M.; Uhlmann, T.; Balazs, A.; Böhmer, M. Simulation-Based Development Methodology for Future Emission Legislation. In 37. Internationales Wiener Motorensymposium 28–29 April 2016; VDI Verlag GmbH: Düsseldorf, Germany, 2016; p. I-209. [Google Scholar]
  40. Mayr, C.; Merl, R.; Gigerl, H.-P.; Teitzer, M.; König, D.; Stemmer, D.; Retter, F. Test emissionsrelevanter Fahrzyklen auf dem Motorprüfstand. In Simulation und Test 2018; Liebl, J., Ed.; Springer Fachmedien Wiesbaden: Wiesbaden, Germany, 2019; ISBN 978-3-658-25293-9. [Google Scholar] [CrossRef]
  41. Faubel, L.; Lensch-Franzen, C.; Schuhardt, A.; Krohn, C. Übertrag von RDE-Anforderungen in eine modellbasierte Prüfstandsumgebung. MTZ Extra 2016, 21, 44–49. [Google Scholar] [CrossRef]
  42. Kondaru, M.K.; Telikepalli, K.P.; Thimmalapura, S.V.; Pandey, N.K. Generating a Real World Drive Cycle–A Statistical Approach; SAE Technical Paper Series; WCX World Congress Experience, APR. 10, 2018; SAE International 400 Commonwealth Drive: Warrendale, PA, USA, 2018. [Google Scholar] [CrossRef]
  43. Balau, A.E.; Kooijman, D.; Vazquez Rodarte, I.; Ligterink, N. Stochastic Real-World Drive Cycle Generation Based on a Two Stage Markov Chain Approach. SAE Int. J. Mater. Manf. 2015, 8, 390–397. [Google Scholar] [CrossRef]
  44. Ashtari, A.; Bibeau, E.; Shahidinejad, S. Using Large Driving Record Samples and a Stochastic Approach for Real-World Driving Cycle Construction: Winnipeg Driving Cycle. Transp. Sci. 2014, 48, 170–183. [Google Scholar] [CrossRef]
  45. Mason, A.; Roberts, P.; Whelan, S.; Kondo, Y.; Brenton, L. RDE Plus—A Road to Rig Development Methodology for Complete RDE Compliance: Road to Chassis Perspective; SAE Technical Paper Series; WCX SAE World Congress Experience, APR. 21, 2020; SAE International 400 Commonwealth Drive: Warrendale, PA, USA, 2020. [Google Scholar] [CrossRef]
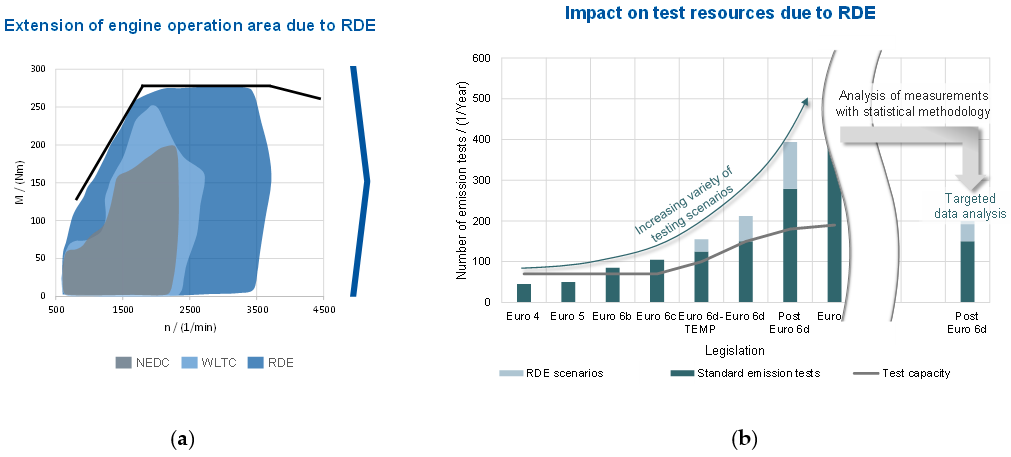
  46. Roberts, P.; Mason, A.; Whelan, S.; Tabata, K.; Kondo, Y.; Kumagai, T.; Mumby, R.; Bates, L. RDE Plus—A Road to Rig Development Methodology for Whole Vehicle RDE Compliance: Overview; SAE Technical Paper Series; WCX SAE World Congress Experience, APR. 21, 2020; SAE International 400 Commonwealth Drive: Warrendale, PA, USA, 2020. [Google Scholar] [CrossRef]
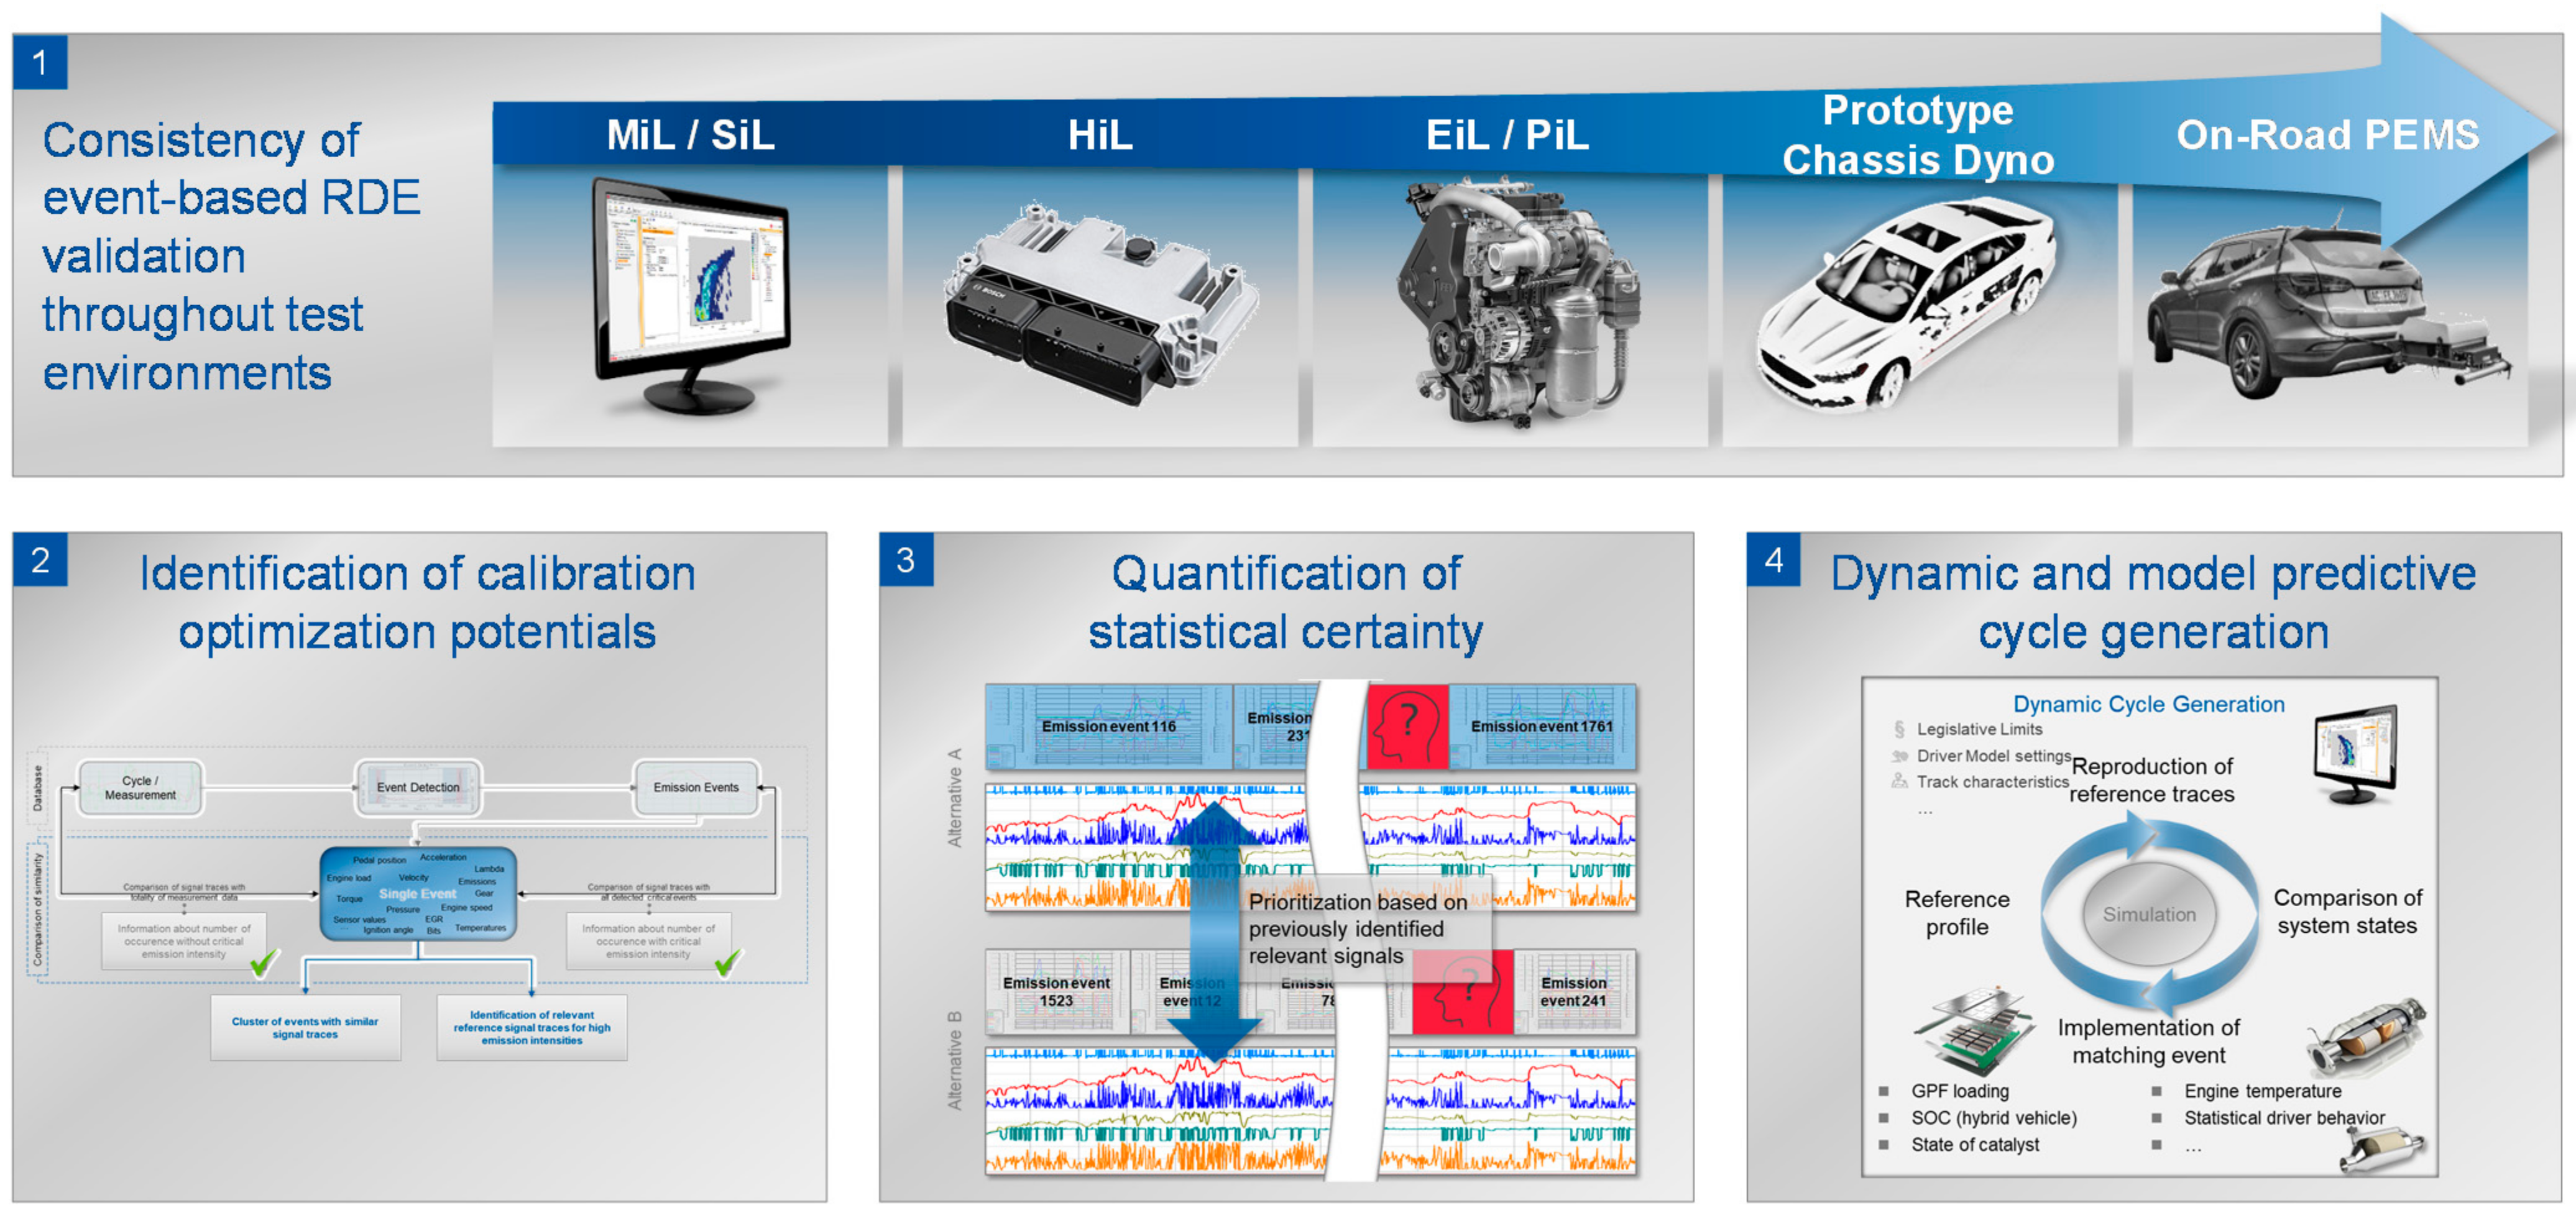
  47. Roberts, P.J.; Mumby, R.; Mason, A.; Redford-Knight, L.; Kaur, P. RDE Plus—The Development of a Road, Rig and Engine-in-the-Loop Test Methodology for Real Driving Emissions Compliance; SAE Technical Paper Series; WCX SAE World Congress Experience, APR. 09, 2019; SAE International 400 Commonwealth Drive: Warrendale, PA, USA, 2019. [Google Scholar] [CrossRef]
  48. Donateo, T.; Giovinazzi, M. Building a cycle for Real Driving Emissions. Energy Procedia 2017, 126, 891–898. [Google Scholar] [CrossRef]
  49. Morcinkowski, B.; Adomeit, P.; Mally, M.; Esposito, S.; Walter, V.; Yadla, S. Emissionsvorhersage in der Entwicklung ottomotorischer EU7-Antriebe. In Experten-Forum Powertrain: Ladungswechsel und Emissionierung 2019; Liebl, J., Ed.; Springer Fachmedien Wiesbaden: Wiesbaden, Germany, 2020; pp. 11–23. ISBN 978-3-658-28708-5. [Google Scholar] [CrossRef]
  50. Böhmer, M. Simulation Der Abgasemissionen Von Hybridfahrzeugen Für Reale Fahrbedingungen. Ph.D. Thesis, RWTH Aachen University, Aachen, Germany, 2017. [Google Scholar]
  51. Dai, Z.; Niemeier, D.; Eisinger, D. Driving Cycles: A New Cycle-Bulding Method that Better Represents Real-World Emissions. Appl. Sci. 2008, 11, 5429. [Google Scholar]
  52. Della Ragione, L.; Meccariello, G. Statistical approach to identify Naples city’s real driving cycle referring to the Worldwide harmonized Light duty Test Cycle (WLTC) framework. Sustain. Dev. Plan. VIII 2017, 210, 555–566. [Google Scholar] [CrossRef] [Green Version]
  53. Wang, L.; Ma, J.; Li, X.; Que, H. Driving Cycle Construction and Operation Characteristics of Taxi in Xi’an City. In Proceedings of the 20th COTA International Conference of Transportation Professionals, Xi’an, China, 14–16 August 2020; pp. 2622–2634. [Google Scholar] [CrossRef]
  54. Galgamuwa, U.; Perera, L.; Bandara, S. A Representative Driving Cycle for the Southern Expressway Compared to Existing Driving Cycles. Transp. in Dev. Econ. 2016, 2, 589. [Google Scholar] [CrossRef] [Green Version]
  55. Esser, A.; Zeller, M.; Foulard, S.; Rinderknecht, S. Stochastic Synthesis of Representative and Multidimensional Driving Cycles. SAE Int. J. Alt. Power. 2018, 7, 263–272. [Google Scholar] [CrossRef]
  56. Gong, Q.; Midlam-Mohler, S.; Marano, V.; Rizzoni, G. An Iterative Markov Chain Approach for Generating Vehicle Driving Cycles. SAE Int. J. Engines 2011, 4, 1035–1045. [Google Scholar] [CrossRef]
  57. Bauer, S.; Steinhaus, T.; Beidl, C.; Dietrich, M. Korrekte Abbildung des Höheneinflusses bei der Simulation von RDE-Fahrten in Prüfumgebungen, In Experten-Forum Powertrain: Simulation und Test 2020; Liebl, J., Ed.; Springer: Berlin/Heidelberg, Germany, 2021; pp. 135–148. ISBN 978-3-662-63605-3. [Google Scholar]
  58. Claßen, J.; Pischinger, S.; Krysmon, S.; Sterlepper, S.; Dorscheidt, F.; Doucet, M.; Reuber, C.; Görgen, M.; Scharf, J.; Nijs, M.; et al. Statistically supported real driving emission calibration: Using cycle generation to provide vehicle-specific and statistically representative test scenarios for Euro 7. Int. J. Engine Res. 2020, 21, 1783–1799. [Google Scholar] [CrossRef]
  59. Picerno, M.; Lee, S.-Y.; Ehrly, M.; Schaub, J.; Andert, J. Virtual Powertrain Simulation: X-in-the-Loop Methods for Concept and Software Development. In 21. Internationales Stuttgarter Symposium; Bargende, M., Reuss, H.-C., Wagner, A., Eds.; Springer Fachmedien Wiesbaden: Wiesbaden, Germany, 2021; pp. 531–545. ISBN 978-3-658-33465-9. [Google Scholar]
  60. Etzold, K.; Fahrbach, T.; Klein, S.; Scheer, R.; Guse, D.; Klawitter, M.; Pischinger, S.; Andert, J. Function Development With an Electric-Machine-in-the-Loop Setup: A Case Study. IEEE Trans. Transp. Electrif. 2019, 5, 1419–1429. [Google Scholar] [CrossRef]
  61. Guse, D.; Heusch, C.; Klein, S.; Fahrbach, T.; Andert, J.; Pischinger, S.; Tegelkamp, S.; Nijs, M.; Scharf, J. Objectified Evaluation and Classification of Passenger Vehicles Longitudinal Drivability Capabilities in Automated Load Change Drive Maneuvers at Engine-in-the-Loop Test Benches; SAE Technical Paper Series; WCX SAE World Congress Experience, APR. 21, 2020; SAE International 400 Commonwealth Drive: Warrendale, PA, USA, 2020. [Google Scholar] [CrossRef]
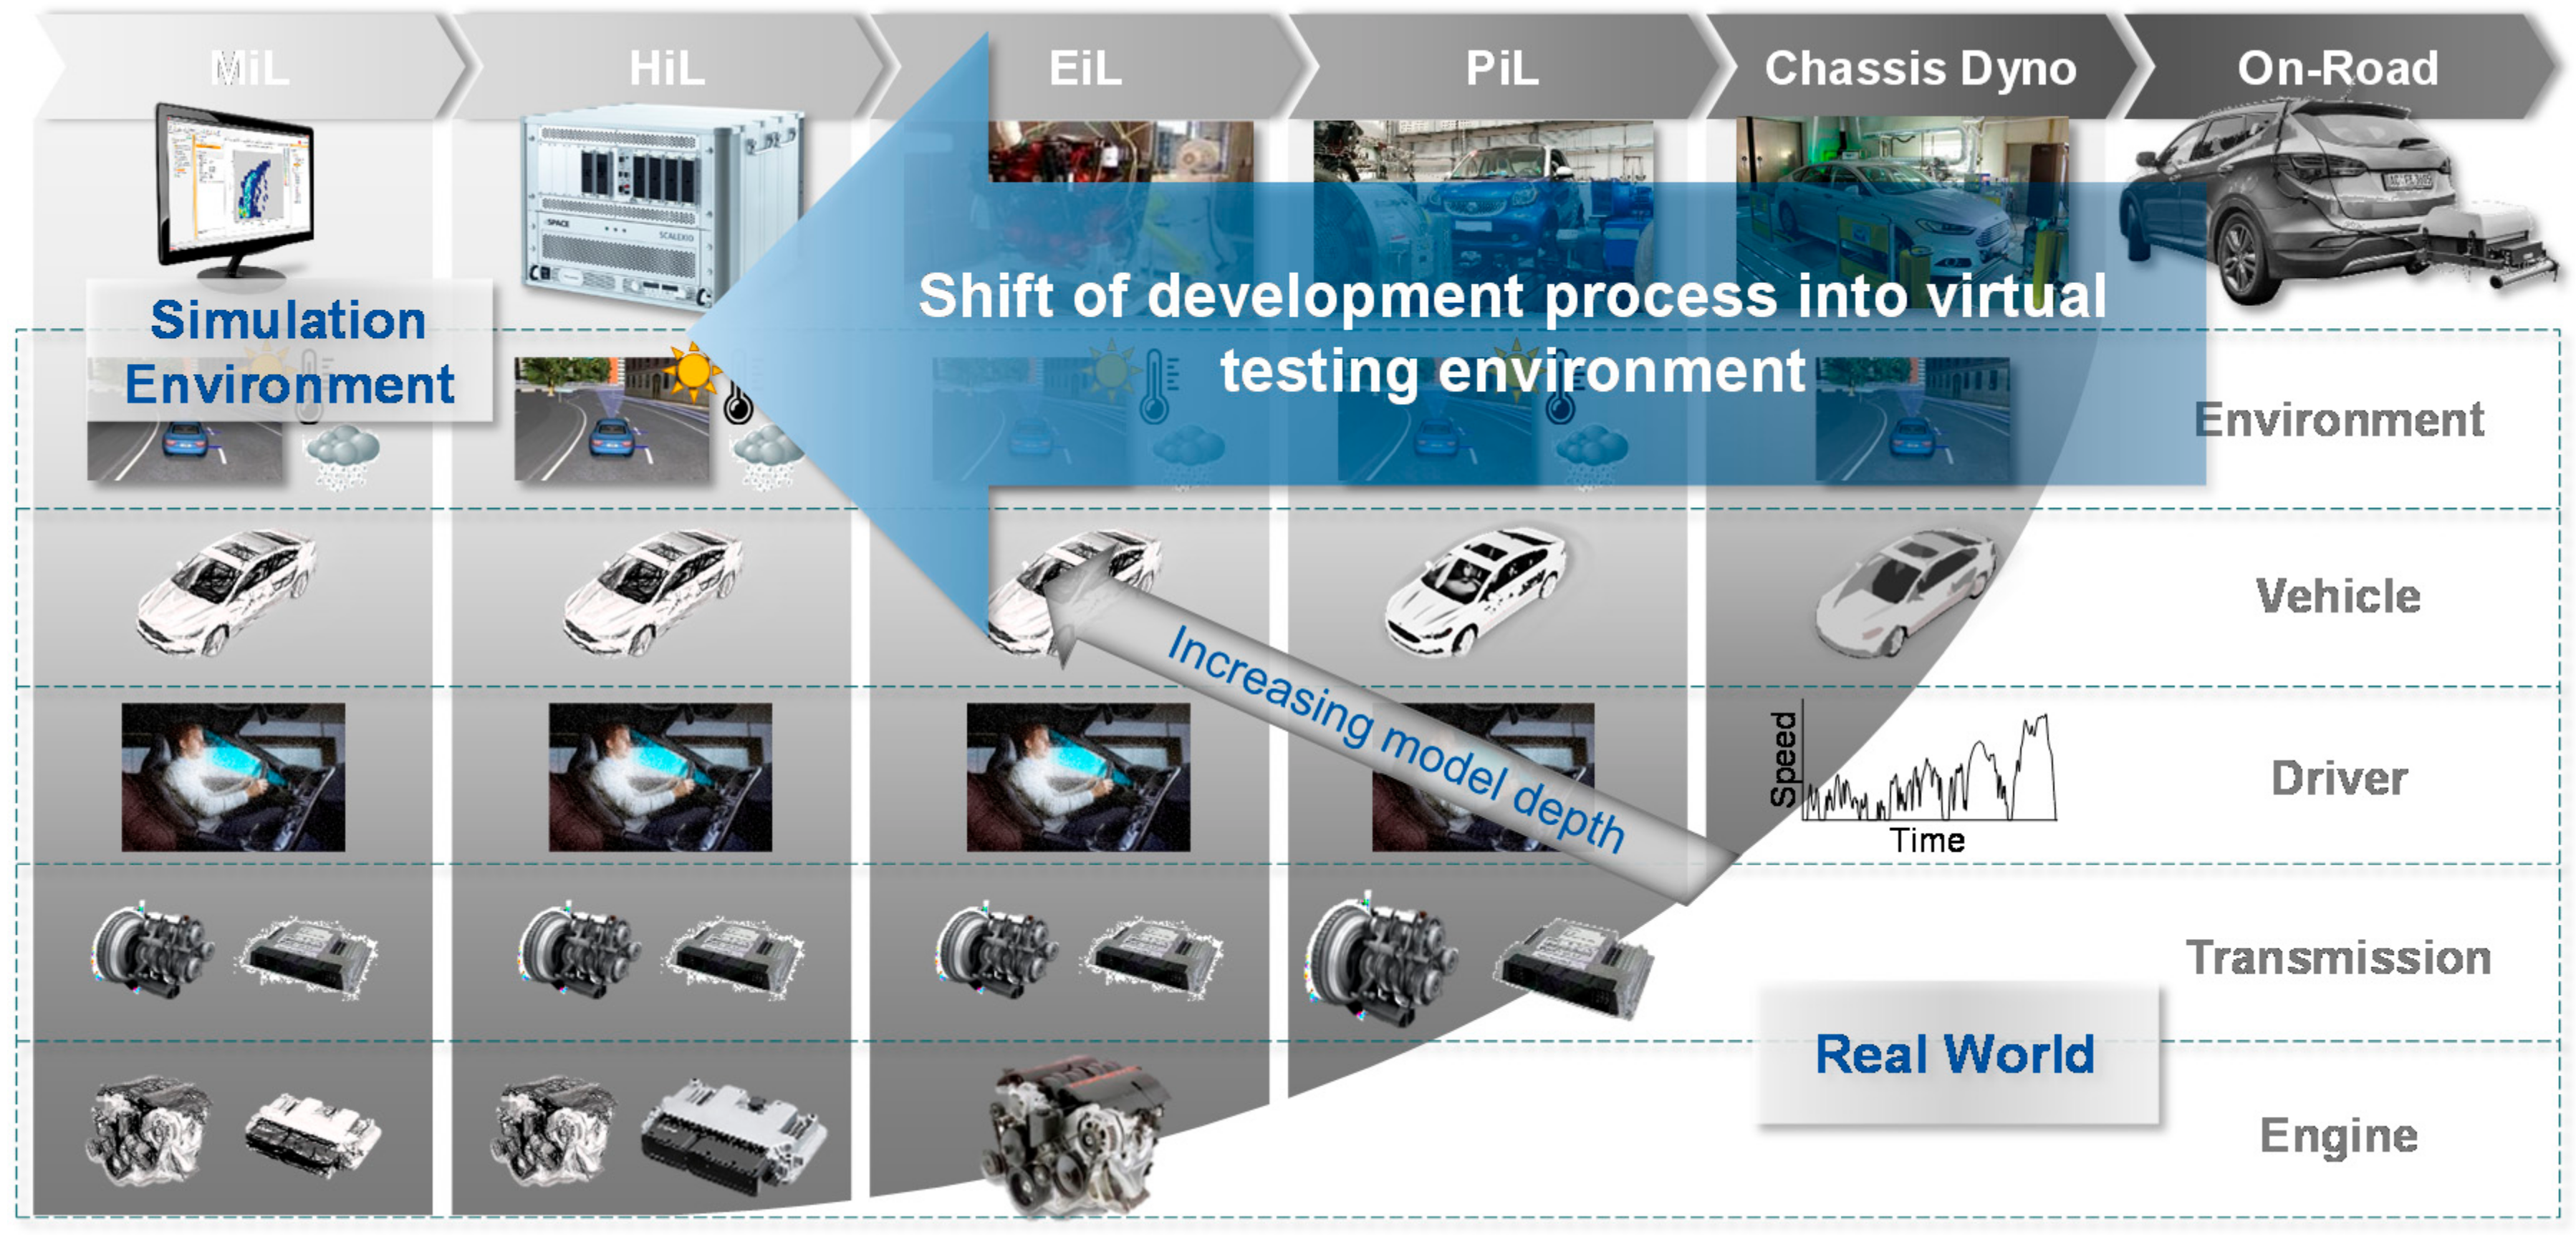
  62. Guse, D.; Heusch, C.; Pischinger, S.; Tegelkamp, S.; Schmidt, C.; Roehrich, H.; Nijs, M.; Scharf, J. Objectified Drivability Evaluation and Classification of Passenger Vehicles in Automated Longitudinal Vehicle Drive Maneuvers with Engine Load Changes; SAE Technical Paper Series; WCX SAE World Congress Experience, APR. 09, 2019; SAE International 400 Commonwealth Drive: Warrendale, PA, USA, 2019. [Google Scholar] [CrossRef]
  63. Lee, S.-Y.; Andert, J.; Neumann, D.; Querel, C.; Scheel, T.; Aktas, S.; Miccio, M.; Schaub, J.; Koetter, M.; Ehrly, M. Hardware-in-the-Loop-Based Virtual Calibration Approach to Meet Real Driving Emissions Requirements. Tech. Pap. 2018, 11, 1479–1504. [Google Scholar] [CrossRef]
  64. Dorscheidt, F.; Düzgün, M.; Claßen, J.; Krysmon, S.; Pischinger, S.; Görgen, M.; Dönitz, C.; Nijs, M. Hardware-in-the-Loop Based Virtual Emission Calibration for a Gasoline Engine. SAE Tech. Pap. 2021. [Google Scholar] [CrossRef]
  65. Liu, H.; Li, C.; Tao, T.; He, S.; Feng, X.; Li, Q.; Li, W. PN Emission Measurements and Real-Driving-Emissions (RDE) Simulation on China 6 Light-Duty Gasoline Vehicles; SAE Technical Paper Series; SAE WCX Digital Summit, APR. 13, 2021; SAE International 400 Commonwealth Drive: Warrendale, PA, USA, 2021. [Google Scholar] [CrossRef]
  66. Guse, D.; Klein, S.; Andert, J.; Pischinger, S.; Scharf, J.; Nijs, M.; Wellers, R.; Zhang, Y. Virtual Transmission Evaluation Using an Engine-in-the-Loop Test Facility. SAE Int. 2018. [Google Scholar] [CrossRef]
  67. Kulikov, I.; Korkin, S.; Kozlov, A.; Terenchenko, A.; Karpukhin, K.; Azimov, U. Component-in-the-Loop Testing of Automotive Powertrains Featuring All-Wheel-Drive. Energies 2021, 14, 2017. [Google Scholar] [CrossRef]
  68. Khadilkar, S.V.; Kulkarni, H.H.; Gupta, V. Engine Testing In Dyno Close Loop Simulation Environment. TURCOMAT 2021, 12, 3507–3515. [Google Scholar]
  69. Brunelli, L.; Capancioni, A.; Gonnella, P.; Casadio, R.; Brusa, A.; Cavina, N.; Caggiano, M. A Hybrid Vehicle Hardware-in-the-Loop System with Integrated Connectivity for Ehorizon Functions Validation. IEEE Trans. Veh. Technol. 2021, 70, 4340–4352. [Google Scholar] [CrossRef]
  70. Gottorf, S.; Fryjan, J.; Leyens, L.; Picerno, M.; Habermann, K.; Pischinger, S. Lean Approach for Virtual Calibration Using Hardware-in-the-Loop and Electronic Control Unit (ECU)-Capable Engine Simulation. SAE Int. J. Engines 2021, 14. [Google Scholar] [CrossRef]
  71. Mirzaeian, M.; Langridge, S. Creating a Virtual Test Bed Using a Dynamic Engine Model with Integrated Controls to Support in-the-Loop Hardware and Software Optimization and Calibration. Energies 2021, 14, 652. [Google Scholar] [CrossRef]
  72. Lenz, M.; Fahrbach, T.; Guse, D.; Pischinger, S. Echtzeitvernetzte Komponentenprüfstände für zukunftsweisende Antriebsstränge. MTZ Extra 2020, 25, 42–47. [Google Scholar] [CrossRef]
  73. Jeong, Y.-S.; Jeong, M.K.; Omitaomu, O.A. Weighted dynamic time warping for time series classification. Pattern Recognit. 2011, 44, 2231–2240. [Google Scholar] [CrossRef]
  74. McInnes, L.; Healy, J.; Astels, S. hdbscan: Hierarchical density based clustering. JOSS 2017, 2, 205. [Google Scholar] [CrossRef]
  75. Petitjean, F.; Ketterlin, A.; Gançarski, P. A global averaging method for dynamic time warping, with applications to clustering. Pattern Recognit. 2011, 44, 678–693. [Google Scholar] [CrossRef]
  76. Meyer, N.; Walter, S.; Guse, D.; Klein, S. Vehicle-Comparative Calibration—Crucial factors for efficient in-the-Loop operation of dynamic engine test benches. In Proceedings of the 4th International FEV Conference Diesel Powertrains 3.0, Aachen, Germany, 3–4 July 2018. [Google Scholar]
  77. Klein, S.; Savelsberg, R.; Xia, F.; Guse, D.; Andert, J.; Blochwitz, T.; Bellanger, C.; Walter, S.; Beringer, S.; Jochheim, J.; et al. Engine in the Loop: Closed Loop Test Bench Control with Real-Time Simulation. SAE Int. J. Commer. Veh. 2017, 10, 95–105. [Google Scholar] [CrossRef]
  78. Xia, F.; Dorscheidt, F.; Lücke, S.; Andert, J.; Gardini, P.; Scheel, T.; Walter, V.; Tharmakulasingam, R.; Kansagara, J.; Böhmer, M.; et al. Experimental Proof-of-Concept of HiL Based Virtual Calibration for a Gasoline Engine with a Three-Way-Catalyst. JSAE/SAE Powertrains Fuels Lubr. 2019. [Google Scholar] [CrossRef]
  79. Etzold, K.; Scheer, R.; Fahrbach, T.; Zhou, S.; Goldbeck, R.; Guse, D.; Frie, F.; Sauer, D.U.; de Doncker, R.W.; Andert, J. Hardware-in-the-Loop Testing of Electric Traction Drives with an Efficiency Optimized DC-DC Converter Control; SAE Technical Paper Series; WCX SAE World Congress Experience, APR. 21, 2020; SAE International 400 Commonwealth Drive: Warrendale, PA, USA, 2020. [Google Scholar] [CrossRef]
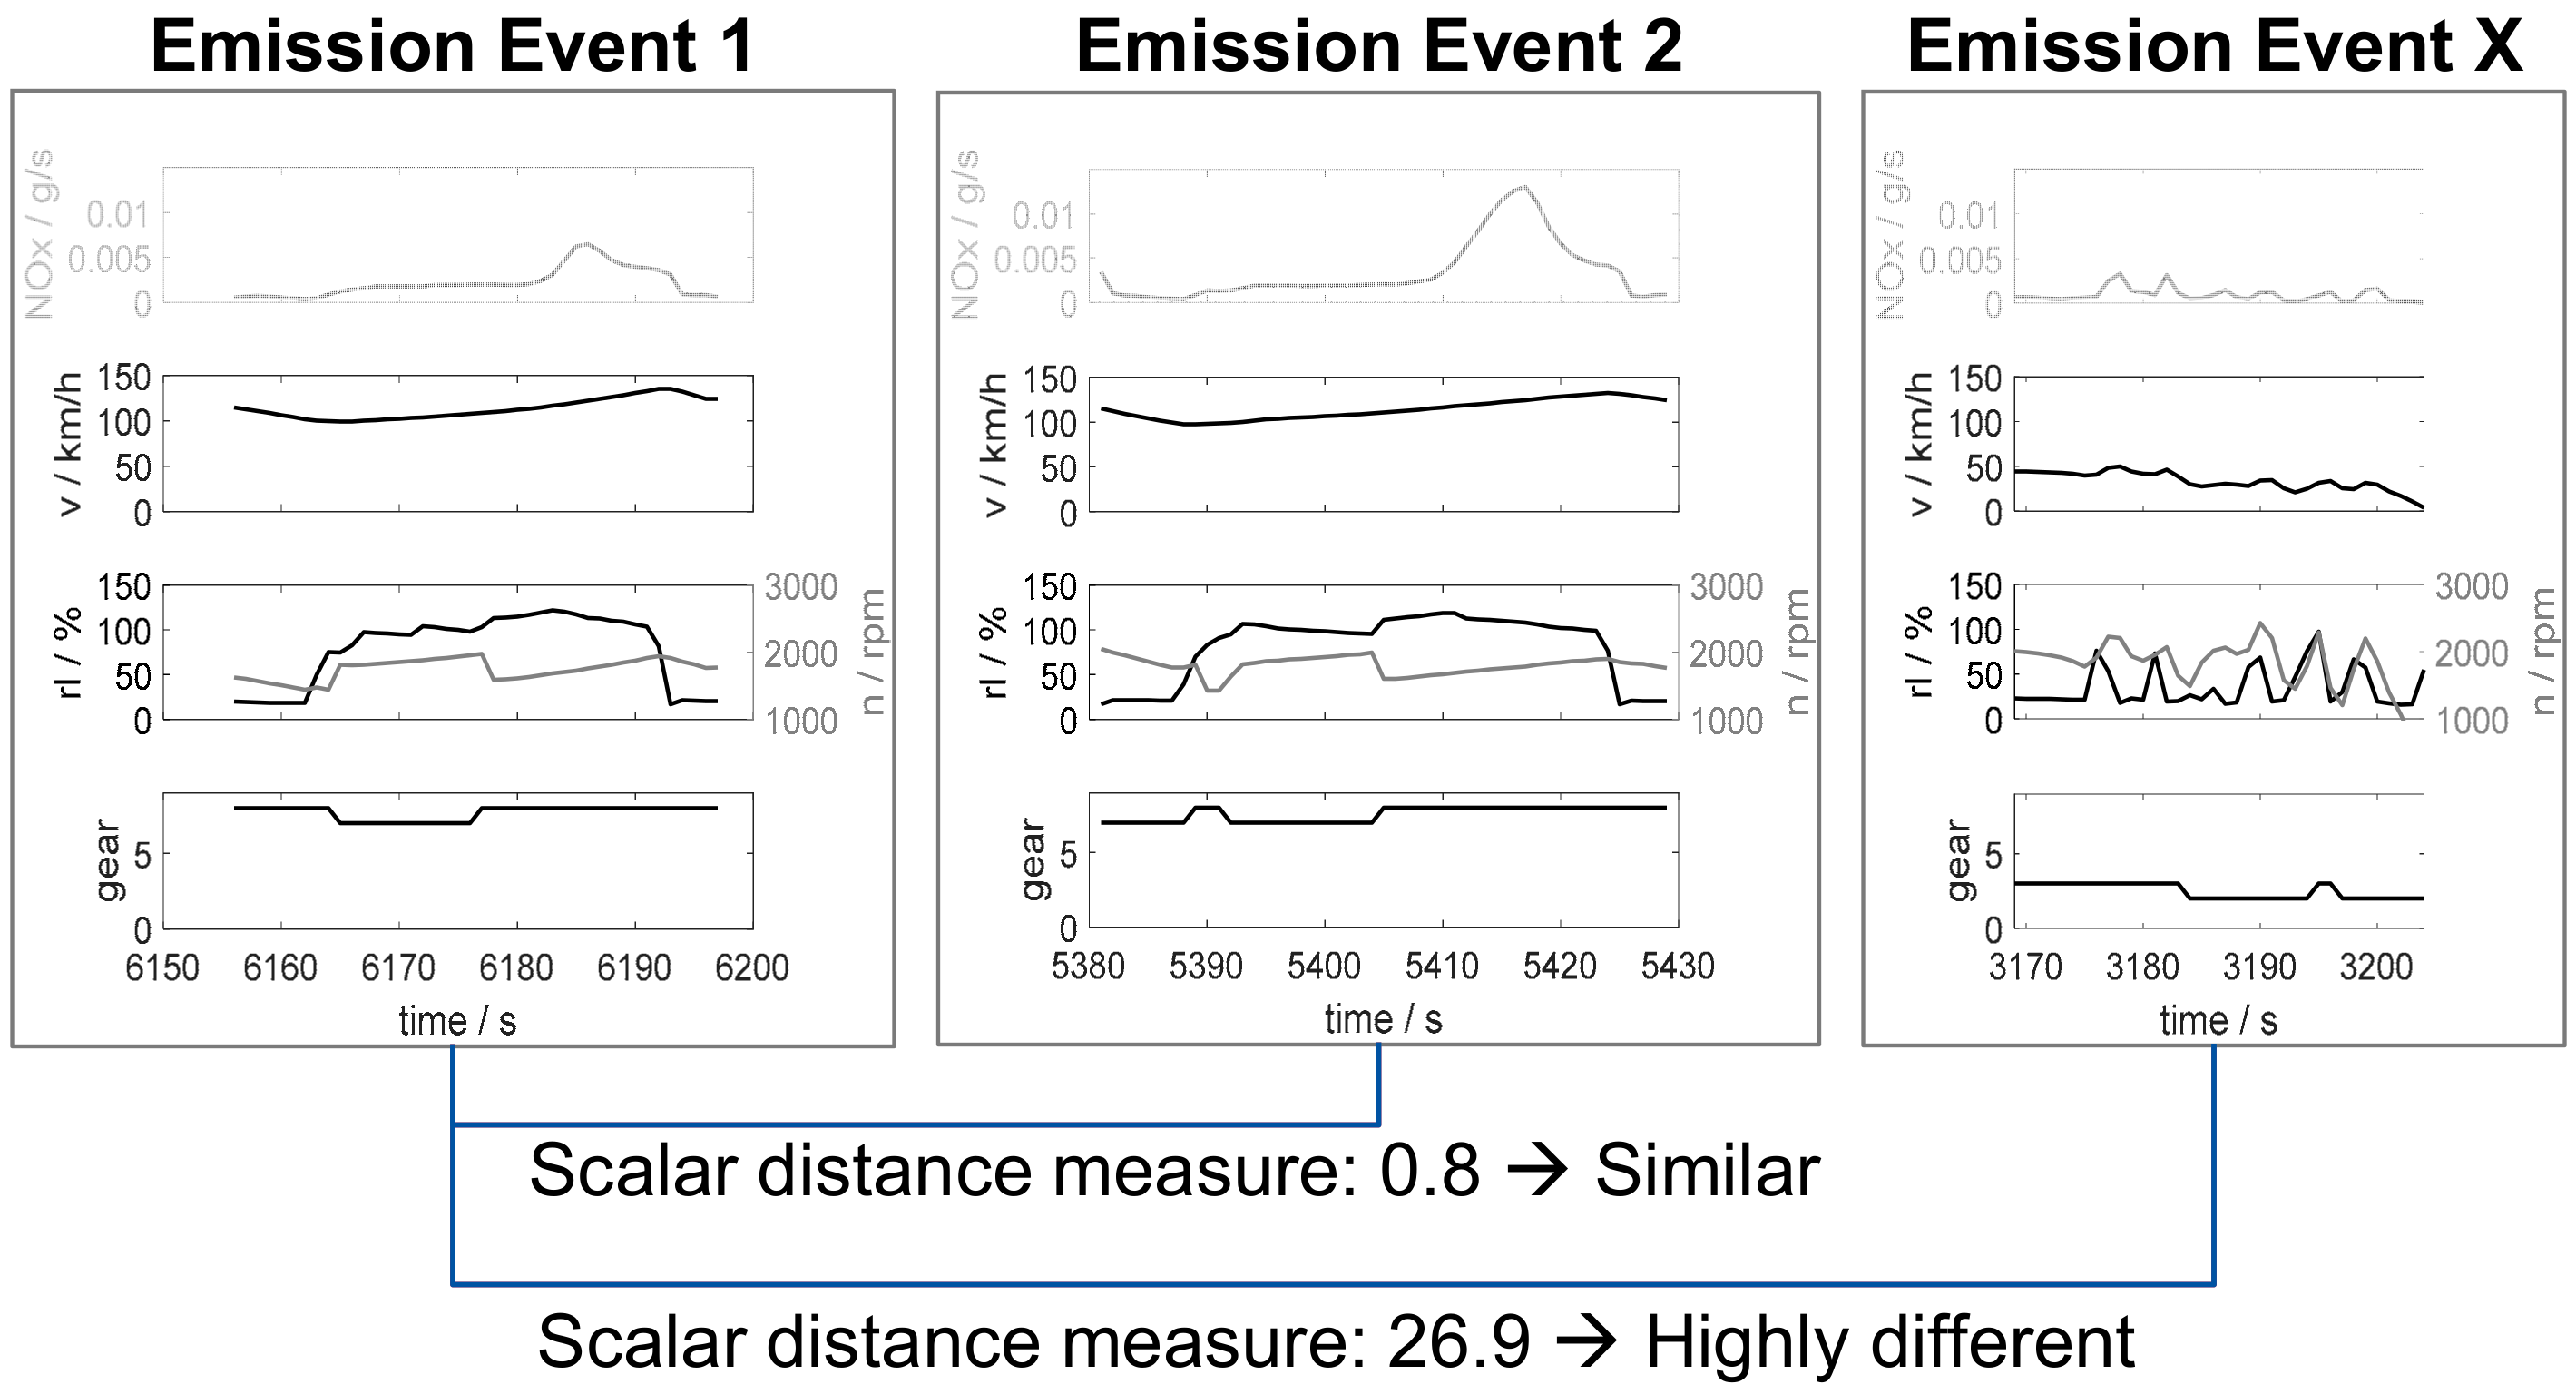
Figure 1. (a) Comparison of operating point ranges used in NEDC, WLTC and representative RDE test; (b) Impact on required testing capacity of different European emission legislation levels.
Energies 14 04747 g001
Figure 2. Criteria for the conception of the novel methodology for virtual calibration.
Energies 14 04747 g002
Figure 3. Overview of test beds and their degree of virtualization used for a holistic calibration and validation approach.
Energies 14 04747 g003
Figure 4. Comparing different events using a dynamic time warping approach with selected reference signals to calculate a scalar distance measure.
Energies 14 04747 g004
Figure 5. Schematical procedure for identification of critical signal patterns.
Energies 14 04747 g005
Figure 6. Automated analysis of database measurements for support of calibration optimizations.
Energies 14 04747 g006
Figure 7. Extract of cluster identified for the downstream lambda sensor voltage for 842 NOX events.
Energies 14 04747 g007
Figure 8. Extract of identified clusters for the downstream lambda sensor voltage for 842 NOX non-events.
Energies 14 04747 g008
Figure 9. Schematic procedure for quantification of statistical data certainty and identification of missing measurements.
Energies 14 04747 g009
Figure 10. Example of SOC sensitivity in simulated maneuver testing with different initial SOC states.
Energies 14 04747 g010
Figure 11. Procedure of dynamic and model predictive cycle generation.
Energies 14 04747 g011
Figure 12. Comparison of SOC deviation for randomly placed events and SOC ordered events.
Energies 14 04747 g012
Figure 13. Concept for calibration and validation on multiple test bench environments.
Energies 14 04747 g013
Figure 14. HiL test bench setup for virtual calibration.
Energies 14 04747 g014
Figure 15. Comparison of real and HiL modeled NEDC emission traces.
Energies 14 04747 g015
Figure 16. Impact of different calibration strategies for catalyst purging on a HiL test bed.
Energies 14 04747 g016
Figure 17. Impact of different calibration strategies and validation of simulation accuracy.
Energies 14 04747 g017
Table 1. Specifications of vehicle used for simulation in MiL environment.
General DataICEElectric MachineBattery
1600 kg1.5 L turbocharged200 Nm5.3 Ah/1.4 kWh
P2 topology4 cylinder gasoline30 kW270 V
6 speed AT177 Nm/94 kWRated = max. values30–70% opt. range
Table 2. Specification of simulated vehicle in the HiL environment.
General DataICEEATS
>1500 kg1.5 L turbochargedTWC
Front wheel drive4 cylinder gasoline
8 speed AT300 Nm/>150 kW
Publisher’s Note: MDPI stays neutral with regard to jurisdictional claims in published maps and institutional affiliations.