Article

Optimal Charging Schedule Planning for Electric Buses Using Aggregated Day-Ahead Auction Bids

1
The Institute of Control and Computation Engineering, Warsaw University of Technology, 00-665 Warszawa, Poland
2
New Grid Solution, Austin, TX 78731, USA
*
Author to whom correspondence should be addressed.
Energies 2021, 14(16), 4727; https://doi.org/10.3390/en14164727
Submission received: 29 June 2021 / Revised: 23 July 2021 / Accepted: 29 July 2021 / Published: 4 August 2021

Abstract

:
This study aims to plan a cost-minimizing charging schedule for electric buses with fast charging stations. The paper conceptualizes the problem as a three-stage procedure, which is oriented around the participation of an electric bus aggregator in a day-ahead energy auction. First, the aggregation stage determines the bid parameters of buses. With bid parameters, aggregated cost-minimizing charging plans are obtained in the second stage conceived as the hourly day-ahead auction. The disaggregation of hourly plans into feasible minutely charging schedules is the third stage. The main contribution is the formulation of mixed-integer linear programming aggregation models to determine charging availability expressed as minimum and maximum hourly energy requirements taking into account detailed, minutely characteristics and constraints of the charging equipment and the buses. No price forecasts are required, and the plans adjust to the wholesale prices of energy. Defining only a few aggregated bids parameters used in linear programming constraints and incorporating them into the auction model is another contributing factor of this paper, allowing the scheduling of storage-based participants economically. The proposed methodology has been verified on a recently published case study of a real-world bus service operated on the Ohio State University campus. We show that the auction-based charging of all 22 buses outperforms as-soon-as-possible schedules by 7% to even 28% of daily cost savings. Thanks to the aggregated bids, buses can flexibly shift charges between high- and low-price periods while preserving constraints of the charging equipment and timetables.

Graphical Abstract

1. Introduction

According to the plans for the electrification of public transport around the world, we are facing a profound change toward electric bus adoption [1]. One of the foremost anticipated challenges related to this growth is in the design and planning of the electric bus charging system [2]. It is crucial to identify the possibilities for cost savings as the incremental charging loads will inevitably impact the power system [3] especially regarding coal-fired generation costs [4]. Among others, active demand-side participation enabled by bus aggregators can create an opportunity for mutual benefits, both for transport entities and the power system [5]. However, it is a challenging issue, as, on the one hand, the constraints of bus timetables and charging infrastructure must be handled, and on the other hand charging flexibility must be transformed into bids that can be traded in the electricity auction [6].

1.1. The Purpose, Objectives, and Hypothesis of Research

Cost-minimizing charging schedule planning of buses with fast charging stations is a valuable area for investigations. Simultaneously, looking for ways to include energy storage-based demands in the market design is another important research topic. This study aims to develop new models that address both challenges and can be formulated as standard mathematical programming optimization problems. The following hypotheses are at the basis of this research:
  • It is possible to define minutely requirements and constraints of the charging equipment and individual buses at the aggregate level in such a way that taking them into account in an hourly model allows obtaining the feasible disaggregated charging schedules.
  • The hourly charging model can be incorporated into the auction-clearing problem, extending the standard formulation with new bidding parameters adopted for storage-based participants.
These hypotheses summarize themselves into a postulate that the day-ahead auction may serve as a mechanism to schedule the charging plans of buses economically.

1.2. Literature Review

There is already some research in the areas of optimal charging schedules for electric buses (EB). The premise behind this research problem is that the current charging schedule for an EB fleet is based on the assumption that there is an ample charging capacity available for an EB fleet and the changing values of electric charging (electricity). This type of traditional charging can lead to expensive costs and misses the opportunity for cost savings. The negative impact of uncoordinated charging was clearly demonstrated by Muratori [7]. In place of this traditional but costly charging scheme, the optimal charging scheme based on the electricity cost or market prices can create opportunities for saving for the fleet dispatcher. The electricity cost considered in those studies can be electricity rates determined by the local electric utility or the electricity market operators’ electricity prices.
One of the earlier works by De Filippo et al. [8] developed a simulation model to examine how electric bus charging strategies are affected by the type and number of chargers installed. A strict idle charging time was not assumed; instead, the study investigated queuing times to determine the fleet requirements. Thus, the study finds out that all 22 of the buses on the campus lines can be made electric and that one 500 kW or two 250 kW chargers are sufficient to maintain reasonable service frequencies. The simulation is very well documented, so we used their parameters in our case study.
Several works, such as Kontou et al. [9], Moradipari et al. [10], Chen et al. [11,12], Raab et al. [13], Qin et al. [14] have been done on the optimal charging schedules for electric buses to reduce the charging costs or emissions. For example, in Moradipari et al. [10] work a mixed-integer linear programming problem was formulated to find the optimal charging schedule for the EB fleet of Stanford University’s Marguerite Shuttle, based on the electricity rates set by the local utility (PG&E) and given the preset physical infrastructure and timetables for the EB fleet. The authors also assume free on-site solar energy that the fleet dispatcher uses to charge/recharge the EB and is the first choice when solar energy is available. If solar energy is not available, the fleet dispatcher will purchase electricity from the grid as the second choice. Although the new charging schedule, which optimizes the EB fleet schedule, can save money for the fleet dispatch, given the electricity rates from the local utility, it is not logical to assume that the on-site solar energy is free. This assumption misses the solar energy opportunity cost, which can obtain revenue if its energy is sold to the grid.
Chen et al. [11] attempted to solve the problem of optimal charging strategies based on the formulation of mixed-integer linear programming for a plug-in electric bus (PEB) to reduce the charging costs and peak load of the electric bus fast charging station (EBFCS) when responding to the time-of-use electricity prices in real time. The authors claimed that the suboptimal charging strategy improves computation efficiency significantly with a slight increase in charging cost. The suboptimal charging strategy is solved as a two-stage model where an ideal charging load profile is optimized without considering the continuous charging at the first stage while the continuous charging loads are scheduled to follow the ideal profile using a heuristic method. The case study employed in their work is the bus transit system in Beijing in the backdrop of the time-of-use (TOU) prices for the relevant charging station.
The same set of authors in [12] extended their previous work by modeling and pairing an energy storage system (ESS) with the existing plug-in electric bus fleet charging stations (PEBFCS) with the same goals of reducing both peak-charging load and electricity purchase cost when providing a real-time control strategy. Two scenarios—coordinated PEB charging and uncoordinated PEB charging—are studied while the price and the valuable life of ESS, the capacity charge of PEBFCS, and electricity price arbitrage are taken into account in the model. In their previous work, a similar heuristics-based method was used to obtain a suboptimal charging strategy that can enhance computation efficiency while compromising the optimal solution. The case study employed in their work is the bus transit system and TOU prices in Chongqing, China.
Raab et al. [13] formulated a dispatch cost minimization problem for a virtual power plant while incorporating an electric bus fleet as a storage resource with their capacity and energy constraints in a market setting. The optimal charging strategies for the electric bus fleet were implemented as the mixed-integer linear programming problem. The optimized dispatched schedules are provided to the forecasted day-ahead and intraday market prices. The electric bus fleet is represented by an EV supplier/aggregator interacting with the virtual power plant operator interacting with the market operator. The schedule for the electric bus fleet was based on the bus operation in Berlin metropolitan area, where three bus types—standard, articular, and double-decker buses—were considered in that work. The authors claimed that their proposed methodology could fully integrate electric bus fleets in the virtual power plant operation while providing economic benefits to both the EV aggregator and power plant operator.
Qin et al. [14] conducted a research work that identified and investigated the optimal charging strategy of an EB fleet from the StarMetro bus fleet in Tallahassee, Florida, intending to reduce demand charge and minimize the fuel cost (aka electricity cost). The authors employed an energy consumption model which provided flexibility to simulate different EB modules. An exhaustive enumeration method covering the full range of charging threshold (CT) of 0–95% was used to search for the optimal CT. The authors found that the CT of 60–64% provided the most cost-saving while the CT of 0–28% produced the highest demand, hence the highest demand and highest fuel costs. The authors also investigated and found that fleets of 4 and 12 buses achieve the lowest cost per mile driven when one fast charger is installed.
Those studies on optimal charging schedules for EB transit systems directly relate to transit management of electric buses. In this regard, the survey work done by Deng et al. [15] provides an excellent reference on electric buses, energy storage, power management, and charging scheduling. Indeed, this research topic on electric buses or electric vehicles, particularly for public transportation or used for public transit systems, cuts across the two important disciplines—the energy system and transportation field. In this regard, many of those works are strong in one area but not in the other.
Another crucial area that requires a mention in the context of our paper is the organization of charging planning. All relevant works consider decentralized, self-planned operation under flat rates or the perfect foresight of TOU prices to the best of our knowledge. This can be a reasonable assumption, as early investigations of [16] suggest. However, there is a considerable improvement area, especially when deciding whether to postpone charging in a specific hour, which can be very sensitive to prices, as shown in our case study. Instead of trying to adjust to uncertain energy prices, one of the possibilities, as recently put forward by Mays [17] is to allow full, bid-based participation of energy storage-based demands in the wholesale markets. The inclusion of new market participants leads to the introduction of a rich parameterization of the market and the definition of bidding parameters adopted for new participation models, as suggested, for instance, in the FERC Order No. 841 [18]. Despite the widely recognized needs, mechanisms suited to storage-based participants remain relatively unrepresented [19]. One of the first attempts is [20] where a new bidding mechanism, which uses the so-called Price Elasticity Matrices, is proposed. Another exciting proposition extended the bidding format with numerous parameters that accounted for three new types of demand characteristics, namely shiftable, adjustable, and arbitrage [21].

1.3. Contribution

We believe that no other papers have investigated the optimal charging schedule of buses with restricted access to fast charging stations from the market-based perspective of bus fleet aggregator.
The process analyzed in this paper is summarized in Figure 1: individual bus and charging stations parameters, specifically buses timetables, idle time and per-cycle energy use, battery capacities and efficiency, number of chargers, and charging efficiency, serve as a basis in the aggregation phase; the resulting aggregated bid parameters are submitted to the market operator a day before the operation; the detailed operating plan is computed in the final, disaggregation phase when an aggregated dispatch plan is received from the market operator.
Based on the above discussion, the main contributions of the paper are summarized as follows:
  • We formulate new mixed-integer linear programming aggregation models regarding the detailed, minutely characteristics and constraints of the charging equipment and the buses. They determine charging availability expressed as minimum and maximum hourly energy requirements.
  • We propose only a few aggregated bids parameters that lead to incorporating linear variables and constraints into the standard auction model. The extended auction model determines aggregated hourly charging plan.
  • We formulate the new mixed-integer linear programming disaggregation model linking the auction-based hourly plan and the detailed charging characteristics.
  • We demonstrate that the bus fleet can be economically scheduled with an auction-clearing model with suitable bid parameters.

2. Materials and Methods

All the nomenclature is provided in the Abbreviations list at the end of the paper.

2.1. Aggregation Model

We propose the aggregation of periods (minutes) and buses to let the buses aggregator participate in the day-ahead energy auction and flexibly adjust to uncertain hourly market prices.
Individual parameters regarding demanded trip energy can be summarized:
E h Agg , Trip = b E b h bus , Trip = b t = ( h 1 ) · 60 + 1 h · 60 E b t Trip , h .
Furthermore, the total energy E 1 that must be loaded by buses is equal to the total amount of energy needed for trips, minus the initial energy stored in batteries:
E 1 = h E h Agg , Trip b ( SoC b 0 SoC ̲ b ) .
On the other hand, the total battery capacity provides the value of additional energy E 2 that can be loaded by buses:
E 2 = b ( SoC ¯ b SoC ̲ b ) .
In adverse market conditions expressed in high energy prices, the buses would charge only the minimum amount of energy required for driving, and at the end of the day, they would return to the depot with depleted batteries. However, they may as well finish their service with full batteries if the prices are low enough. The threshold price the aggregator decides is denoted as c, one reasonable level may be the average nightly price. Charging during the night hours is not a problem. First, because the buses are fully available, second, the prices level and volatility are much lower than prices during the day.
We assume a deterministic trip energy usage E b t Trip while many factors affecting the driving conditions may exist, as recently investigated by Gao et al. [22]. This limitation of our study can be relieved relatively easily using a certain safety margin. The procedure is justified in Gao et al. research.
Setting other parameters is a challenging problem because there are two dependencies between periods and the buses. One linking constraint valid for each minute and links the buses is the number of charging stations available. Another linking constraint connects each period, so the SoC level of each bus sustains within the admissible limits. The solution strategy for dealing with the charging constraints when we determine aggregated charging demand is to resolve the aggregated minimum and maximum energy requirements separately, but considering the detailed constraints.
In the following two sections, we discuss these aspects and show how we use them to form the aggregated parameters that can be submitted directly to the auction.

2.1.1. Minimum Hourly SoC Level

To find the minimum SoC level of the buses at the end of each hour, we consider a hypothetical situation where buses charge as frequently as possible to keep the charge level as low as possible. With this goal in mind and unlimited access to chargers, buses would load just enough energy to make the next trip. However, when chargers are limited, we need to solve the following MILP optimization problem.
min h SoC h Agg , min ,
SoC h Agg , min = b SoC b h min h ,
p b t s b t · r b , t ,
s b t A b t b , t ,
b s b t C t ,
SoC b t = SoC b , t 1 + p b t E b t Trip b , h , t ,
SoC b t SoC ¯ b b , t ,
SoC b t SoC ̲ b b , t ,
SoC b h min = SoC b , h · 60 b , h .
The goal is to determine minimum hourly SoC levels (4), defined as the summary minimum hourly SoC levels of each bus (5). Detailed SoC level of each bus SoC b t is inspected in typical constraints (6)–(11), while we are particularly interested in SoC level at the end of each hour (12).

2.1.2. Maximum Hourly Energy Requirements

The solution to the problem (4)–(12) provides reference values to further determine maximum amount of energy P h Agg , max that can be possibly loaded in each hour. When considering maximum amounts of energy, we should not be restricted to the total maximum demanded energy E 1 + E 2 . Instead, we need to determine potential maximum amounts of energy in particular hours. That is why we must solve each hour’s problem separately but consider some multiperiod characteristics, such as the requirement on minimum SoC level at the beginning of each hour. Thus, the following model considers the SoC level of each bus separately in each hour, but charging energy has multiperiod limits.
max P h Agg , max ,
p h Agg , max = b t = ( h 1 ) · 60 + 1 h · 60 s b t · r h ,
s b t A b t b , t ,
b s b t C t ,
k = 1 i b s b k · r k = 1 i b E b k Trip + SoC ¯ b SoC b 0 b , i b ,
k = 1 i b s b k · r k = 1 i b δ E b k Trip + E b cycle SoC b 0 + SoC ̲ b b , i b ,
SoC b t = SoC b , t 1 + s b t · r E b t Trip b , h , t = ( ( h 1 ) · 60 + 2 , , h · 60 ) ,
SoC b t SoC ¯ b b , t ,
SoC b t SoC ̲ b b , t ,
SoC b , h · 60 + 1 SoC b h min b , h < H .
The goal is to determine aggregated maximum amounts of energy that can be loaded in a particular hour h (13), which is simply equal to all charging statuses of buses in all minutes belonging to a given hour (14). Charging statuses may not violate bus timetables (15), nor summary chargers number (16), just as in (7) and (8). New constraints introduced into this model (17)–(19) are responsible for ensuring that despite the SoC level at the beginning of each hour being independent of the SoC level at the end of the previous hour (19), charging is still limited by the total amount of energy used so far plus the initial free battery capacity (17). On the other hand, all the charged energy till the end of the specific idle period must cover all the trip energy used so far plus energy demanded in another cycle minus the initially stored energy (18). Detailed SoC level of each bus must be within acceptable limits (20) and (21). Starting SoC level is independent of ending SoC level in the previous hour but must be at least equal to the minimum hourly SoC level (22).

2.2. Auction Model

The energy auction we consider is a single-price and double-sided auction that balances supply and demand in a 24-h horizon of the next day. The independent market operator collects demand bids and offers from all auction participants, solves the auction-clearing problem, and posts day-ahead hourly dispatch and prices.
Bidding parameters allowed in the auction provide clear, quantitative boundaries to the buses’ energy storage capabilities and operating limits. Specifically, they state the total energy E 1 requested by buses, plus an additional amount of energy E 2 that can be potentially loaded by buses when the auction price of energy is below the price c of their bid to buy. To enable the control of aggregated states of charge, summary hourly trip energy of buses E h Agg , Trip is reported, together with aggregated hourly minimum battery State of Charge SoC h Agg , min . Final parameter is the aggregated maximum amount of energy P h Agg , max that can be loaded in each hour.
For clarity, we present the auction model considering a single bus aggregator; however, there may be multiple participants of this type. In such a case, the aggregator-specific index should also be considered when defining the bidding parameters. Assuming several aggregators are indexed with index ‘a’ then bidding parameters used in the auction model would be: c a , E a 1 , E a 2 , E a h Agg , Trip , P a h Agg , max , SoC a h Agg , min .
Thanks to including the aggregated bus parameters, the auction can economically schedule the hourly charged energy based on the aggregated states of charge of the buses. This leads to the auction model of pool type, where power scheduling is conducted by the operator aiming at social welfare maximization. The model can be formulated as a price-based unit commitment problem, with generators’ technical constraints, etc. Moreover, the network power flow constraints can also be included. Detailed, centralized auction model may be found, for example, in [23]. Here, we concentrate on the newly introduced constraints of demands representing (aggregated) storage-based participants.
max Q = c · ( h p h Agg E 1 ) h Cost ( NetSupply h ) .
Subject to:
p h Agg = NetSupply h h , π h ,
h p h Agg E 1 + E 2 ,
p h Agg P h Agg , max + SoC h Agg , min SoC h 1 Agg h > 1 ,
p 1 Agg P 1 Agg , max ,
SoC h Agg = SoC h 1 Agg + p h Agg E h Agg , Trip h ,
SoC h Agg SoC h Agg , min h ,
NetSupply   constr .
Transmission   constr .
The social welfare Q defined as the difference between consumption willingness-to-pay and the generation offered costs is maximized in the auction objective (23). Equilibrium prices, also known as marginal prices derived as the shadow prices to the energy balance constraint (24) are used to settle the trading energy volumes in each hour. In (25), we limit the total energy bought by buses while (26) preserves hourly limit. Recall that aggregated maximum amount P h Agg , max is determined considering the minimum SoC level, as explained in Section 2.1.2. This value must be decreased with a higher actual SoC SoC h 1 Agg at the end of previous hour. In (28), the standard linear SoC update is modeled, using aggregated values. Aggregated SoC must not drop below the acceptable limit, as given by (29). Finally, (30) symbolically represents all the constraints of other market participants (generators, loads, etc.), including representation of costs Cost ( NetSupply h ) . Similarly, (31) represents network constraints. Notice that the variables and constraints representing (aggregated) storage-based participants, which are newly introduced with our proposed approach, are linear (LP).

2.3. Disaggregation Model
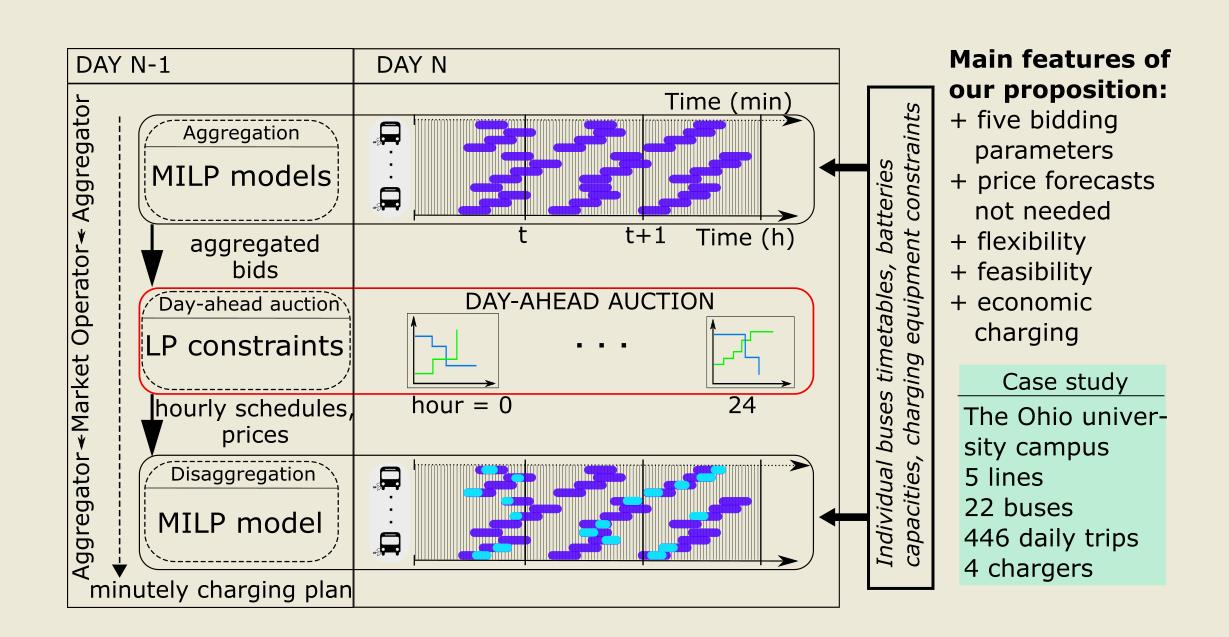
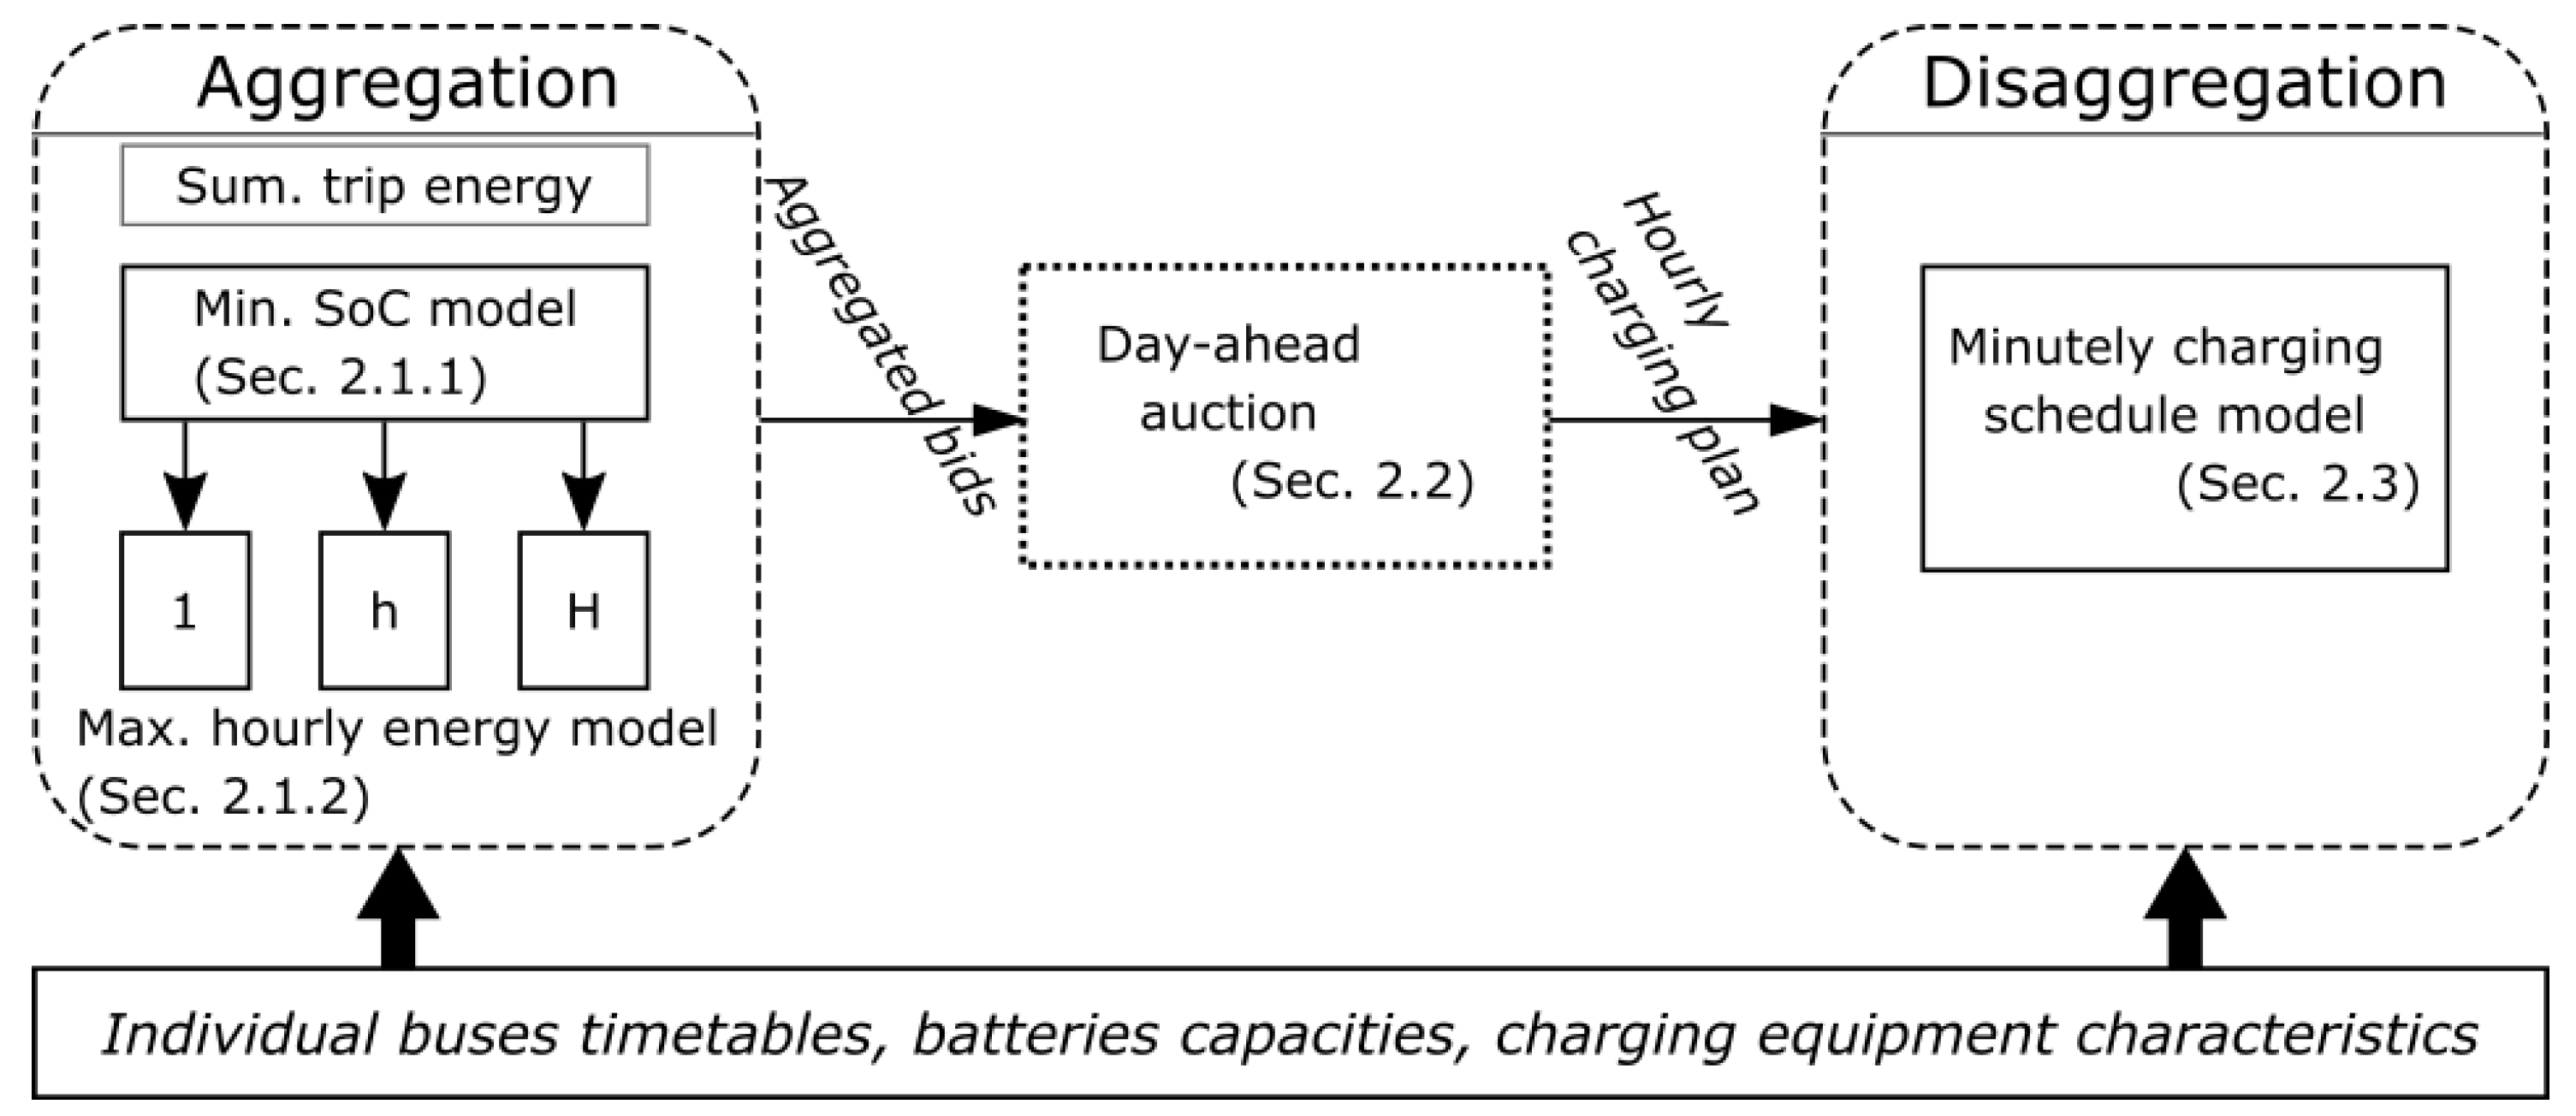
Once the bus fleet aggregator receives from the market operator the planned hourly energy schedules p h Agg , the final step is to determine detailed, minutely charging plans. The disaggregation model uses the same individual bus and charging station parameters as aggregation models developed in Section 2.1.1 and Section 2.1.2. Here, it finds the feasible solution that considers the characteristics and constraints of the charging equipment and the buses and the amount of available energy in each hour. Specifically, the following constraints must be met.
p h Agg = t = ( h 1 ) · 60 + 1 h · 60 b p b t h ,
p b t s b t · r b , t ,
s b t A b t b , t ,
b s b t C t ,
SoC b t = SoC b , t 1 + p b t E b t Trip b , t ,
SoC b t SoC ¯ b b , t ,
SoC b t SoC ̲ b b , t .
In (32), we ensure that all energy bought on the market is charged by buses every hour. Constraints (33)–(38) represent standard characteristics of the charging equipment and the individual buses. Model is of MILP type because of binary charging state variables s b t . It is a simple, standard model; the main novelty is in the fact that any auction-based solution can be safely disaggregated, thanks to the use of proper aggregation models introduced in Section 2.1.1 and Section 2.1.2.

2.4. Summary

To summarizing, dependencies between the models introduced in this paper are visualized in Figure 2. The most challenging phase is developing MILP aggregation models: they consist of a multiperiod model determining minimum aggregated SoC level at the end of each hour, complemented by models setting the maximum amounts of energy that can be loaded solved separately for each hour. For the record, in this phase, total demanded energy is computed, which is simply the sum of the individual trip energy demands. The resulting aggregated parameters constitute bids submitted to the market operator. Hourly charging plan is finally provided to bus fleet aggregator after auction clears, where it is disaggregated into feasible charging instructions using a typical MILP model based on buses states of charge. Aggregation phase may be performed once in a longer horizon, because its results do not depend on changing market environment. Disaggregation, on the other hand, should be executed daily, each time an auction clears.

3. Results

We show the applicability of our methodology on a bus network serving the Ohio State University’s main campus located in Columbus, as first described by De Filippo et al. [8].

3.1. Data

The system consists of six lines of varying cycle time and energy consumption. Additionally, the lines are operating with different frequencies, so they use different numbers of buses. All the details are listed in Table 1, repeated after [8].
Altogether 22 buses are sharing four fast charging stations at the same depot. Each bus has a 55 kWh battery with a capacity of 41.25 kWh (acceptable SoC range from 20% to 95%) while the charging rate of each station is 250 kW with a 5% efficiency loss. Available charging time for each bus is assumed 5 min, which means that they could charge up to 19.7 kWh during idle time.
The first bus begins service on each line at 7:00 a.m. Subsequent buses run with corresponding line frequencies until 7:00 p.m. Buses operate 446 trips in total and use 4762.48 kWh during 12 h (720 min). They begin service with a fully charged (i.e., 95% SoC) battery. Figure 3 visualizes A b t indicating if bus b is available for charging in minute t.
Values of the parameters are summarized in Table 2.
We compare our results to a typical recharging strategy, i.e., charging as soon as possible (Asap rule) and refilling batteries to maximum SoC during each idle time, as illustrated in Figure 4. Acting like this causes several problems: first, queues may arise because the number of buses would exceed the number of chargers; second, high energy costs may arise because of charging during peak hours. The first problem with Asap charging is shown in Figure 5.
We computed a feasible Asap charging plan to all constraints and used it as a benchmark to the cost efficacy of our newly proposed approach. The charging energy of the Asap plan aggregated into hourly values is shown in Figure 6, together with summary hourly trip energy. The charging stations limitations are visible when investigating the first hour—there are about 30 min available for charging after buses finish their first cycle tour, then they accumulate, as can be inspected in Figure 5.

3.2. Results of the Proposed Approach

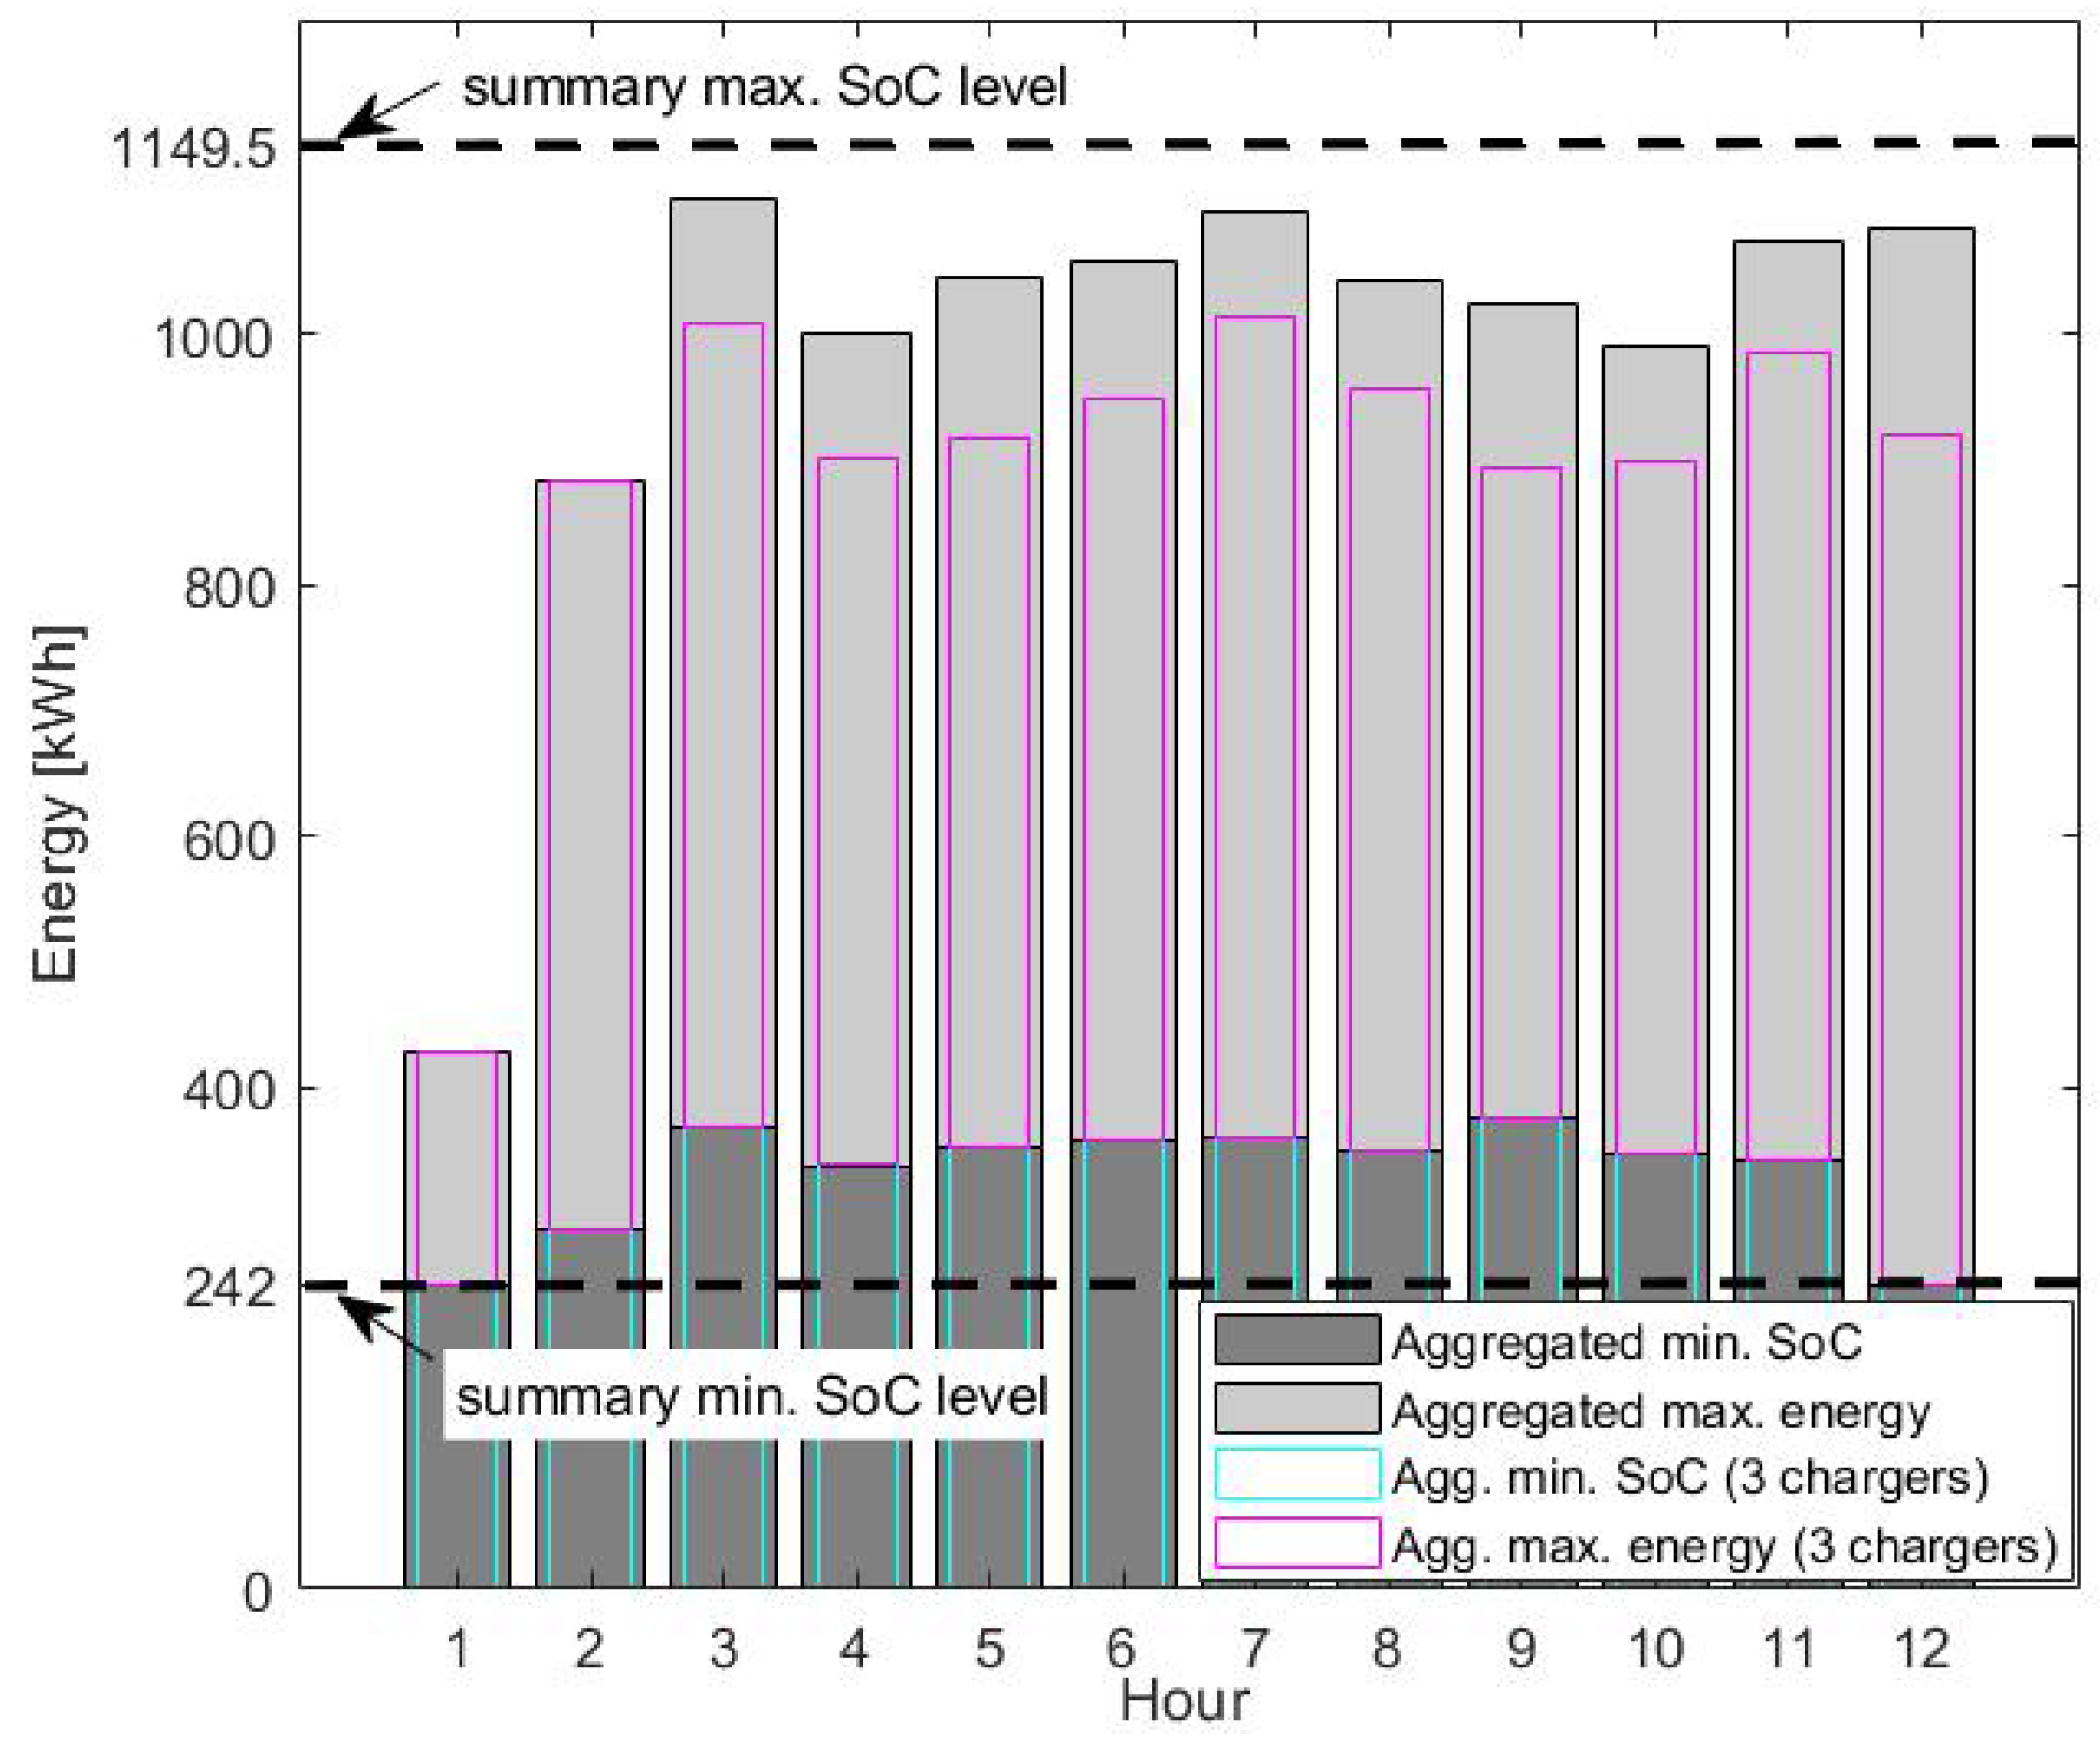
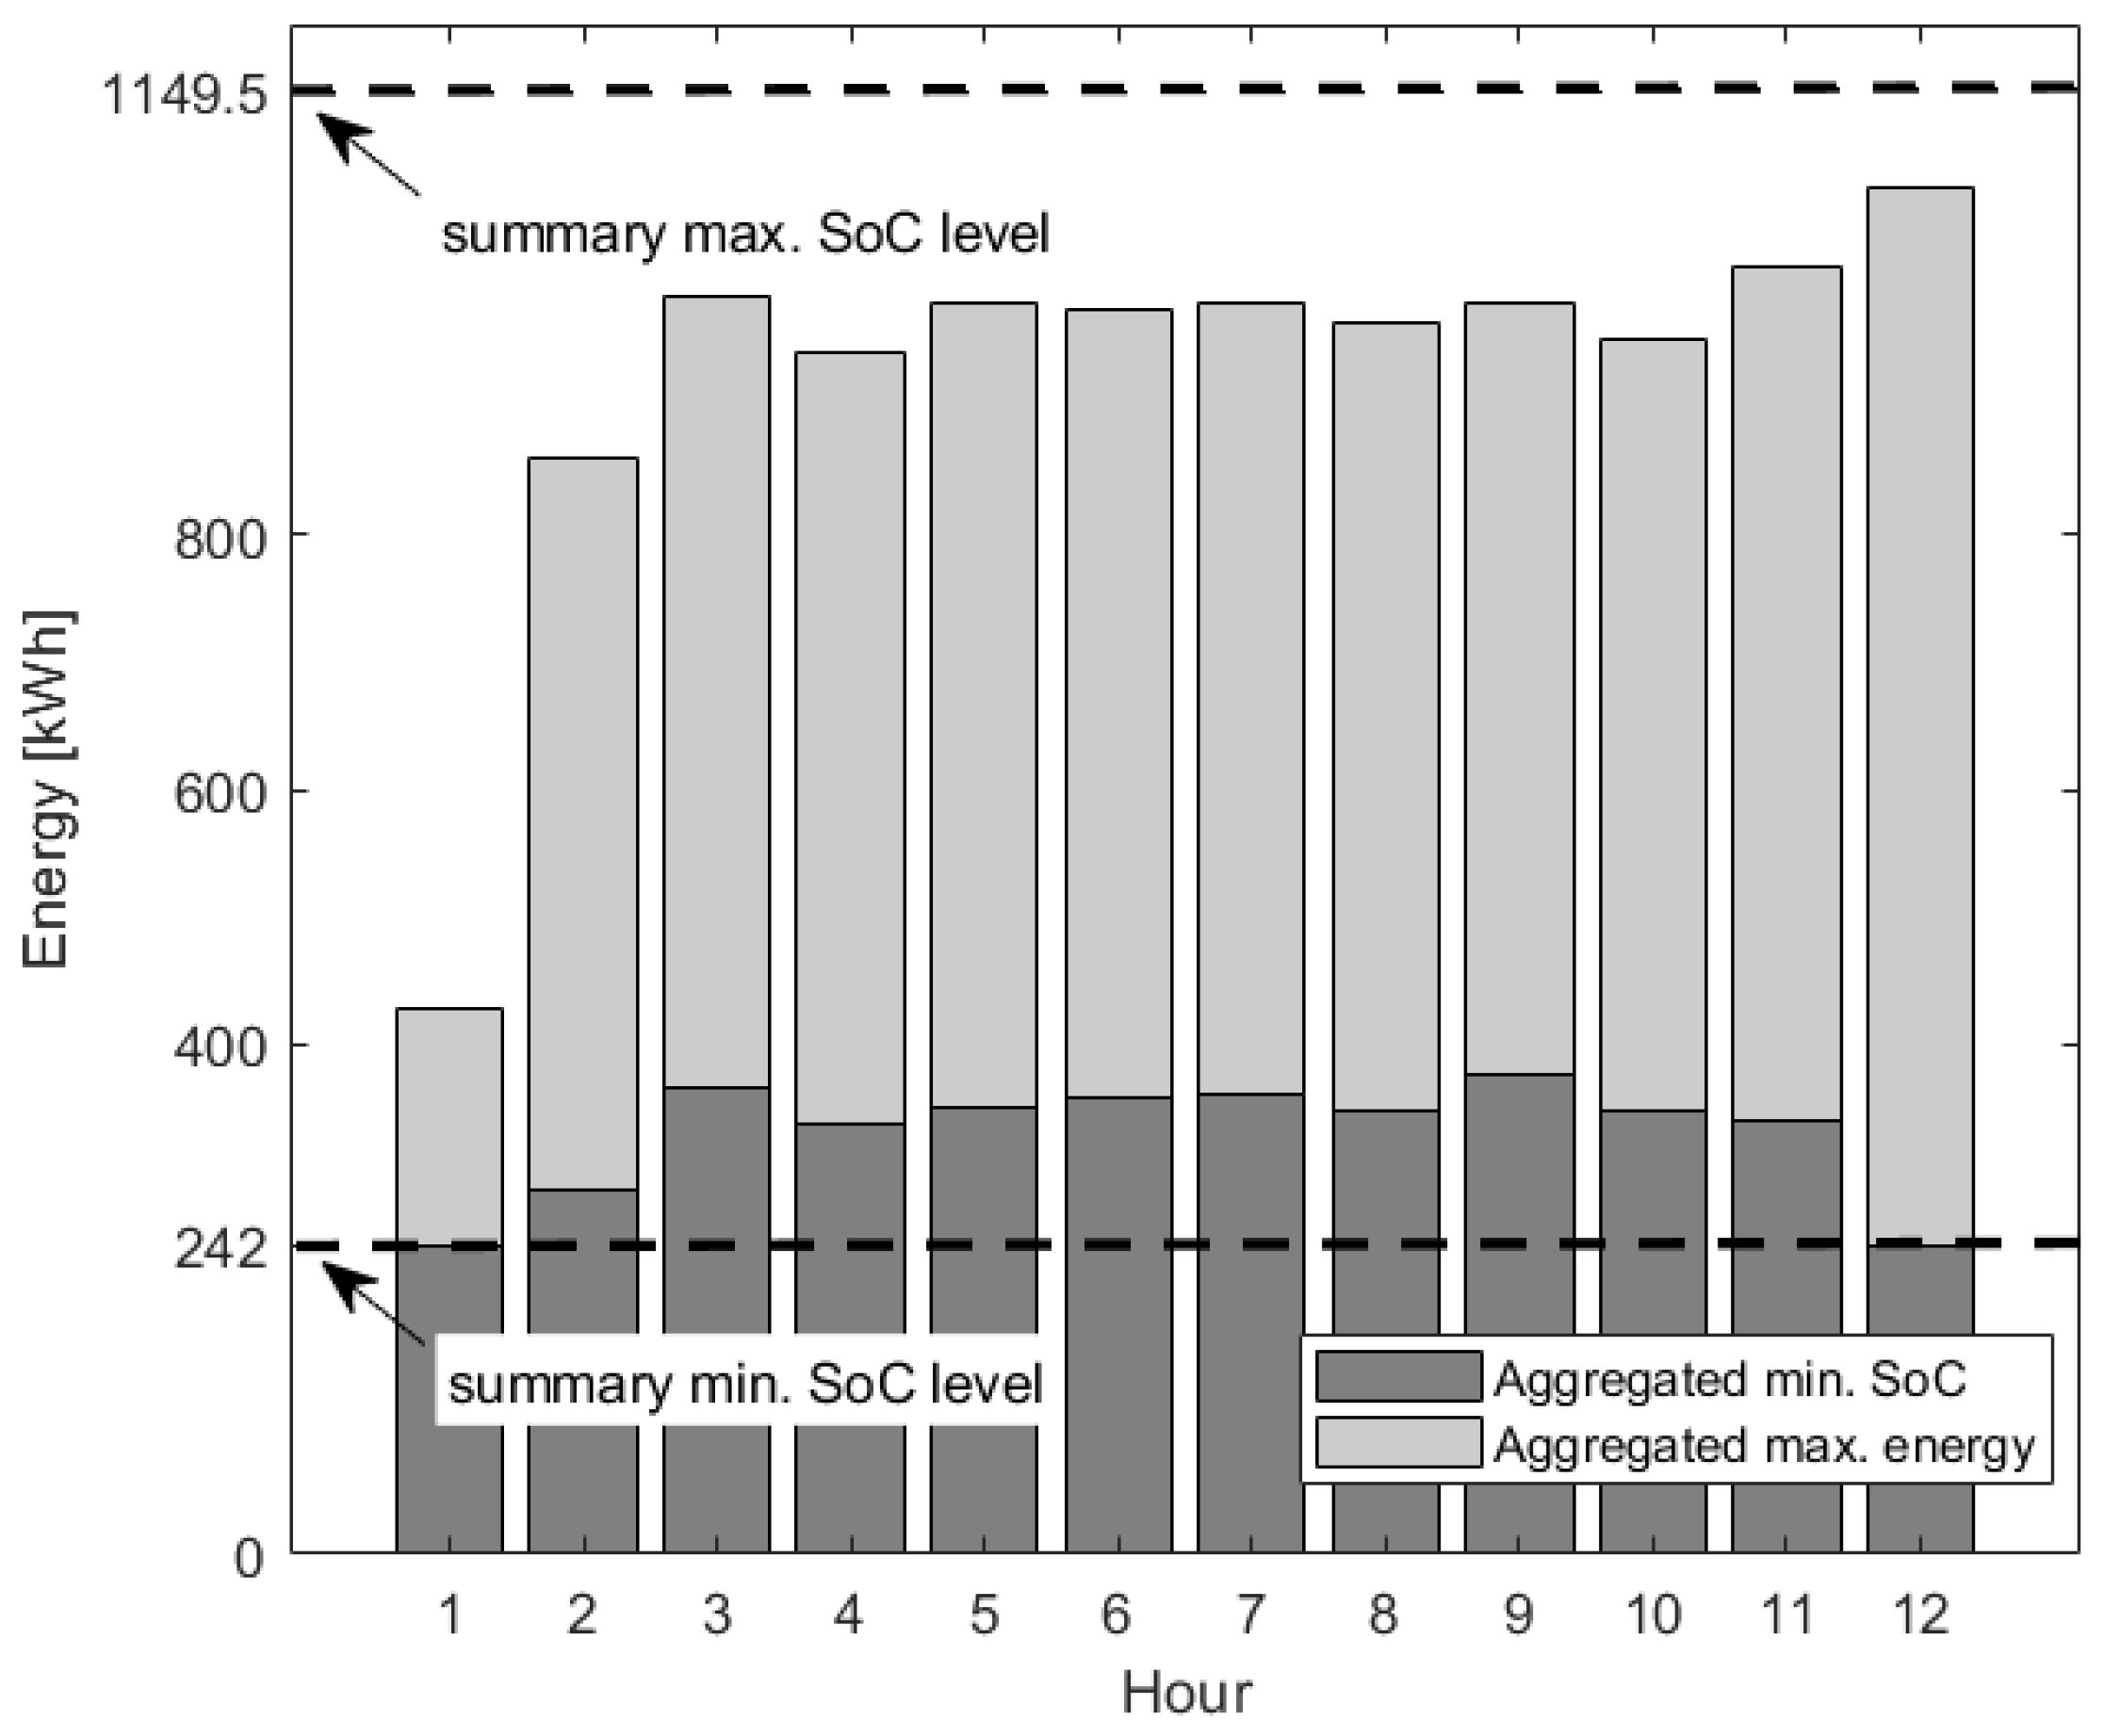
3.2.1. Aggregation Results

In this section, we describe results obtained using models from Section 2.1. The total energy E 1 that must be loaded by buses, equal to the total amount of energy needed for trips, minus the initial energy stored in batteries, is given in Table 2, where also the value of additional loadable energy E 2 is provided. For the record, we also show summary hourly trip energy E h Agg , Trip in Figure 6.
Applying the method described in Section 2.1 we first determine the minimum aggregated SoC level at the end of each hour. Results are shown in Figure 7. Notice that aggregated minimum SoC values SoC h Agg , min exceed the simple summary minimum SoC level of batteries ( 22 × 11 = 242 kWh) in every hour but first and last. In the first hour, batteries are full, so the minimum level will not be reached after all. It is safe to end trips with the minimum SoC level in the last hour as no other trips will be made.
Figure 7 also shows the result of determining maximum aggregated energy to load by solving in each hour the model provided in Section 2.1.2. Interestingly, the total capacity of batteries may never be reached when starting from the minimum SoC level within a specific hour.
Detailed values of the computed parameters are summarized in Table 3. These aggregated parameters constitute aggregated bid submitted to the market operator.

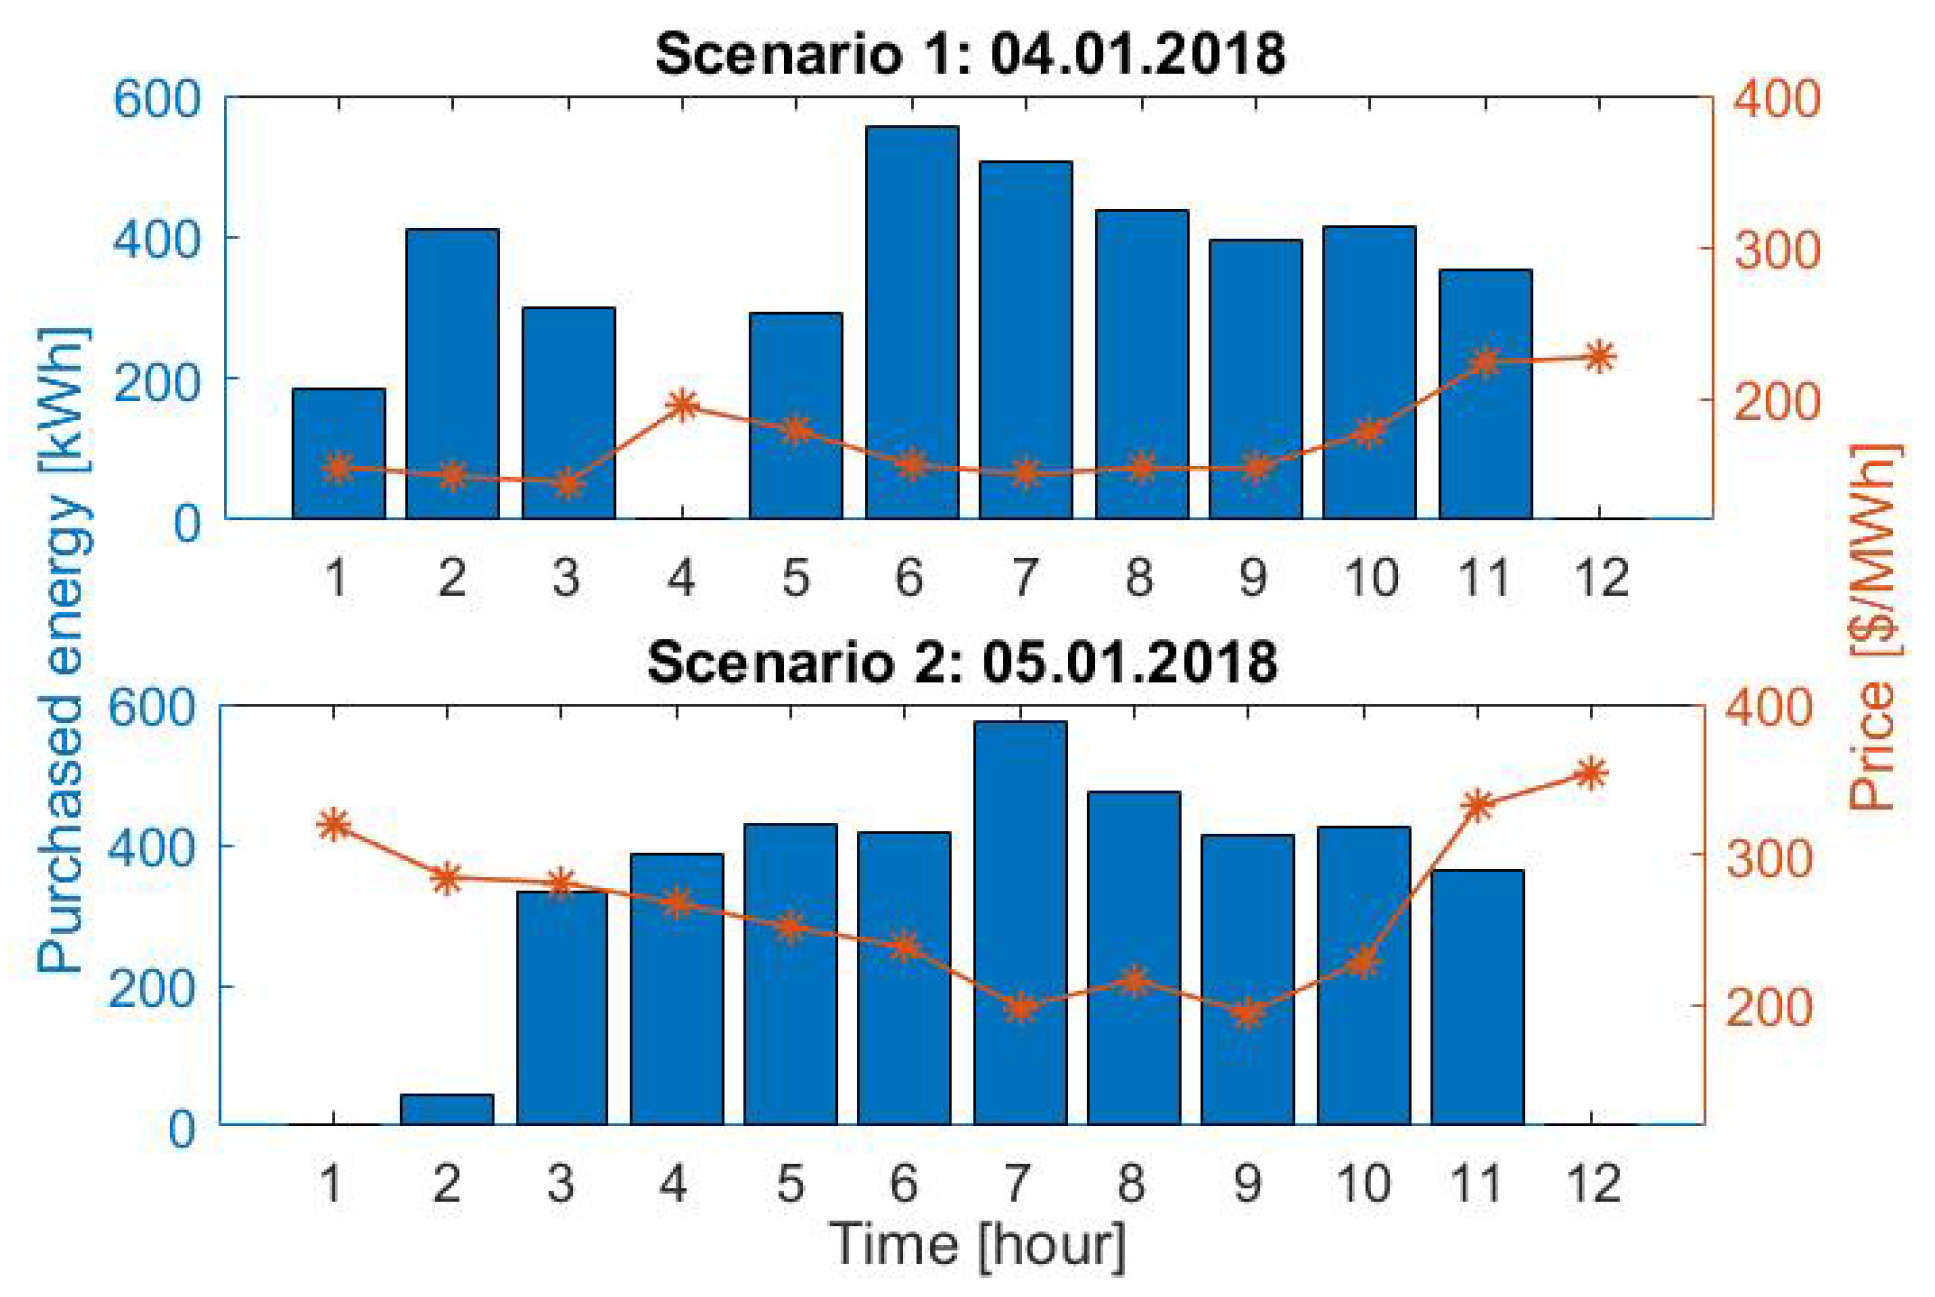
3.2.2. Auction Results

Depending on the market situation, different hourly schedules and prices can be obtained, but buses are guaranteed to receive at least the minimum required energy and be scheduled for charging during hours with the lowest prices. The auction model was solved, assuming net supply costs reflected in marginal energy price from PJM market [24]. Such an assumption is justified under a price-taking feature of the bus fleet, which is small enough that its charges do not affect the price of electricity.
We examine more closely exemplary scenarios of two consecutive days: in the first scenario (4 January 2018), high prices occurred in hours number 4 and 12 (13:00 a.m. and 17:00 a.m., translating into daily time), while in the second scenario (5 January 2018) high prices occurred in hours 1 and 12. Prices, together with the energy schedules determined in the auction, are presented in Figure 8. Threshold price c was set to $100 per MWh, so total energy purchased in both scenarios is equal to trip energy used, i.e., 3854.98 kWh. In both scenarios, buses do not charge at all in hours with the highest prices.

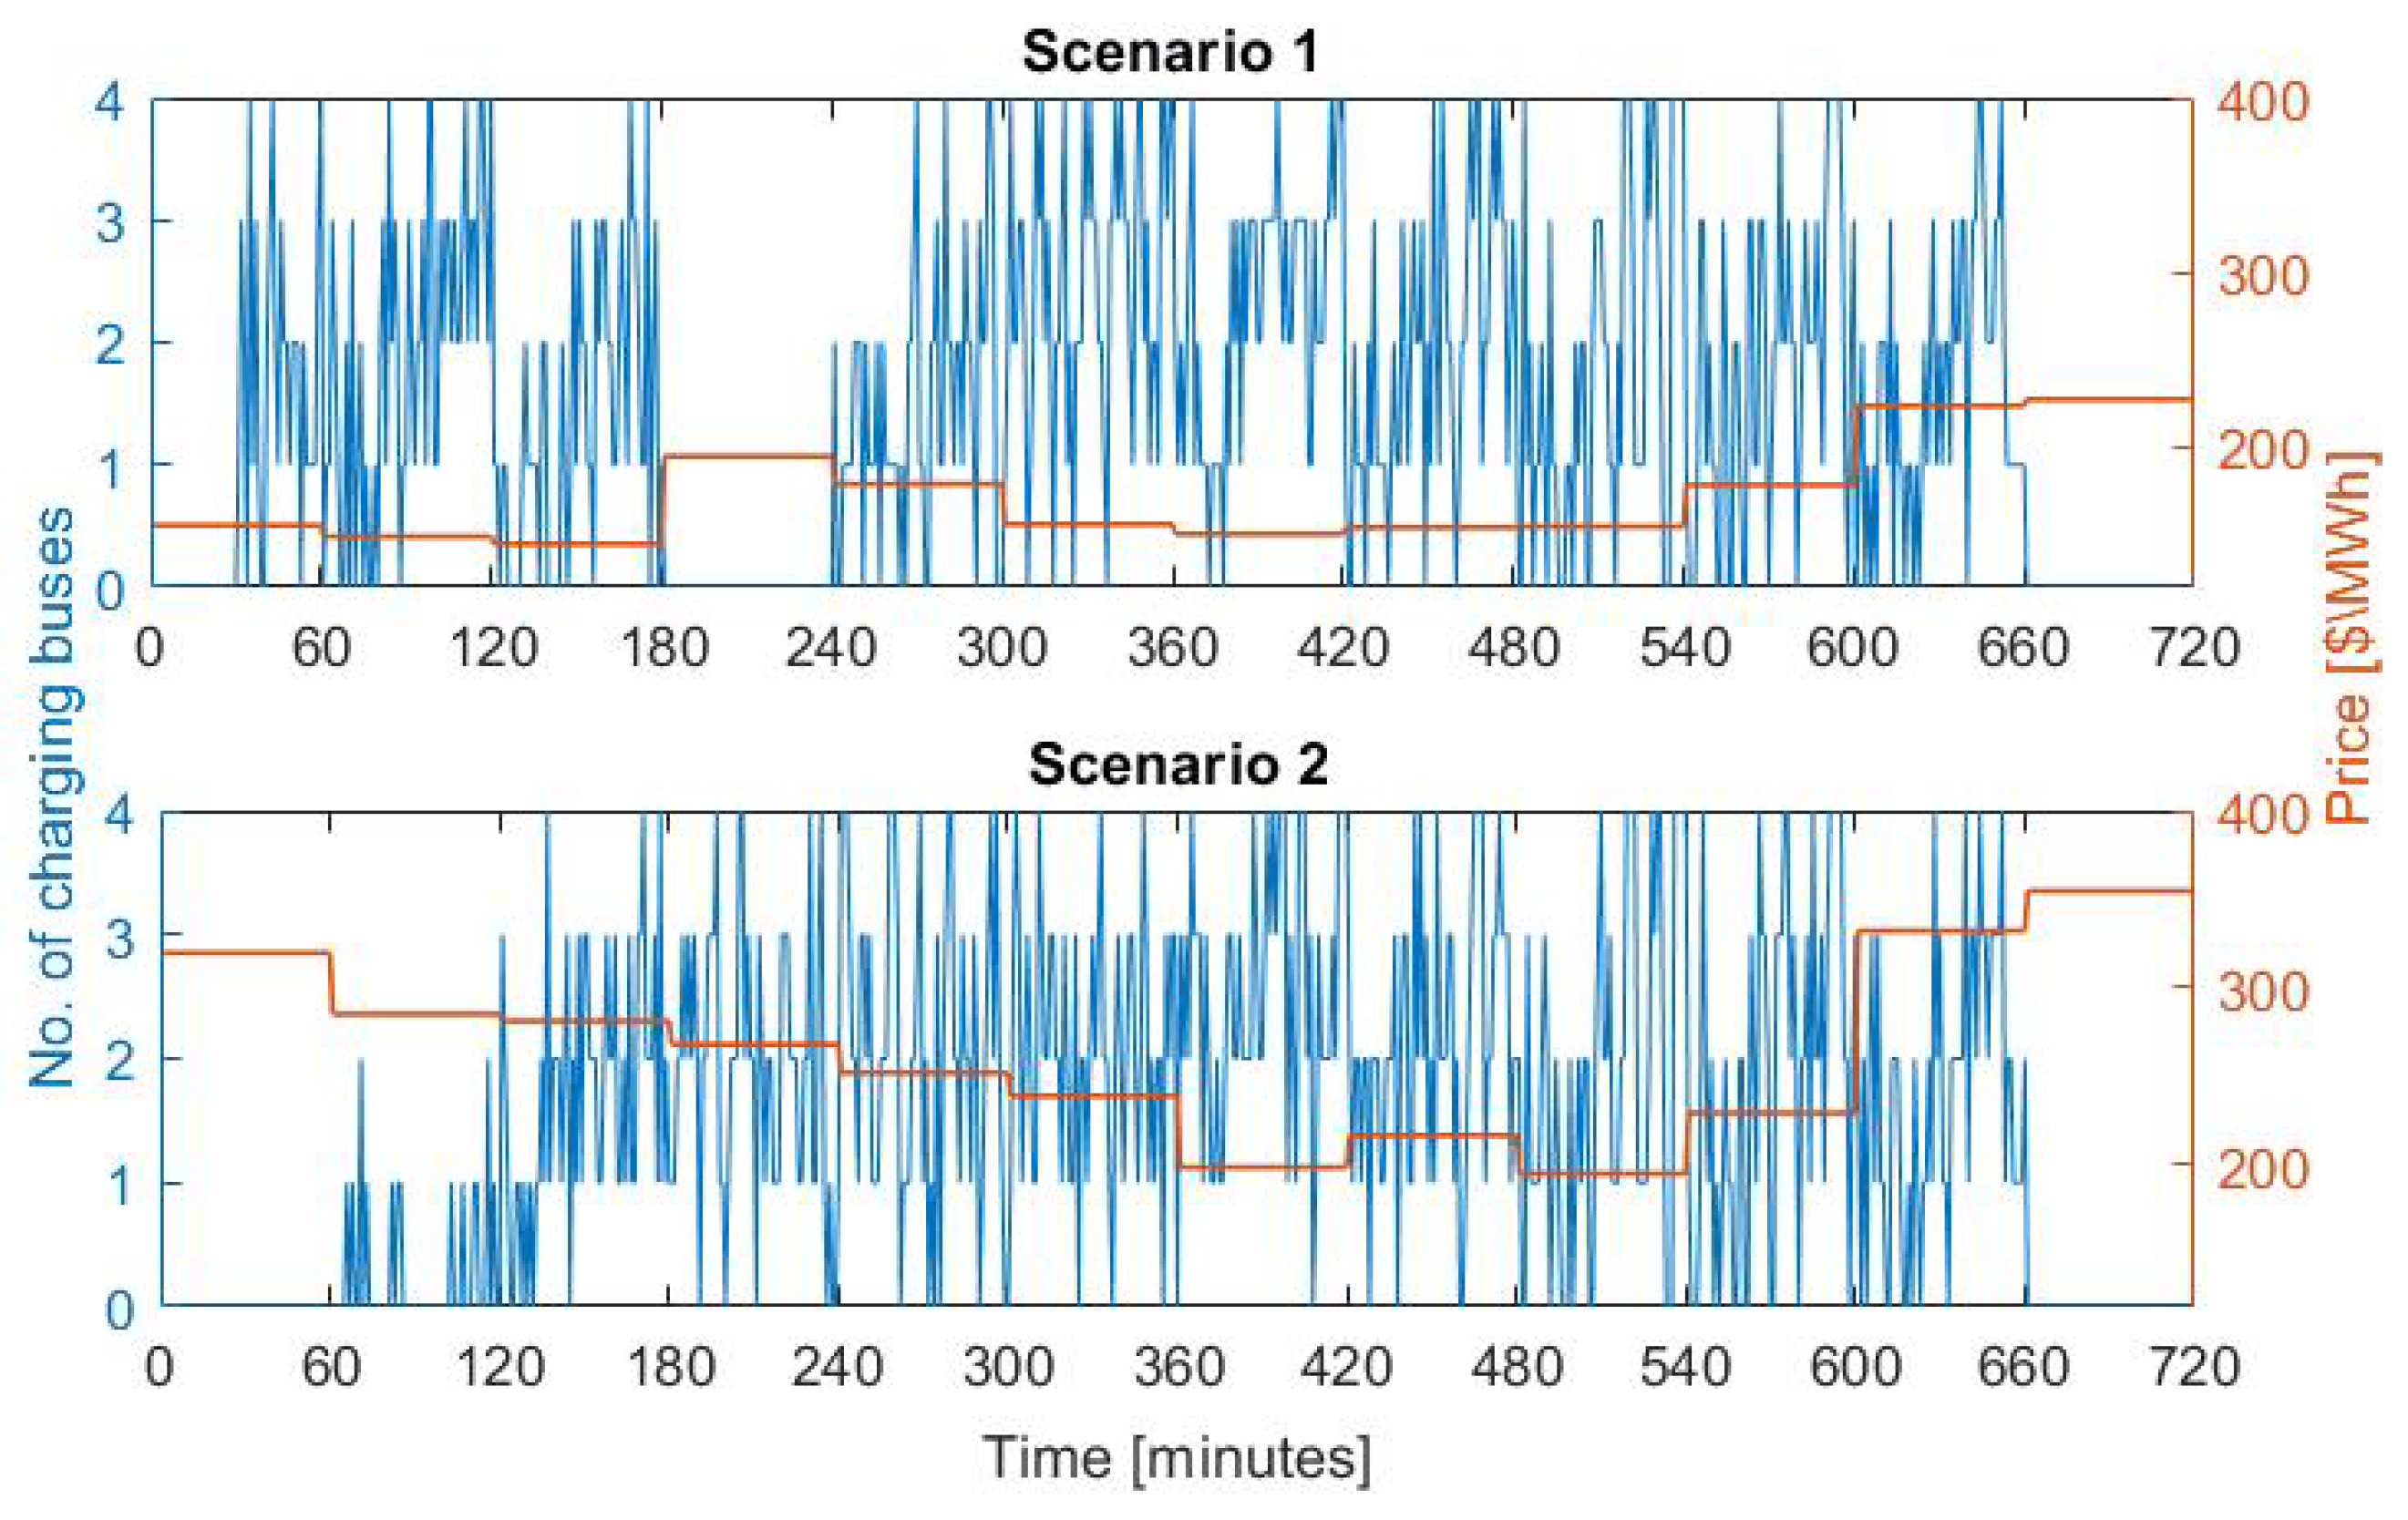
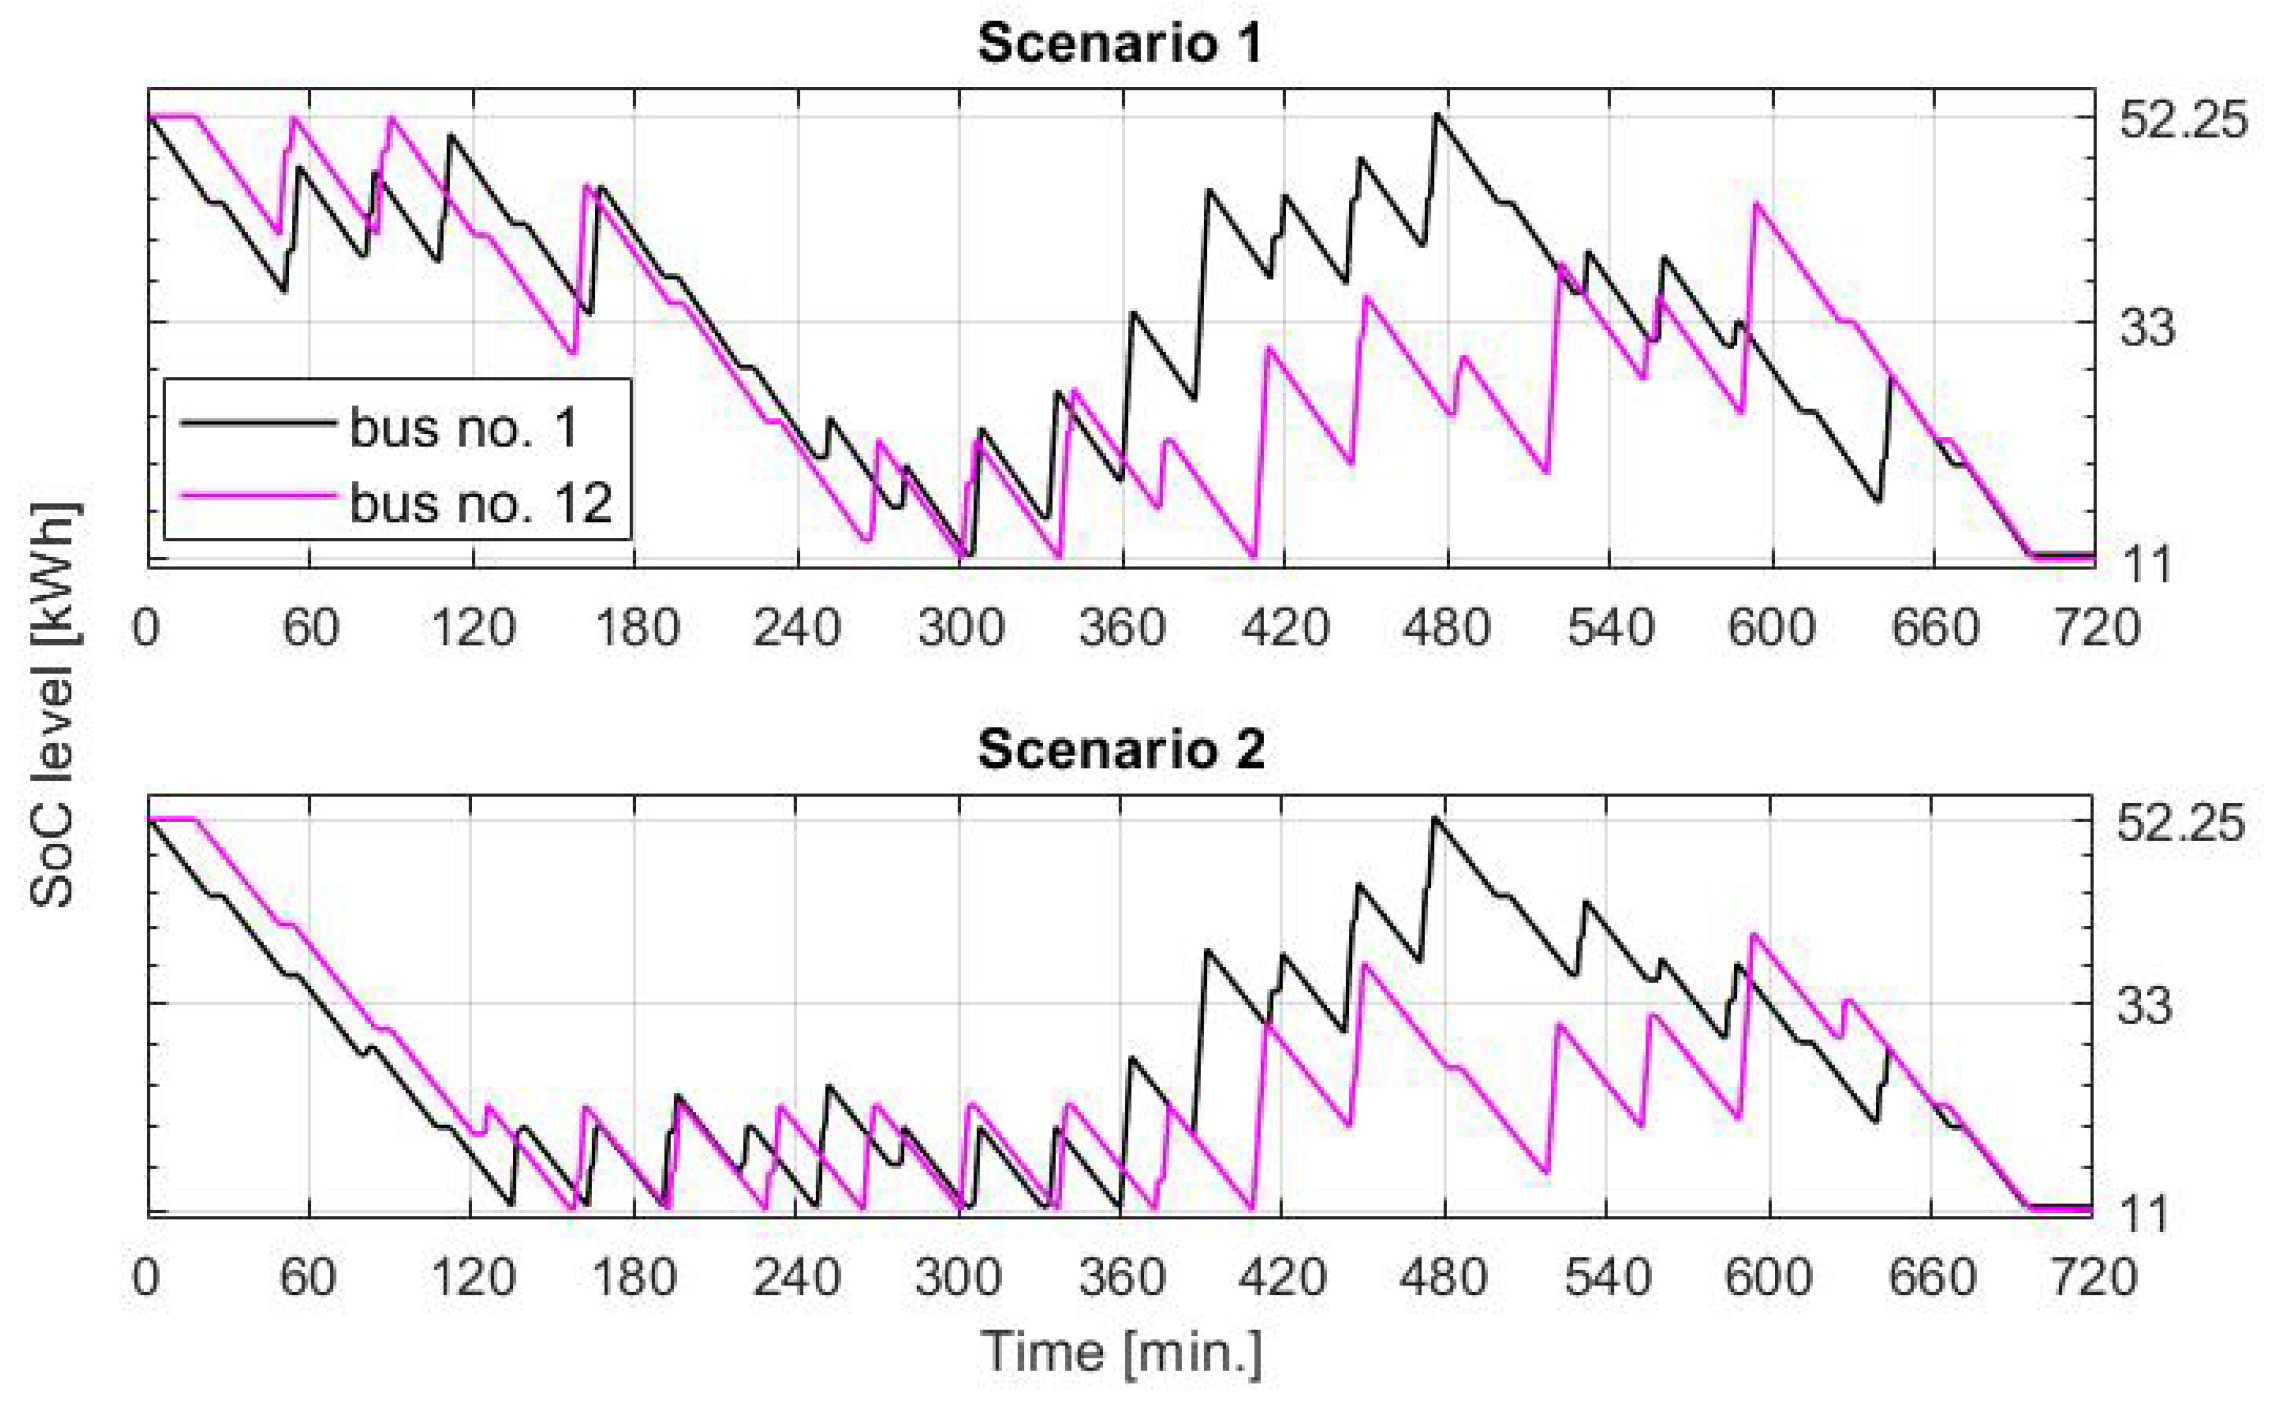
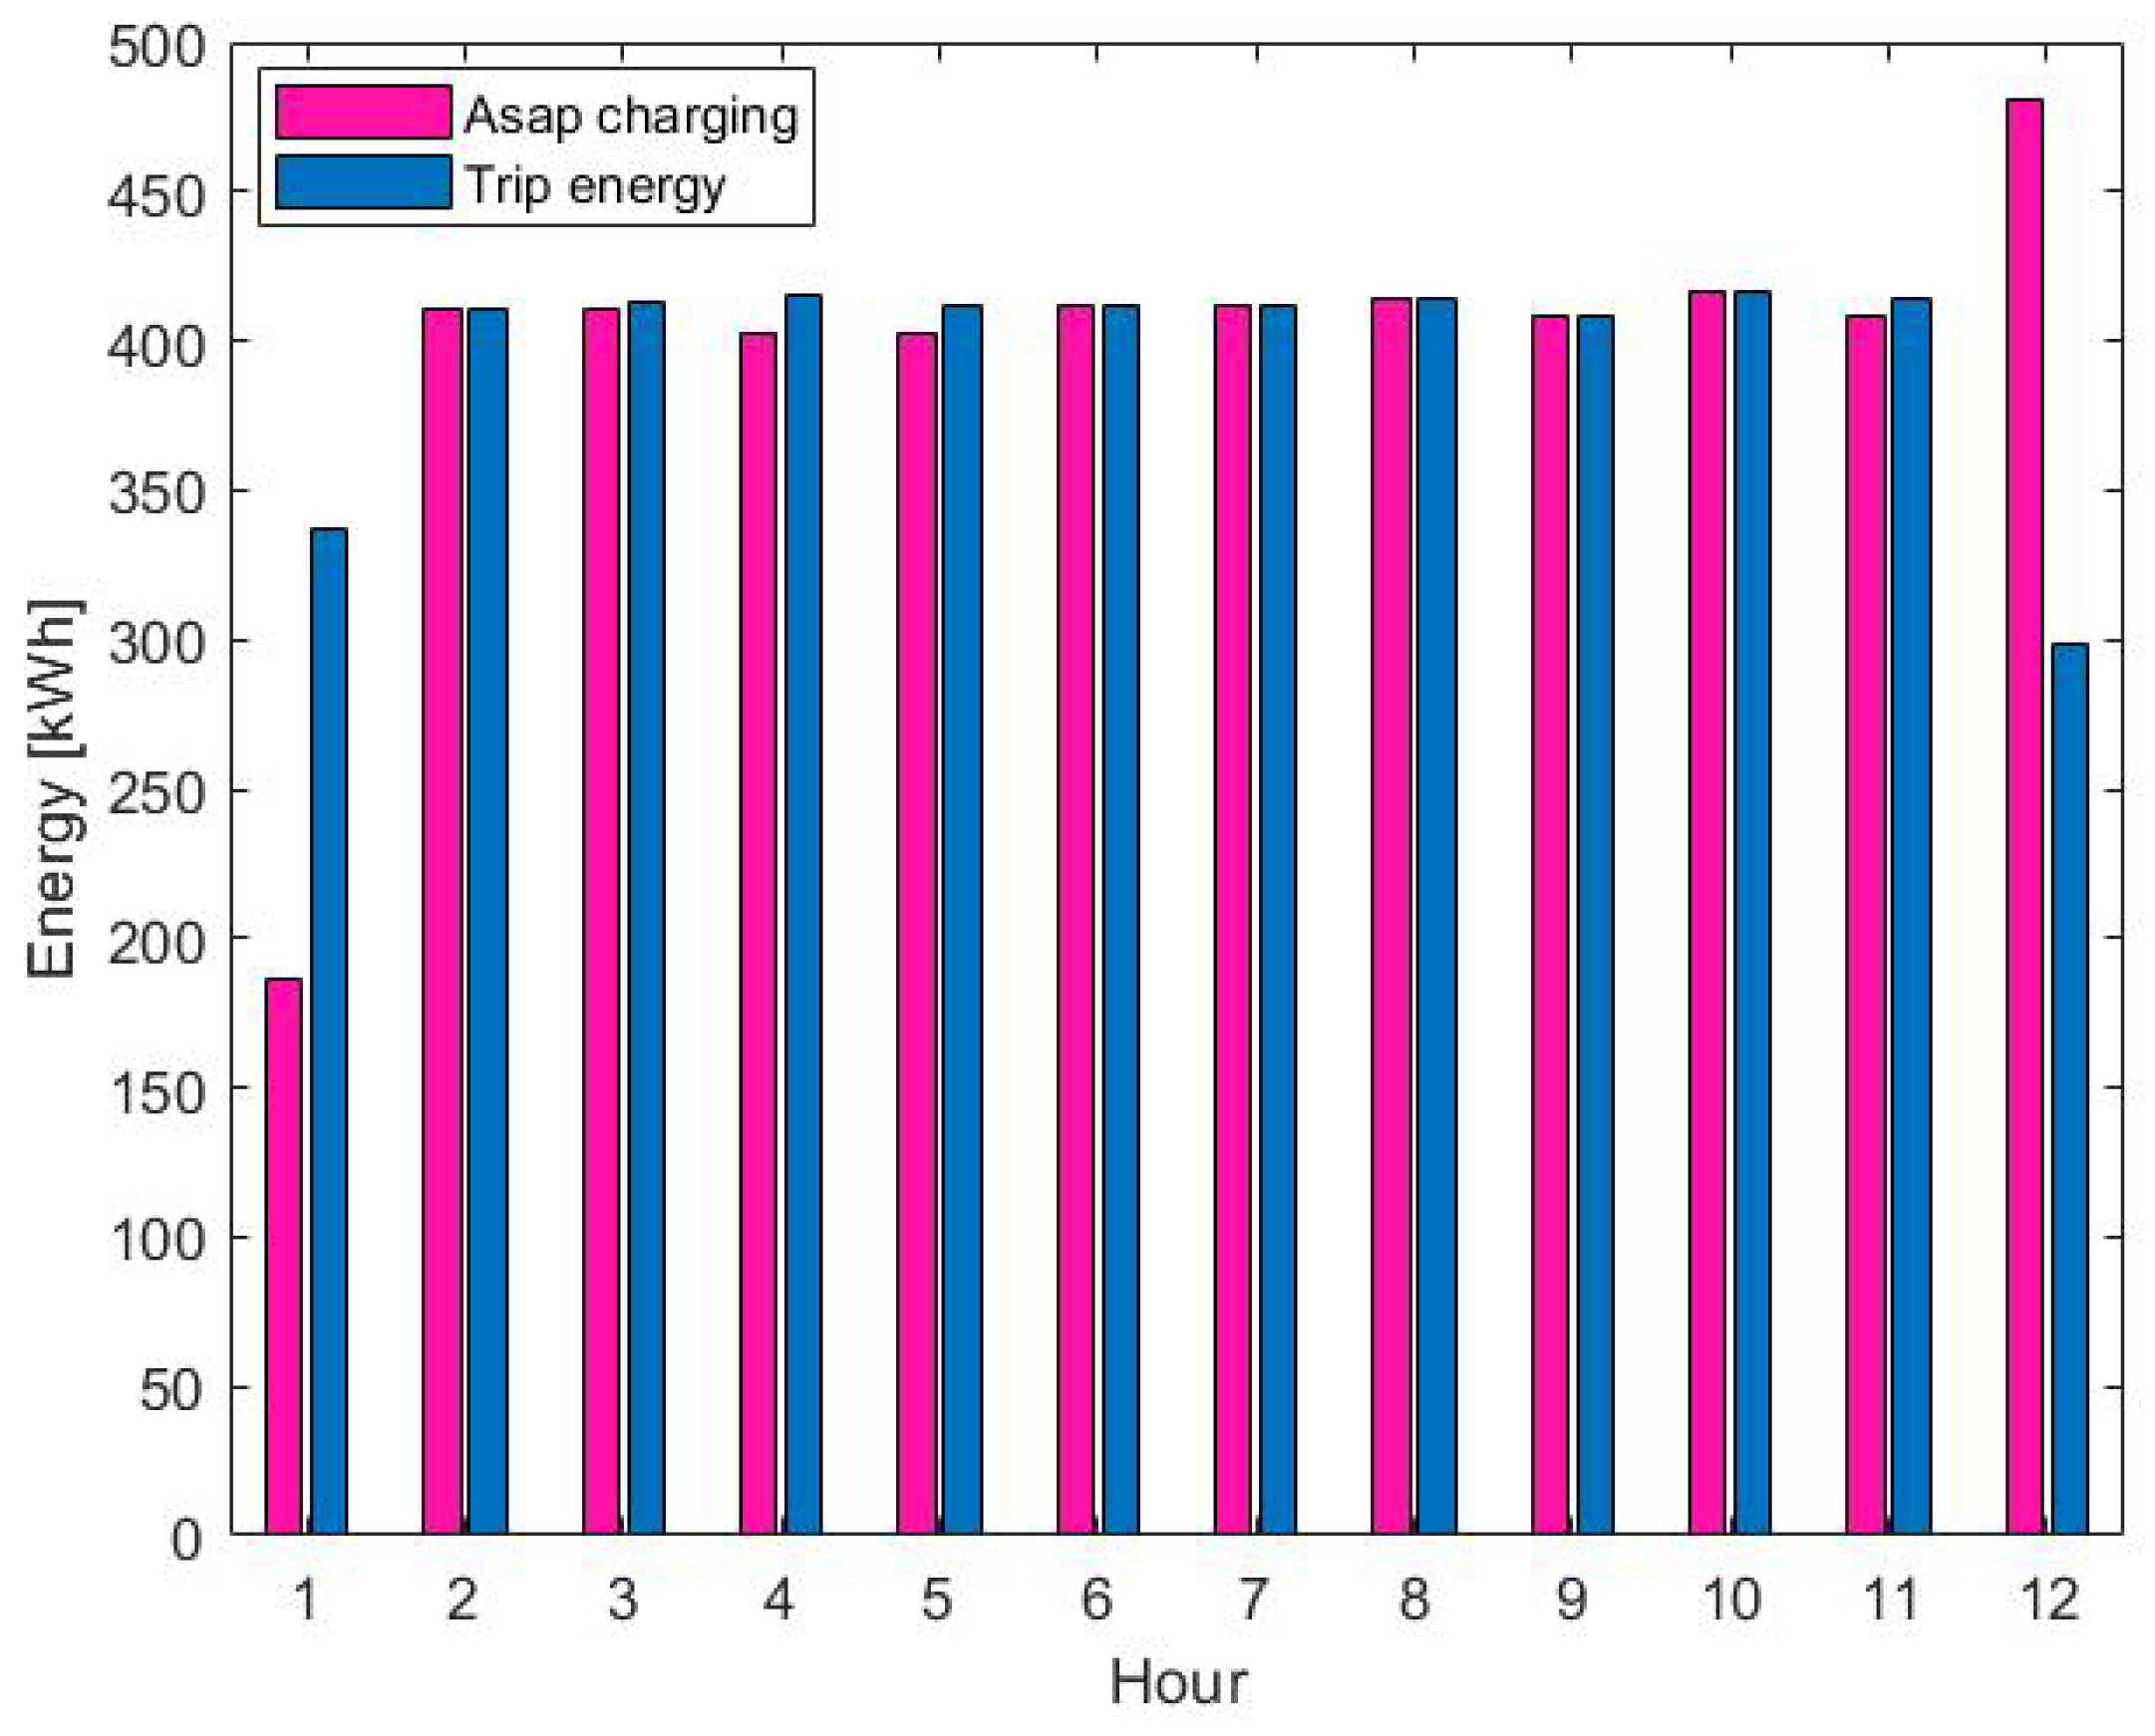
3.2.3. Disaggregation Results

Finally, the disaggregation step is performed applying the algorithm provided in Section 2.3. Detailed charging stations occupation obtained in each scenario is shown in Figure 9. We also show in Figure 10 specific SoC levels for two exemplary buses (1 and 12) under each scenario. It can be observed that the batteries are correctly managed within the operational limit, i.e., between 11 and 52.25 kWh.

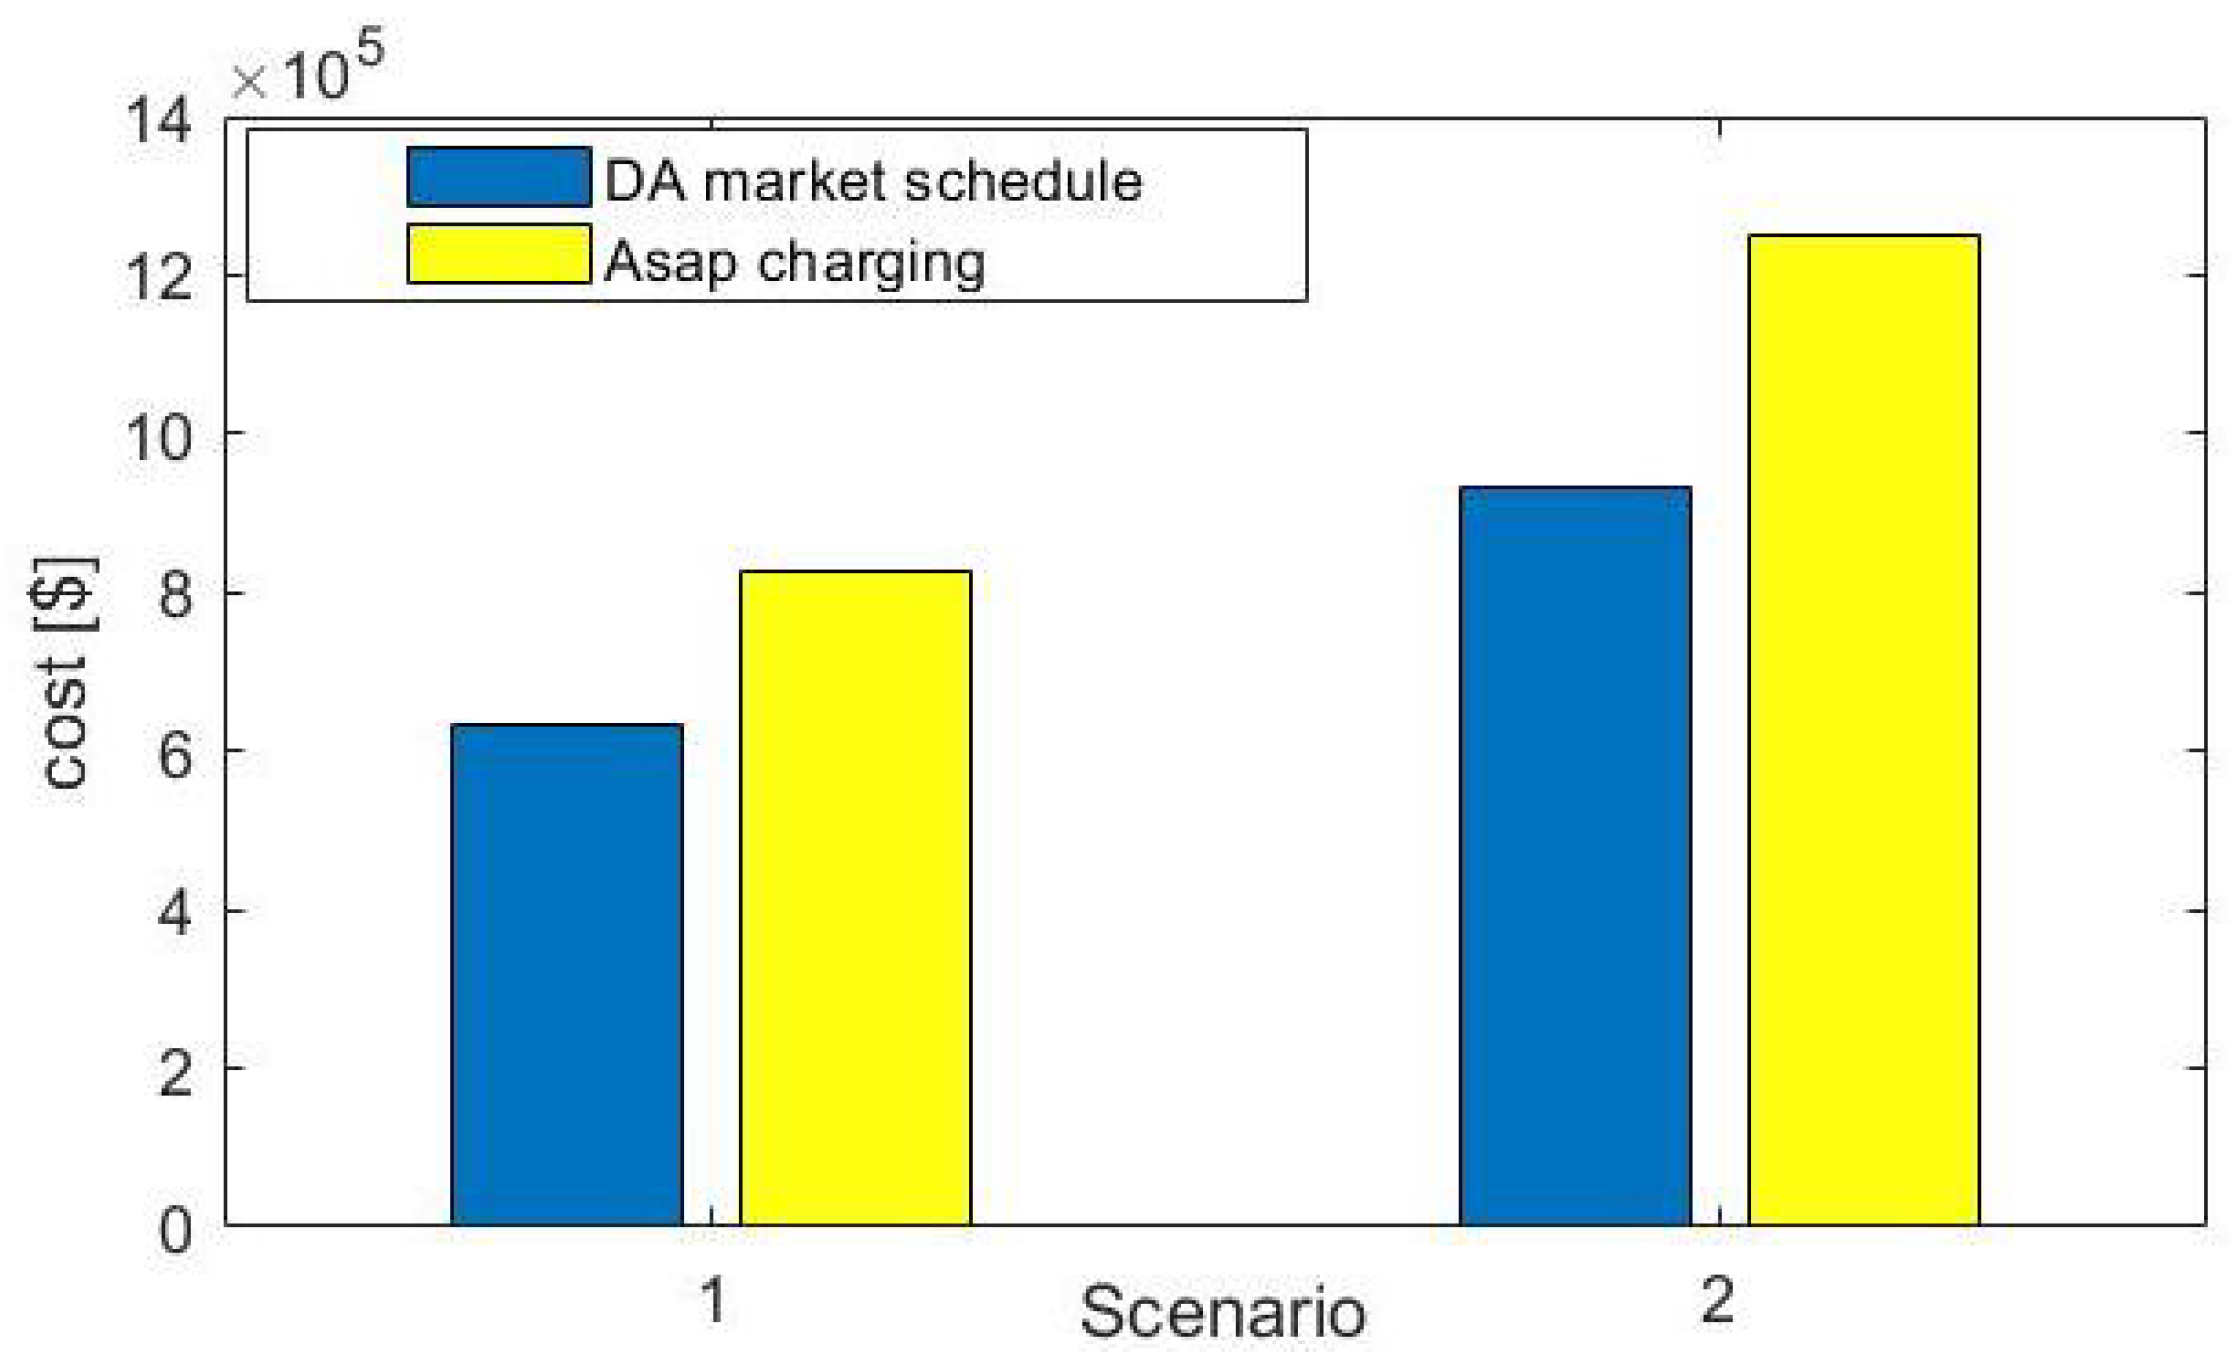
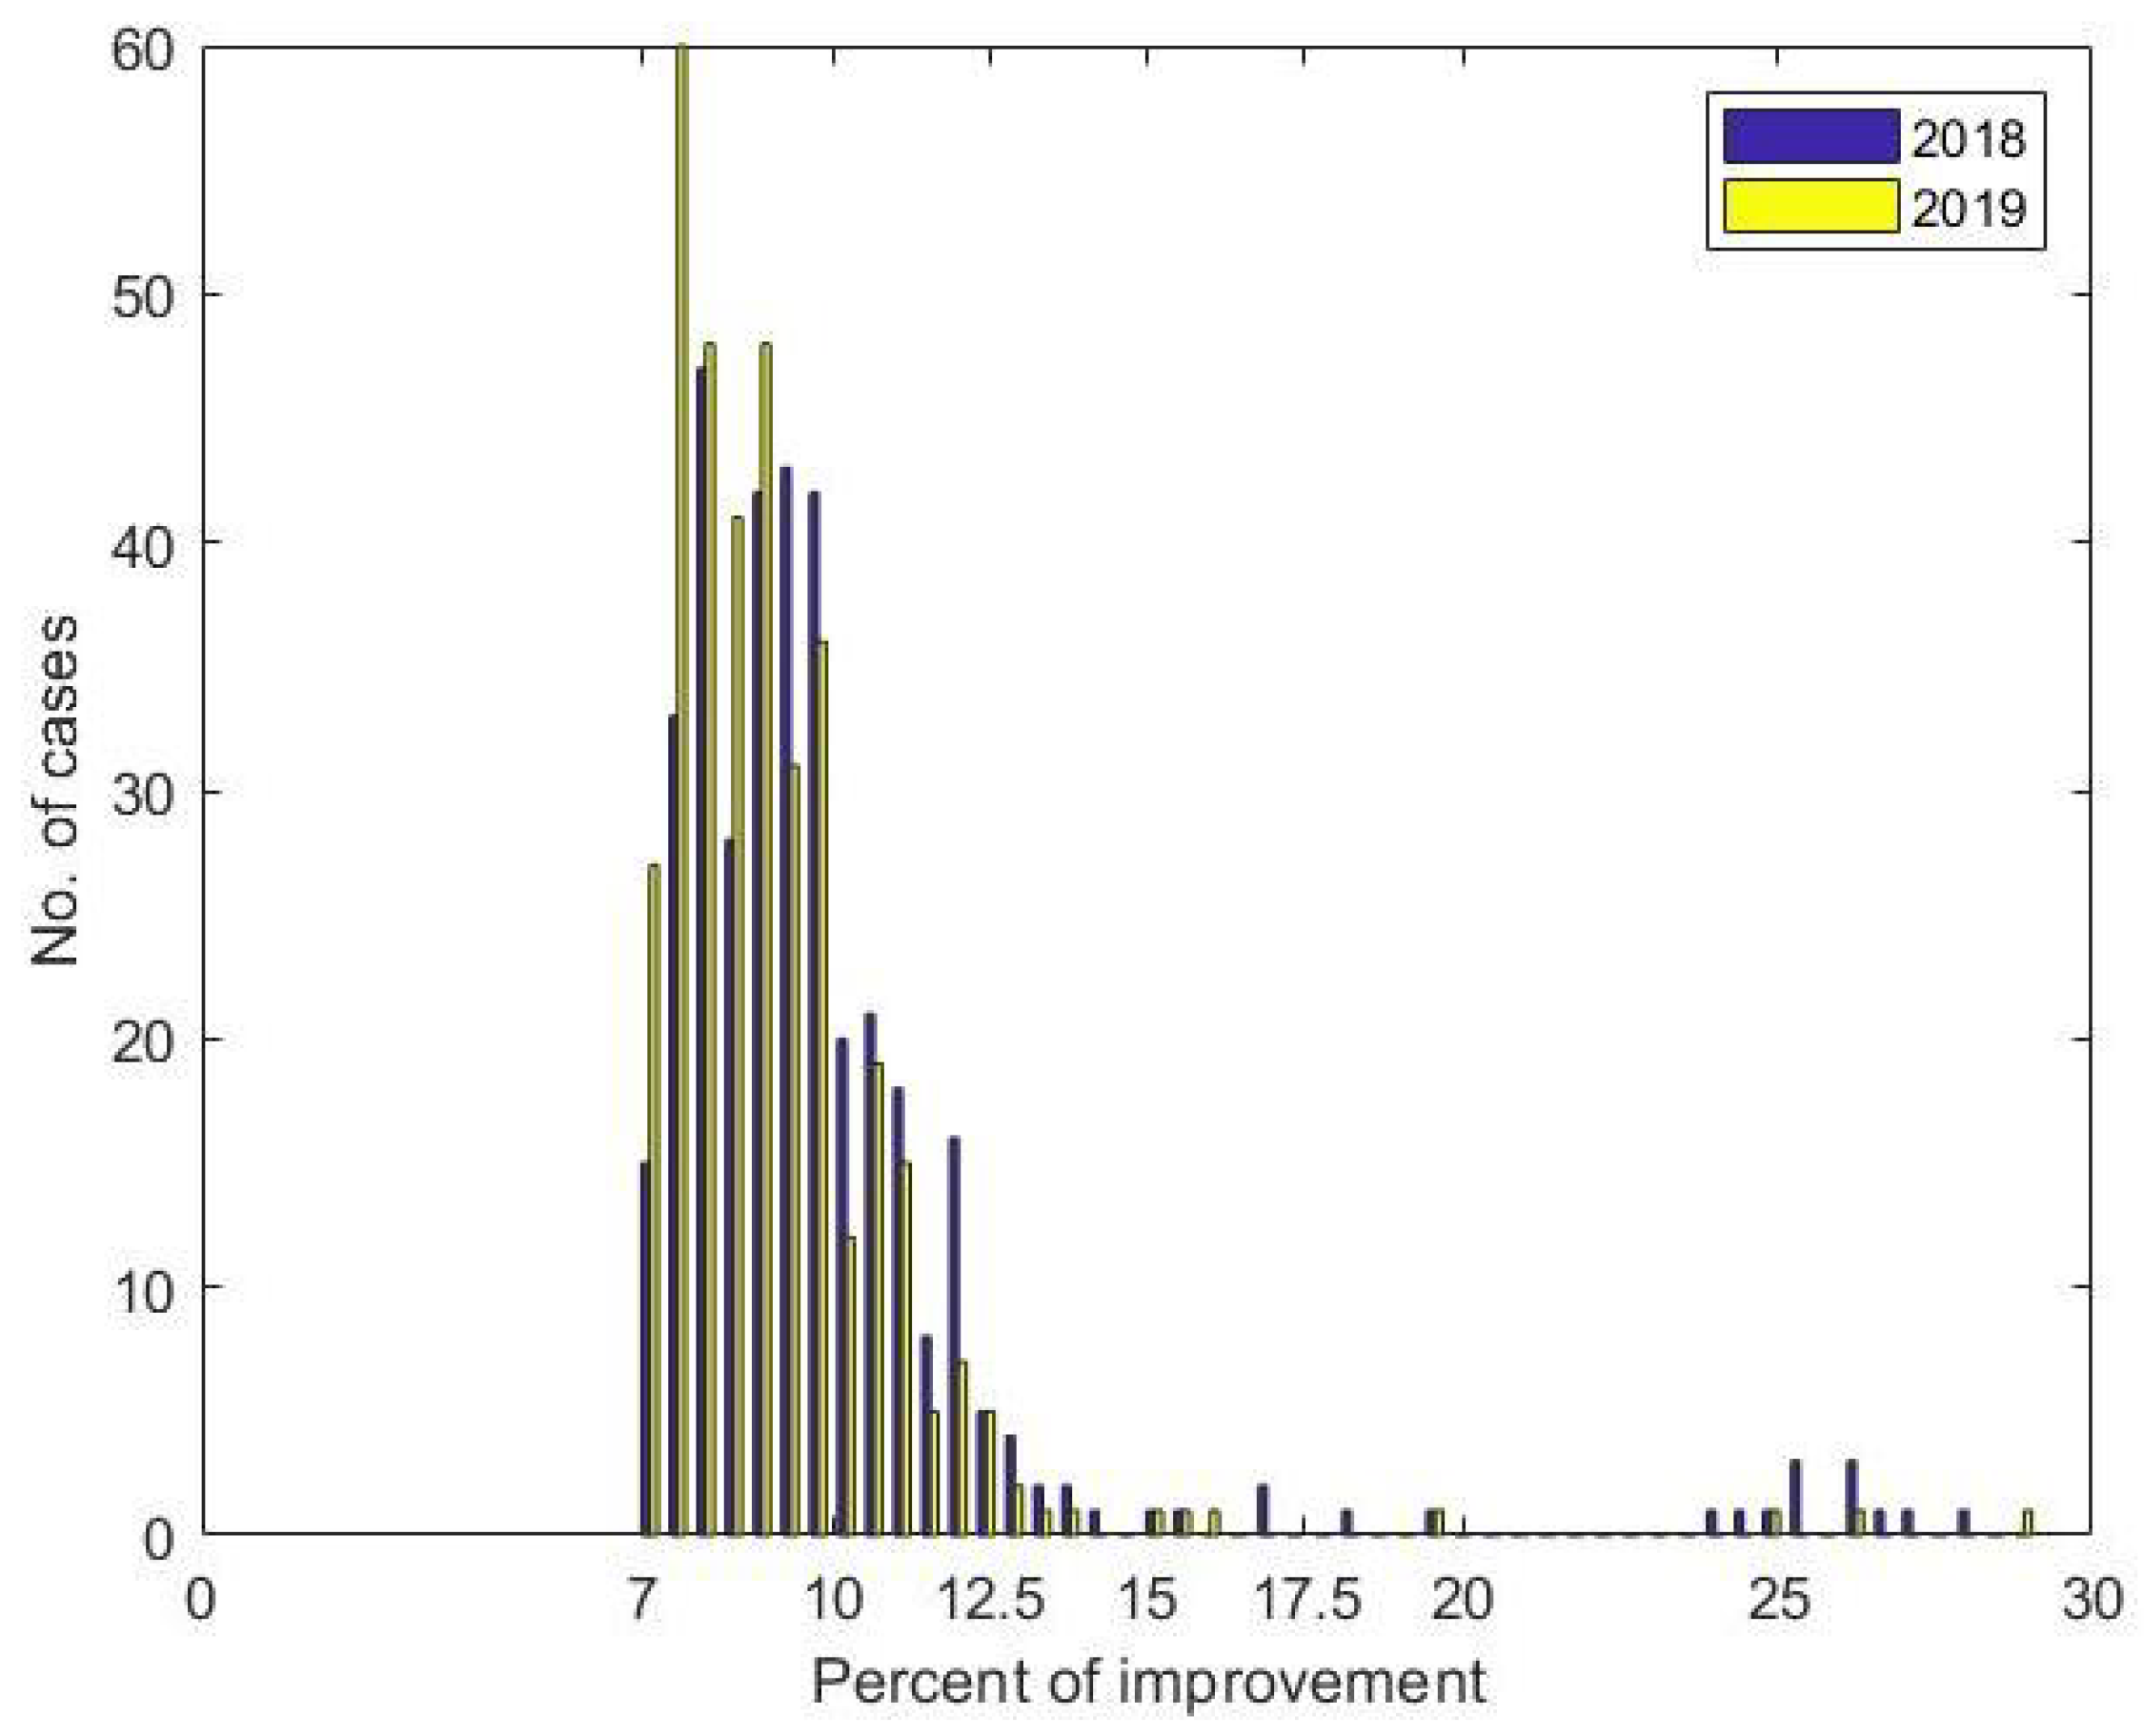
3.3. Cost Savings Analysis

Comparison of costs incurred under our newly proposed day-ahead auction-based charging and Asap charging in each scenario is shown in Figure 11. In both cases, the fleet can achieve about 25% savings using day-ahead auction participation models developed in this paper.
Investigating the whole year of historic prices reveals that the savings on average are not as significant as in the test scenarios; instead, they are around 10%. Regardless, there are several days when up to 28% of savings can be achieved, and they are never less than 7%. Histograms of daily savings day in years 2018–2019 are shown in Figure 12.

3.4. Sensitivity Analysis of the Number of Chargers

For the sensitivity analysis, we tested the scenario results reducing the number of chargers. The reduction from 4 to 3 chargers has a minor effect on the minimum aggregated SoC level: in hour 4, the value increases by 1.3 kWh (from 336.3 to 337.6), while in hour 8 2.1 kWh (from 348.3 to 350.4). Minimum SoC level in other hours remains unchanged, i.e., the same as given in Table 3.
On the contrary, maximum aggregated energy to load decreases considerably. Starting from hour 3, the value decreases by about 80 to 160 kWh (assuming full use of a 250 kW rate charger, a reduction of at most 250 kWh could be expected). The scale of differences varies over time, as shown in Figure 13.
Further reduction of the number of available chargers (from 3 to 2) leads to no feasible solution. With only two chargers, a service level with very short, 5-min idle time cannot be maintained. The result confirms the findings of [8] showing that installing only two 250 kW chargers would result in an average of 3.7 min of additional time to each bus trip along a line.
Finally, it is interesting to compare auction results obtained with the new aggregated parameters, computed assuming three chargers. We observe a very slight increase in costs in both price scenarios: by 1.4% in the first scenario, and only 0.6% in the second scenario. Detailed comparison of differences in aggregated plans reveals minor changes, see Table 4.
Reduction of the amount of energy that can be loaded caused a decrease in purchase volume during low-price hours: hour 3 or 6 in Scenario 1, or hour 8–9 in Scenario 2. On the contrary, purchases increase during the more expensive hours to sustain the constraints. The comparison clearly shows the ability of the day-ahead auction to schedule the charging plans of buses economically within the allowed flexibility. However, the observed worsening of costs is insignificant; therefore, it can be assumed that investing in more than 3 chargers is unprofitable.

4. Discussion

An optimization model for coordinated charging of bus fleet and fast charging stations is developed using the market participation concept in this study. By contrast, the conventional methods assume charging as soon as the buses arrive at the charging location or optimization based on forecasted (or fixed) prices. Our results show that it is possible and reasonable to define aggregated energy demands of the bus fleet in such a manner that allows it to fully participate in the markets and take advantage of its charging flexibility. It is worth noting that only five bidding parameters related to bus fleet charge states are required for inclusion in the day-ahead auction. All complicated, individual characteristics are taken into account in the aggregation phase and then in the disaggregation phase, formulated as mixed-integer linear problems. The proposition provides flexibility to the market operator, as well as to the bus fleet aggregator. Additionally, our case study confirms the ability of the proposed day-ahead auction model to schedule the charging plans of buses economically.
Though our newly developed models are quite versatile, there are few limitations of our study: (1) Although the assumed deterministic driving parameters could be handled to account for uncertainty using the safety margin, determination of the specific level related to the risk-aversion of the aggregator can be challenging; (2) The proposed models aim to minimize only the electricity-related cost. Operational life-cycle cost or emissions impacts are neglected; (3) Although the aggregation can make it possible for electric buses to participate in the day-ahead, the demanded amounts of energy may be still too small for some larger wholesale markets. Limitations on the size of demand may not be easily addressed in our proposition.
Several future research areas are further recognized. First, we take a price-taking perspective in this paper. Analyses investigating the effects of large-scale bus fleets on the price of energy and the overall economics of the energy markets, including network congestion, etc. would be of great interest. An enhancement to integrated decision support including intraday, and real-time operation, is another good topic. On the other hand, the applicability of the proposed models to estimate the profitability of strategic decisions regarding, i.e., battery capacity or charging infrastructure, seems a natural enhancement of this approach.

Author Contributions

Conceptualization, methodology, software, validation, formal analysis, investigation, resources, writing—original draft preparation, visualization, supervision, project administration, funding acquisition, I.Z.; data curation, I.Z. and J.L.; writing—review and editing, J.L. All authors have read and agreed to the published version of the manuscript.

Funding

This research received no external funding.

Institutional Review Board Statement

Not applicable.

Informed Consent Statement

Not applicable.

Data Availability Statement

Data is contained within the article.

Conflicts of Interest

The authors declare no conflict of interest.

Abbreviations

The following abbreviations are used in this manuscript:
Indices
bIndex of electric buses
hIndex of time periods (hours)
tIndex of time periods (minutes)
i b Index of minutes when bus b ends the idle period
Parameters
δ idle time (in minutes)
A b t 0/1 indicator if bus b is available for charging in minute t
CNumber of chargers
cMaximum unit price for the excess amount of energy set by bus aggregator
E b cycle Per-cycle trip energy demand of bus b
E b t Trip Per-minute trip energy demand of bus b (per-cycle energy use/cycle time)
SoC ¯ b Maximum battery State of Charge of bus b
SoC ̲ b Minimum battery State of Charge of bus b
SoC b 0 Initial battery State of Charge of bus b
rCharging rate of a charger
Variables used specifically in aggregation/disaggregation model
p b t Charging energy of bus b scheduled in minute t
s b t Binary charging status of bus b in minute t
SoC b t Battery State of Charge of bus b in minute t
SoC b h min Minimum battery State of Charge of bus b at the end of hour h
Variables in Aggregation model used as Parameters in Auction model
E 1 Total energy that must be loaded by buses
E 2 Additional energy that can be loaded by buses
E h Agg , Trip Summary hourly trip energy of buses
P h Agg , max Aggregated maximum amount of energy that can be loaded in hour h
SoC h Agg , min Aggregated minimum battery State of Charge in hour h
Variables used specifically in auction model
Cost ( NetSupply h ) Net supply cost in hour h
NetSupply h Net supply in hour h
SoC h Agg Aggregated battery State of Charge in hour h
π h Auction energy price in hour h derived as the shadow prices to balance constraint ()
Variables in Auction model used as Parameters in Disaggregation model
p h Agg Charging energy scheduled in hour h

References

  1. Pietrzak, O.; Pietrzak, K. The Economic Effects of Electromobility in Sustainable Urban Public Transport. Energies 2021, 14, 878. [Google Scholar] [CrossRef]
  2. Lin, Y.; Zhang, K.; Shen, Z.J.M.; Ye, B.; Miao, L. Multistage large-scale charging station planning for electric buses considering transportation network and power grid. Transp. Res. Part C Emerg. Technol. 2019, 107, 423–443. [Google Scholar] [CrossRef]
  3. Clairand, J.M.; Guerra-Terán, P.; Serrano-Guerrero, X.; González-Rodríguez, M.; Escrivá-Escrivá, G. Electric Vehicles for Public Transportation in Power Systems: A Review of Methodologies. Energies 2019, 12, 3114. [Google Scholar] [CrossRef] [Green Version]
  4. Batrancea, I.; Batrancea, L.; Nichita, A.; Gaban, L.; Masca, E.; Morar, I.D.; Fatacean, G.; Moscviciov, A. An econometric approach on production, costs and profit in Romanian coal mining enterprises. Econ. Res. Ekon. Istraživanja 2019, 32, 1019–1036. [Google Scholar] [CrossRef] [Green Version]
  5. Zoltowska, I. Demand shifting bids in energy auction with non-convexities and transmission constraints. Energy Econ. 2016, 53, 17–27. [Google Scholar] [CrossRef]
  6. Zoltowska, I.; Lin, J. Availability Bids Enabling Participation of Electric Vehicles in the Wholesale Markets. In Proceedings of the 2019 Electric Vehicles International Conference (EV), Bucharest, Romania, 3–4 October 2019; IEEE: Piscataway, NJ, USA, 2019; pp. 1–6. [Google Scholar]
  7. Muratori, M. Impact of uncoordinated plug-in electric vehicle charging on residential power demand. Nat. Energy 2018, 3, 193–201. [Google Scholar] [CrossRef]
  8. De Filippo, G.; Marano, V.; Sioshansi, R. Simulation of an electric transportation system at The Ohio State University. Appl. Energy 2014, 113, 1686–1691. [Google Scholar] [CrossRef]
  9. Kontou, E.; Yin, Y.; Ge, Y.E. Cost-effective and ecofriendly plug-in hybrid electric vehicle charging management. Transp. Res. Rec. 2017, 2628, 87–98. [Google Scholar] [CrossRef]
  10. Moradipari, A.; Tucker, N.; Zhang, T.; Cezar, G.; Alizadeh, M. Mobility-Aware Smart Charging of Electric Bus Fleets. In Proceedings of the 2020 IEEE Power & Energy Society General Meeting (PESGM), Montreal, QC, Canada, 2–6 August 2020; IEEE: Piscataway, NJ, USA, 2020; pp. 1–5. [Google Scholar]
  11. Chen, H.; Hu, Z.; Xu, Z.; Li, J.; Zhang, H.; Xia, X.; Ning, K.; Peng, M. Coordinated charging strategies for electric bus fast charging stations. In Proceedings of the 2016 IEEE PES Asia-Pacific Power and Energy Engineering Conference (APPEEC), Xi’an, China, 25–28 October 2016; IEEE: Piscataway, NJ, USA, 2016; pp. 1174–1179. [Google Scholar]
  12. Chen, H.; Hu, Z.; Zhang, H.; Luo, H. Coordinated charging and discharging strategies for plug-in electric bus fast charging station with energy storage system. IET Gener. Transm. Distrib. 2018, 12, 2019–2028. [Google Scholar] [CrossRef] [Green Version]
  13. Raab, A.F.; Lauth, E.; Strunz, K.; Göhlich, D. Implementation schemes for electric bus fleets at depots with optimized energy procurements in virtual power plant operations. World Electr. Veh. J. 2019, 10, 5. [Google Scholar] [CrossRef] [Green Version]
  14. Qin, N.; Gusrialdi, A.; Brooker, R.P.; Ali, T. Numerical analysis of electric bus fast charging strategies for demand charge reduction. Transp. Res. Part A Policy Pract. 2016, 94, 386–396. [Google Scholar] [CrossRef]
  15. Deng, R.; Liu, Y.; Chen, W.; Liang, H. A Survey on Electric Buses—Energy Storage, Power Management, and Charging Scheduling. IEEE Trans. Intell. Transp. Syst. 2019, 22, 9–22. [Google Scholar] [CrossRef]
  16. Sioshansi, R.; Denholm, P.; Jenkin, T.; Weiss, J. Estimating the value of electricity storage in PJM: Arbitrage and some welfare effects. Energy Econ. 2009, 31, 269–277. [Google Scholar] [CrossRef]
  17. Mays, J. Missing incentives for flexibility in wholesale electricity markets. Energy Policy 2021, 149, 112010. [Google Scholar] [CrossRef]
  18. Federal Energy Regulatory Commission. Electric Storage Participation in Markets Operated by Regional Transmission Organizations and Independent Systems Operators. 2018. Available online: https://elibrary.ferc.gov/eLibrary/docinfo?document_id=14643624 (accessed on 22 June 2021).
  19. Sakti, A.; Botterud, A.; O’Sullivan, F. Review of wholesale markets and regulations for advanced energy storage services in the United States: Current status and path forward. Energy Policy 2018, 120, 569–579. [Google Scholar] [CrossRef]
  20. Wang, J.; Kennedy, S.; Kirtley, J. A new wholesale bidding mechanism for enhanced demand response in smart grids. In Proceedings of the 2010 Innovative Smart Grid Technologies (ISGT), Gaithersburg, MD, USA, 19–21 January 2010; pp. 1–8. [Google Scholar] [CrossRef]
  21. Liu, Y.; Holzer, J.T.; Ferris, M.C. Extending the bidding format to promote demand response. Energy Policy 2015, 86, 82–92. [Google Scholar] [CrossRef] [Green Version]
  22. Gao, Y.; Guo, S.; Ren, J.; Zhao, Z.; Ehsan, A.; Zheng, Y. An electric bus power consumption model and optimization of charging scheduling concerning multi-external factors. Energies 2018, 11, 2060. [Google Scholar] [CrossRef] [Green Version]
  23. Sen, S.; Kothari, D. Optimal thermal generating unit commitment: A review. Int. J. Electr. Power Energy Syst. 1998, 20, 443–451. [Google Scholar] [CrossRef]
  24. PJM Interconnection, LLC (PJM). PJM Data Viewer: Locational Marginal Pricing. 2020. Available online: https://www.pjm.com/ (accessed on 3 August 2021).
Figure 1. The phases of the optimization process proposed in this paper.
Energies 14 04727 g001
Figure 2. Dependencies between the models introduced in this paper.
Energies 14 04727 g002
Figure 3. Availability charging periods of buses.
Energies 14 04727 g003
Figure 4. Illustration of the Asap recharging strategy that aims in refilling batteries to maximum SoC during each idle period.
Energies 14 04727 g004
Figure 5. Total number of buses trying to recharge immediately after each cycle under Asap charging strategy.
Energies 14 04727 g005
Figure 6. Asap charging plan aggregated into hourly values compared to summary trip energy.
Energies 14 04727 g006
Figure 7. Aggregated minimum battery State of Charge and aggregated maximum amount of energy that can be loaded in each hour.
Energies 14 04727 g007
Figure 8. Scenarios of purchased energy.
Energies 14 04727 g008
Figure 9. Detailed charging plan in each scenario.
Energies 14 04727 g009
Figure 10. Exemplary SoC levels of buses 1 and 12 in each scenario.
Energies 14 04727 g010
Figure 11. Comparison of costs incurred in each scenario in reference to costs incurred in the case of charging buses as soon as possible (asap rule).
Energies 14 04727 g011
Figure 12. Histograms of costs savings achieved in each day of years 2018–2019 when comparing day-ahead auction-based charging to the Asap charging.
Energies 14 04727 g012
Figure 13. Comparison of computed parameters regarding aggregated minimum battery State of Charge and aggregated maximum amount of energy, assuming four (baseline case) or three fast charging stations.
Energies 14 04727 g013
Table 1. Description of bus lines at the Ohio campus [8].
Bus LineCycle Time [min]Per-Cycle Energy Use [kWh]Frequency [min]No. of Buses
North Express238.4195
Loop North3110.9194
Loop South3111.0894
Central Connector3212.11123
East Residential3311.6294
Buckeye Village3012.71152
Table 2. Detailed parameters values used in the case study.
δ Cr SoC ̲ b SoC ¯ b SoC b 0 E 1 E 2
5 min4250 kW11 kW52.25 kW52.25 kWh3854.98 kWh907.5 kWh
Table 3. Detailed bid parameters [kWh] resulting from aggregation stage.
h E h Agg , Trip P h Agg , max SoC h Agg , min
1336.8186.0242.0
2410.3597.7285.3
3413.3740.2366.4
4415.0665.0336.3
5412.1692.7351.3
6411.4700.6357.9
7411.4736.3360.5
8414.6692.7348.3
9408.5649.2375.5
10416.1641.3347.5
11414.3732.3340.2
12298.6843.1242.0
Table 4. Comparison of hourly charging plans [kWh] obtained in each scenario, assuming four or three fast charging stations.
hScenario 1Scenario 2
4 Chargers3 Chargers4 Chargers3 Chargers
1186.0186.00.00.0
2411.0411.043.343.3
3299.9250.4334.0333.9
40.00.0384.9386.2
5292.3341.8427.1425.8
6556.0500.6418.1418.0
7504.8491.0517.7532.3
8439.3430.4458.1451.0
9397.1370.9441.0381.2
10415.2421.9414.6427.0
11353.3451.1416.3454.2
120.00.00.02.1
Publisher’s Note: MDPI stays neutral with regard to jurisdictional claims in published maps and institutional affiliations.

