1. Introduction
The marine energy (ME) industry (marine energy refers to renewable energy captured from waves, tides, ocean currents, the natural flow of water in rivers, and marine thermal gradients, without building new dams or diversions) has a vital role in the U.S. clean energy strategy as we progress to meet U.S. electricity needs with renewable, domestic energy sources. However, the young U.S. marine energy industry has had few operational projects, which presents multiple challenges for environmental assessment and monitoring. The lack of environmental baseline data and historical databases on potential environmental effects for these new technologies have resulted in high uncertainty regarding potential environmental impacts. This uncertainty presents significant challenges for marine energy developers, who have identified the cost and time for environmental permitting and compliance as a major development hurdle (Copping et al. [
1,
2]). Overall, the costs of licensing, permitting, and environmental compliance (e.g., environmental monitoring) for marine energy projects have not been well understood or quantified. While efforts have been conducted to look at these costs in similar industries (e.g., offshore wind, offshore oil and gas; Kramer et al. [
3]), there has been no comprehensive investigation for marine energy. Previous efforts focused on marine energy have utilized logic models to define and estimate costs. The best documented effort in the U.S. has been the Environmental Compliance Module of the Reference Model Project. The Reference Model Project, sponsored by the U.S. Department of Energy, was a partnered effort to develop open-source marine hydrokinetic/marine energy point designs as references to benchmark marine energy technology, performance, and costs. (Copping and Geerlofs, Neary et al. [
4,
5].) The Environmental Compliance Module theorized what resources were required for the licensing, permitting, and compliance of ME projects based on efforts from other industries as well as from the handful of projects being developed at that time.
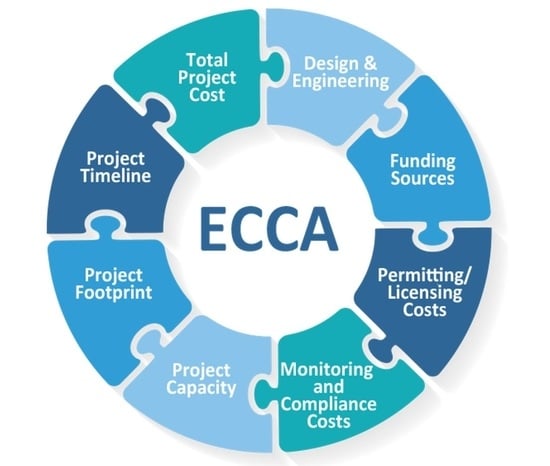
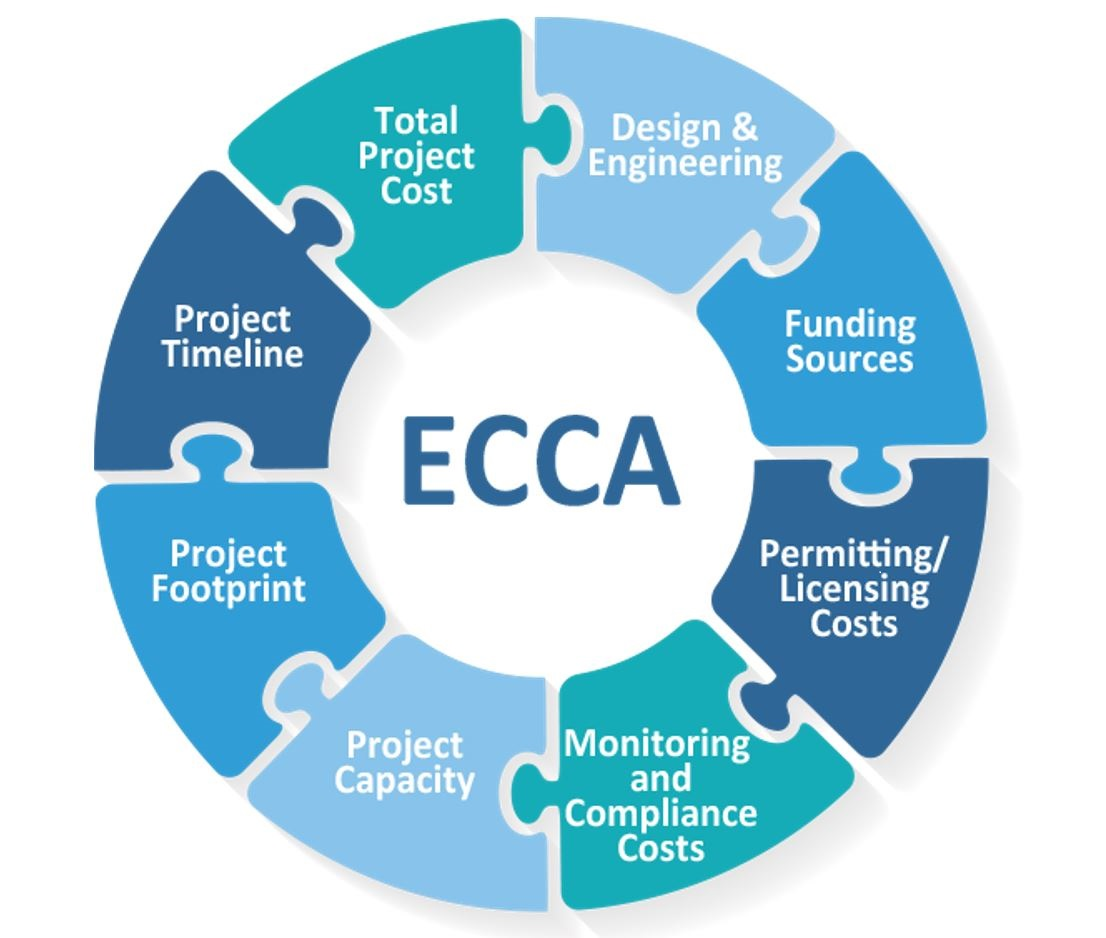
The primary goal of the present effort, the Environmental Compliance Cost Assessment (ECCA) project, has been to compile and analyze the available environmental permitting and compliance costs for a variety of U.S.-based marine energy projects that have gone through the permitting process. This first-of-a-kind effort provides a national “snapshot in time” of early marine energy development and understanding of the studies and costs associated with permitting and monitoring, contextualized with overall project costs where available. Our objectives were to:
Examine actual cost information for marine energy project permitting, licensing, monitoring, and compliance;
Collect additional project information to provide context for those costs;
Understand developer and regulatory perspectives on the permitting process.
Comparing cost information from multiple project types at different locations—with different permitting requirements and progress in their permitting process—understandably produced widely variable results and associated challenges for analysis. For example, each project had different experiences complying with federal laws such as the Endangered Species Act, the Marine Mammal Protection Act, the Coastal Zone Management Act, and the Magnuson-Stevens Fishery Conservation and Management Act. Further, different states have their own regulatory requirements. Another major project difference is whether a developer permitted their project to deliver energy to the grid; to connect to the grid, developers must follow the Federal Energy Regulatory Commission (FERC) licensing process, whereas those testing a free-standing system not connected to the grid follow the U.S. Army Corps of Engineers (USACE) permitting process. The FERC licensing process generally requires more time and interaction with regulators than the USACE permit process. This can be related to the larger amount of infrastructure required, like subsea transmission cables and the onshore grid connection. The USACE Nationwide Permit 52 (USACNWP 52, or USACE 52) requires much less detail, and less investment of time and money. It is intended “on a national basis to streamline the authorization of activities that result in minimal individual and cumulative adverse effects on the aquatic environment” (USACE [
6]). These USACE permits last for 5 years and work well for individual energy converter test deployments. Fortunately, with all of these variable information needs and requirements, the end goals of licensing, permitting, and compliance provide a baseline from which to interpret the data in this work.
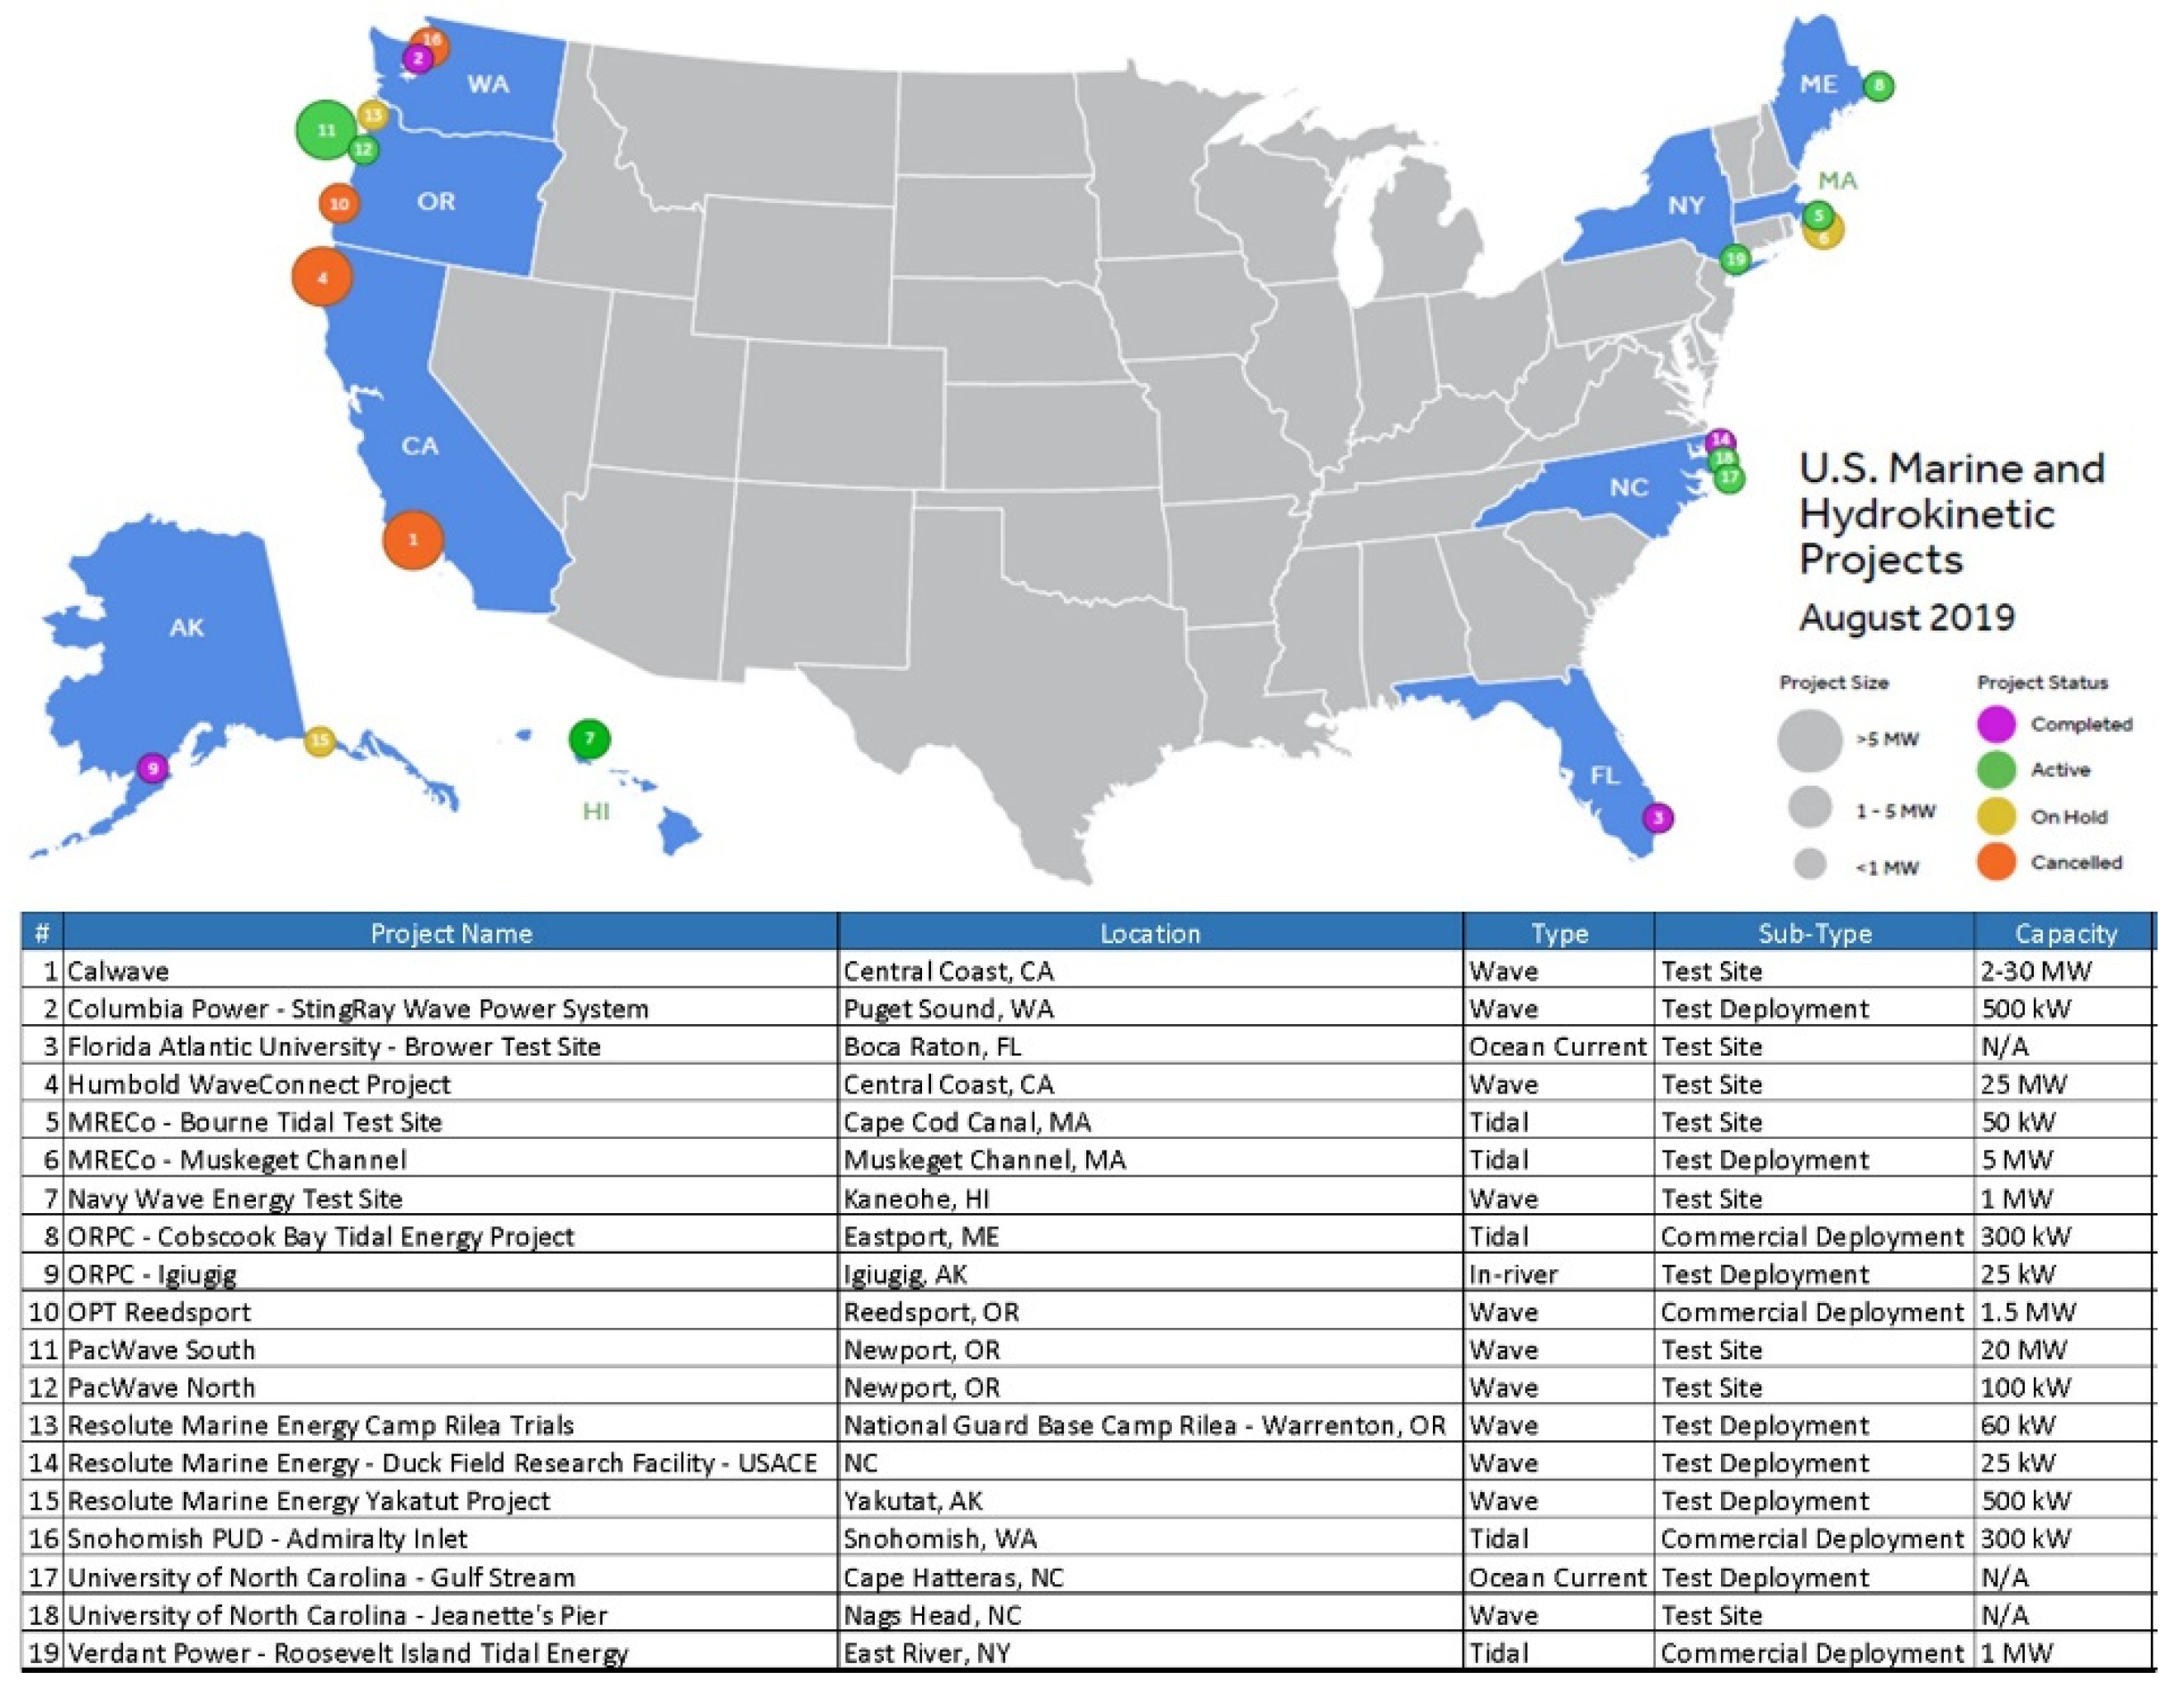
In alignment with our objectives, this work collected quantitative cost information from U.S. marine energy project developers (
Figure 1) and qualitative information (e.g., experience-based views and understanding of the time and resources associated with permitting) from both U.S. industry project developers and federal and state regulators to provide data for evaluation. The evaluation was conducted to look for opportunities to create efficiencies in, and improve, the permitting process. The opportunities were modeled after the findings of the work (Kramer et al. [
3]) that identified the lessons learned from other similar industries.
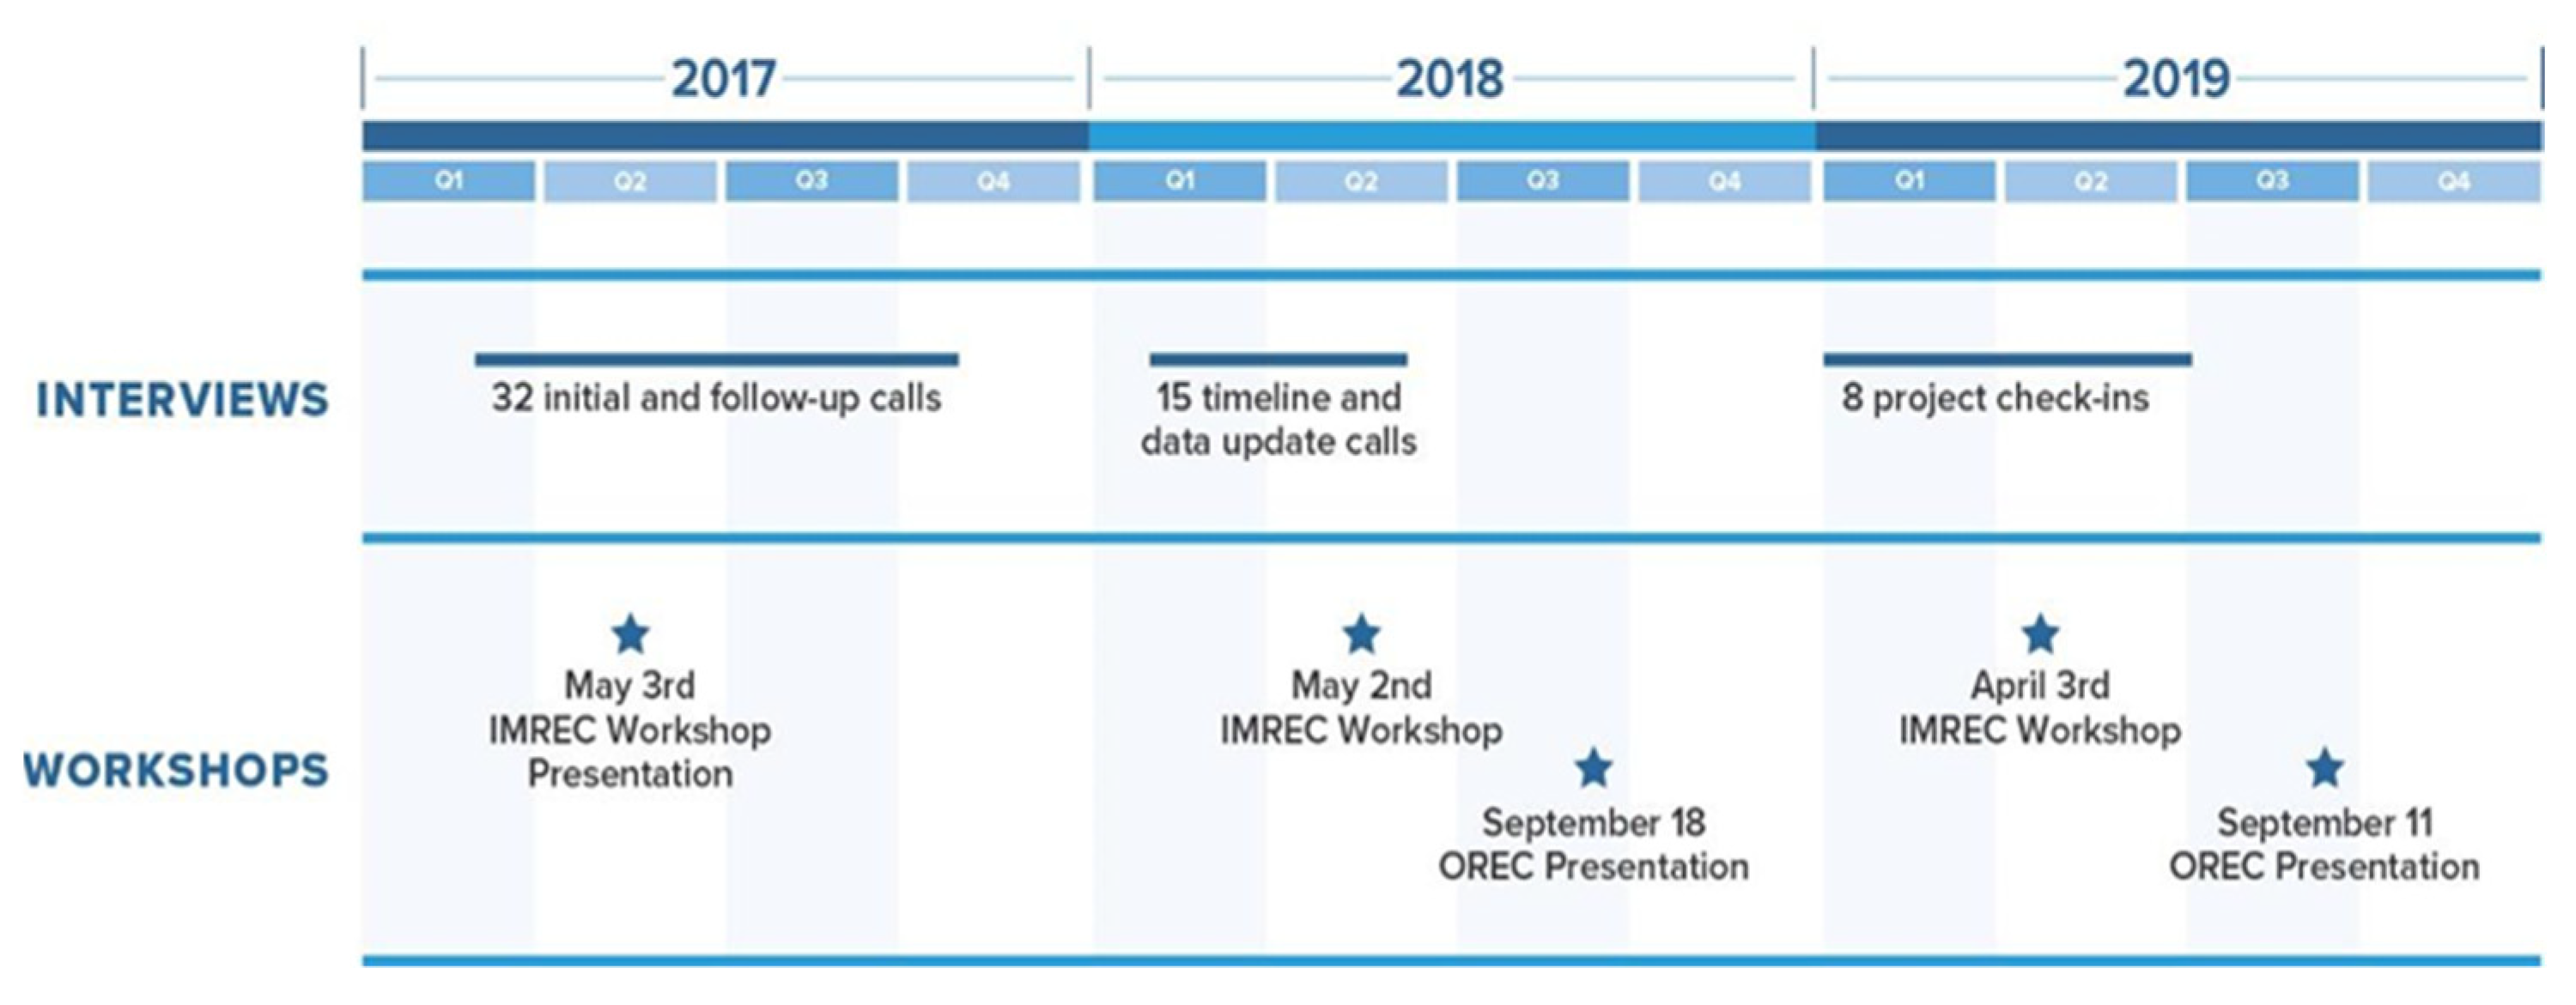
The data collected included overall project development costs as well as costs for marine energy licensing and compliance activities, including those associated with environmental studies, stakeholder outreach, baseline studies (pre-project site characterization), mitigation and monitoring, and adaptive management measures. In this article, “monitoring” is defined as a post-installation study that is conducted under a specific standardized protocol that is defined during consultation with permitting agencies during the permitting and licensing process. Although the developers and projects are noted in this paper, all cost data are aggregated to ensure confidentiality and protection of proprietary information. Data on costs and project findings were shared several times over the 3-year data collection period—in workshop environments and through one-on-one interviews—to enable the marine energy community to review and provide feedback on our findings and categorizations, helping to ensure accuracy and digestibility (
Figure 2). As part of our assessment, we compare actual cost data obtained and studies required to the baseline of studies proposed and cost estimates offered in the Reference Model work (Copping and Geerlofs, Neary et al. [
4,
5]). Though not a focus of this paper, the marine energy project permitting and compliance cost data, in coordination with the qualitative, experienced-based regulators and developers’ first-hand experience in permitting, were further analyzed to inform pathways that aim to create efficiencies and improve the effectiveness of the permitting and compliance processes.
3. Results
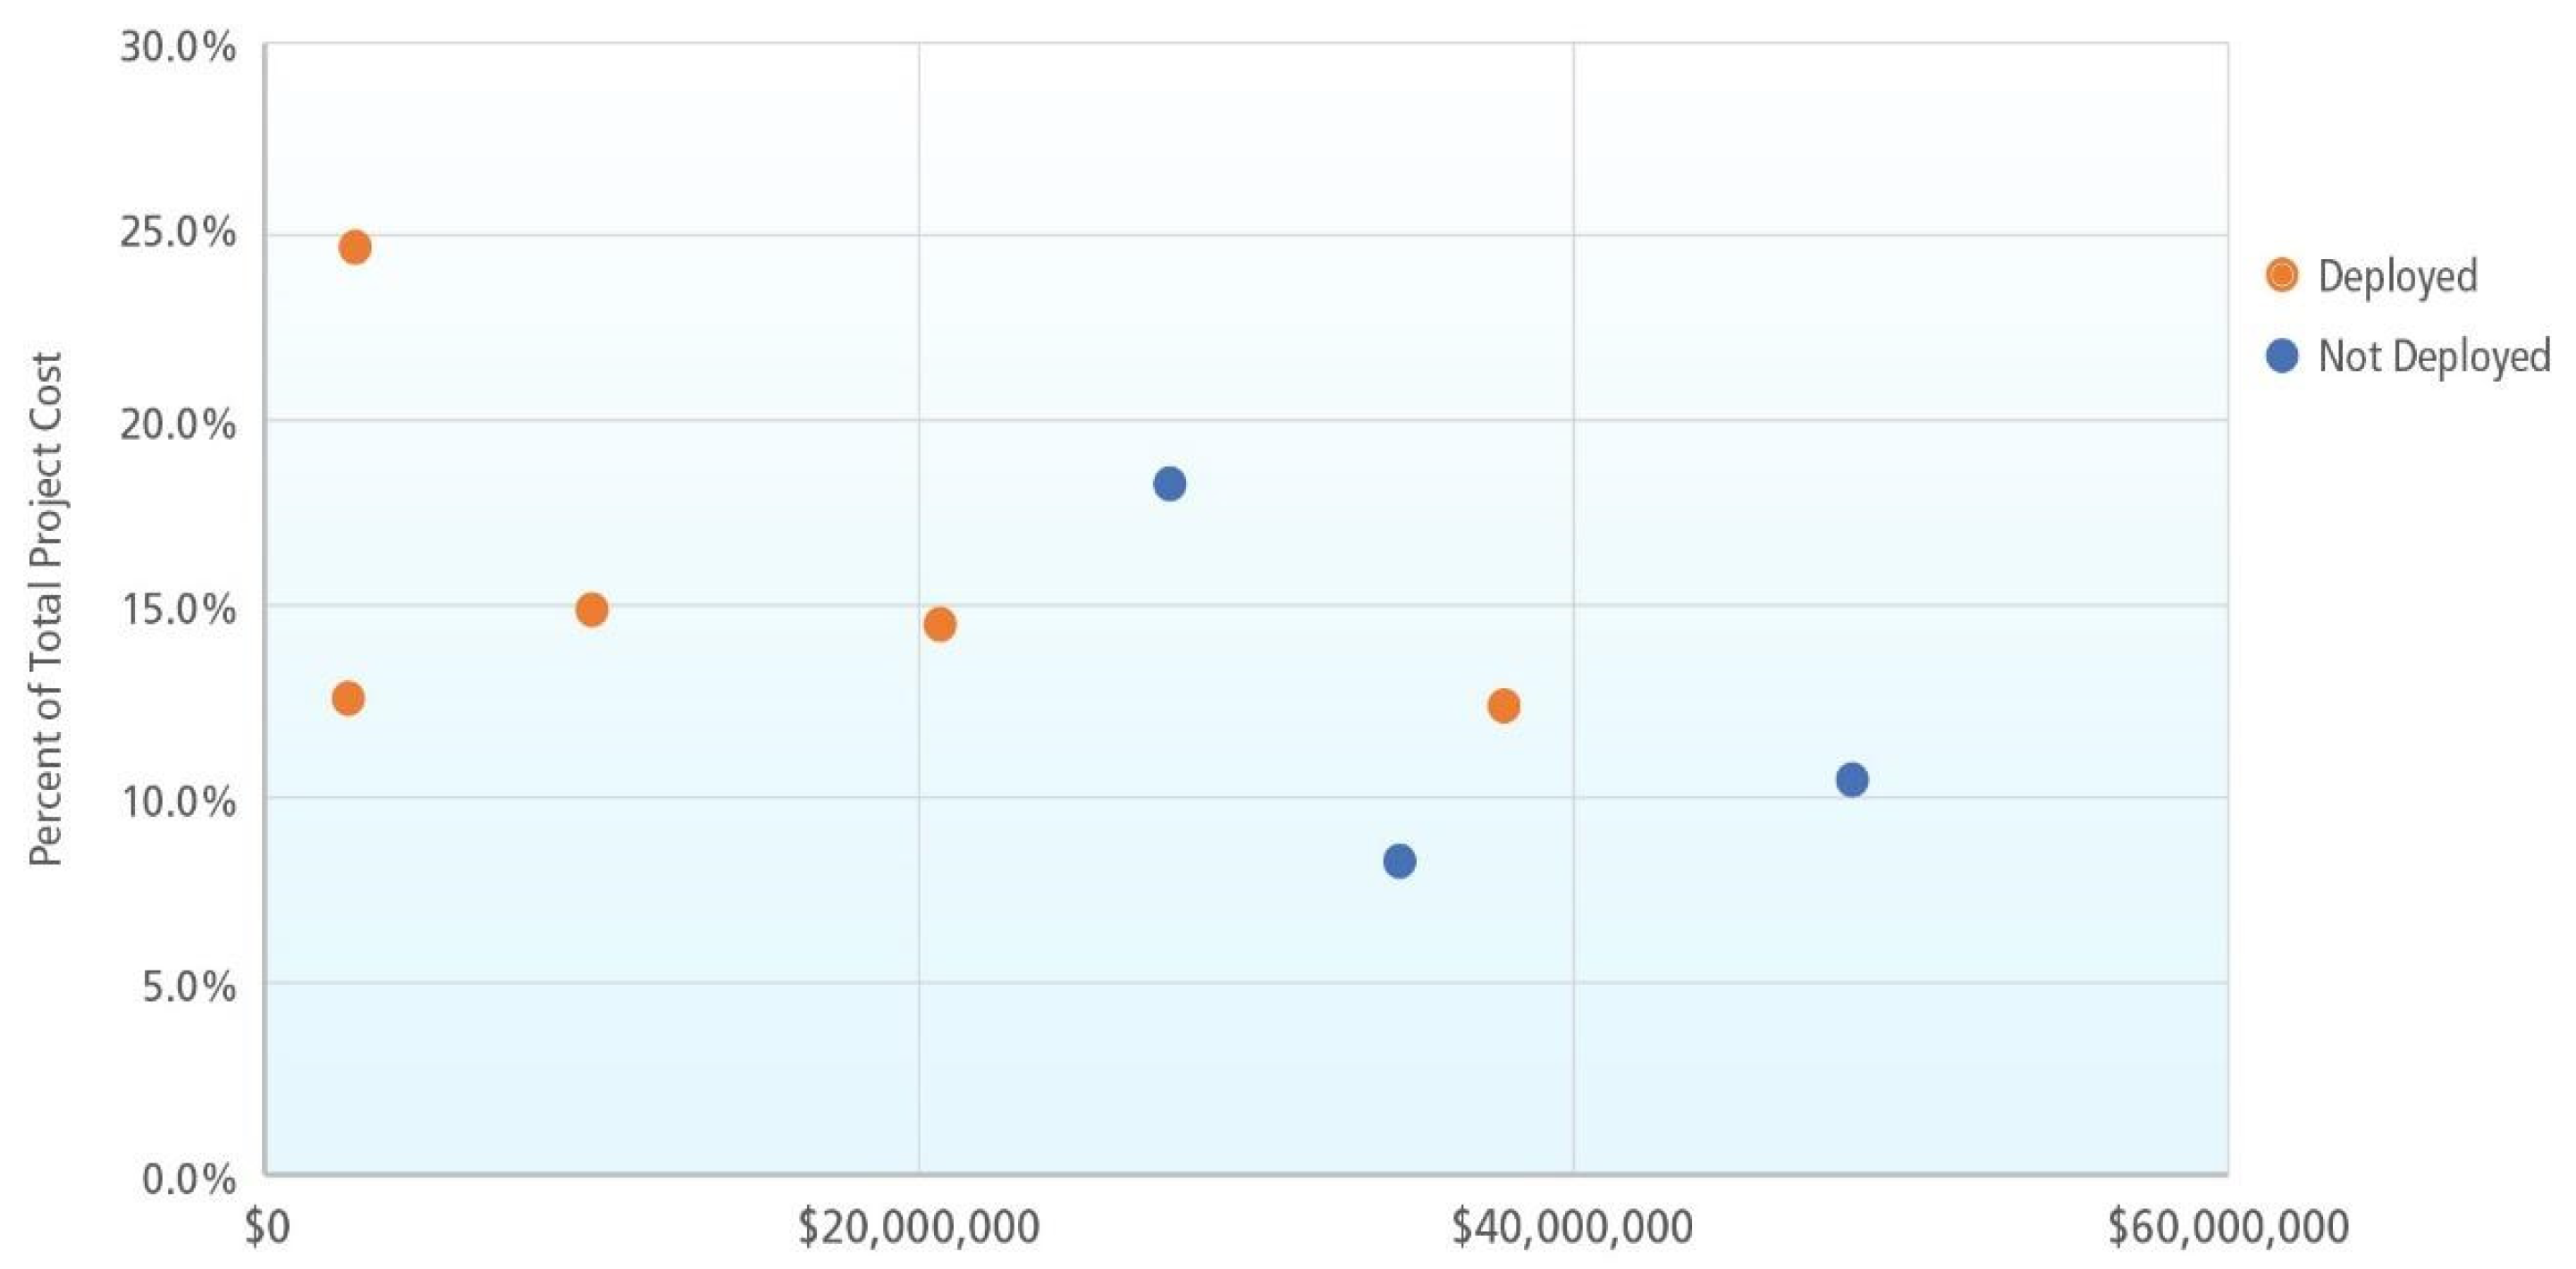
The question of how much of total project cost is dedicated to environmental permitting compliance is addressed in
Figure 3. Small projects, less than USD 5000, spent up to 25% of costs on environmental compliance whereas percentages decrease to 10%, or less, as projects increase in size up to USD 50 million. Only eight of the 19 sites reported a value for total cost allowing this calculation. The average percent of these eight is 14.6%. All of these projects successfully finished the permitting process. Additionally, of note, that these data are only a snapshot in time because one data point represents an active, non-deployed project that will continue to incur costs for production, monitoring, and compliance. If that site is removed from the calculation, the average percent increases to 14.9%.
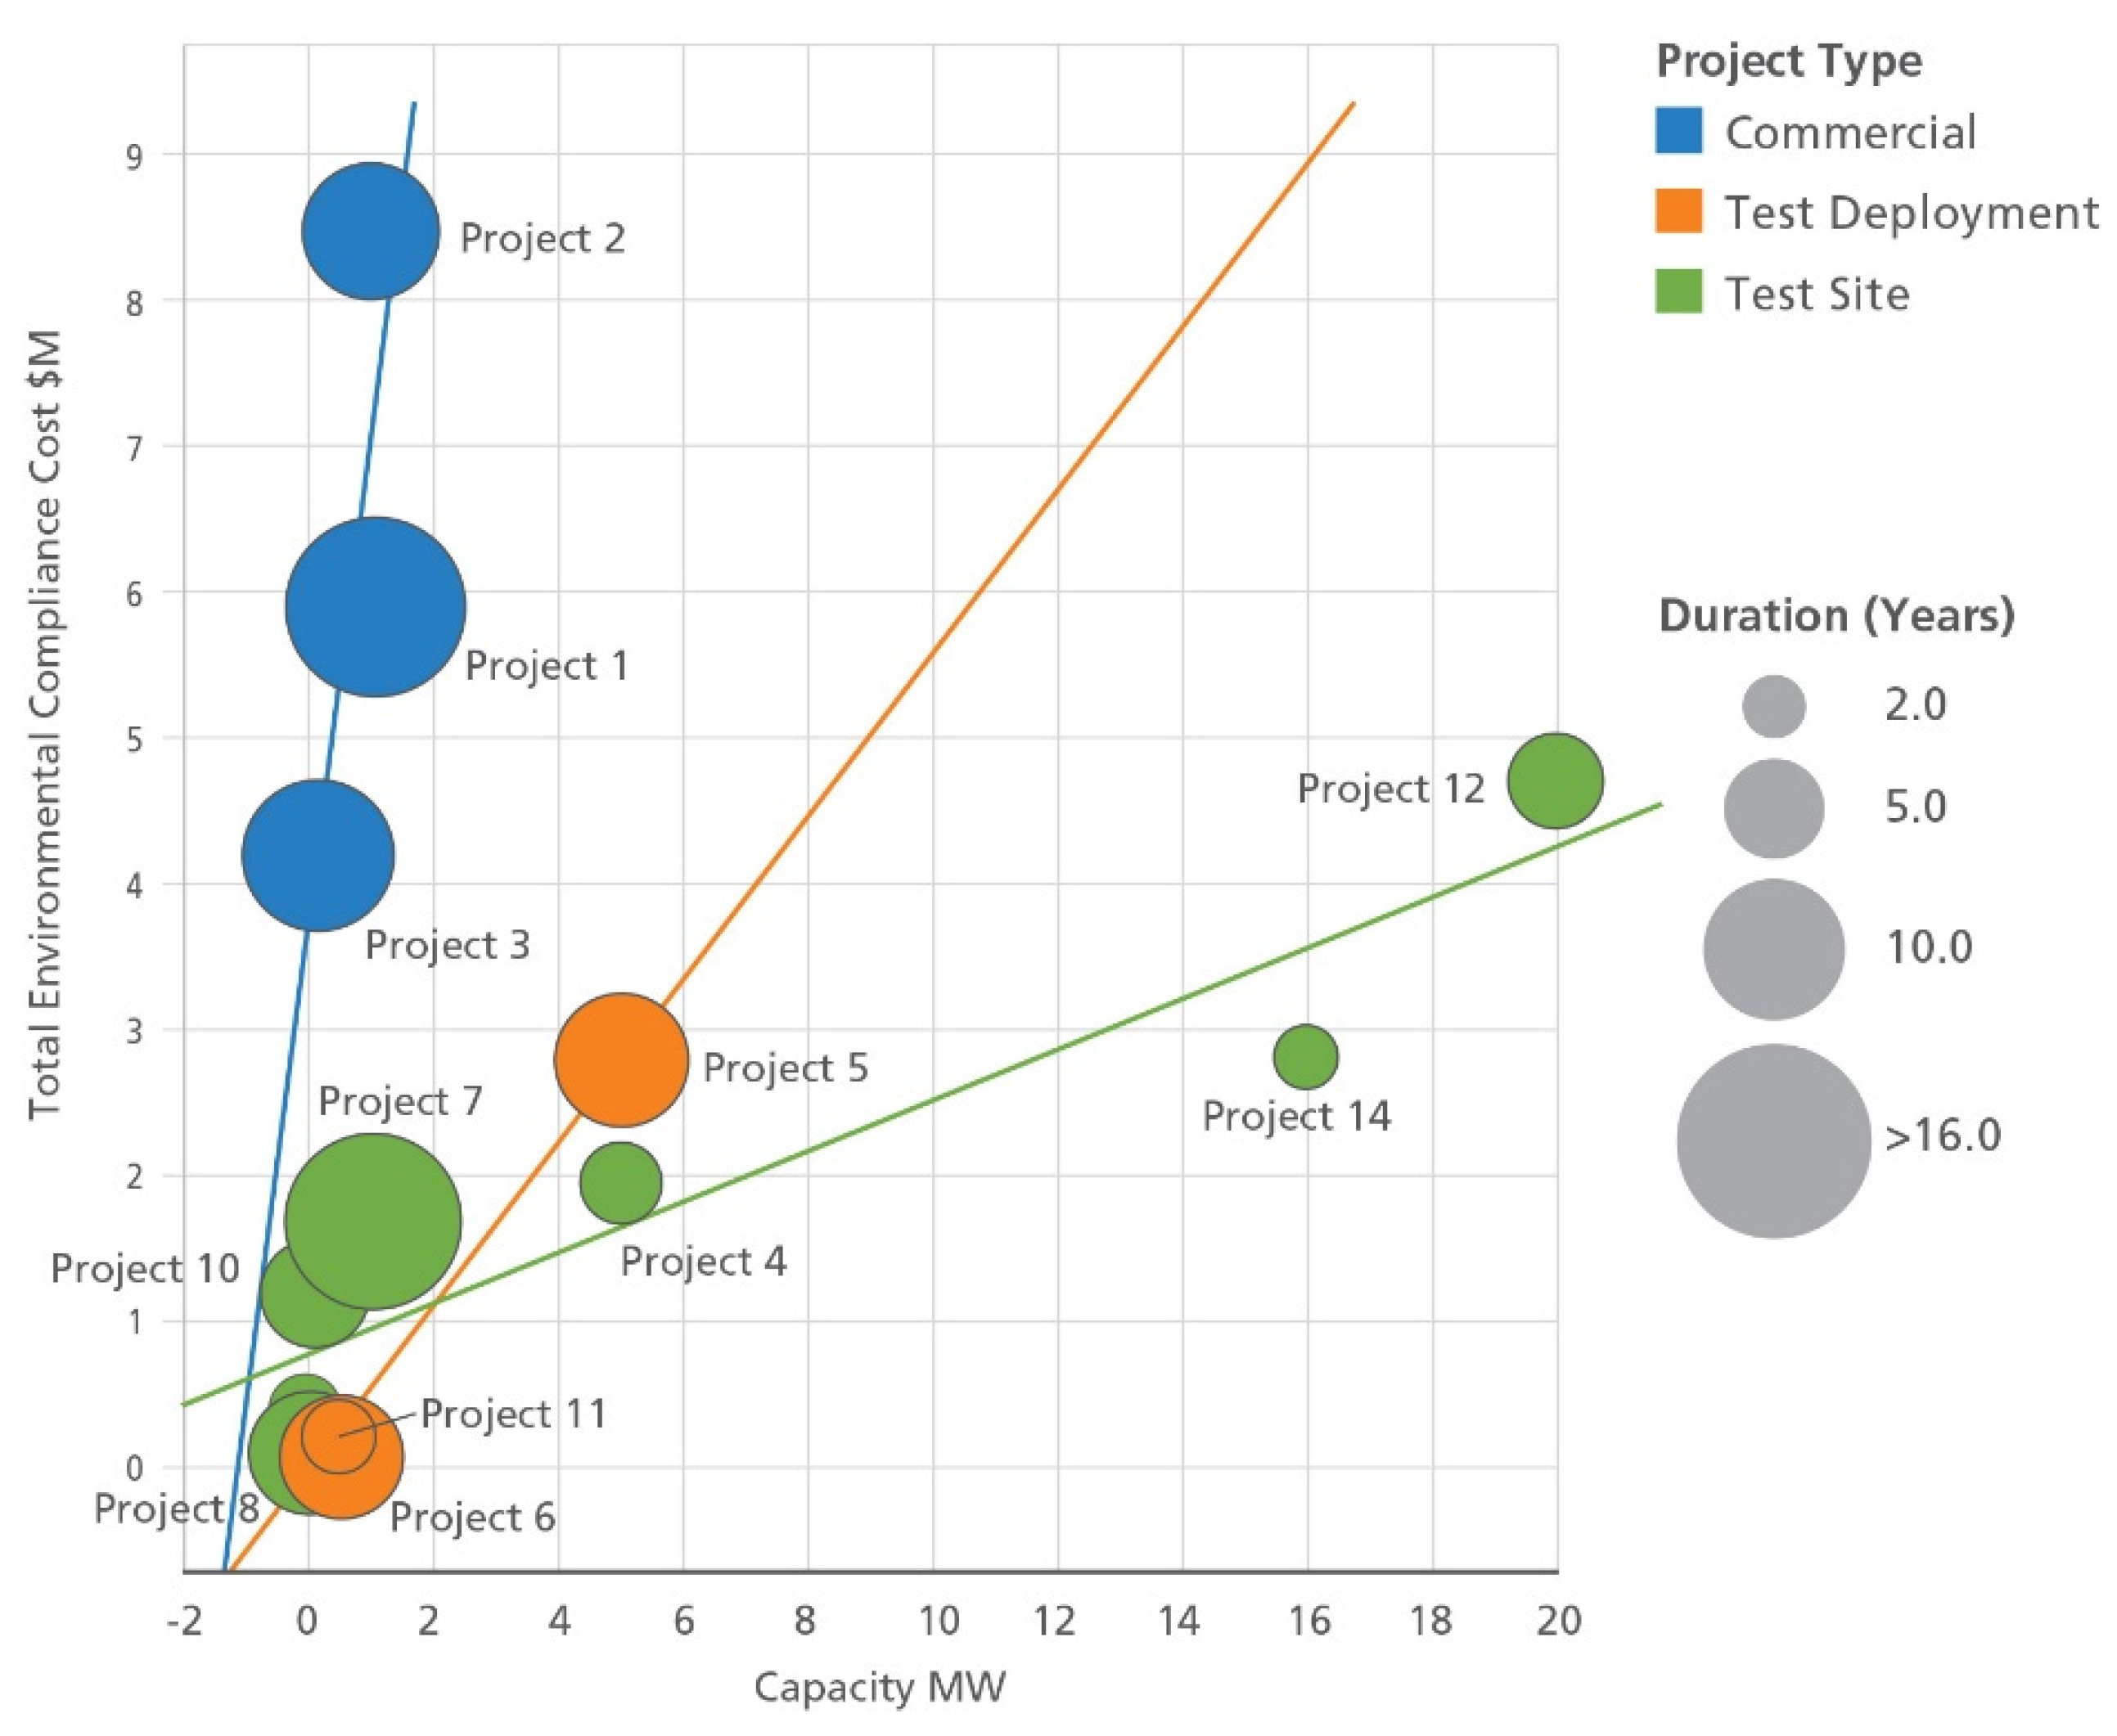
We compared the total environmental compliance cost of the projects, which included the total non-capital expenditures, with permitted production capacity of the analyzed commercial, test deployment, and test site projects (
Figure 4). The total non-capital expenditures for each project is the sum of the permitting/licensing costs, monitoring/compliance, and other costs (engineering, design, etc.).
The data for each project type were fit with a simple trendline to depict the general relationship between project types (e.g., commercial, test sites, and test deployments). Commercial projects are the most expensive and have relatively small production capacities due to their small scale. Capacities are anticipated to increase as the industry matures. Test sites have lower costs and some of them have been permitted with higher capacities. Test deployments have the lowest costs and have low permitted capacities, being clustered near the origin on
Figure 4, with the exception of Project #5.
The largest permitted capacity of the three commercial projects is 1.05 MW and has the highest total cost at USD 8.5 million (
Figure 4). All three commercial projects are tidal projects, and two are still in operation or development. One was terminated by the developer. Project duration ranged between 9 and 17 years at the time of data collection, suggesting considerable commitment by the project developers.
There is much more variability in test site project duration than that of the commercial sites, ranging from 3 to 16.7 years. The two longest project durations (i.e., the largest green circles in
Figure 4, Projects #7 and #8), did not incur the highest costs as they had relatively simple regulatory paths; our qualitative data suggest that of the three largest capacity test sites, two are no longer active (Projects #4 and #14), but five of the test sites represented in
Figure 4 are either active or in active development.
Test deployments are all clustered around the origin (
Figure 4, orange circles) with the exception of Project 5, a tidal project. Note that the environmental compliance cost for the tidal project is greater than that of the wave projects.
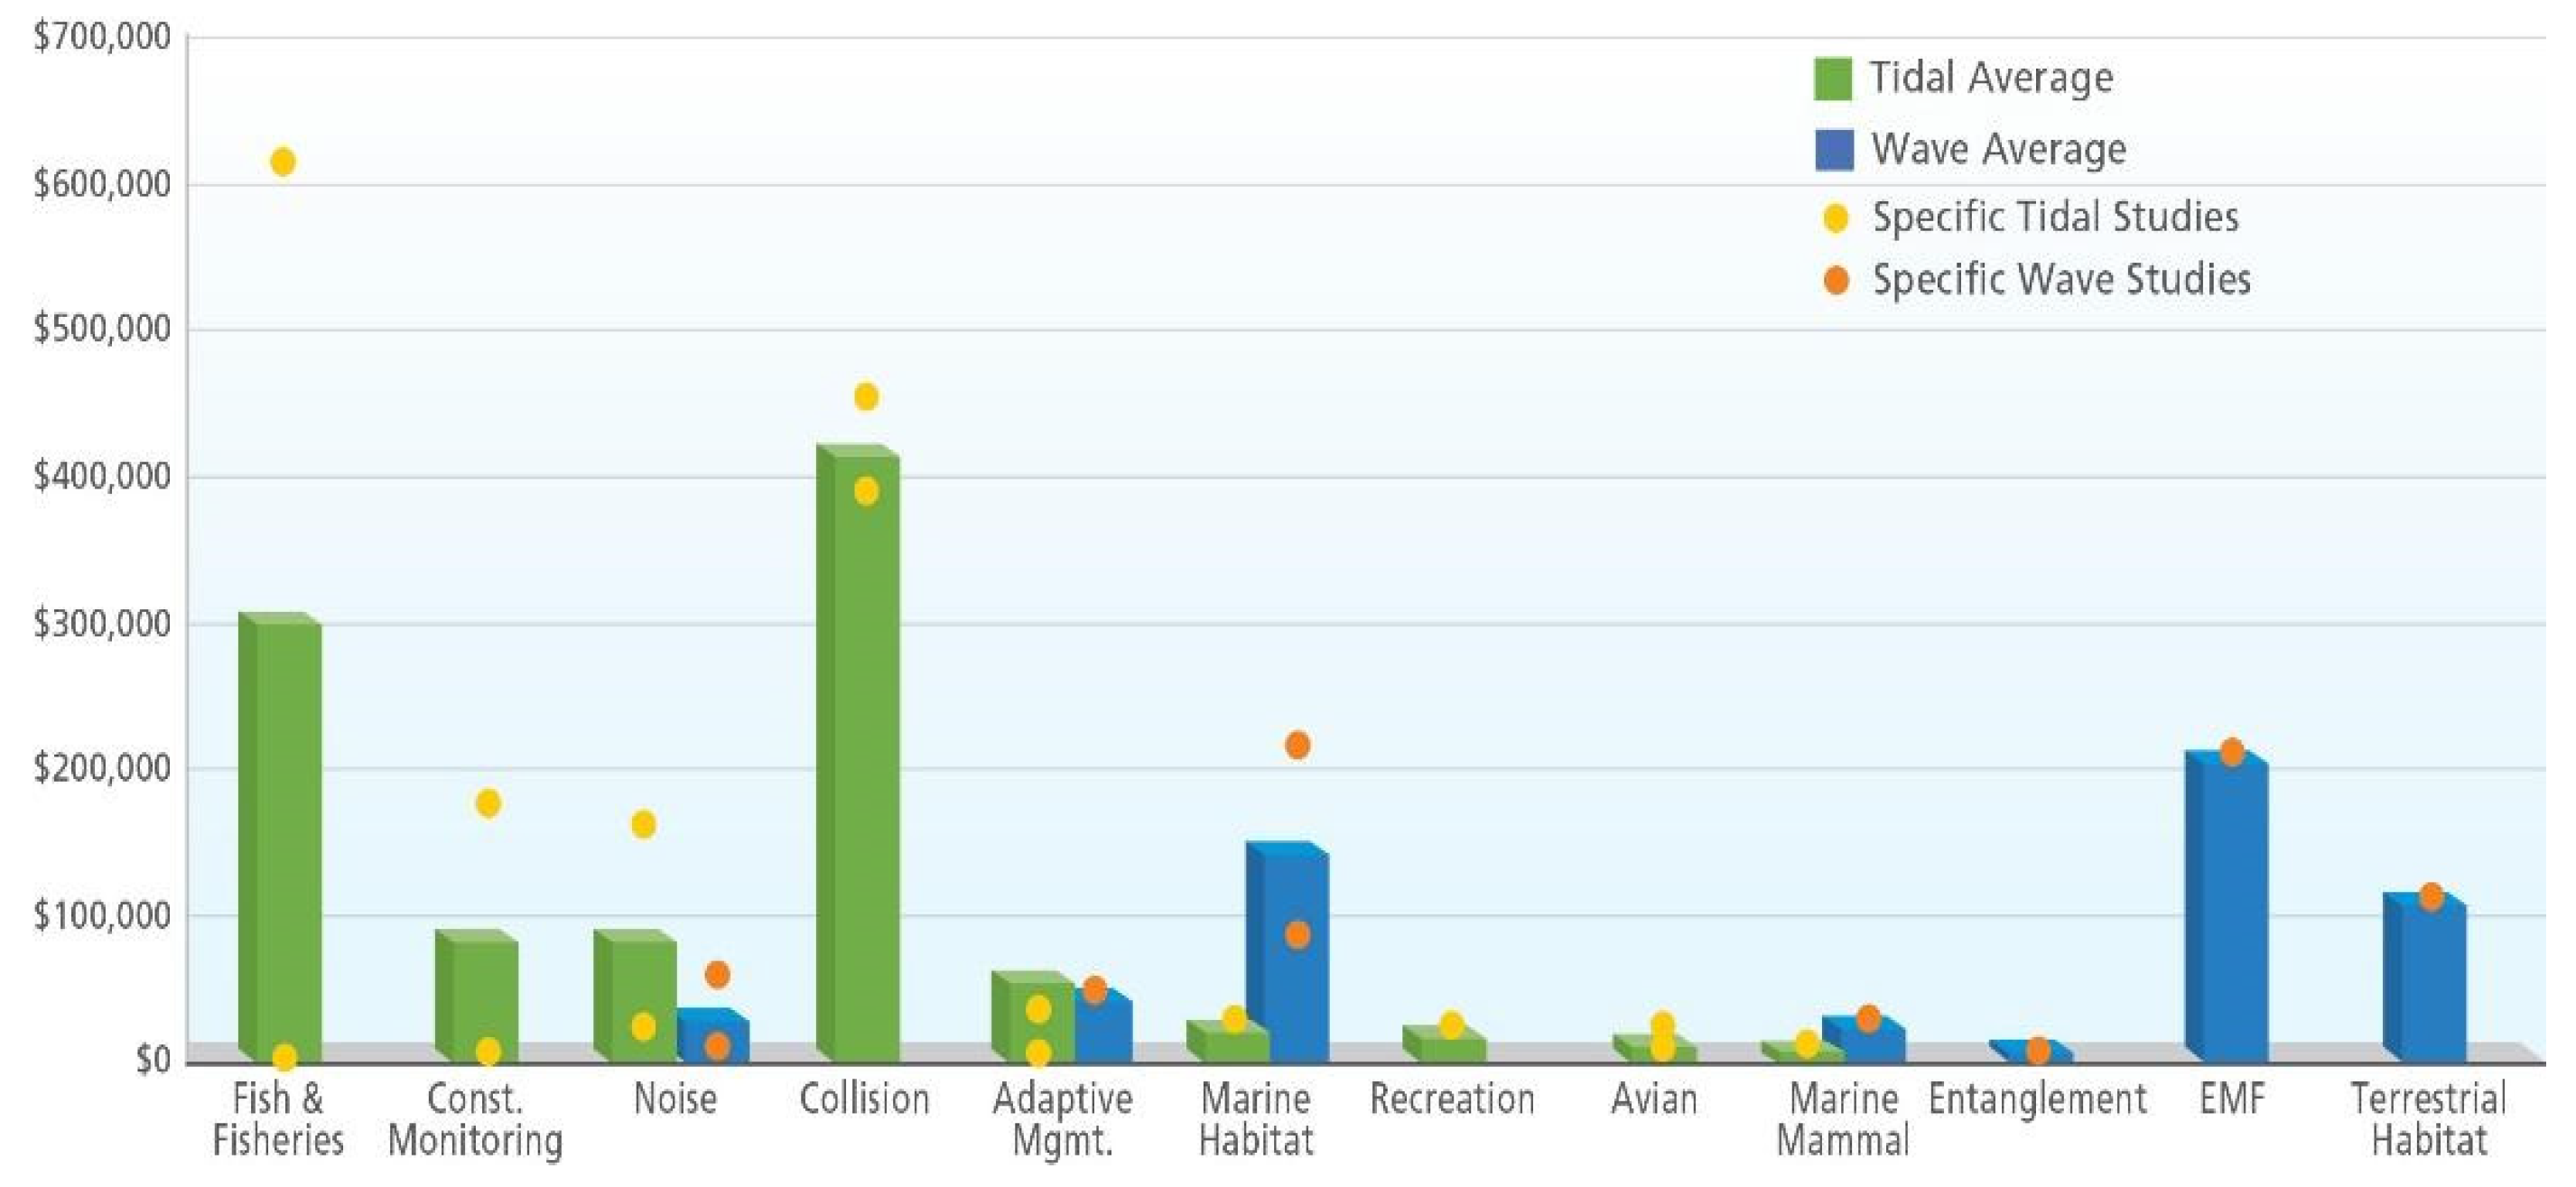
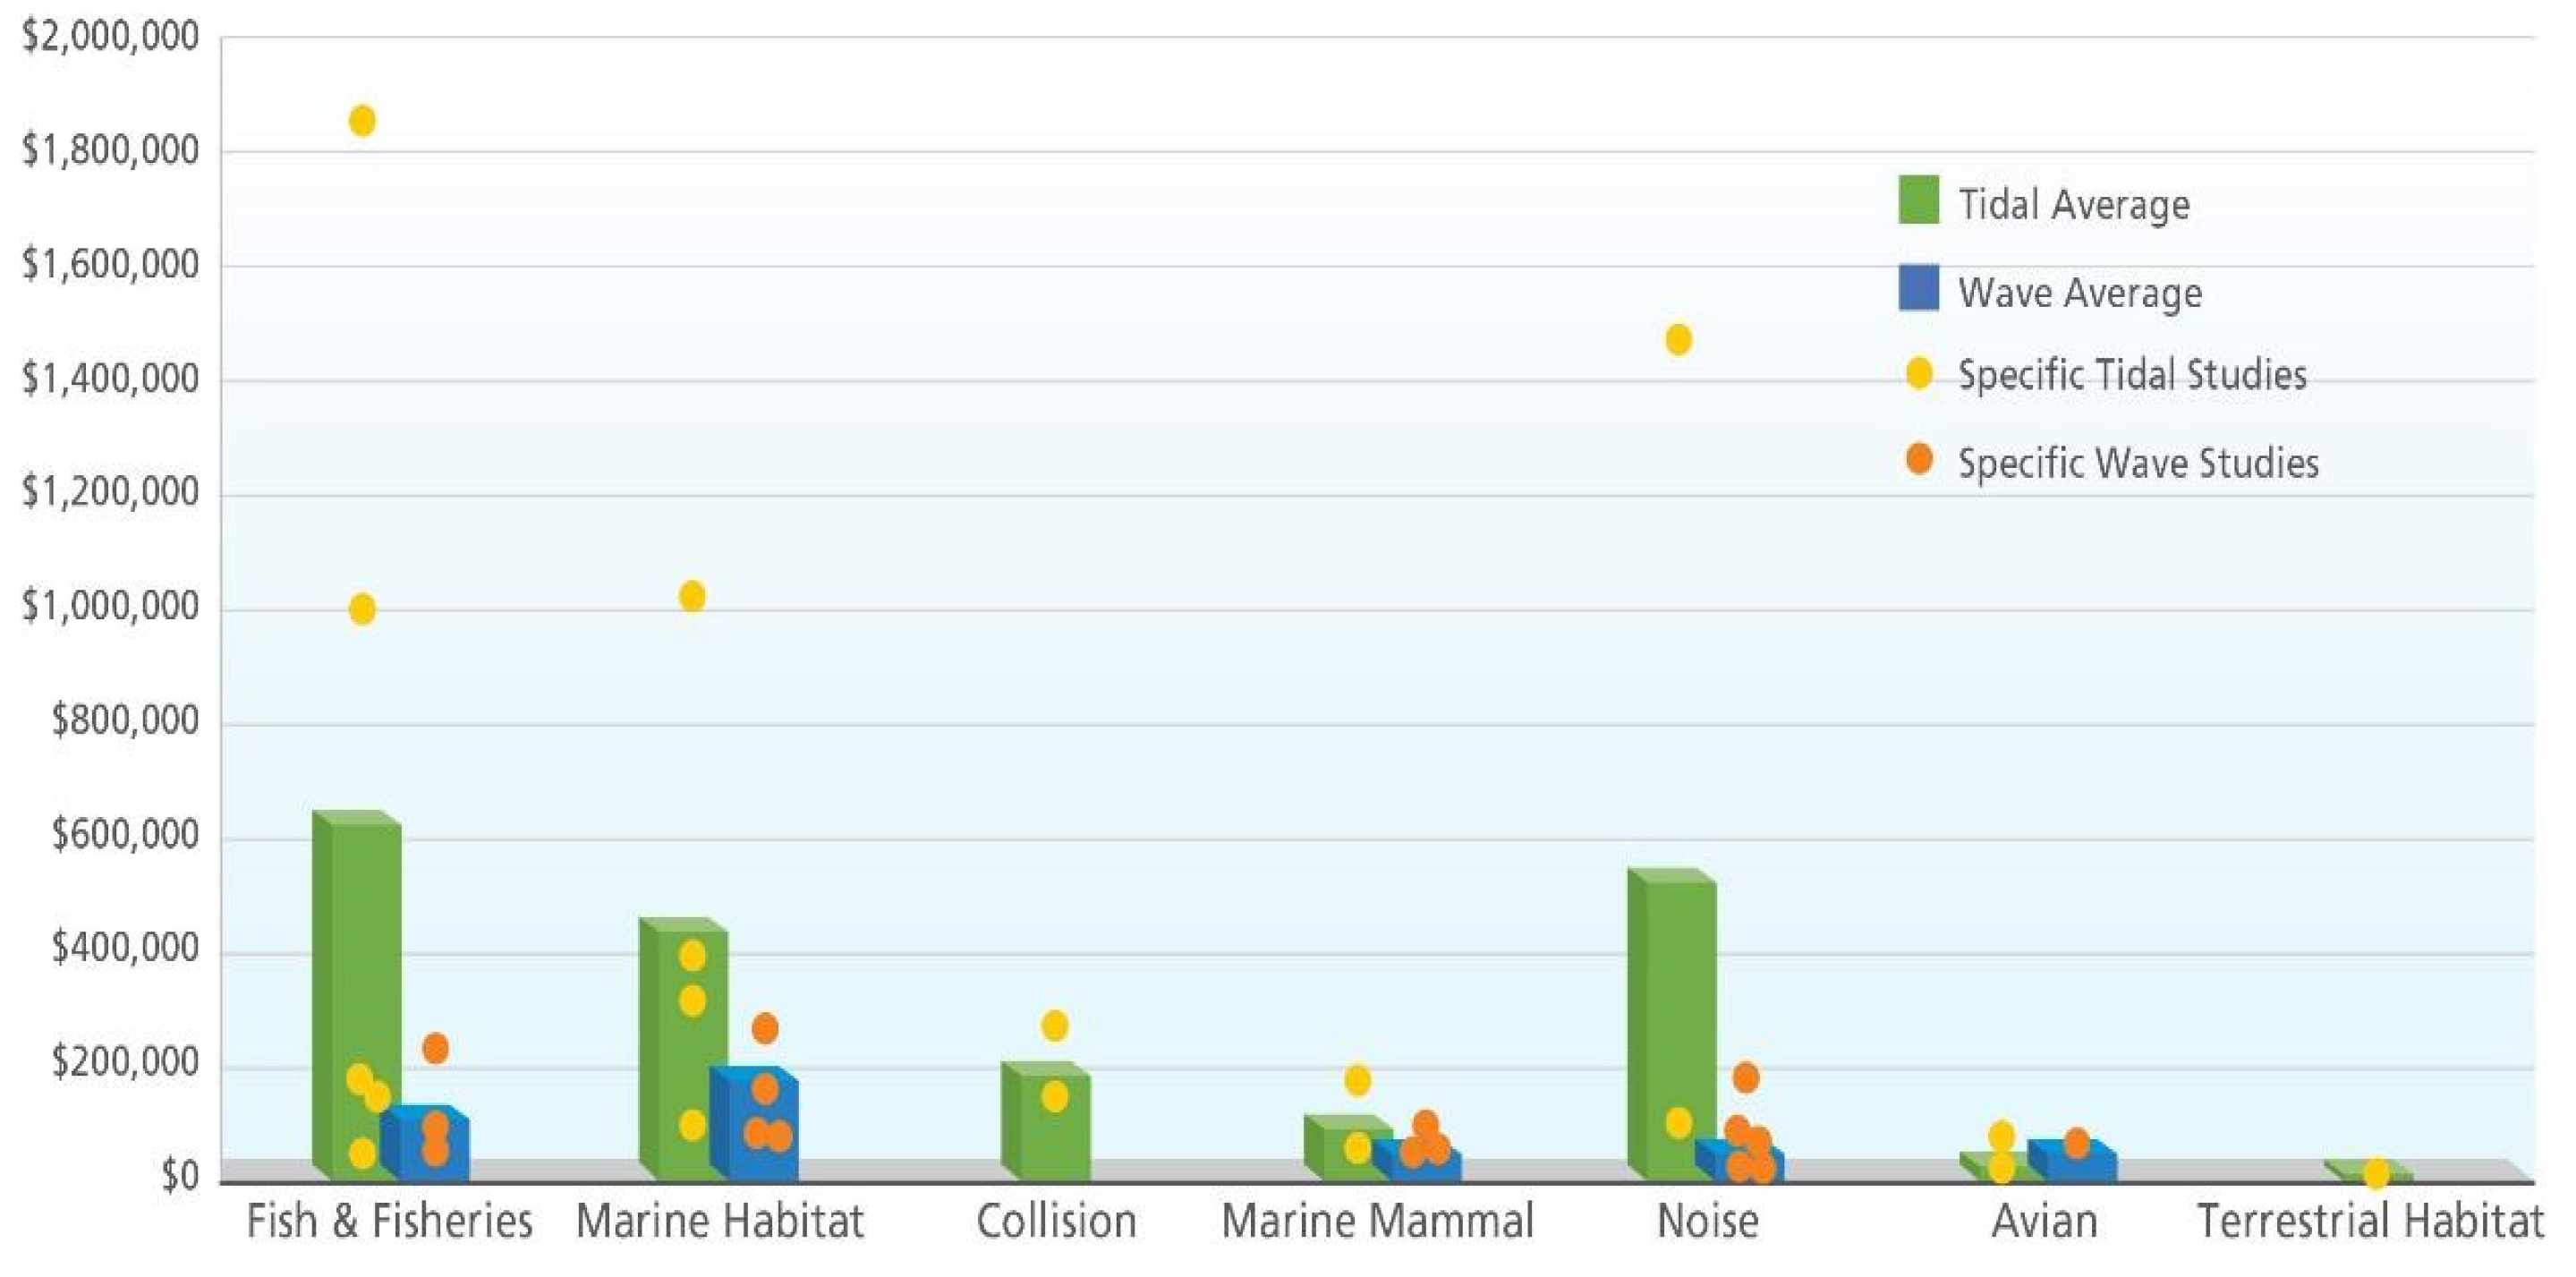
Environmental study costs for seven wave and five tidal projects, including wave project test sites, wave test deployments, and tidal projects (commercial and test deployments) were compared by study type (
Figure 5). Not all of the projects were required to perform the same studies but these seven study categories allow comparison. The most commonly performed environmental studies were: Fish and Fisheries (9), Noise (9), Marine Habitat/Benthic (9), Marine Mammals (6), and Avian = (4).
Study costs for tidal projects were generally more expensive than wave, which may be due to higher perceived environmental risks, differing environmental conditions, and uncertainties. The tidal projects category includes long-term commercial projects and challenges to monitoring in high-velocity tidal habitats (
Figure 4 and
Figure 5). The paucity of published studies in high-energy tidal environments leads to a general lack of knowledge and higher regulatory uncertainty (Sparling et al. [
15]), therefore increasing costs of baseline studies.
Further, the tidal projects presented are predominantly commercial deployments (3 of 5), which may also result in increased costs compared to the wave test sites and test deployments (there are currently no U.S. wave energy commercial deployments). Fish and Fisheries, Marine Habitat, and Noise studies are the largest average expenditures for both tidal and wave projects. For wave test deployments the only studies conducted were for Noise, suggesting that evaluating device noise is an important requirement for regulatory agencies.
Three tidal projects (Projects 6, 8, and 19) studied fish species behavior and distributionto inform possible interactions with the tidal turbines. These Fish and Fisheries studies conducted for tidal projects are the most expensive study category, with their percentages of total permitting and licensing costs ranging from 7% to 75%.
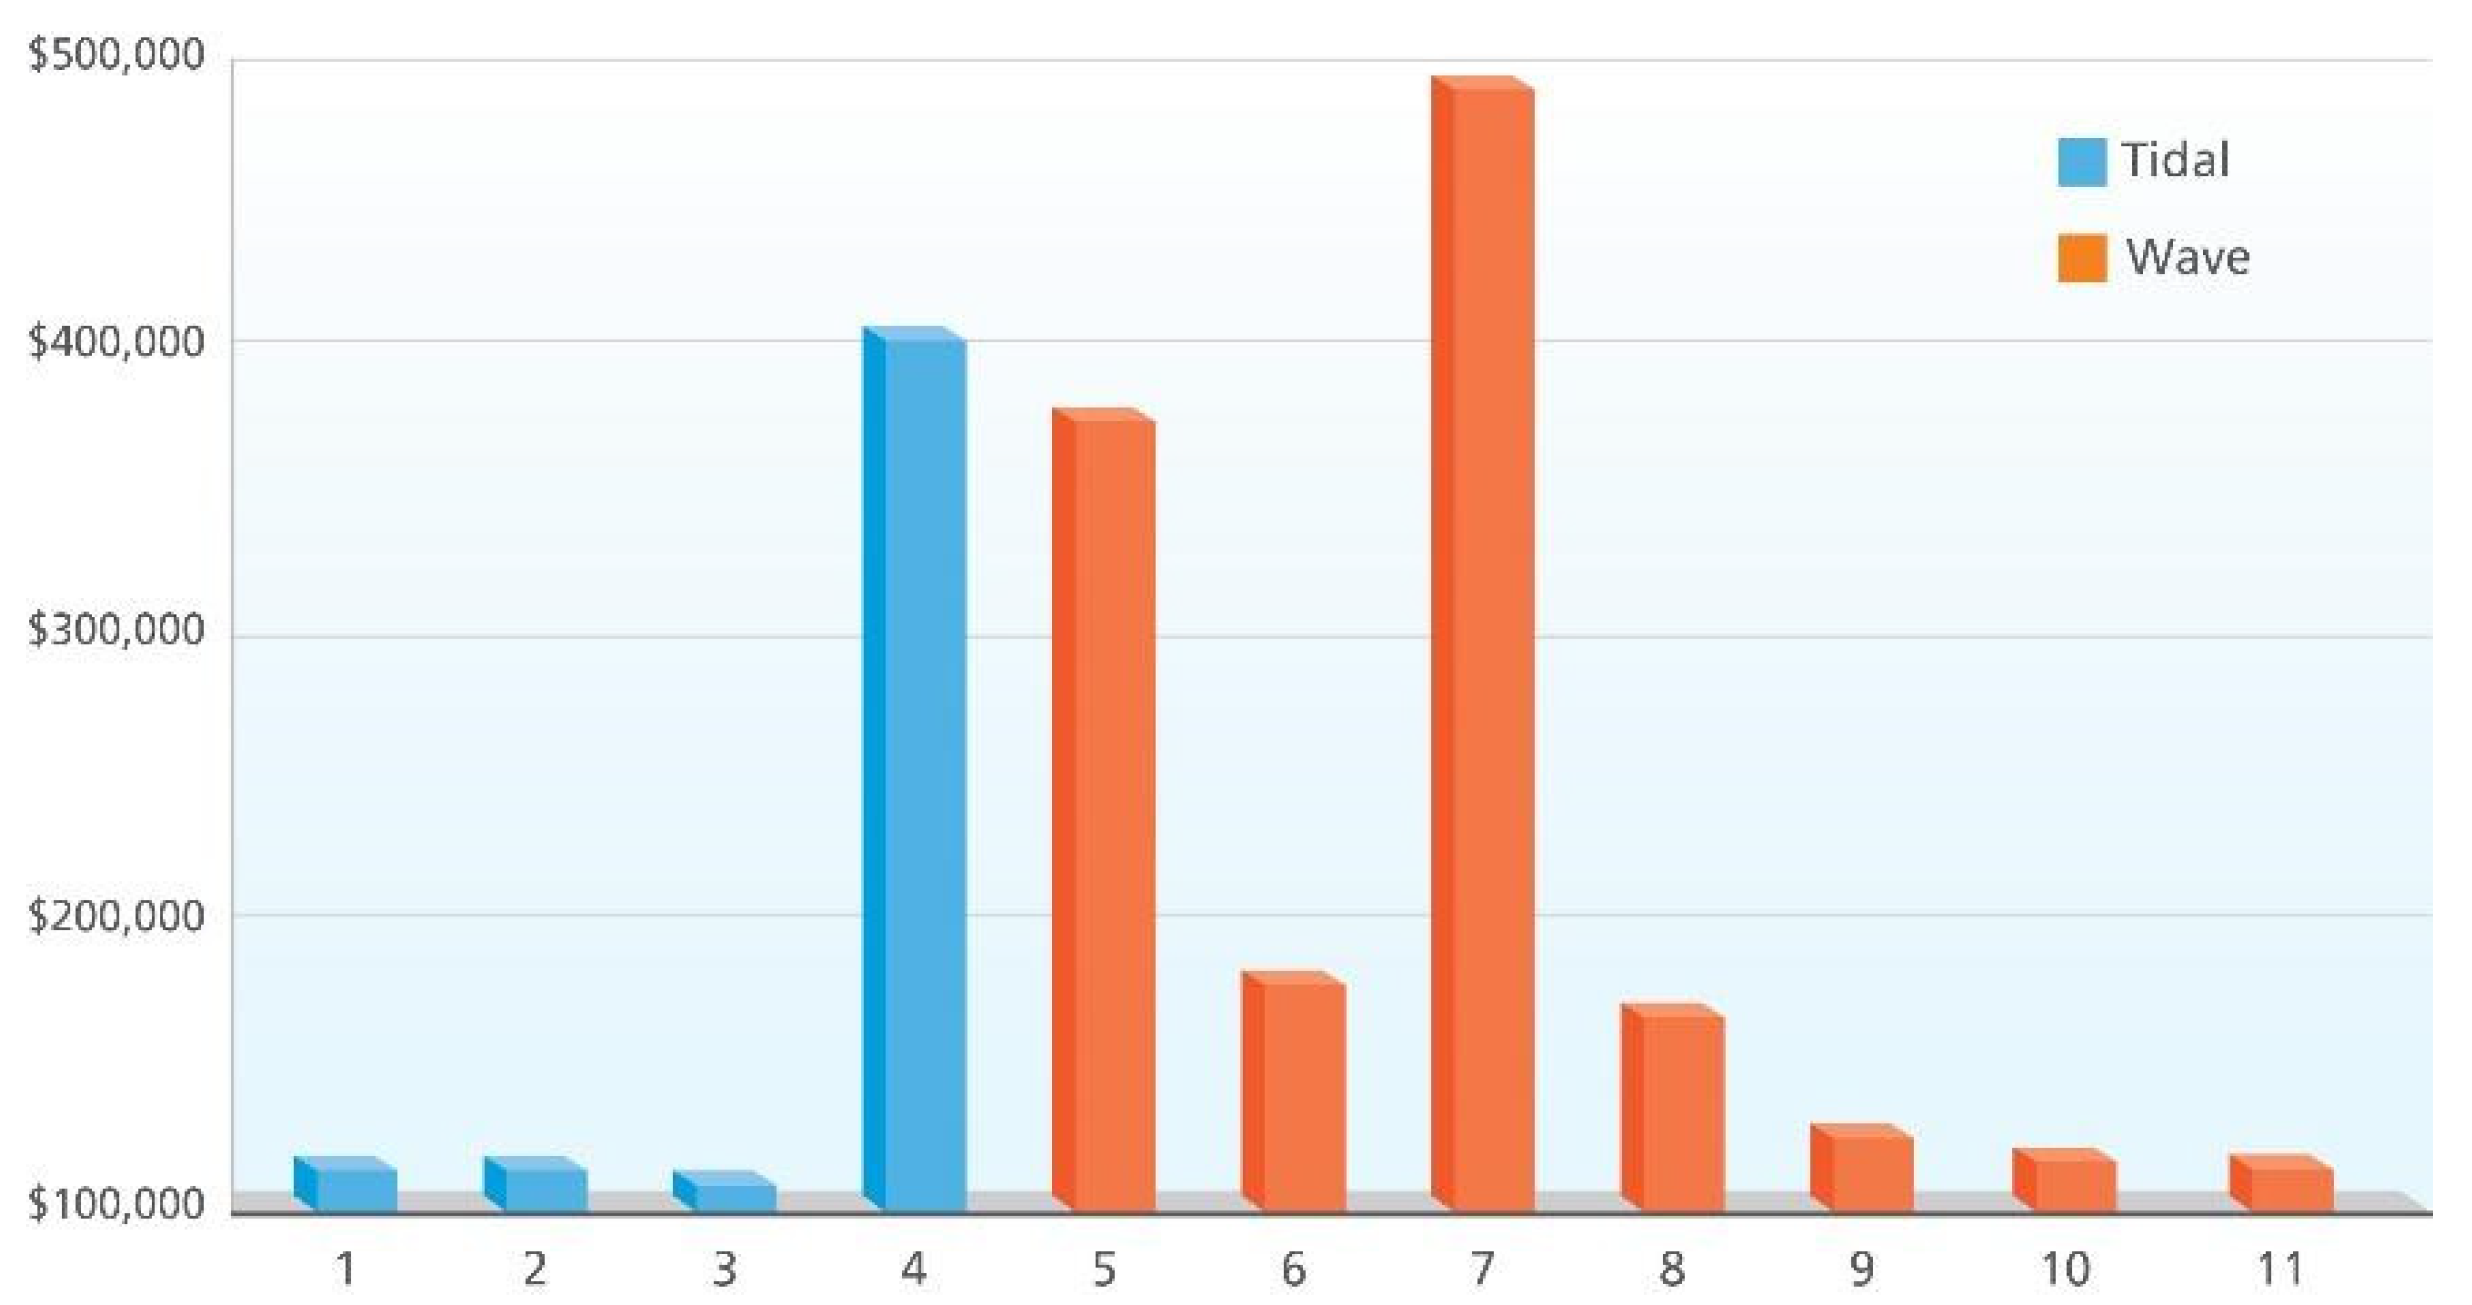
Environmental studies done for post-deployment device monitoring and compliance were evaluated for three wave and three tidal projects (
Figure 6). Wave and tidal projects did not always conduct the same post-deployment monitoring and compliance studies, but noise, adaptive management, and marine habitat studies were conducted for both. Collision study costs, incurred by the three tidal projects, had the highest cost average and variability. The highest cost Collision study is not shown in
Figure 6 because its value at USD 2.9 million is an outlier; including it raises the Collision study average value from USD 421,000 to USD 1.257 million. This one high value is from permit-required monitoring that necessitated high research and development costs to pioneer study methods and instrumentation. These costs were borne by the developer and DOE, but the research (e.g., new methods and instrumentation) will contribute to reduced costs in the future. Certain studies (e.g., Recreation and Avian) had lower costs.
The three highest cost categories for tidal projects were Fish and Fisheries, Collision, and Noise. As a percentage of the project costs for post-installation studies, these categories averaged 52%, 58%, and 9%, respectively. The three highest environmental study costs for wave projects were Electromagnetic Fields (EMF), Marine Habitat, and Terrestrial studies to support onshore grid connection. Again, as a percentage of the project costs for post-installation studies, they averaged 57%, 39%, and 32%, respectively.
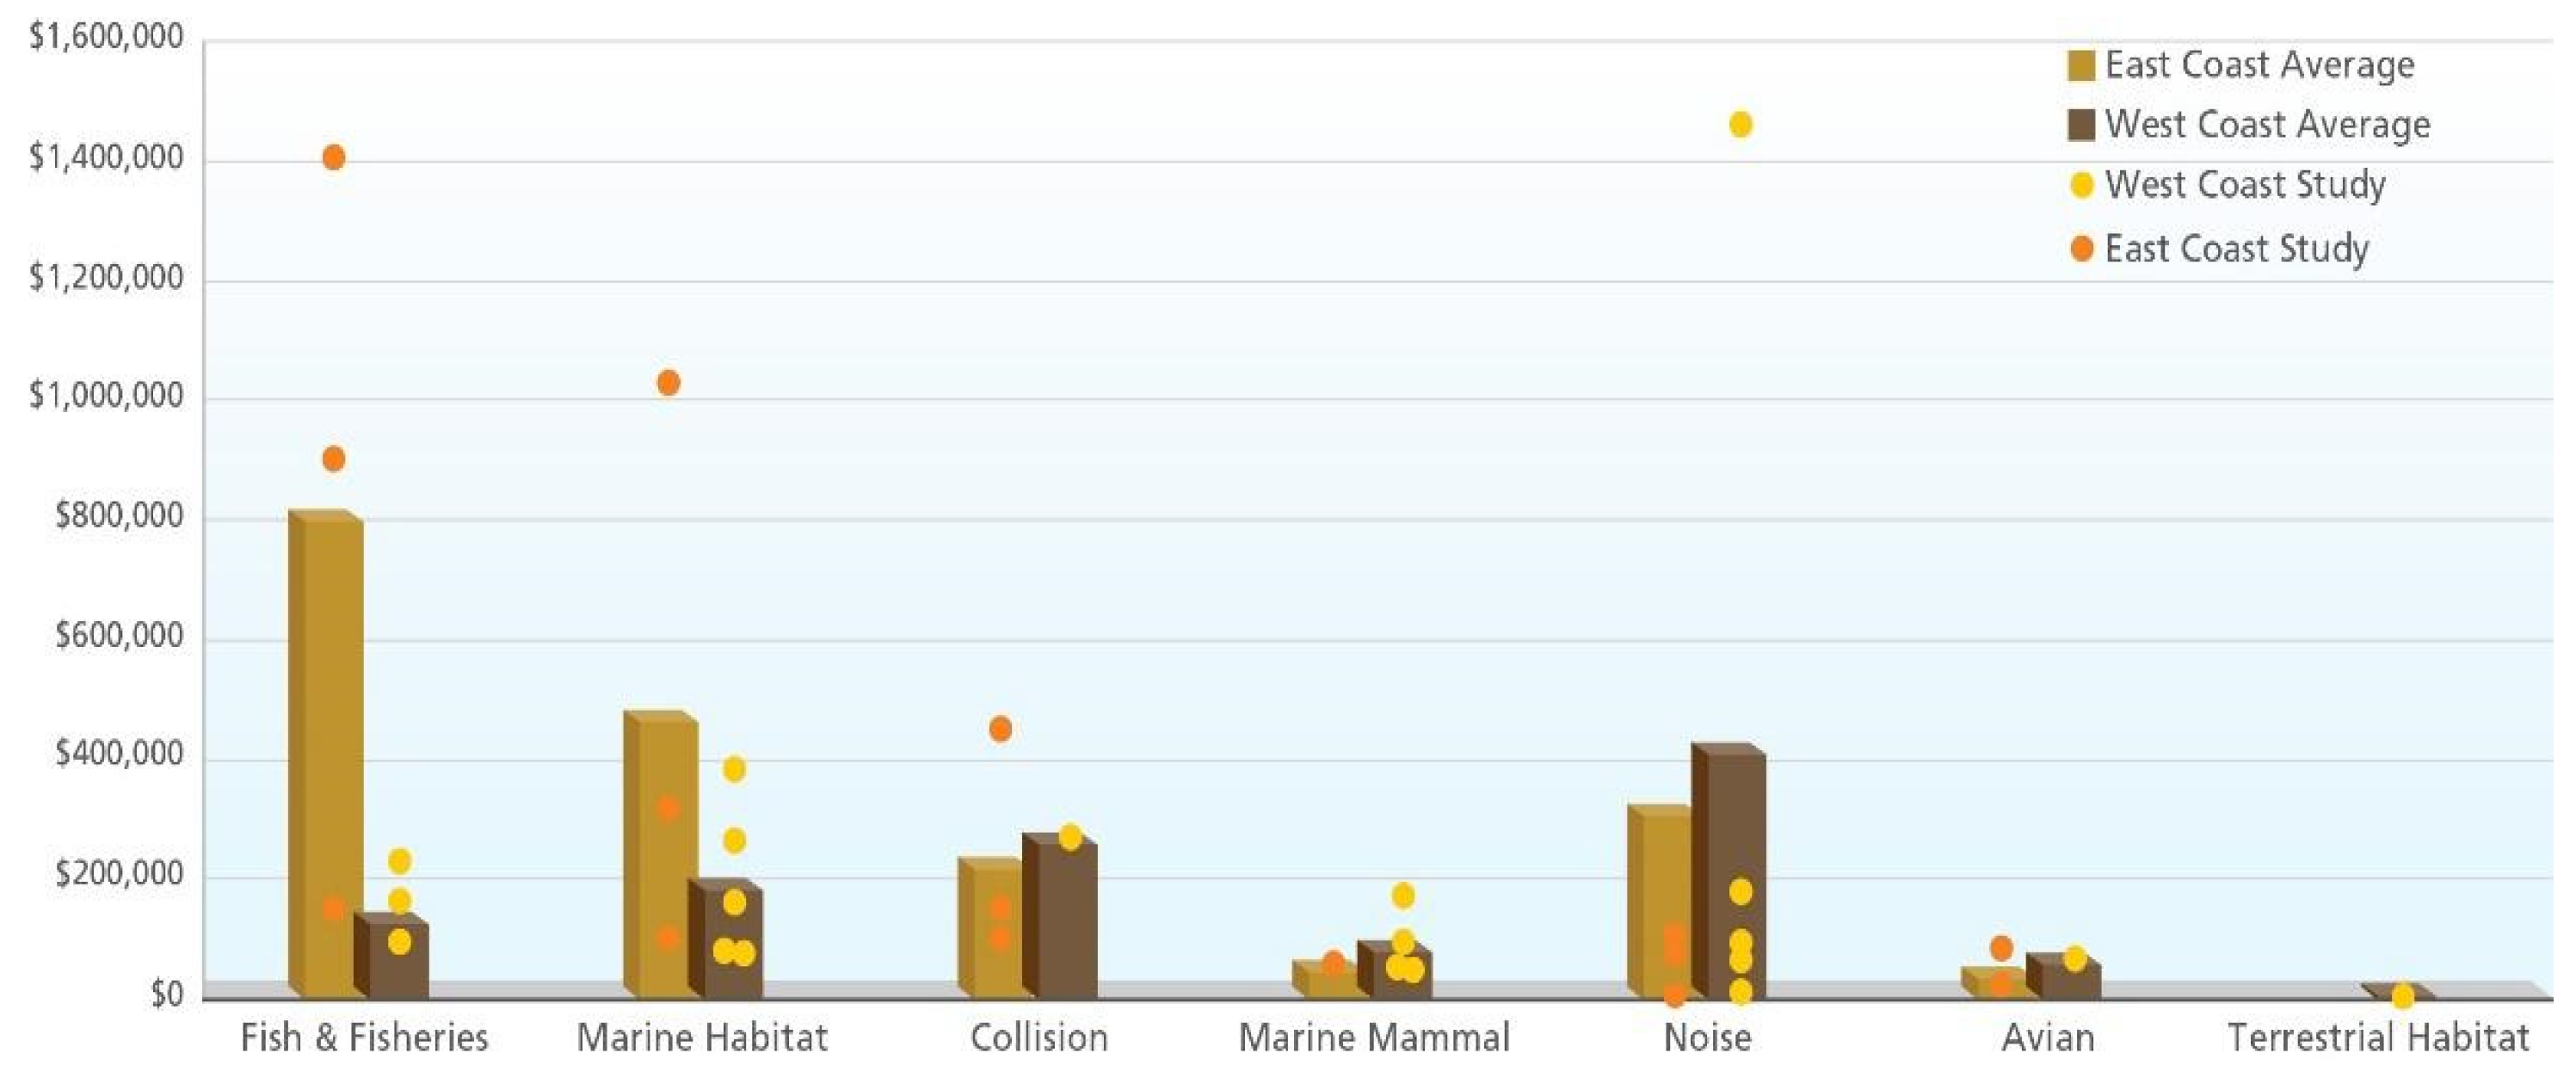
Environmental studies in support of permitting were costlier on average for Fish and Fisheries and Marine Habitat studies conducted for projects on the East Coast compared to projects on the West Coast (
Figure 7). This is likely because East Coast projects are mostly tidal, which, as discussed above, have greater environmental uncertainties and are typically more expensive to evaluate in general. Costs for Noise studies were higher for West Coast projects than East Coast projects and that trend is maintained when considering project percentage. Several smaller studies spent 100% of their permitting budget on noise studies, driving the averages to 35% on the East Coast and 51% on the West Coast.
Costs for meetings and public outreach were considerable for several projects as well, as shown in
Figure 8.
Analysis of outreach spending suggests that wave projects spend more on public interaction than tidal energy projects. Project funds spent on public outreach and education varied from USD 8000 to USD 500,000, with 11 of the project efforts reporting, but just four sites spent between USD 84,000 and USD 500,000. There could be several reasons for the tendency of high cost wave projects. Wave projects may have a larger footprint and therefore a greater interaction with local fisheries. Wave projects are typically moored to the bottom, raising the perceived risk of entanglement or entrapment of cetaceans, and there may be local concerns about EMF due to long export cables running along the bottom from arrays anchored farther offshore.
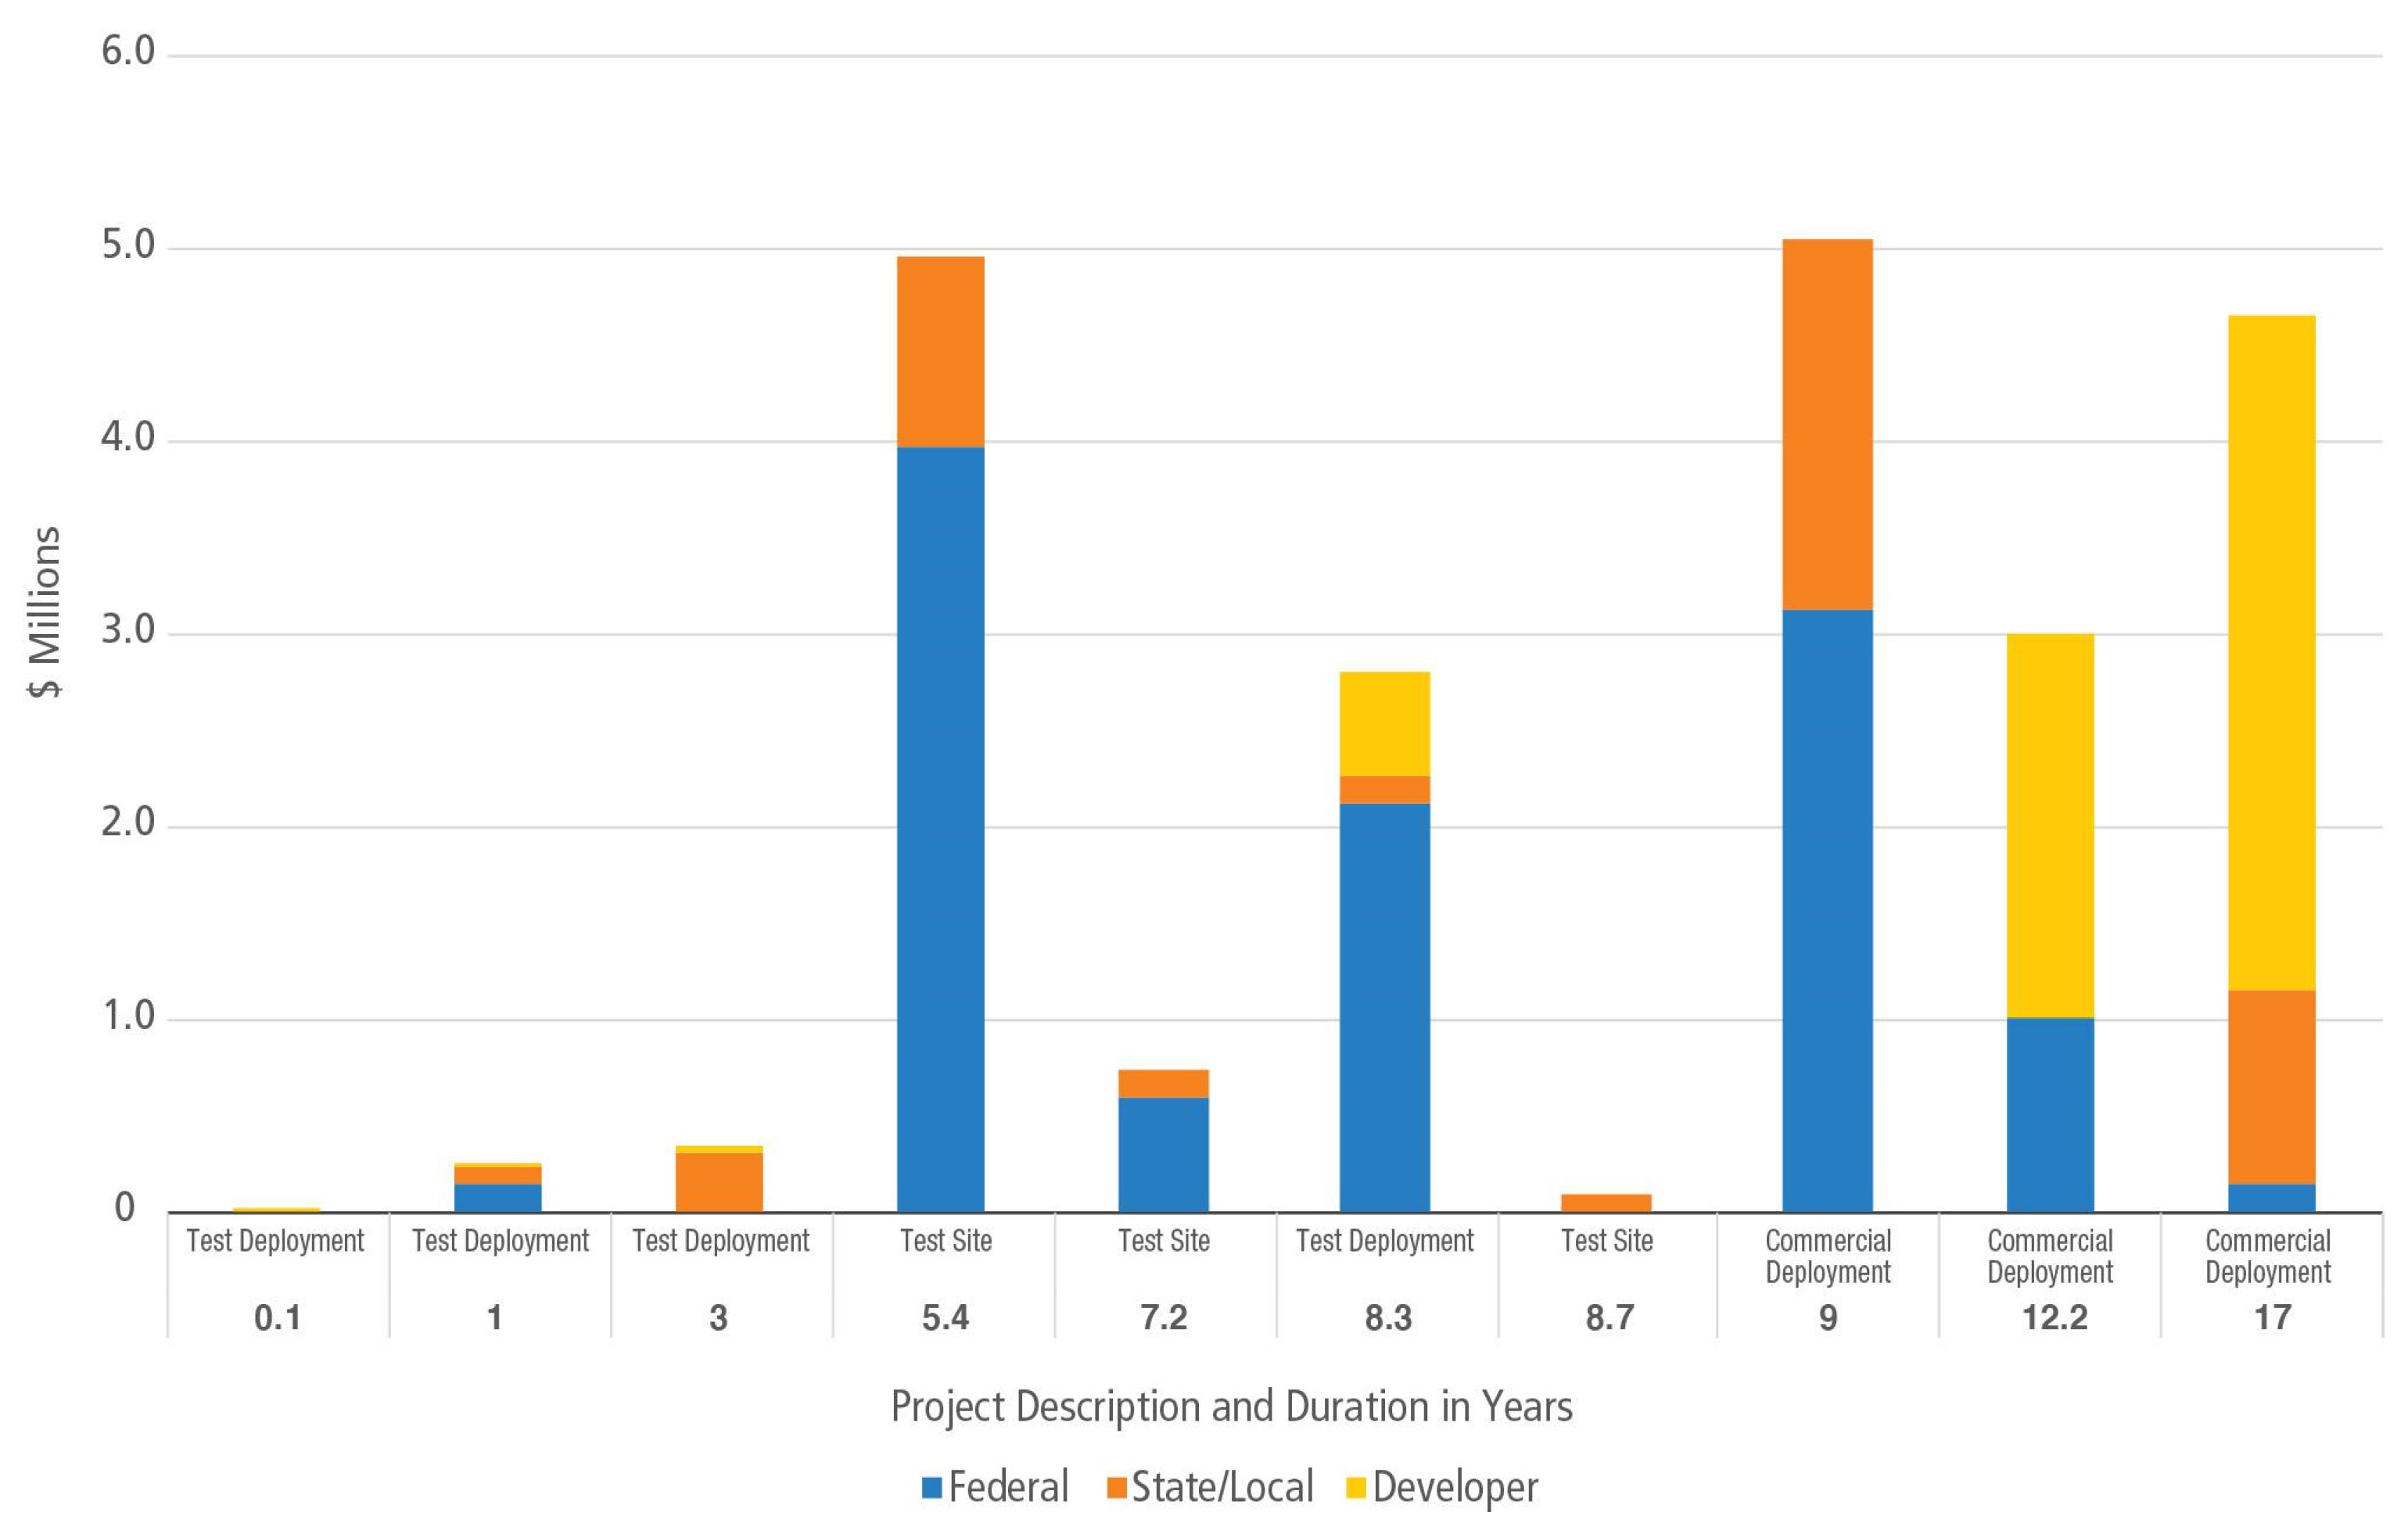
Sources of funding changed over time for 10 ME projects, with data reported in 2019 (
Figure 9). Project compliance duration in years is shown as the number below each bar. The longest duration projects received a majority of their funding for environmental permitting costs from private developers, with some federal and state support. More recently, a much higher percentage of state and federal funding was used to support permitting, as is seen specifically in the case of the 5.4-year test site. The range of funding varies widely for these sites, between USD 4000 and USD 5 million, reflecting the differences between commercial sites and short-term test deployments. The shortest duration project (60 days), was 100% developer funded for USD 4000. The two longest duration projects (12.2 and 17 years) have used between USD 2 million and USD 3.5 million in developer funds.
4. Comparing Actual Project Data to Reference Models
In 2011, Pacific Northwest National Laboratory published benchmark estimates of how environmental siting and permitting requirements contributed to the cost of wave and current/tidal based Marine Renewable Energy (MRE) installations (Copping and Geerlofs [
4]). The goal was to “identify key cost drivers and cost reduction pathways to direct future R&D efforts.” Logic models were developed to describe expected studies and provide a range of siting and permitting costs from pilot to small and to large commercial scales. Cost estimates in these reference models were developed based on previous and proposed projects, scaling factors, projections for post-installation monitoring costs, and expert opinions. A range of costs was given (Copping and Geerlofs [
4]) as an acknowledgement of the large amount of uncertainty in their calculations. Estimates were placed in the categories of Siting and Scoping, Pre-Installation Studies, Post-Installation Studies, and NEPA and Process. Reference Model 1 (RM-1) estimates costs for a tidal site, based on Puget Sound resource data. Reference Model 2 (RM-2) estimates permitting costs for riverine technology and Reference Model 3 (RM-3) estimates costs for a wave energy site, based on resource data from Northern California.
Neary et al. [
5], Bull et al. [
16], and Yu et al. [
17] provided additional costing benchmarks. They incorporated and expanded on the earlier Reference Models in analyses to estimate the levelized cost of electricity (LCOE) from MRE devices. Their six reference models each contain four modules to cover capital and operational expenditures (CAPEX and OPEX): Design and Analysis Module; Manufacturing and Deployment Module; Operations and Maintenance Module; and Environmental Compliance Module. Similar to Copping and Geerlofs [
4], estimates are made at multiple scales: a single energy converter, a small array of 10 units, a larger array of 50 units, and the largest array of 100 units. The same binning categories mentioned above are used in the Environmental Compliance Module. Wave and tidal energy characterizations for (Neary et al. [
5]) RM-1 through RM-3 correspond with Copping and Geerlof’s [
4] RM-1 though RM-3. Neary’s RM-4 covers new ground describing an ocean current turbine. RM-5 (Yu et al. [
16]) describes an oscillating surge wave energy converter (WEC) and RM-6 (Bull et al. [
17]) an oscillating water column energy converter.
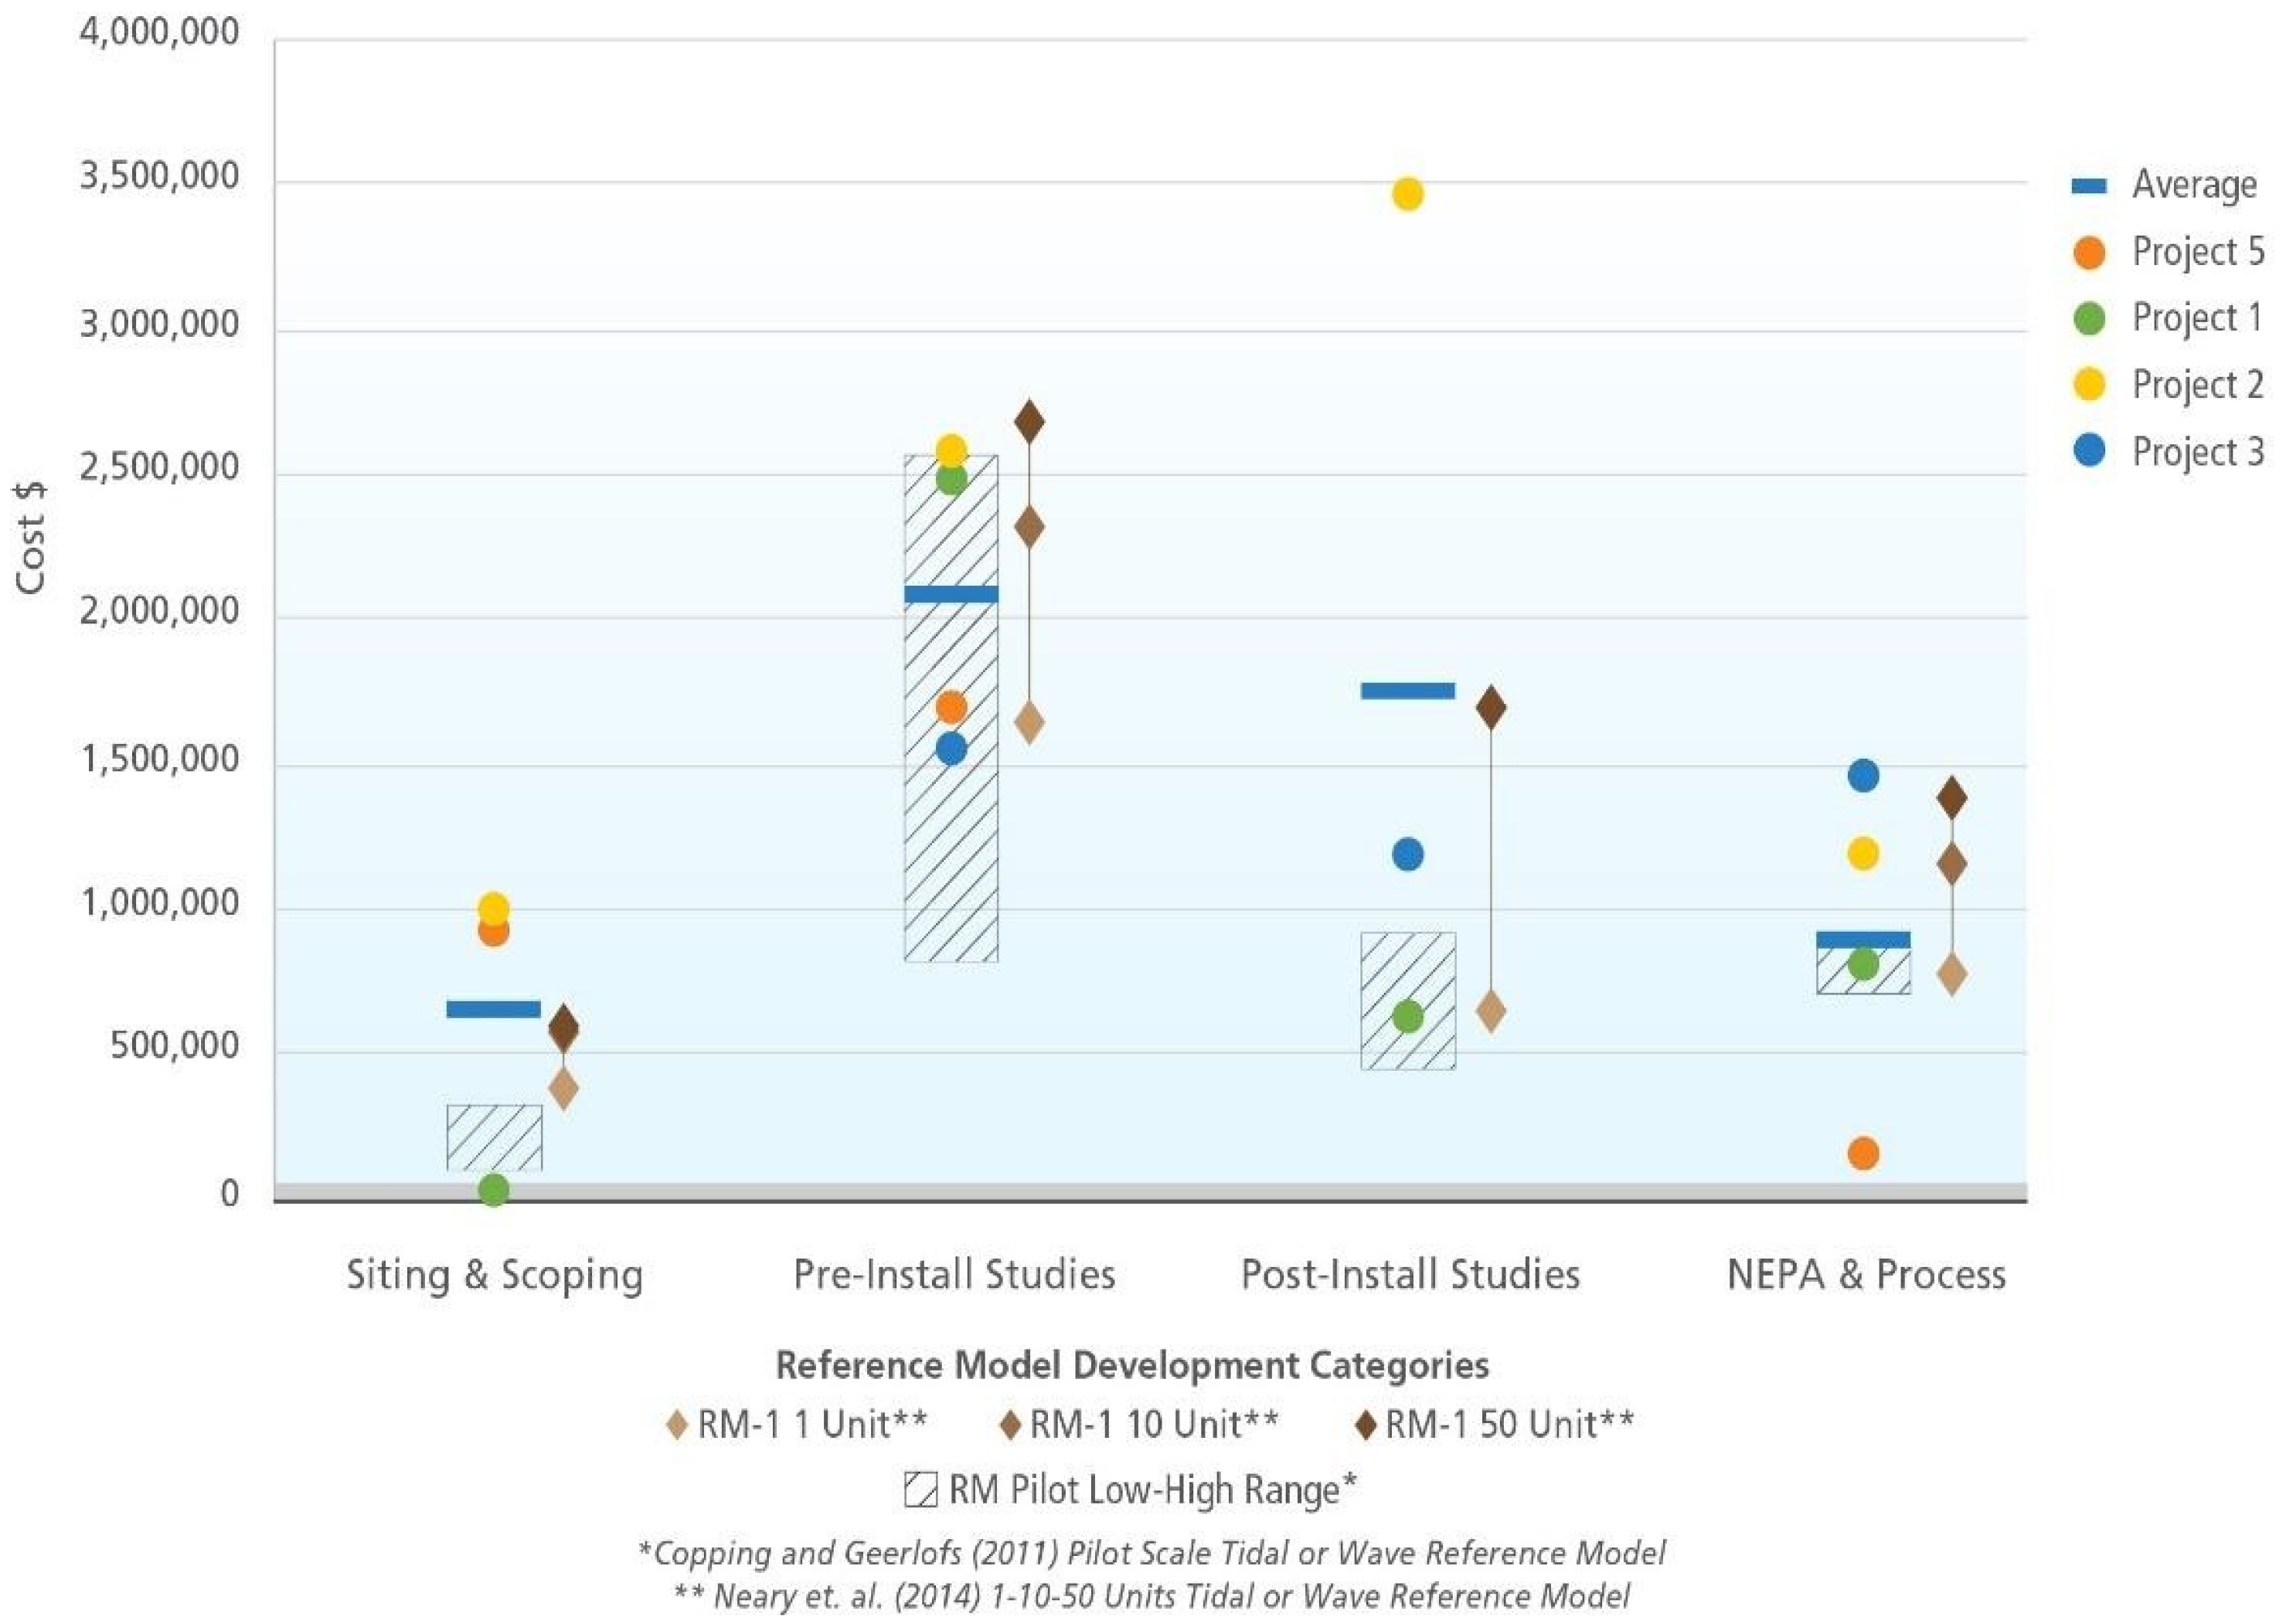
Our actual tidal and wave project costs are compared to both of the models for RM-1 (
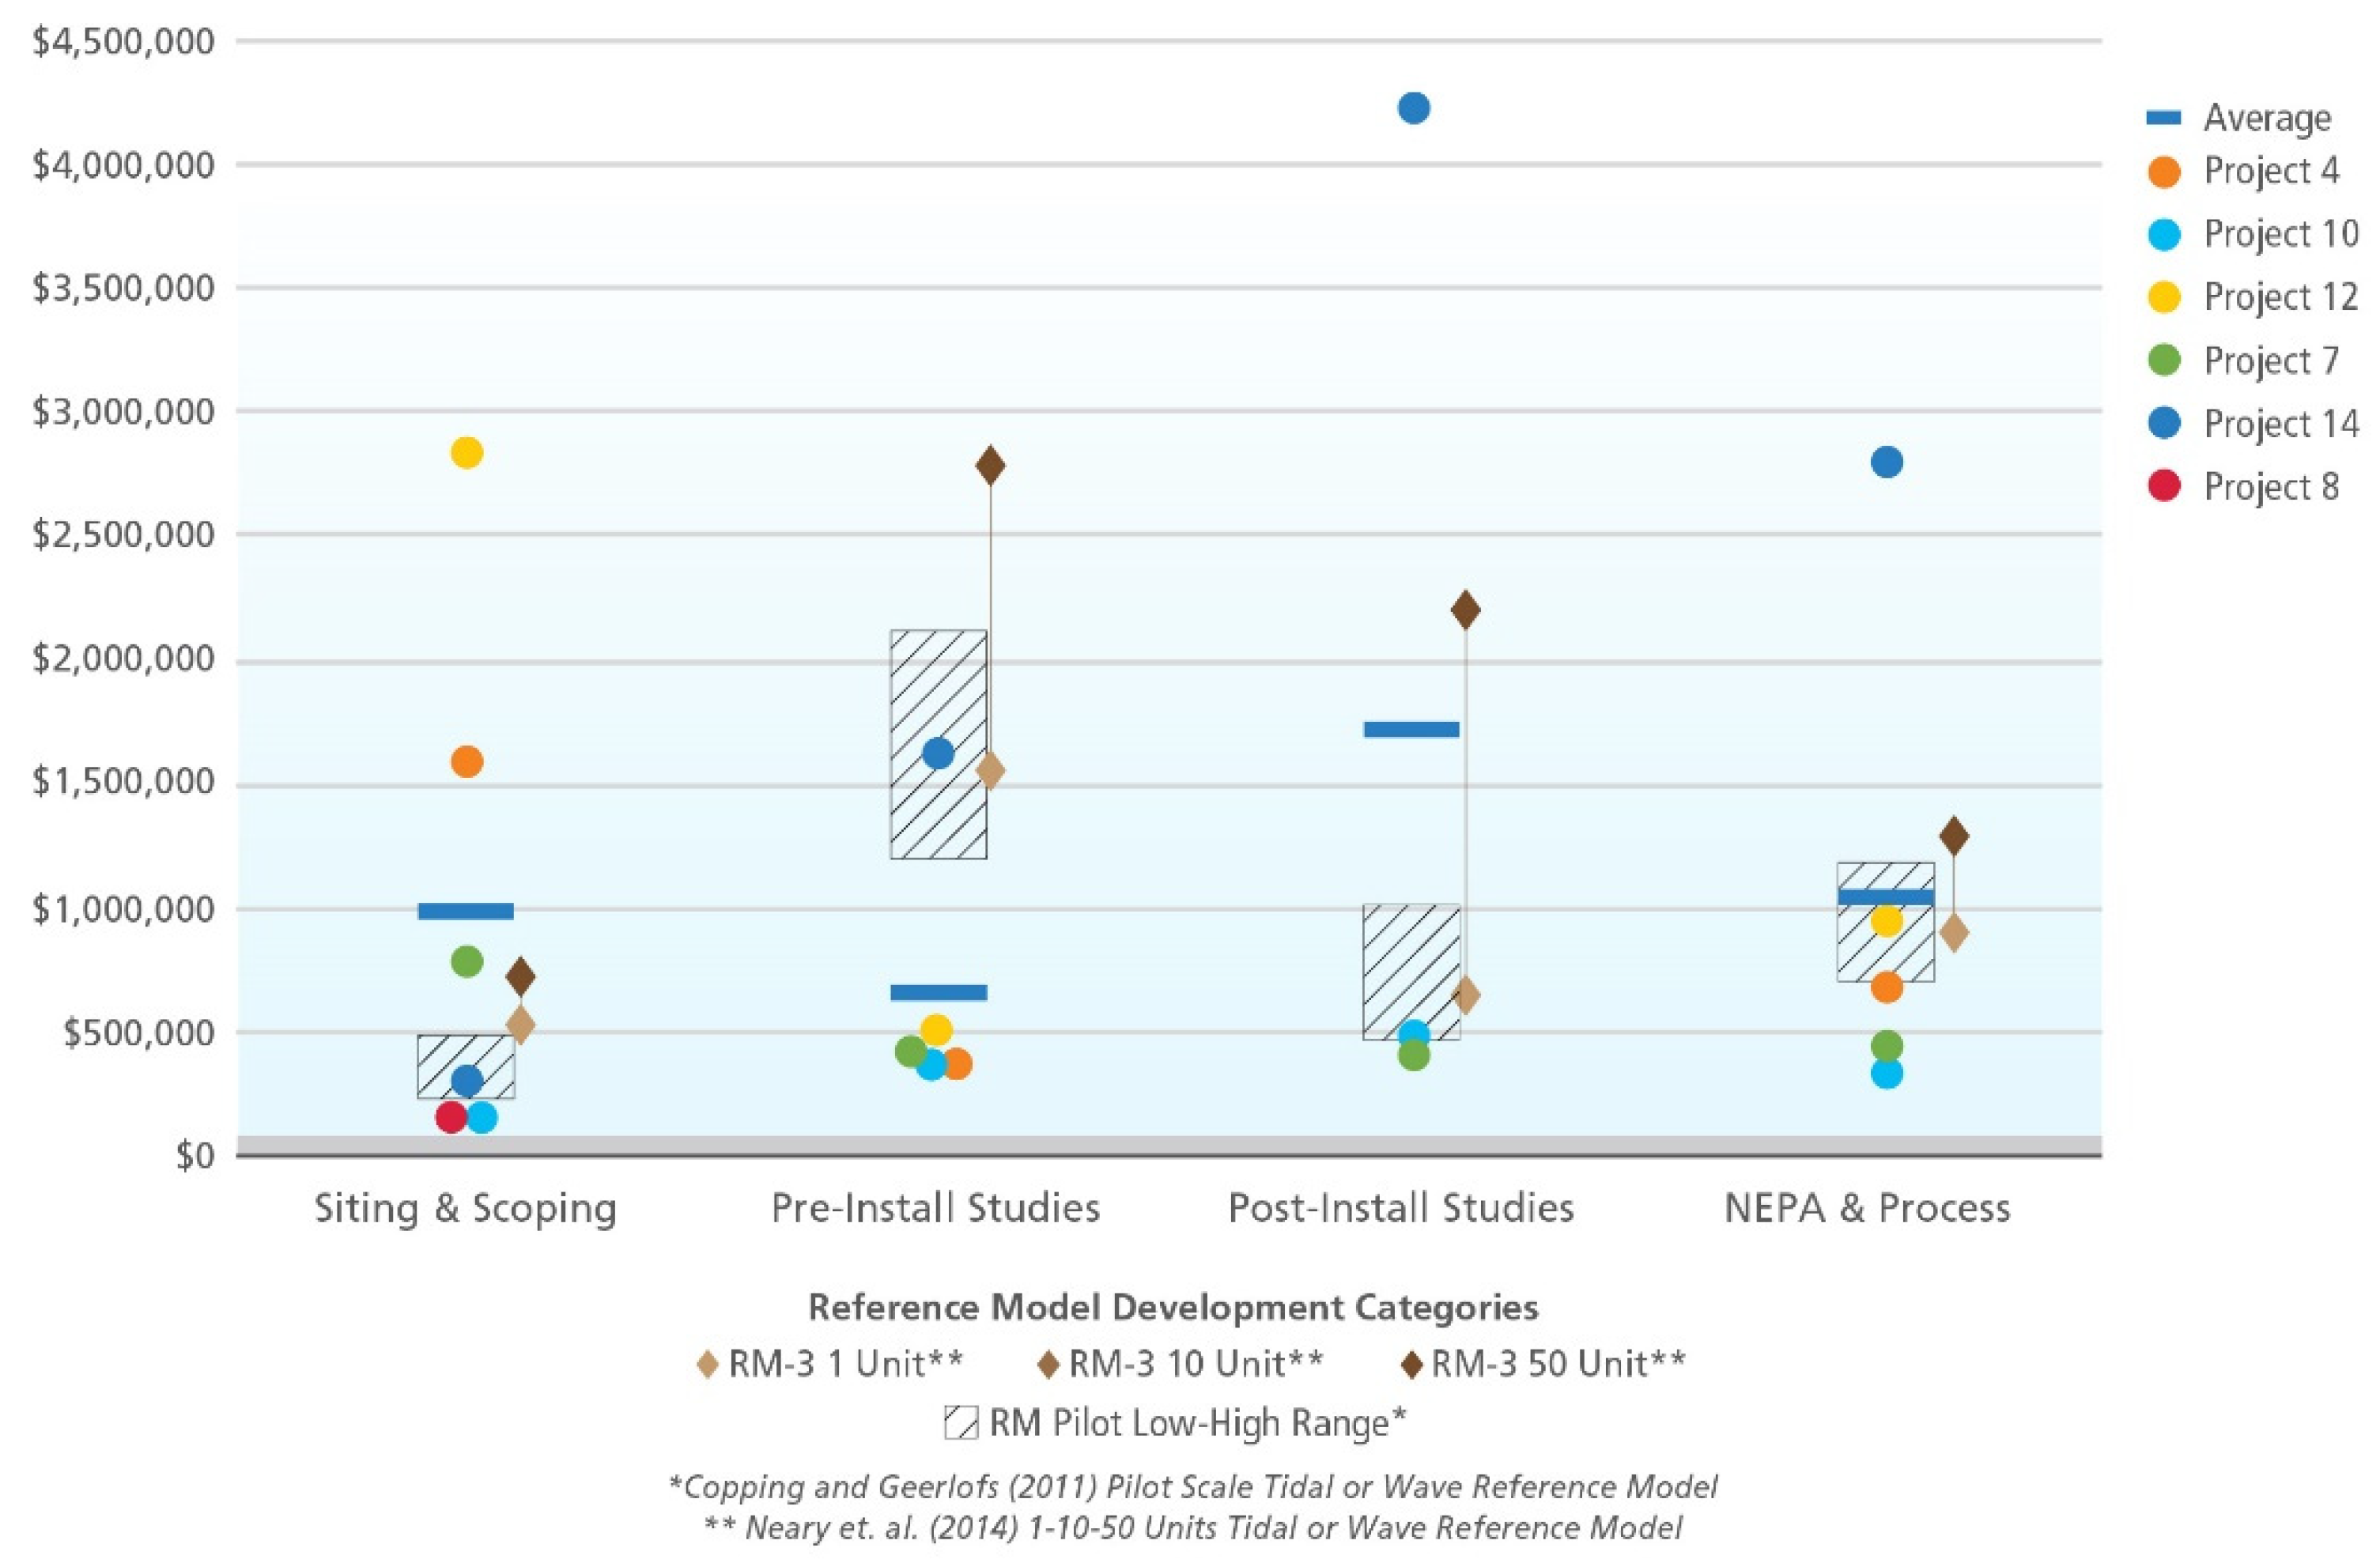
Figure 10) and RM-3 (
Figure 11), respectively. Copping and Geerlof’s [
4] pilot-scale estimate more closely matched the actual data as they represent mainly pilot-size installations, particularly the tidal energy converters (TEC) in
Figure 10. None of these data yet represent small or large commercial installations.
Figure 11 represents costs for WEC test deployments and test sites. Three of the four size ranges considered by Neary et al. [
5] are shown in both figures, 1, 10 and 50 energy converters.
Figure 10 and
Figure 11 suggest that, at this point in time, environmental compliance costs are variable beyond the ranges estimated by the Reference Models. In two categories—Siting and Scoping and Post-Installation Studies (
Figure 10 and
Figure 11)—the average values generated from the data are above Copping and Geerlofs’ [
4] model results. In other cases (
Figure 11, Pre-Installation Studies) the average data value is below the model results. Comparison to Neary et al.’s [
5] model results suggests a similar pattern, with the average data value below the single WEC cost estimates (
Figure 11, Pre-Installation Study) and most others above the values for a single WEC with some above the 50 WEC installation estimate. Multiple outlier points are beyond the cost estimates for a 50 WEC/TEC array, which bring the average values up.
5. Discussion
Using cost information from multiple project types, at different locations and scales, with different permitting requirements and levels of progress in their permitting process, creates difficulty in comparing dissimilar data. All these differences lead to the range of data values reported.
The differing permitting pathways of FERC for grid connected projects and USACE for non-grid connected projects were mentioned earlier. As an example of this variability consider two projects that may both report doing a fisheries study, with one following the FERC licensing process and the other following the USACE process. The first may have had multiple phases and field efforts taking several years, whereas the second may have been completed with a literature search over less than a year. Thus, the final cost of these two studies will be quite different.
Projects were also in different stages of development during this study. For example, considering Capacity vs. Total Cost (
Figure 4), the total costs reported will continue to increase for the active projects while a completed projects’ costs will remain static. Several of the test sites, in particular, are still working towards a final permit and their costs continue to grow. Similarly, for active permitted sites their total costs continue to grow as they continue monitoring and compliance activities. Thus, these data are merely a snapshot in time of compliance costs in the development of a new energy technology.
Equally important is that WECs, TECs, and current energy convertors (CECs), unlike wind turbines, are not built to a standardized design, leading to multiple unknowns in the regulatory process. Each new design must be considered in terms of the associated environmental stressors with no benefit from previous lessons learned, because they will not apply to a totally different design. Thus, the distribution of costs is wider than estimated in the Reference Model work (
Figure 10 and
Figure 11).
Finally, some of the differences between project costs may come down to the comfort regulators have with MRE technologies and developers. Previous experience and development of good relationships between MRE developers and regulators may lead to a level of trust, smoothing the initial application process and later adaptive management decisions. Conversations during guided discussions suggest this can be the case.
As noted, the most commonly performed environmental studies were Fish and Fisheries, Noise, Marine Habitat/Benthic, Marine Mammals, and Avian Studies (
Figure 5), with greater costs for environmental studies for current energy projects than for wave energy projects (
Figure 5 and
Figure 6). Guided discussions with developers suggest this is because it is much more difficult and expensive to collect data in a high-energy tidal environment than in a wave energy environment. Under the known episodic high flow rates experienced in tidal channels, collecting data underwater may be either limited to short work windows (e.g., during slack tides), or longer work windows with higher instrumentation costs. Many instruments are not “off the shelf” but under research and development, which may drive up study costs compared to wave energy sites.
Baseline studies are also less common in high-energy environments. Often it is only known that fish species may be present, but their use of tidal channels during different tidal cycles, day vs. night, and different seasons, is poorly understood. As a result, it is generally not known which species or how many individuals might come into contact with a tidal turbine, especially when it is rotating during fast tidal flow. This has led to a perception amongst some stakeholders of higher risk, predominantly to commercial fish species. Therefore, fish and fisheries studies (
Figure 5 and
Figure 6) are needed to determine which species are present, timing and duration of site use, and exposure to tidal turbines. Collision studies are using video systems, acoustic cameras, and stationary and mobile hydroacoustics to determine if fish collide with rotating blades or are able to detect and avoid them, to improve understanding of risks (Viehman and Zydlewski [
18], Sparling et al. [
15], Polagye et al. [
19]).
The outlier data point for tidal collision monitoring (USD 2.9 million) represents funding used to develop instrumentation such as remote undersea optical and acoustic cameras, lighting systems, and other integrated instrumentation, to observe fish in the vicinity of turbine blades (Sparling et al. [
15], Polagye et al. [
19]). Permitting of one project was dependent on the ability to characterize and validate the risk of juvenile salmon and marine mammal collision with tidal turbines at the site. As technology was not available at the time, DOE funded research and development to create and test instrumentation. Though a high cost for project development, this technology is now available for use by other projects.
When comparing environmental study costs based on location (East vs. West Coast,
Figure 7), the East Coast tidal projects have the highest costs with Fish and Fisheries and Marine Habitat studies, with average values of USD 800,000 and USD 450,000, respectively. On the West Coast, projects’ highest costs are for Acoustic/Noise and Collision studies, but average values are still well below the East Coast for Fish and Marine Habitat studies. These data indicate that studies of fish and their habitat are more expensive than marine mammal acoustic studies.
Comparing wave and tidal energy outreach costs suggests wave project developers focused more on public interaction. One tidal project did spend more than all but one wave project (
Figure 8, Project 4), having conducted over 100 formal and informal meetings with upwards of 50 stakeholder groups over a 5-year period. There are multiple reasons for increased outreach and interaction costs for wave projects; they are located predominantly on the West Coast, increasing the potential for development to affect valuable commercial and recreational fisheries such as Dungeness crab and Chinook salmon, and the potential for interactions with a number of species listed under the Endangered Species Act, such as Southern Resident killer whales, listed salmonids, and green sturgeon.
The projects, compared by funding source (
Figure 9), are ordered from shortest to longest duration but they are also roughly in chronological order by start date. A few are out of order, but the general trend is clear: longer running and older projects have used more private developer money. Shorter and more recent projects have been more fully supported by state and federal funds. The exception is the shortest project in
Figure 9, with a duration of 0.1 year. This project was funded entirely with developer funds and may represent any number of small un-reported experimental deployments that would rather focus on engineering than grant applications. Lack of funding is often the greatest obstacle for developers and increased support from government bodies over time bodes well for this young industry.
The Logic and Reference Models developed for DOE by Copping and Geerlofs [
4] and Neary et al. [
5] represent expert knowledge and engineering cost predictions for use in scoping ME projects. Actual data indicate that costs vary well beyond predictions. Data collected in the interview and survey process revealed environmental studies for several projects turned out to be more expensive and some less expensive than predicted.
Figure 11 shows examples of each. In the Siting and Scoping category, one test site reported costs over 3 times greater than those expected for a 50 WEC array. Yet, in pre-installation studies the same site reports study costs well below the lowest Reference Model estimate. This is partially explained by site-specific difficulties with studies, longer time for data collection required than expected, or more complex monitoring required to obtain baseline information to support permitting. Obviously, much is still unknown. Pathways to decrease these costs and improve efficiencies in permitting will be the goal of a follow-on article.
6. Conclusions
Over the last two decades, which our data represents, permitting of marine energy projects has proven to be a challenge as the nascent industry strived to develop the technology to tap the potential of ocean energy. Marine energy’s nearshore location and unique, developing technologies have led to increased scrutiny and greater permitting and monitoring costs. This likely represents the initial steep section of the learning curve for permitting projects, with costs expected to decrease as stakeholders gain better understanding of its environmental effects and benefits, and the preferred technologies narrow.
The most expensive environmental studies conducted were for Fish and Fisheries, Noise, and Benthic Habitat and were reported for 53%, 65% and 53% of the projects, respectively. Studies done for tidal installations were more expensive than for wave installations, with average values 4.8 times greater for Fisheries, 3 times greater for Marine Habitat and 7 times greater for Noise. The range of study costs was also wider than predicted by the previous estimation models of Copping and Geerlofs [
4], and Neary et al. [
5], for both tidal and wave projects. As more projects progress through the permitting process and into construction and operation, improved instrumentation and standardized monitoring protocols and technologies will likely lead to a decrease in cost of permitting. Future research on permitting costs, compared with those reported here, would be the best way to document those results. Lessons learned from projects suggest that as developers work with regulators over time, or on multiple projects, this interaction will benefit their working relationships by building trust and improving understanding of the environmental effects of marine energy development (Kramer et al. [
3]). Increased knowledge of interactions of stressors and receptors, which is an on-going study, may eventually reduce monitoring requirements (Copping and Hemery [
2]), and while any marine energy installation will involve risks to the environment, in the future these risks may be well enough understood to support the licensing, permitting, and compliance processes more efficiently.


 ,
, 


