Abstract
Climate change has a potential impact on the number of hot and torrid days in the summer period. Due to the occupants’ comfort needs, and because of the high heat loads during the summer period, in several European countries, the energy used for air conditioning in buildings increased. With multiple environmental monitoring systems (Testo Saveris) in two similar offices, having west and east orientation of glazing, 1920 data (internal air, mean radiant temperature) related to operative temperature were collected in order to show the differences between heat loads of rooms with similar geometry in the same building. Data were measured in a 15 min interval. The diffuse and direct solar radiation had been determined for the horizontal and vertical surfaces, using the measured hourly global radiation (Debrecen, Hungary) data for the analyzed days (summer, hot, and torrid days). The local climatic results were compared with other climatic days used in different national standards. The daily energy need for cooling for different building comfort categories was also determined in the case of the representative days. The maximum daily energy need for cooling can be even 2.3 times higher for east orientation in comparison to the west orientation of the facades.
1. Introduction
Extreme weather events, just like the summer period’s hot and torrid days, are challenging the inhabitant’s health and comfort. Numerous research had been performed, and plenty of scientific papers studying thermal comfort, indoor operative temperature, indoor air quality were published [1,2,3].
Majewsky et al. analyze the indoor environment quality in two different intelligent buildings, which are located in Poland. The authors stated that energy consumption worldwide is constantly rising. Most of the energy is used by the building sector, mainly for the daily operation of modern buildings, intelligent buildings for offices, and also for public use [4].
Increasing the airtightness of the buildings’ envelope, special attention should be paid to the CO2 concentration level in the indoor air. It was shown that the CO2 concentration may exceed even 4000 ppm in the case of two persons performing office work if aeration of the room is not performed properly [5]. Bullová et al. have shown that the air change rate can be reduced to even 0.1–0.3 h−1 in the case of refurbished buildings [6]. In the last decades, the need for thermal comfort increased considerably. Several air conditioning systems were mounted in the existing office buildings, while new office buildings are equipped with cooling systems.
Thus, the energy use for cooling in the buildings increased substantially in the last years [7,8]. Mousavi Motlagh et al. have shown that most researchers analyzed the energy use in residential and office buildings [9].
In the European Commission Report related to energy performance in buildings, the annual final energy consumption per square meter in the residential sector in Hungary was 150 kWh/m2 year in 2013 [10]. Hungarian Energy and Public Utility Regulatory Authority, in the yearly report, presents the energy consumption for cooling used by air conditioning systems in the summer period [11]. It was shown that the energy consumption for cooling increased from 271 TJ (2015) to 570 TJ (2019). Bazazzadeh et al., in their research, conclude that the cooling load will increase by 135% by 2080 in Poland [12]. The proper architectural design of buildings can mitigate the energy need for cooling. Long et al. and Reilly et al., in their research, present the thermal mass and heat storage capacity effects for the heat load of buildings [13,14].
The present paper focuses on the importance of operative temperature for different office building comfort categories and energy needs for cooling. In order to determine the operative temperature and the daily energy need for cooling in buildings, according to standards, the first step is to determine the local specific meteorological data, such as global diffuse radiation, diffuse and direct radiation on vertical surfaces, mean outdoor temperature, and so on. Duties of the Meteorological Observatory (Debrecen, Hungary, GPS coordinates: 47.53253, 21.62537) are the collection and measurement of global hourly radiation data and mean hourly outdoor temperatures.
In order to obtain an appropriate overview of the building’s cooling needs, it is essential to review different standards on the topic. According to ISO-52000-1:2017, “Building: construction as a whole, including the fabric and all technical building systems, where energy may be used to condition the indoor environment” [15]. Cooling energy needs can be determined using the algorithm given by ISO 13790:2008 standard, as a room or enclosure, which is specified to be cooled to a given setpoint temperature. According to ISO standard 13790:2008, energy needs for cooling in a conditioned space have to maintain the expected temperature conditions until a given period of time. Solar heat gains are defined as heat that is provided by solar radiation, entering directly or indirectly through openings, opaque walls, and roofs, or by passive solar devices such as sunspace, transparent insulation, and solar walls [16]. The calculation methodology presented in ISO 13790:2008 standard was previously validated, and the results were published in different articles [17,18].
The aim of the present research is to discuss and analyze through a case study the effect of different building structures, size, and orientation of glazed areas on the indoor operative temperature for different comfort categories and on the daily cooling energy need in the case of hot and torrid days (selected from the 11 analyzed years).
2. Materials and Methods
In order to see the effects of the orientation of transparent surfaces, building structure, and glazing ratio on the operative temperature, measurements and simulations were simultaneously performed.
2.1. Methods for Measurements of the Operative Temperature
A multiple environmental monitoring system provided the opportunity for complex research related to building performance on different aspects, including thermal comfort, energy use, and indoor air quality.
With the expansion of wireless communication, data storage, small electronic devices, etc., will be able to transfer bigger data for increasing the building performance [19].
Firstly, it was identified a western and an eastern-orientation office in a 3-story building with heavy structure. The selected offices are located on the upper building level (similar shading) and have similar geometry. In these offices, a Testo Saveris measurement system was placed (Figure 1a,b). This measurement system can be used for monitoring building internal air and mean radiant temperature.
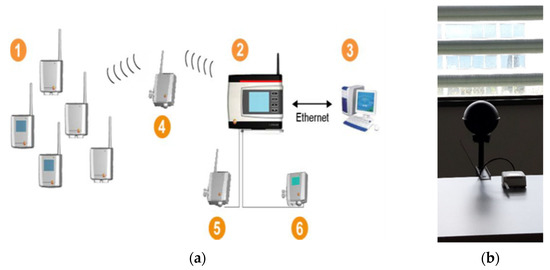
Figure 1.
The Testo Saveris measurement system [20]. (a) Testo Saveris base system (b) globe sensorWith this measurement system, ambient or process data for temperature and humidity in sealed rooms and/or during transportation is measured and recorded using probes (1). These measured values are transmitted by radio to the Saveris base (2) and saved. A router (4) can be used to optimize the radio signal in the event of difficult structural conditions. The data is then called up from a computer (3) by the Saveris base and saved to a database [20].
Very long distances can be bridged using a converter (5), which converts the radio signals of the probe or router and then transmits this measurement data to the base via an Ethernet cable. The Ethernet probes (6) can also be connected to the base using an Ethernet cable. NTC sensor measuring range of the Saveris T2/T2D is from −35 to +50 °C, and the accuracy is ±0.2 °C (−25 to +70 °C) [20].
The dimension of the analyzed offices is 7.5 × 6 × 4.5 m (Figure A1 in Appendix A). The windows dimension is 1.32 × 5.44 m. The overall heat transfer coefficients of external building elements were Uwall = 0.28 W/m2 K; Uwindow = 1.1 W/m2 K; and Uflatroof = 0.2 W/m2 K. The operative temperature was measured on the working places, which are located at 1.5 m from the window, similar for both offices (Figure 2a,b). Measurements were carried out in the summer period when no occupants were in the rooms (holiday 3 August 2018–7 August 2018). The HVAC systems were switched off.
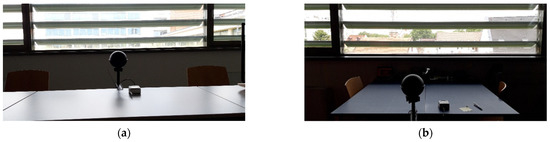
Figure 2.
Measurements of the Operative temperature (a) East-orientation office; (b) west-orientation office.
2.2. Methods for Calculation of the Operative Temperature and Daily Energy Need for Cooling
The elements of a cooling system are chosen depending on the setpoint operative temperature and the maximum value of the operative temperature in a room. In order to determine the daily variation of the operative temperature, different calculation methods can be used. In the following, the method given by standard EN 13790 was used. The validation of the calculation model was performed and presented in previously published papers [17,18]. Furthermore, the day for which the calculation is performed has to be chosen carefully. This has to be a torrid day, but for energy need for a day or a whole summer period, the hot days and summer days are important as well.
The calculation method uses the RC network of the heat flows, as is shown in Figure 3 [16].
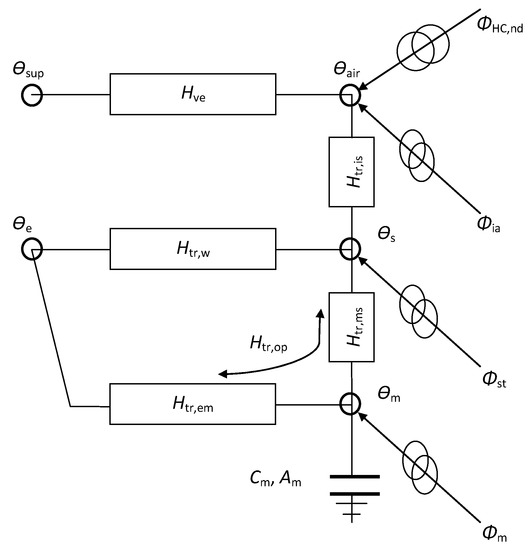
Figure 3.
RC network heat flows [16].
The internal heat capacity of the building zone, Cm, (J/K), was calculated for a maximum thickness of 10 cm.
The operative temperature is obtained using Equation (1), [16]:
The cooling need is [16]:
where:
The ASHRAE 90.1 standard presents the prototype buildings. In the standard 16 prototype buildings are presented: apartment, hospital, hotel, office (large, medium, small), restaurant, school. The room dimensions used for calculus in the present paper is a model room for each prototype building defined in the ASHRAE 90.1 standard [21].
In buildings with various functions, rooms have different dimensions. In the case of office buildings, the geometrical sizes of rooms depends on the number of persons working in the office. Usually, the dimensions of a room result from a grid. Generally, in the case of a suspended ceiling, the dimension of one element of the grid is 600 × 600 mm. In the following, for cooling load calculus, a room with a 4.8 × 4.8 × 3.0 m dimension is taken into account.
The overall heat transfer coefficients of external building elements were Uwall = 0.226 W/m2 K; Uwindow = 1.0 W/m2 K; and Uflatroof = 0.166 W/m2 K.
The room is located in the corner of the attic of a three-story building. The window has no shading, the solar energy transmittance: g = 0.7, and the glazed ratio is 85% (in all cases, 15% is frame). The air change rate was considered ACH = 0.5 h−1.
The window glazed of analyzed room ratio is 85% (for example: exterior glass wall, window wall).
According to Hungarian regulation related to the energy performance of buildings [22], the building is considered light structured if the specific thermal mass is lower or equal to 400 kg/m2, and the building is considered heavy structured if the specific thermal mass exceeds 400 kg/m2.
Four different cases were analyzed for each window orientation.
- (a)
- Heavy construction, external wall with 50% window;
- (b)
- Light construction, external wall with 50% window;
- (c)
- Heavy construction, external wall with 100% window;
- (d)
- Light construction, external wall with 100% window.
3. Input Data for Calculation of the Operative Temperature and Daily Energy Need for Cooling
In the last decades, the heat waves are longer lasting, and their number increases. During the heatwaves, besides health problems [23], the electrical energy consumption in the building sector caused by air conditioners operation at maximum capacity raises substantially.
The local design standards for energy efficiency do not contain the input local climatic data, which are: hourly values of the external air temperature and solar radiation intensity.
Hourly global radiation data and mean outdoor temperature were provided by the local Agro-Meteorological Observatory Debrecen, Hungary [24].
In order to determine the local meteorological data, the calculation method for the selected days was presented in several articles [17,18].
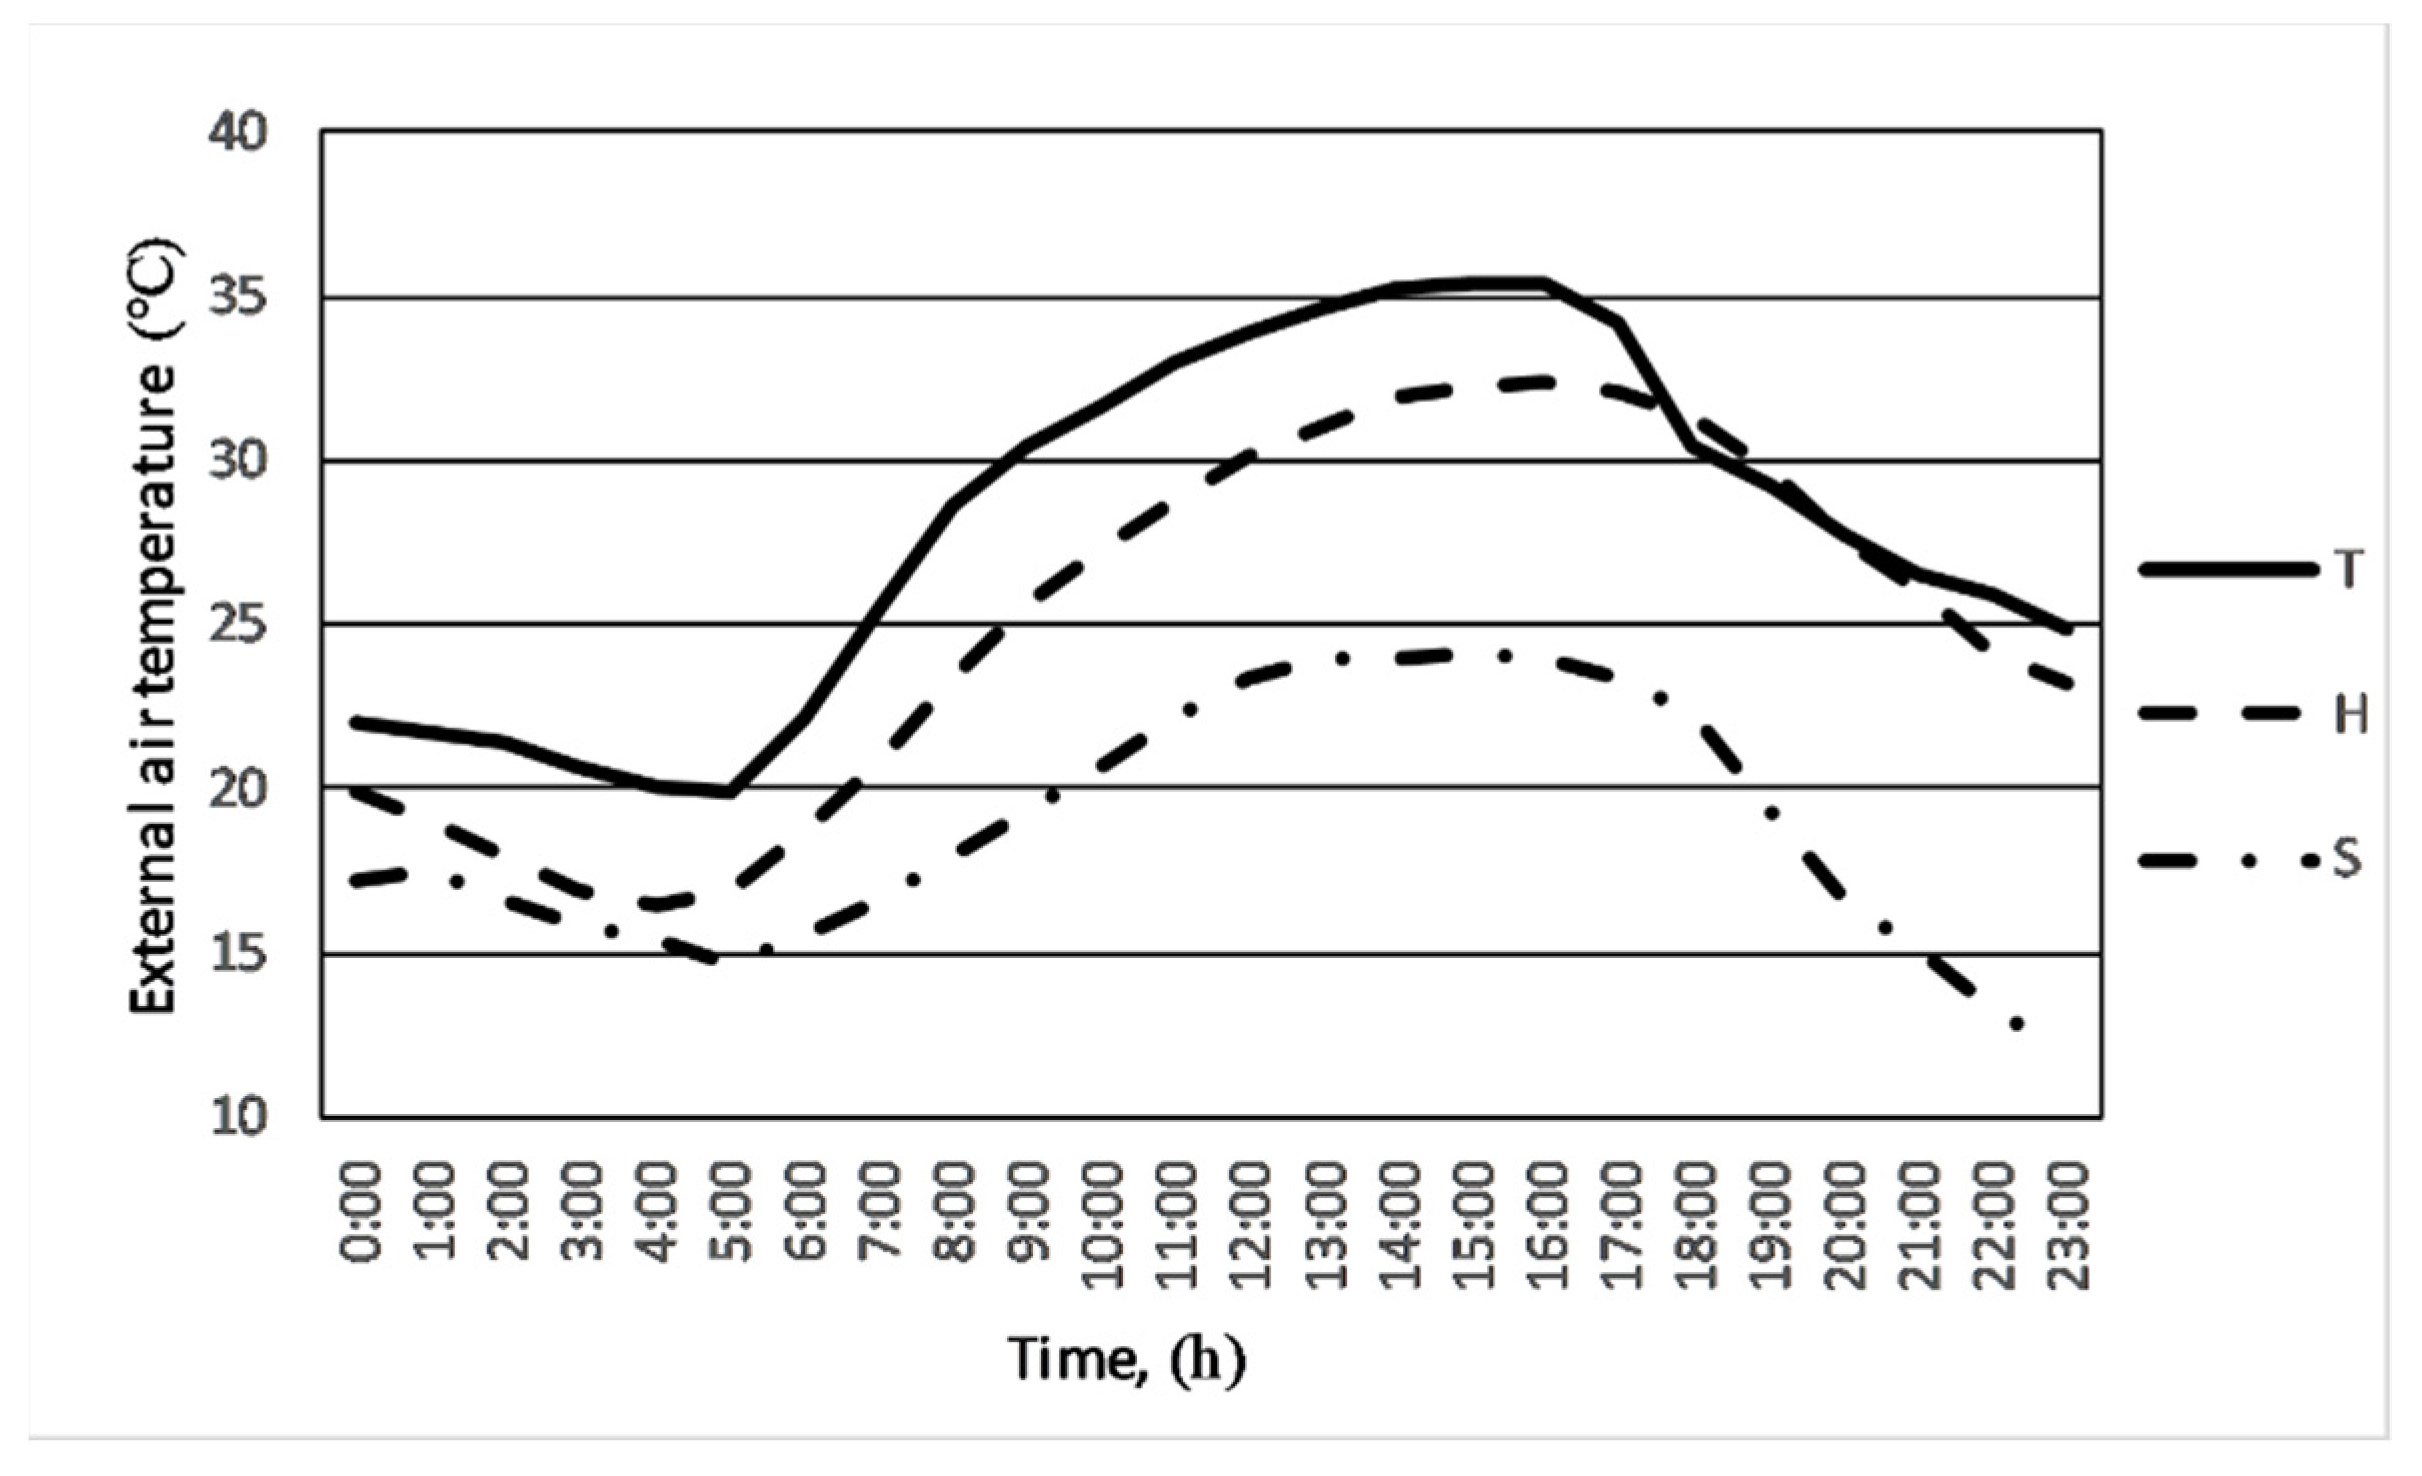
According to the Hungarian Meteorological Service, those days that have a maximum temperature higher than 25 °C are called “Summer days”. If the maximum temperature value is higher or equal to 30 °C, the day is defined as a “Hot day”. “Torrid days” have the maximum daily temperature equal to or higher than 35 °C [25].
Between 2009 and 2019, 514 summer days, 247 hot days, and 21 torrid days were registered.
The daily maximum temperature of the selected summer day was 25.3 °C. The chosen hot day had a maximum daily external air temperature of 32.4 °C, while the torrid day had a maximum external air temperature of 35.6 °C.
The local climatic data for the summer, hot and torrid days are presented in Table 1 (and Figure A3, Figure A4, Figure A5 and Figure A6).

Table 1.
Maximum radiation values and energy yield for hottest days [26,27,28].
The clear sky days are important because the cloudiness is omitted (direct radiation values are higher than for real days, while the diffuse radiation values are lower).
Furthermore, the input meteorological data given by different national standards are included in Table 1.
Standard 04-140-2 (national Hungarian Standard) was previously in use [26]. This standard provides the solar radiation and external air temperature data for heat load calculation until 2012.
In standard [27], local meteorological data are mentioned, related to Oradea city, Romania, which is located near Debrecen, Hungary. The distance between the two cities is 60 km.
Standard [28] contains only statistic days, and real days are not included.
4. Results and Discussion
In the following, the measured and calculated operative temperatures and the determined daily energy need for cooling are presented.
4.1. Measurements of the Operative Temperature
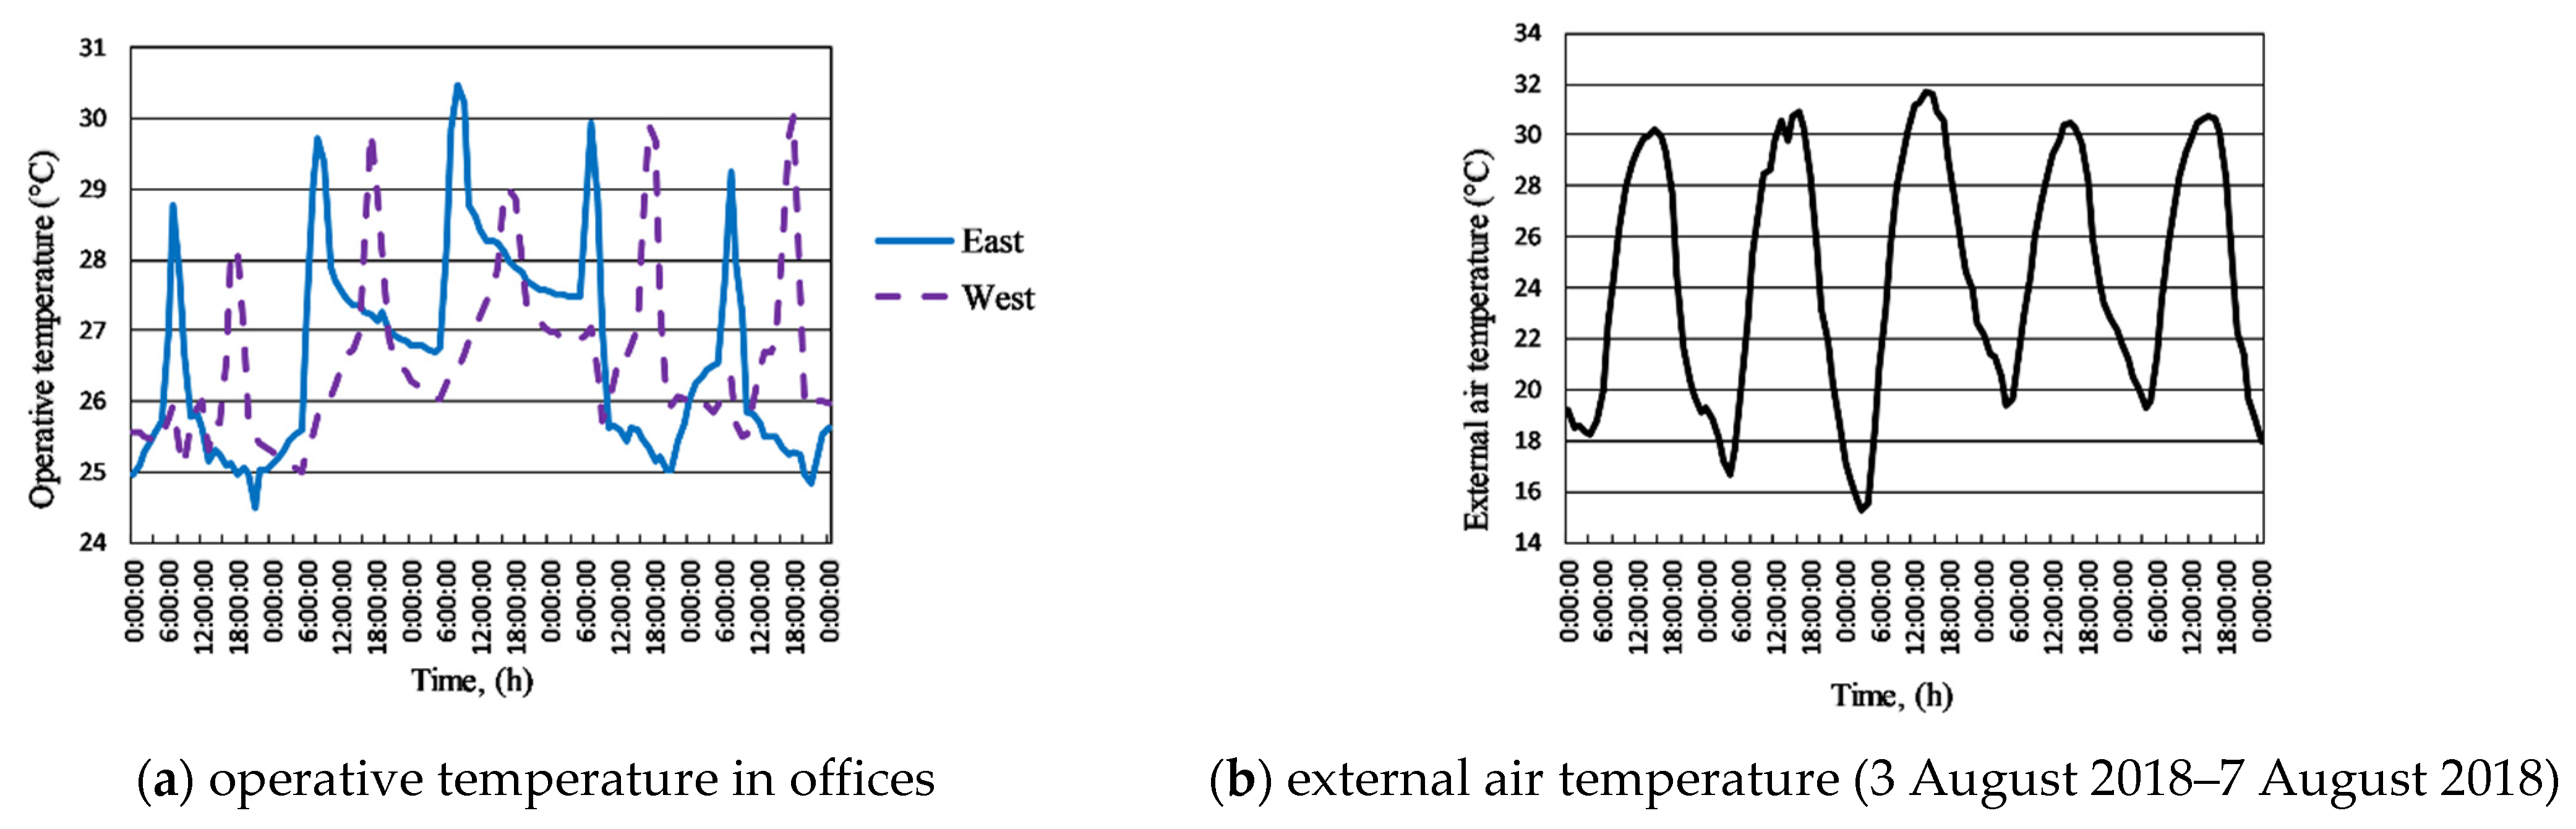
The gathered values of the operative temperature and outdoor dry temperature are illustrated in Figure 4a,b.

Figure 4.
Measured operative and external temperature.
It can be observed that the operative temperature in the offices followed the variation of the external temperature (three subsequent days increase, two subsequent days decrease). Moreover, the maximum values can be similar (second and fourth days) or different, depending on the cloudiness. As in the offices, the working hours starts at 8oo a.m. and ends at 17oo p.m. the west-oriented offices are advantageous from the cooling point of view. The question is: how much cooling energy can be saved renting a west-oriented office instead of an east-oriented office?
4.2. Calculation of the Operative Temperature
The results of maximum operative temperature for all analyzed cases are presented in Table 2 and Table 3.
Table 2.
Maximum operative temperature for heavy construction buildings.
Table 3.
Maximum operative temperature for light construction buildings.
It can be observed that in Table 2 and Table 3, the highest operative temperatures were obtained to east and west orientation of window for all analyzed days and windows to wall ratios.
The hourly operative temperature for south- and north-orientation glazed areas are presented in Figure A7, Figure A8, Figure A9, Figure A10, Figure A11, Figure A12, Figure A13 and Figure A14.
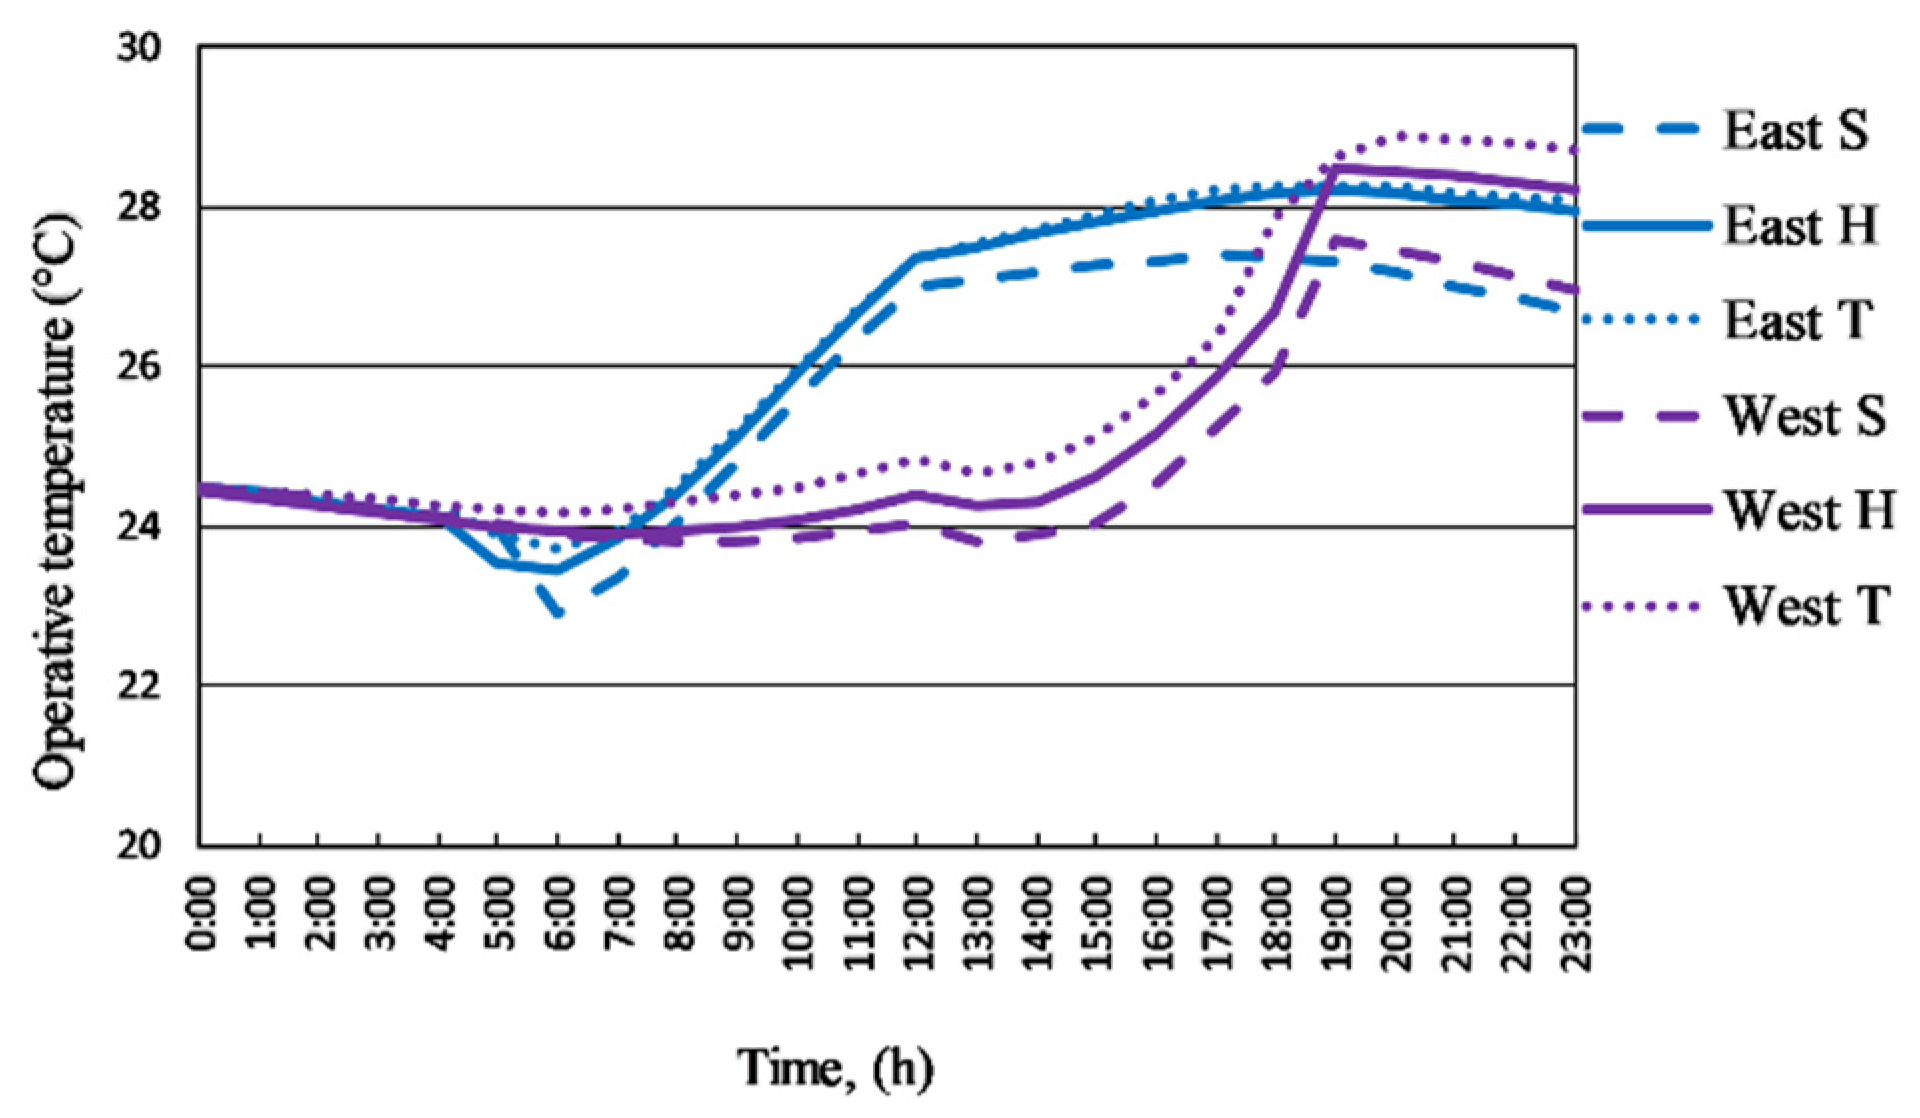
In Figure 5, Figure 6, Figure 7 and Figure 8, both for the east and west orientation of the glazed area, the hourly operative temperatures are presented.

Figure 5.
Heavy construction, 50% window (summer, hot, torrid day).
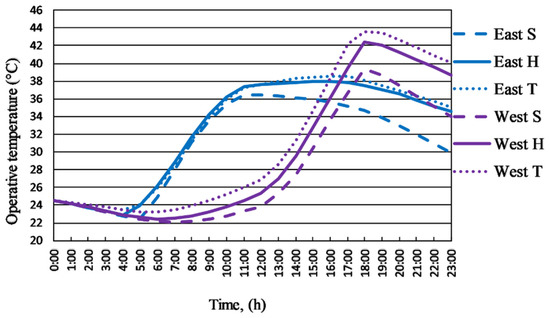
Figure 6.
Light construction, 50% window (summer, hot, torrid day).
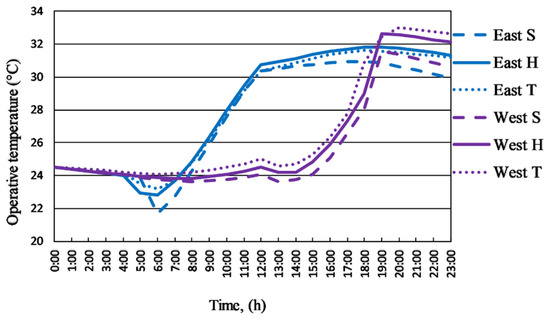
Figure 7.
Heavy construction, 100% window (summer, hot, torrid day).
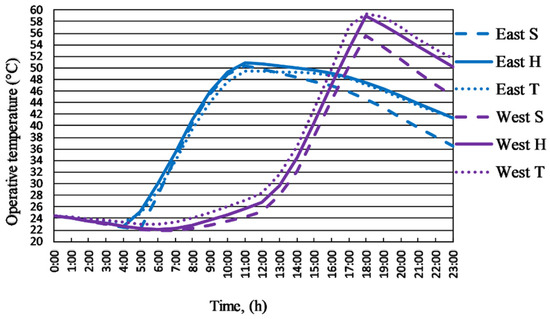
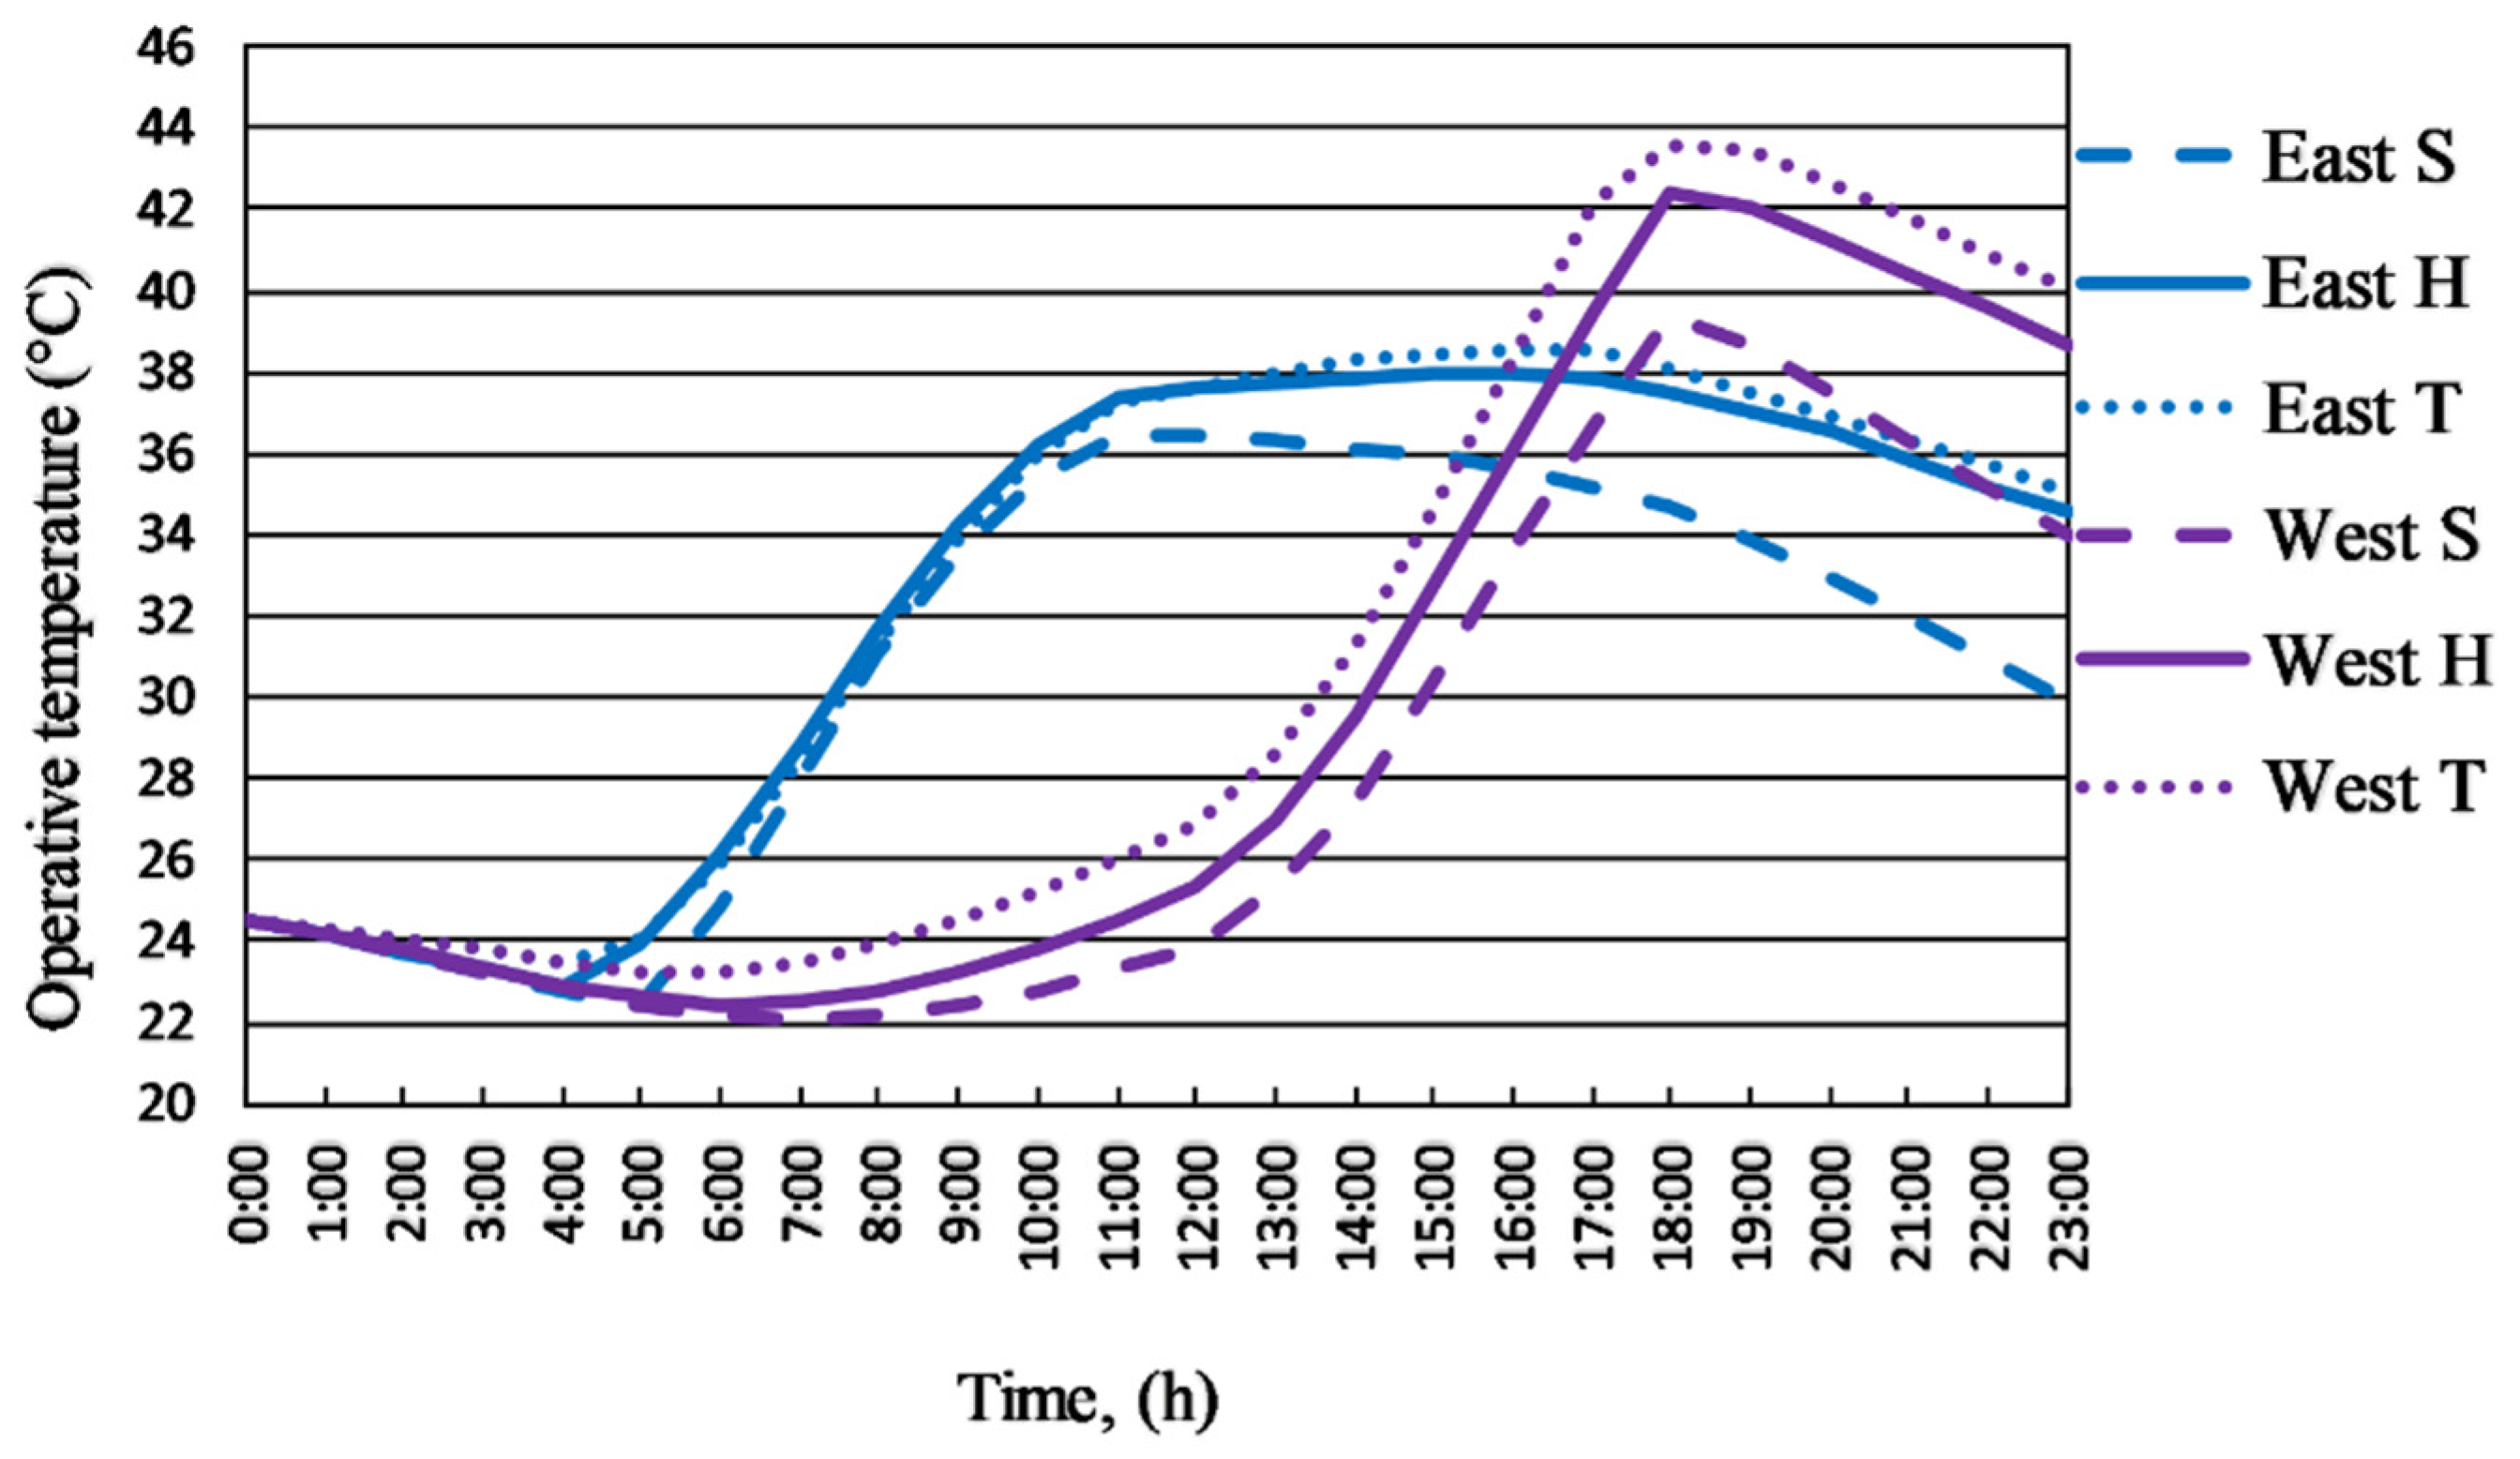
Figure 8.
Light construction, 100% window (summer, hot, torrid day).
Assuming the upper limit of comfort operative temperature 26.0 °C, the overheating hours in the summer, hot and torrid days for east and west orientation of window can be determined based on Figure 5, Figure 6, Figure 7 and Figure 8.
It can be observed that the 26 °C setpoint temperature is exceeded for both orientations in each analyzed day. If there is no cooling system installed, the overheating generates thermal discomfort, which leads to health problems and a decrease in work productivity [29,30,31]. In the case of offices with air cooling systems, the length of overheating period determines the operation time of the cooling system, while the amplitude of overheating determines the installed cooling capacity.
4.3. Daily Energy Need for Cooling
In the Technical Report CR 1752:1998 Ventilation for buildings—Design criteria for the indoor environment, different building types, and spaces, the design criteria are defined [32].
Single/landscape office operative temperatures in summer and cooling season for different comfort categories:
- A 24.5 ± 1;
- B 24.5 ± 1.5;
- C 24.5 ± 2.5 [32].
In the following, the energy calculations were performed for the heavy and light construction using the clear sky day meteorological data, the daily energy need for cooling was determined. For each building category, the minimum and maximum acceptable operative temperatures were taken into consideration. The results are presented in Table 4, Table 5, Table 6, Table 7, Table 8 and Table 9. Obviously, with intelligent and properly operated external shading structures, the daily energy need for cooling can be reduced substantially [33].
Table 4.
Daily energy need for cooling of analyzed room. heavy construction, summer day (Wh/day).
Table 5.
Daily energy need for cooling of analyzed room. Light construction, summer day (Wh/day).
Table 6.
Daily energy need for cooling of analyzed room. Heavy construction, hot day (Wh/day).
Table 7.
Daily energy need for cooling of analyzed room. Light construction, hot day (Wh/day).
Table 8.
Daily energy need for cooling of analyzed room. Heavy construction, torrid day (Wh/day).
Table 9.
Daily energy need for cooling of analyzed room. Light construction, torrid day (Wh/day).
It can be observed that for all analyzed cases, the maximum value of daily energy demand for cooling was obtained for the east orientation of the glazed area.
5. Conclusions
The majority of comfort and energy standards do not contain external meteorological data. In the case of calculation of the operative temperature and energy need for cooling, it is essential to know the values and variation of the external air temperature and solar radiation. Therefore, meteorological data over the past 11 years were analyzed. For this period, 514 summer, 274 hot, and 21 torrid days were identified. In order to determine and investigate the daily cooling energy need, one summer day, one hot day, and one torrid day was chosen.
In the frame of a case study, the operative temperature was measured and analyzed in two similar office rooms, having east and west orientation of glazing, in a 5-day period. The results enlighten that the energy consumption for cooling and the operational costs for west-orientation offices might be advantageous.
With the use of a validated model, the operative temperature was calculated for different building structures and window dimensions. For different comfort categories, the daily energy need for cooling was determined.
The cooling energy demand was calculated in the case of the analyzed days in light and heavy construction buildings, with different sizes and orientations of windows. It was also determined the differences that occur in the case of daily energy demand under summer-hot and torrid days’ radiation conditions.
The upper limit of the operative temperature in a B comfort category office is 26.0 °C. In the case of the south orientation of the glazed area, for this operative temperature, assuming 100% of the daily energy need for cooling in a summer day for a heavy structure building with 100% window, it can be observed that for hot days the daily energy need will be 106.1%, while for torrid days 138.8%. In the case of a light structure building, on a summer day is 283.8%, hot day, the daily energy need for cooling is 327%, while for a torrid day, the increase is 355.6%.
Keeping the same reference value for 100% of the daily cooling energy need but decreasing the glazed area to 50%, the daily energy need for cooling decreases to 29.1% (summer day), 51.1% (hot day), and torrid day 63.4% (torrid day) in the case of heavy structure.
For light structure, the daily cooling energy needs increase to light structures 132.2% (summer day), 173.4% (hot day), and 200.2% (torrid day).
In the glazing area north orientation, the daily energy need for cooling is substantially lower in comparison to other glazing orientations.
Analyzing the results obtained for cooling energy need (east and west orientation), it can be observed that for heavy structure, the daily operative temperature for west orientation exceeds with 1.4–2.8 K the values obtained for east orientation, while the daily energy need for cooling can be even 2.3 times higher for east orientation in comparison on the west orientation of the facades.
In the case of light construction, the operative temperature differences can be 4.7–6.7 K, while the daily energy need for cooling can be 1.69 times higher for east orientation in comparison with the west orientation of facades.
The data presented in Table 4, Table 5, Table 6, Table 7, Table 8 and Table 9 might be useful for building renters and operators. The main point is that torrid days, hot and summer days are the most important because these days will be operating days of the cooling and ventilation systems, giving the energy consumption in a month or for a whole year.
A future research perspective is the analysis of the effect of the use of intelligent external blinds and PCMs on the cooling energy need. Furthermore, the relation between the behavior of occupants and cooling energy use has to be investigated.
Funding
This research was funded by Hungarian Academy of Sciences: BO/00237/18.
Institutional Review Board Statement
Not applicable.
Informed Consent Statement
Not applicable.
Data Availability Statement
Not applicable.
Acknowledgments
This paper was supported by the János Bolyai Research Scholarship of the Hungarian Academy of Sciences. The author would like to express their gratitude to the Agro-Meteorological Observatory, Debrecen, for providing indispensable meteorological data.
Conflicts of Interest
The author declares no conflict of interest.
Nomenclature
| Hve | Heat transfer by ventilation (W/K) |
| θair | Air temperature node (°C) |
| θsup | The supply temperature (°C) |
| Htr,w | Heat transfer by transmission is split into the window segment, (W/K) |
| Htr,op | The thermal mass (W/K) |
| θs | (A mix of θair and mean radiant temperature) and the node representing the mass of the building zone, θm (°C) |
| Cm | Thermal capacity (J/K) |
| Φint | Heat flow rate given by internal heat sources (W) |
| Φsol | Solar heat sources (W) |
| ΦHC | nd Energy need for cooling (W) |
| Af | Is the conditioned area (m2) |
| θair,10 | The air temperature obtained for a heating power of 10 W/m2 (°C) |
| θair,0 | Is the air temperature in free floating conditions (°C) |
| θair,set | Air temperature (°C) |
| S | Summer day |
| H | Hot day |
| T | Torrid day |
| IGH | Is the global solar radiation on horizontal surfaces (W/m2) |
| IdirH | Direct solar radiation on horizontal surfaces (W/m2) |
| IdifH | Diffuse solar radiation on horizontal surfaces (W/m2) |
| IdifV | Diffuse solar radiation on vertical surfaces (W/m2) |
| IdirSouth, IdirEast, IdirWest, IdirNorth | Direct solar radiation on vertical surfaces (W/m2) |
Appendix A
Methods for Measurements of the Operative Temperature
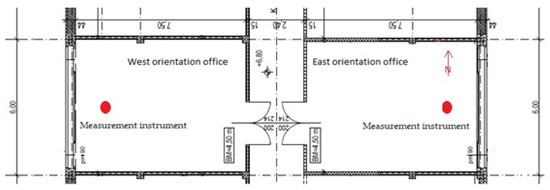
Figure A1.
Plan of the offices.
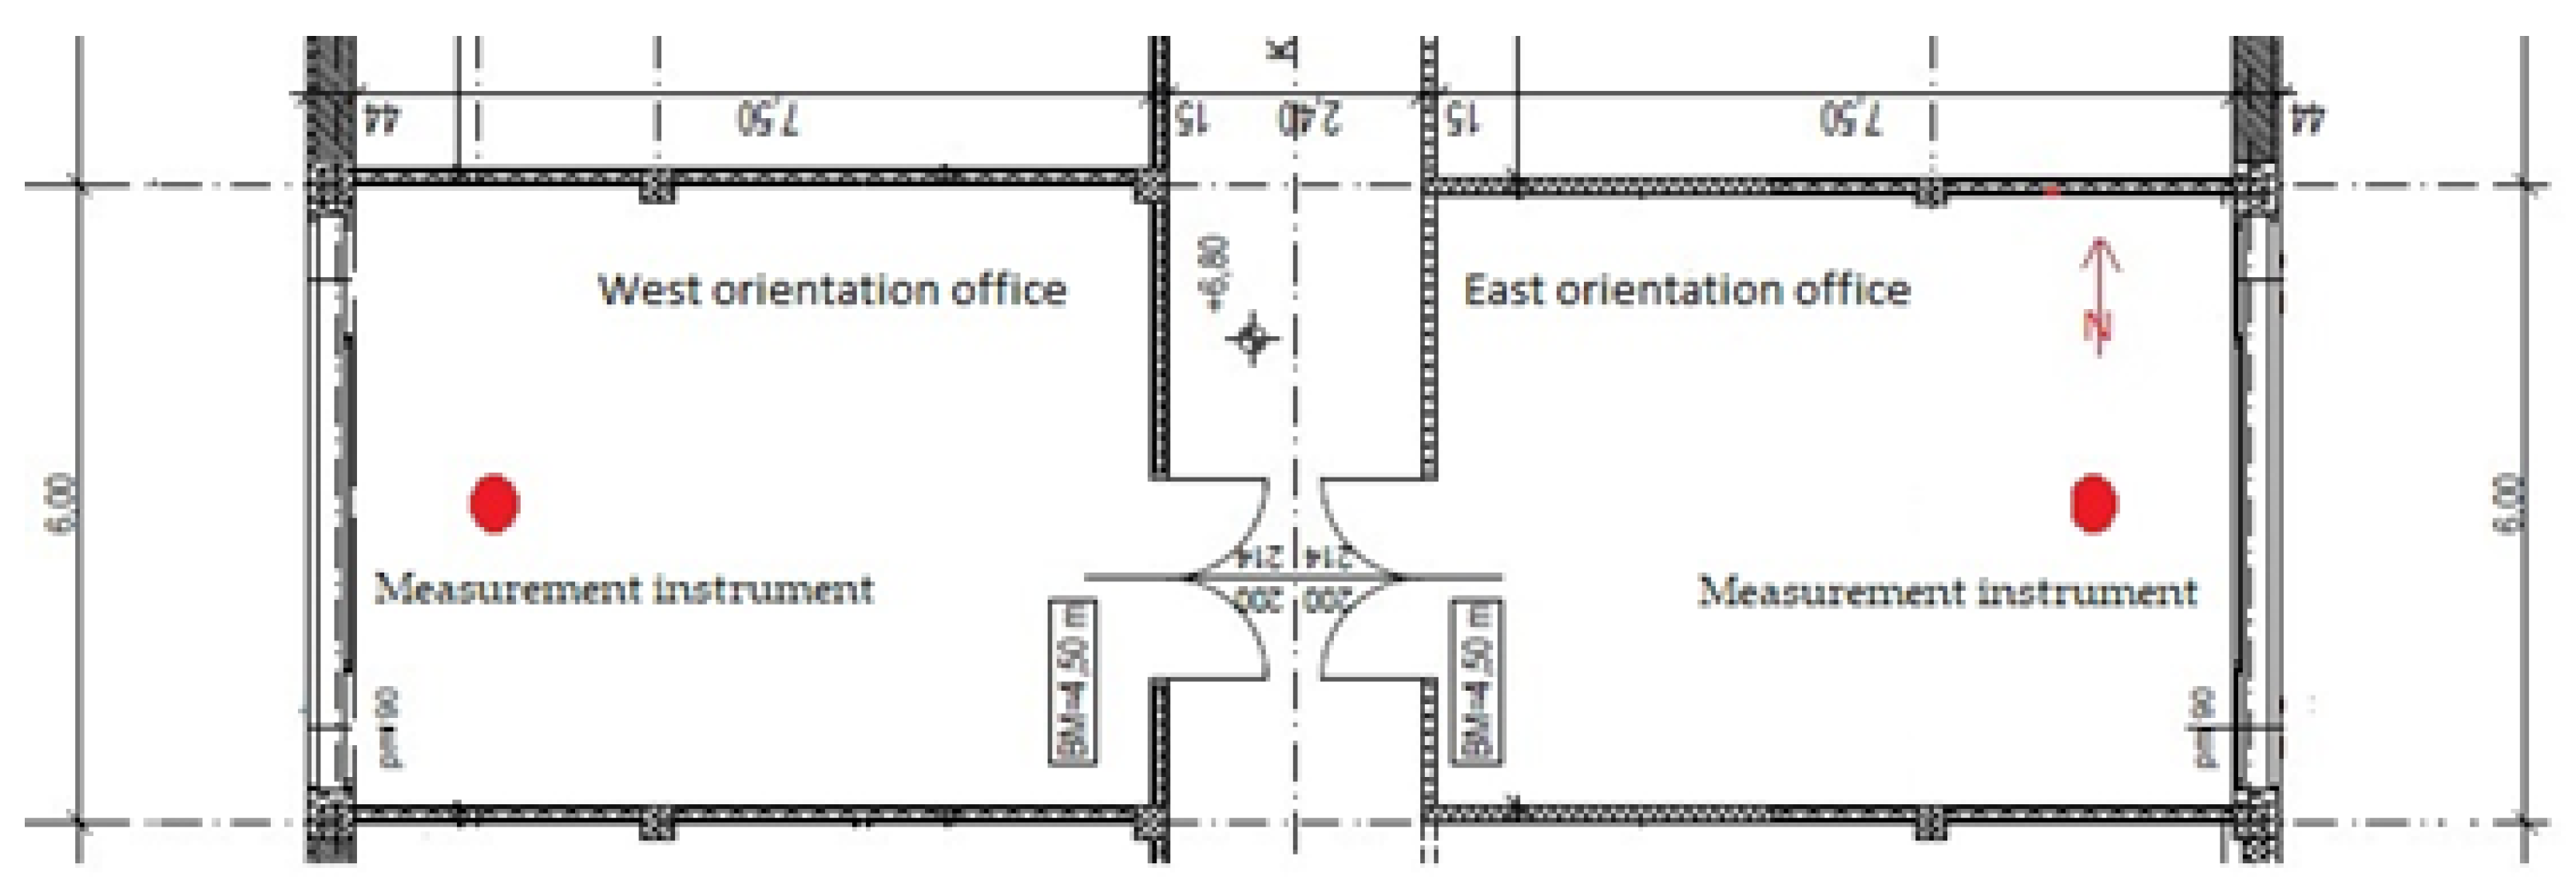

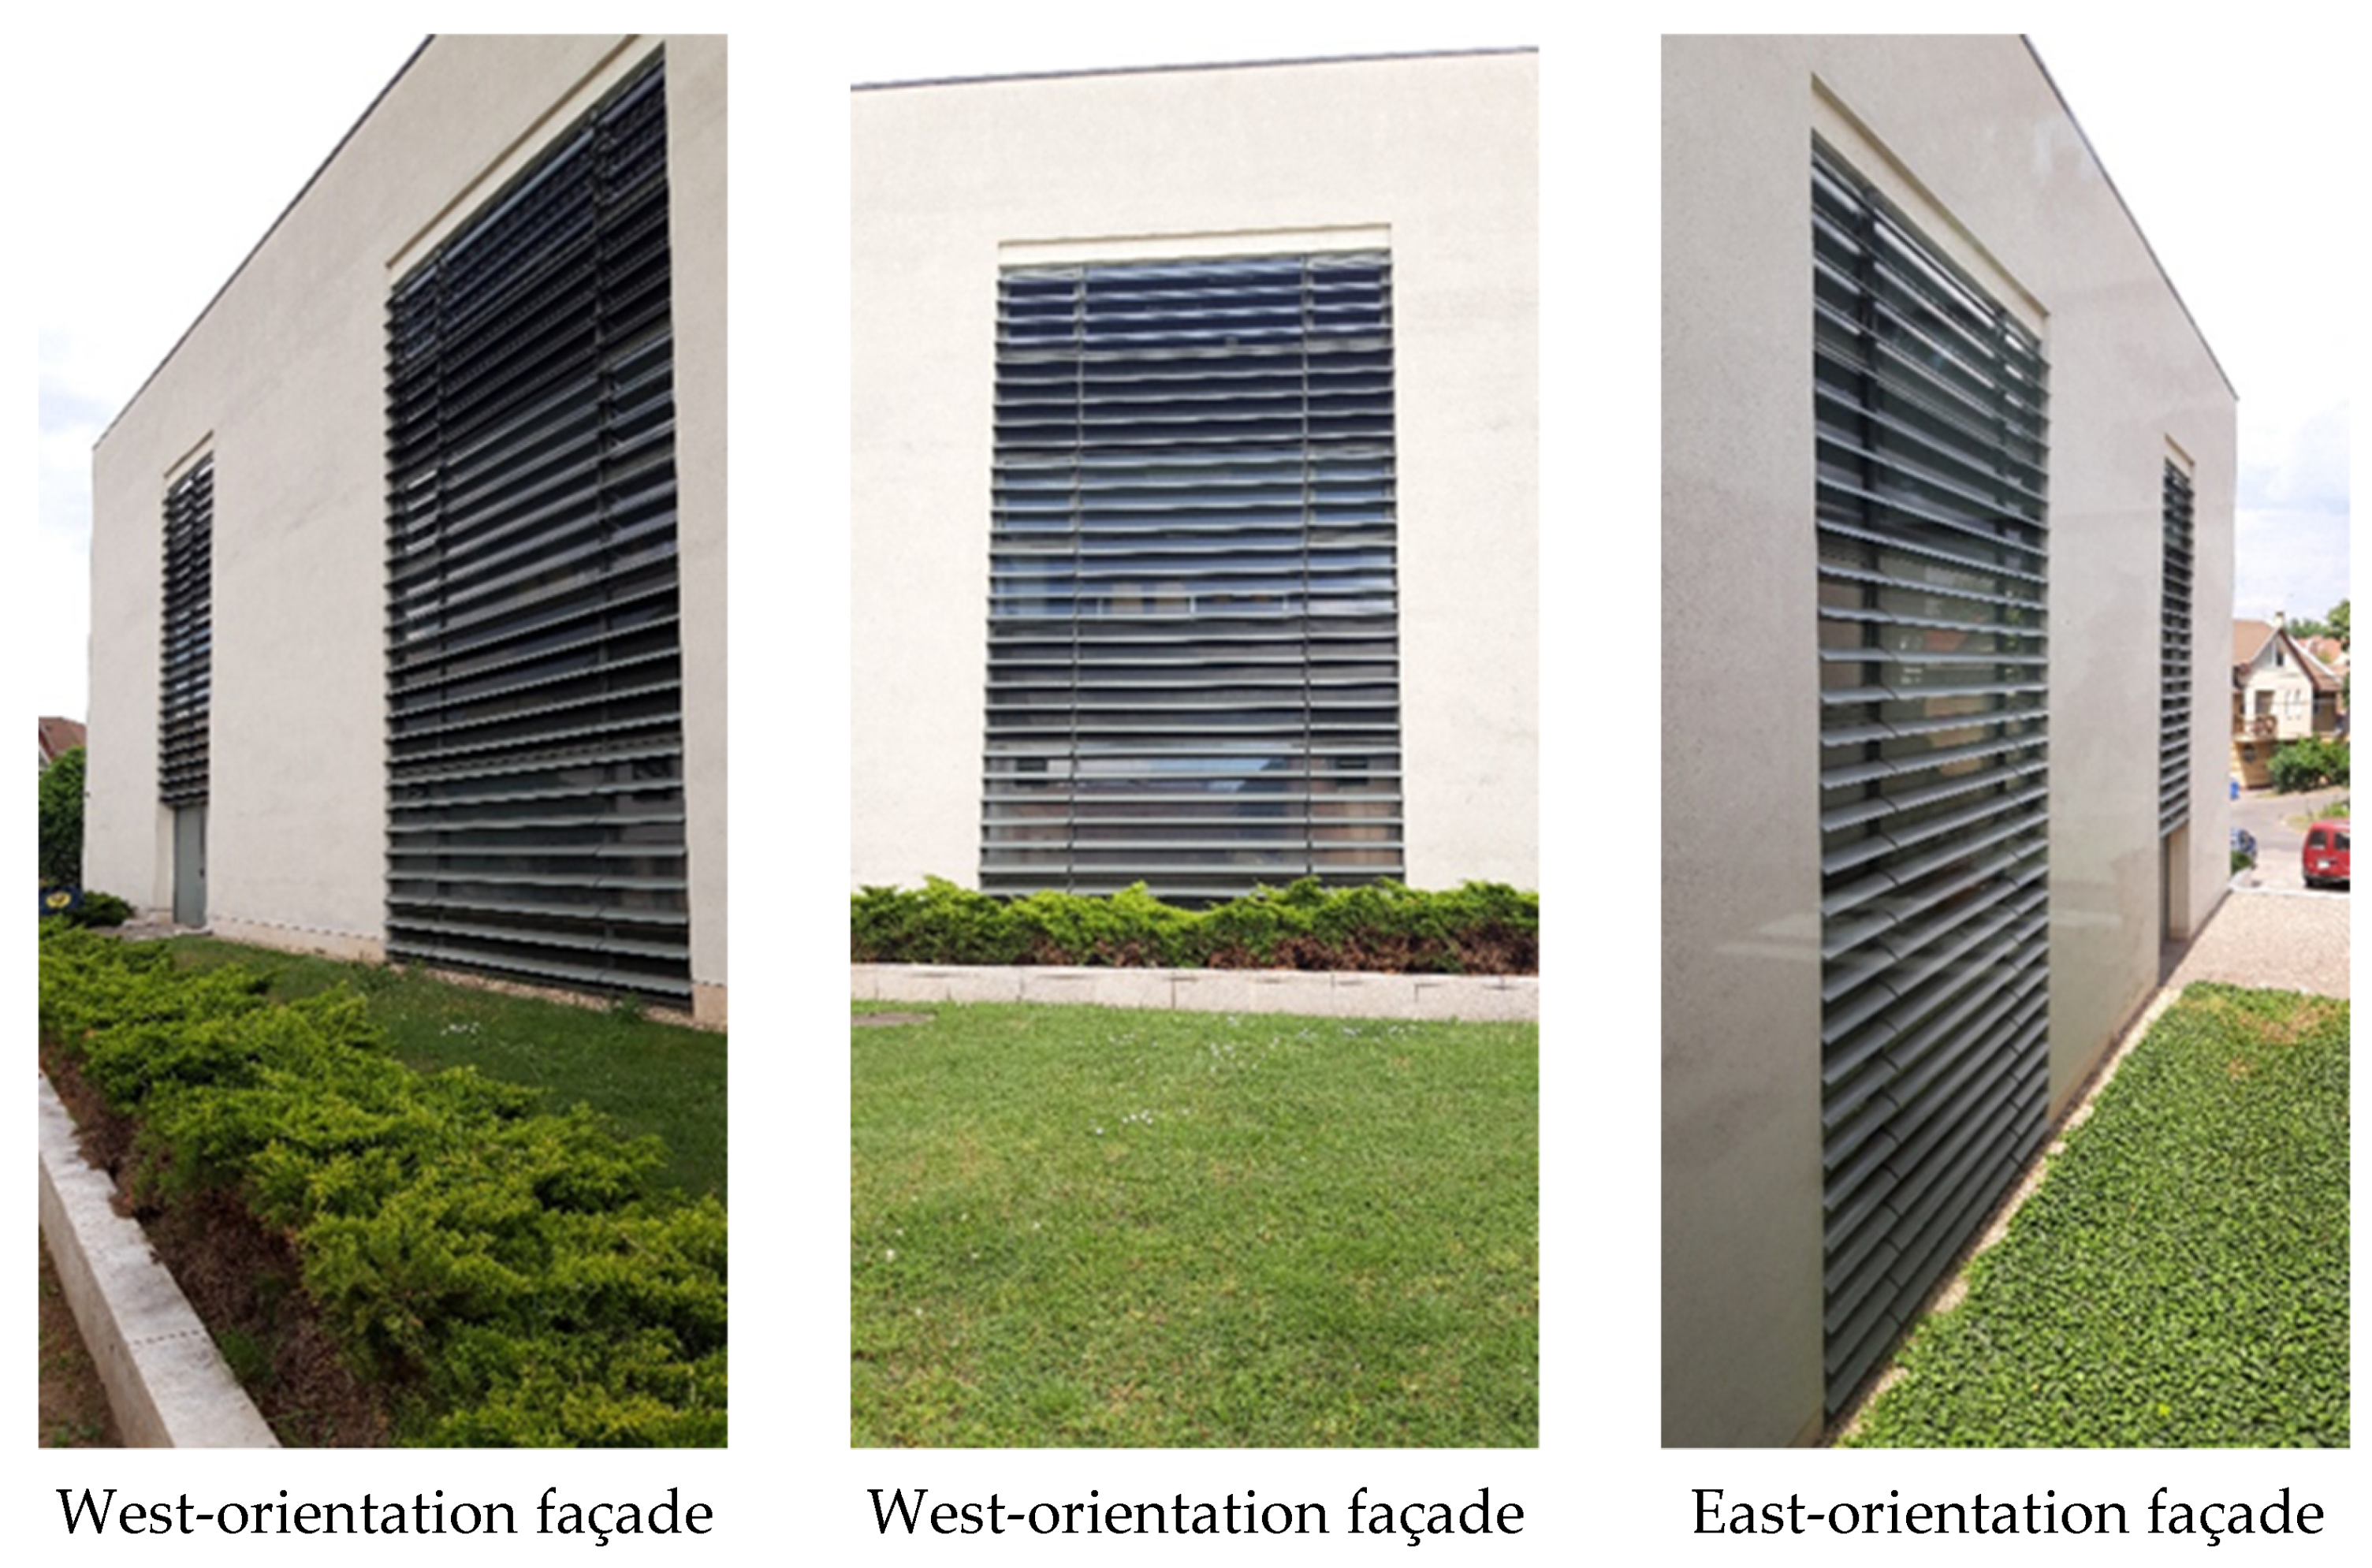
Figure A2.
Façade of the building with windows oriented to east and west.
Input Data for Calculation of the Operative Temperature and daily Energy Need for Cooling
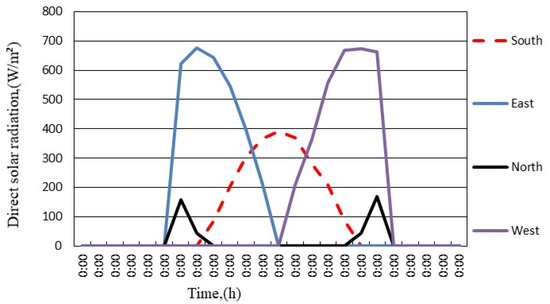
Figure A3.
Direct solar radiation values, summer day.
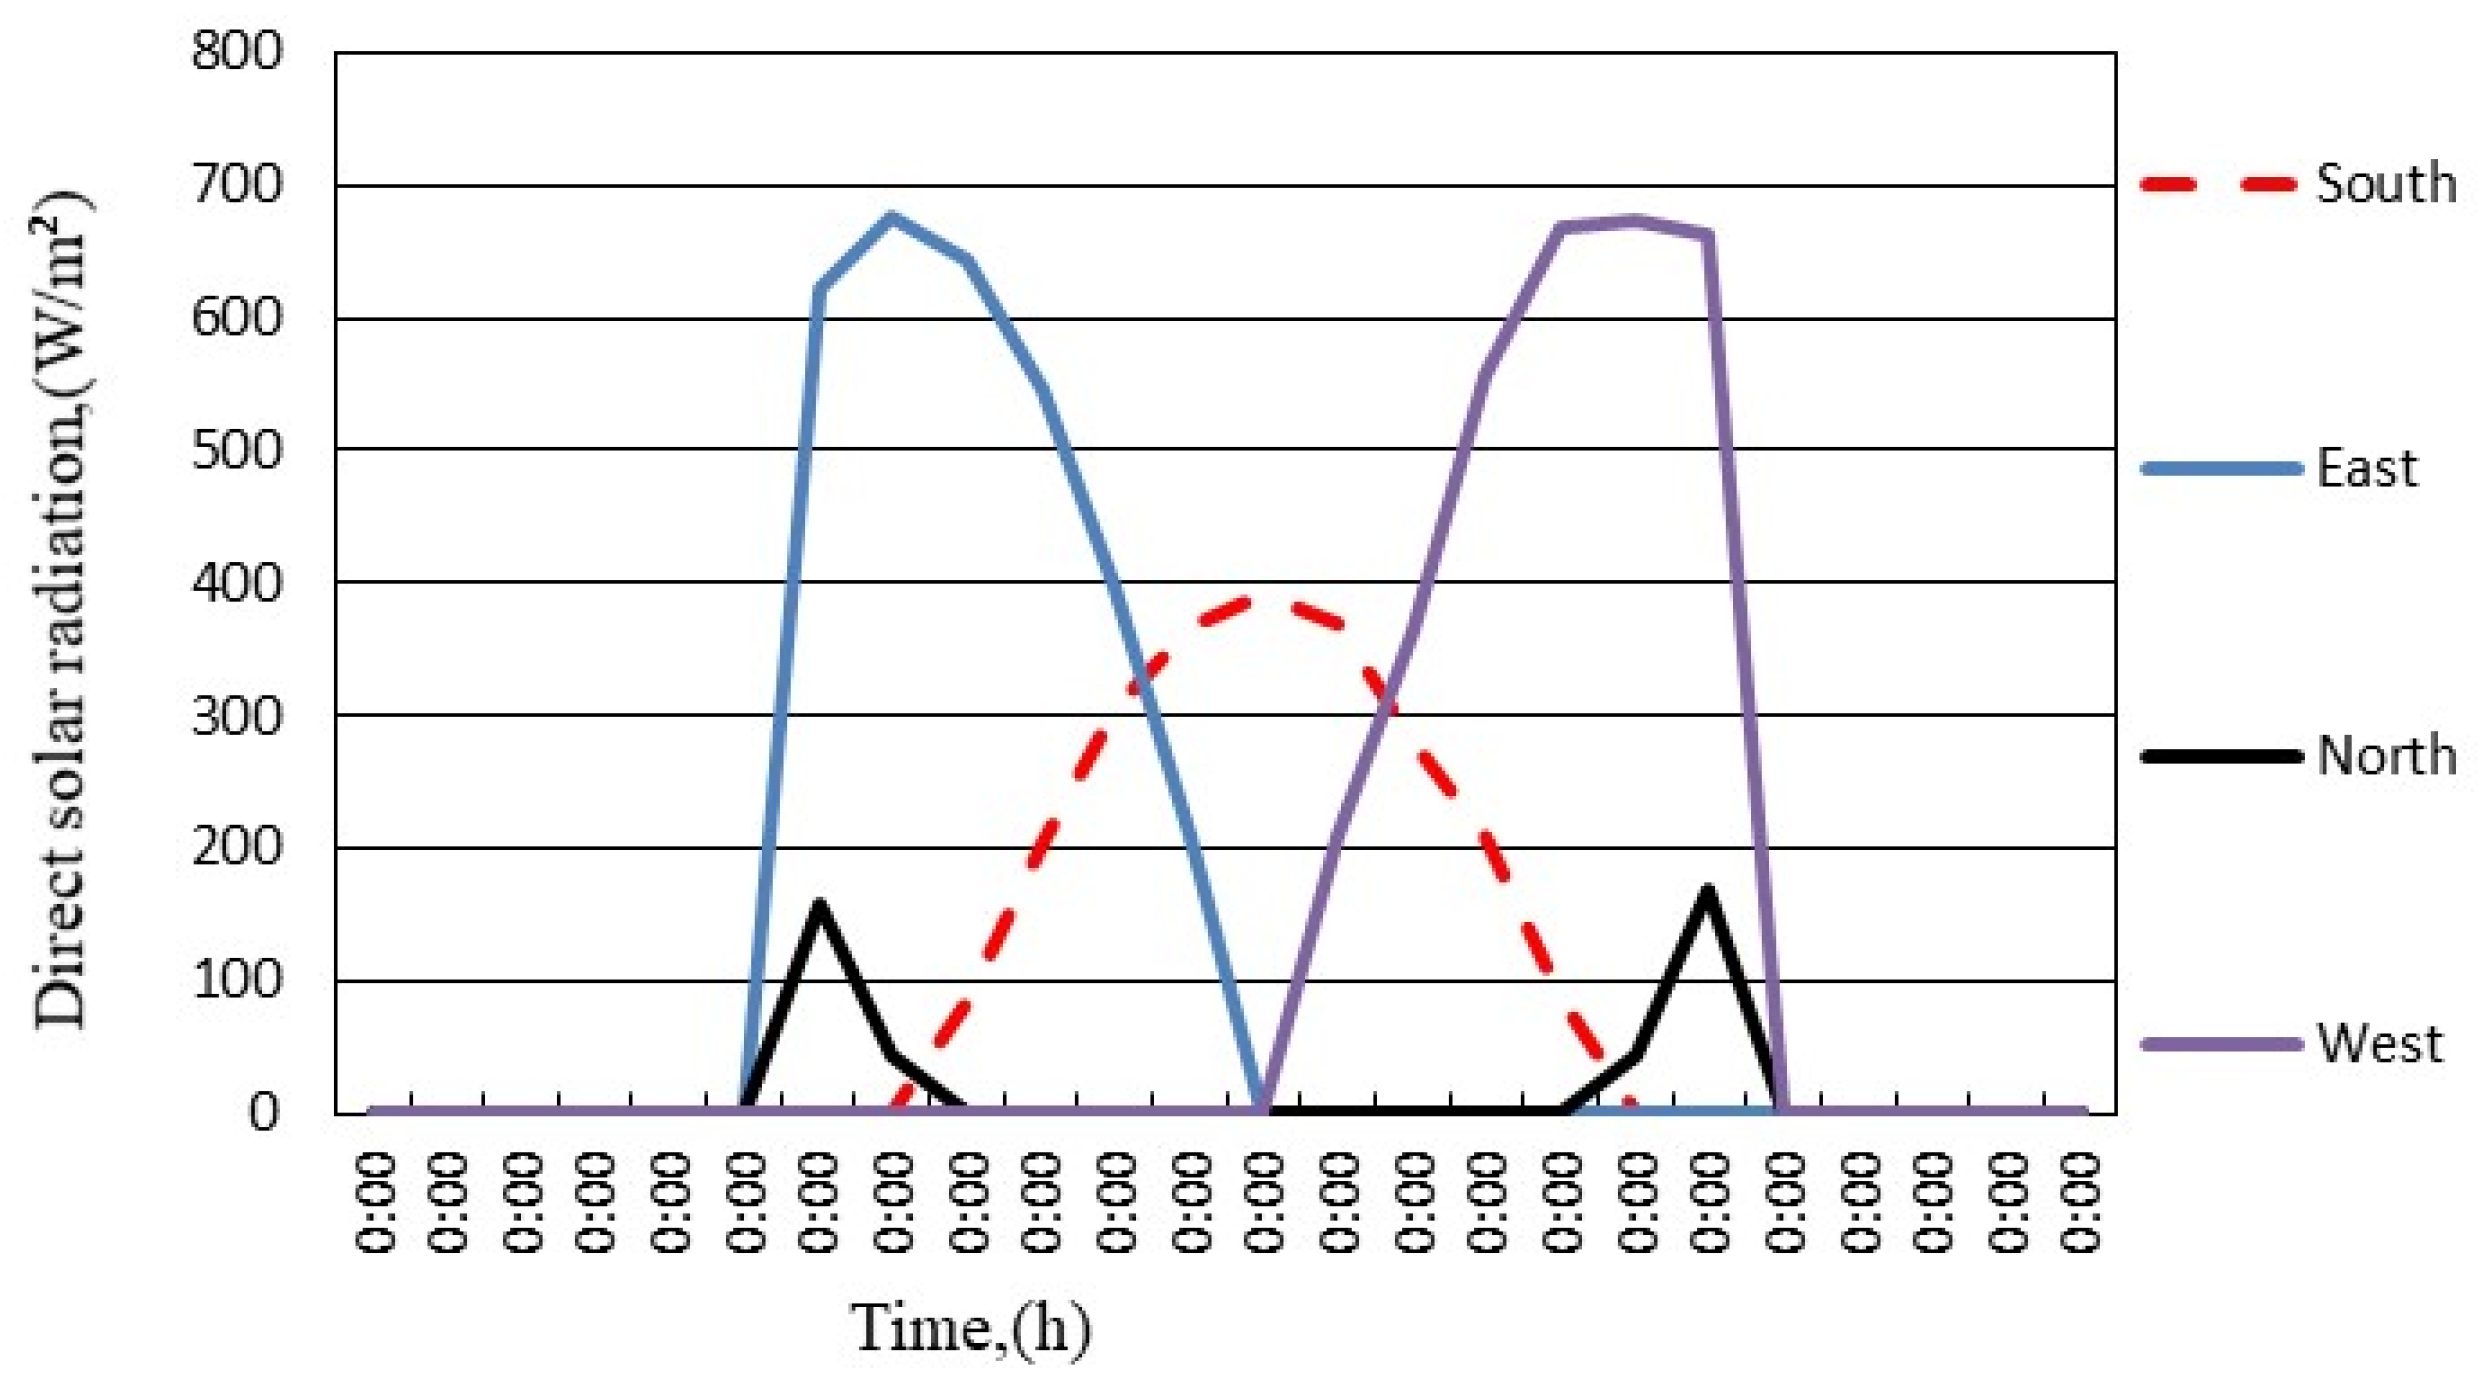
Figure A4.
Direct solar radiation values, hot day.
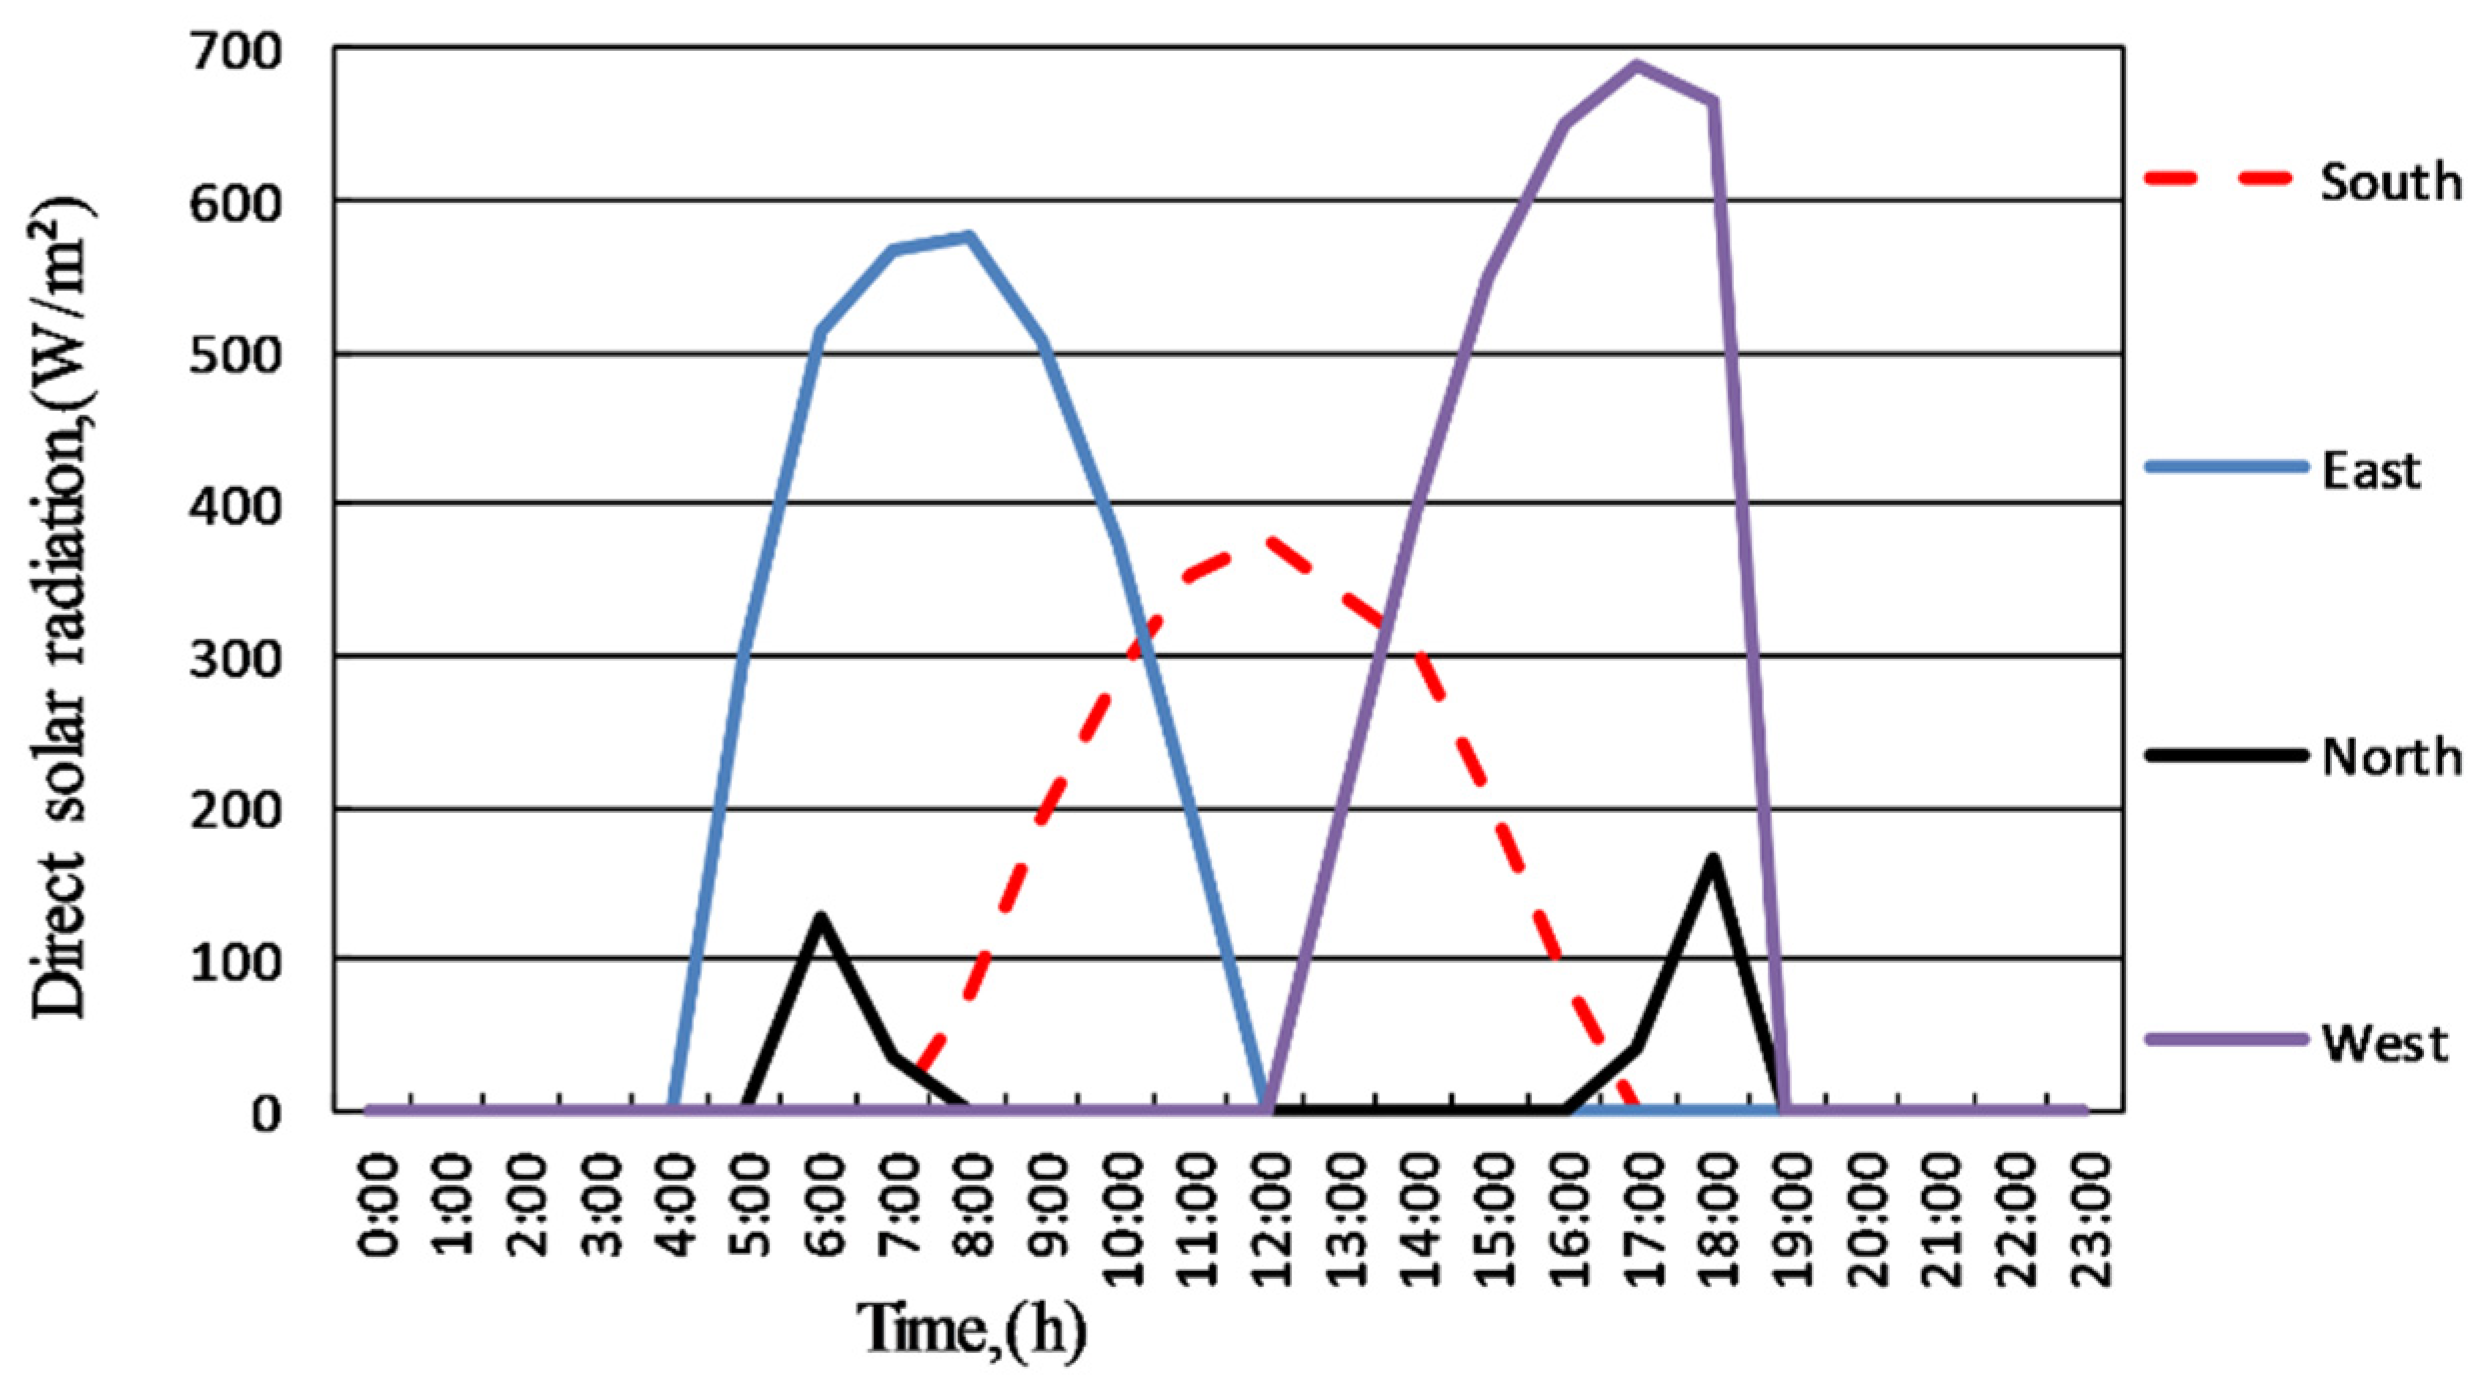
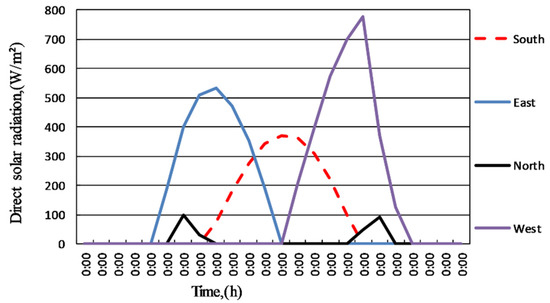
Figure A5.
Direct solar radiation values, torrid day.
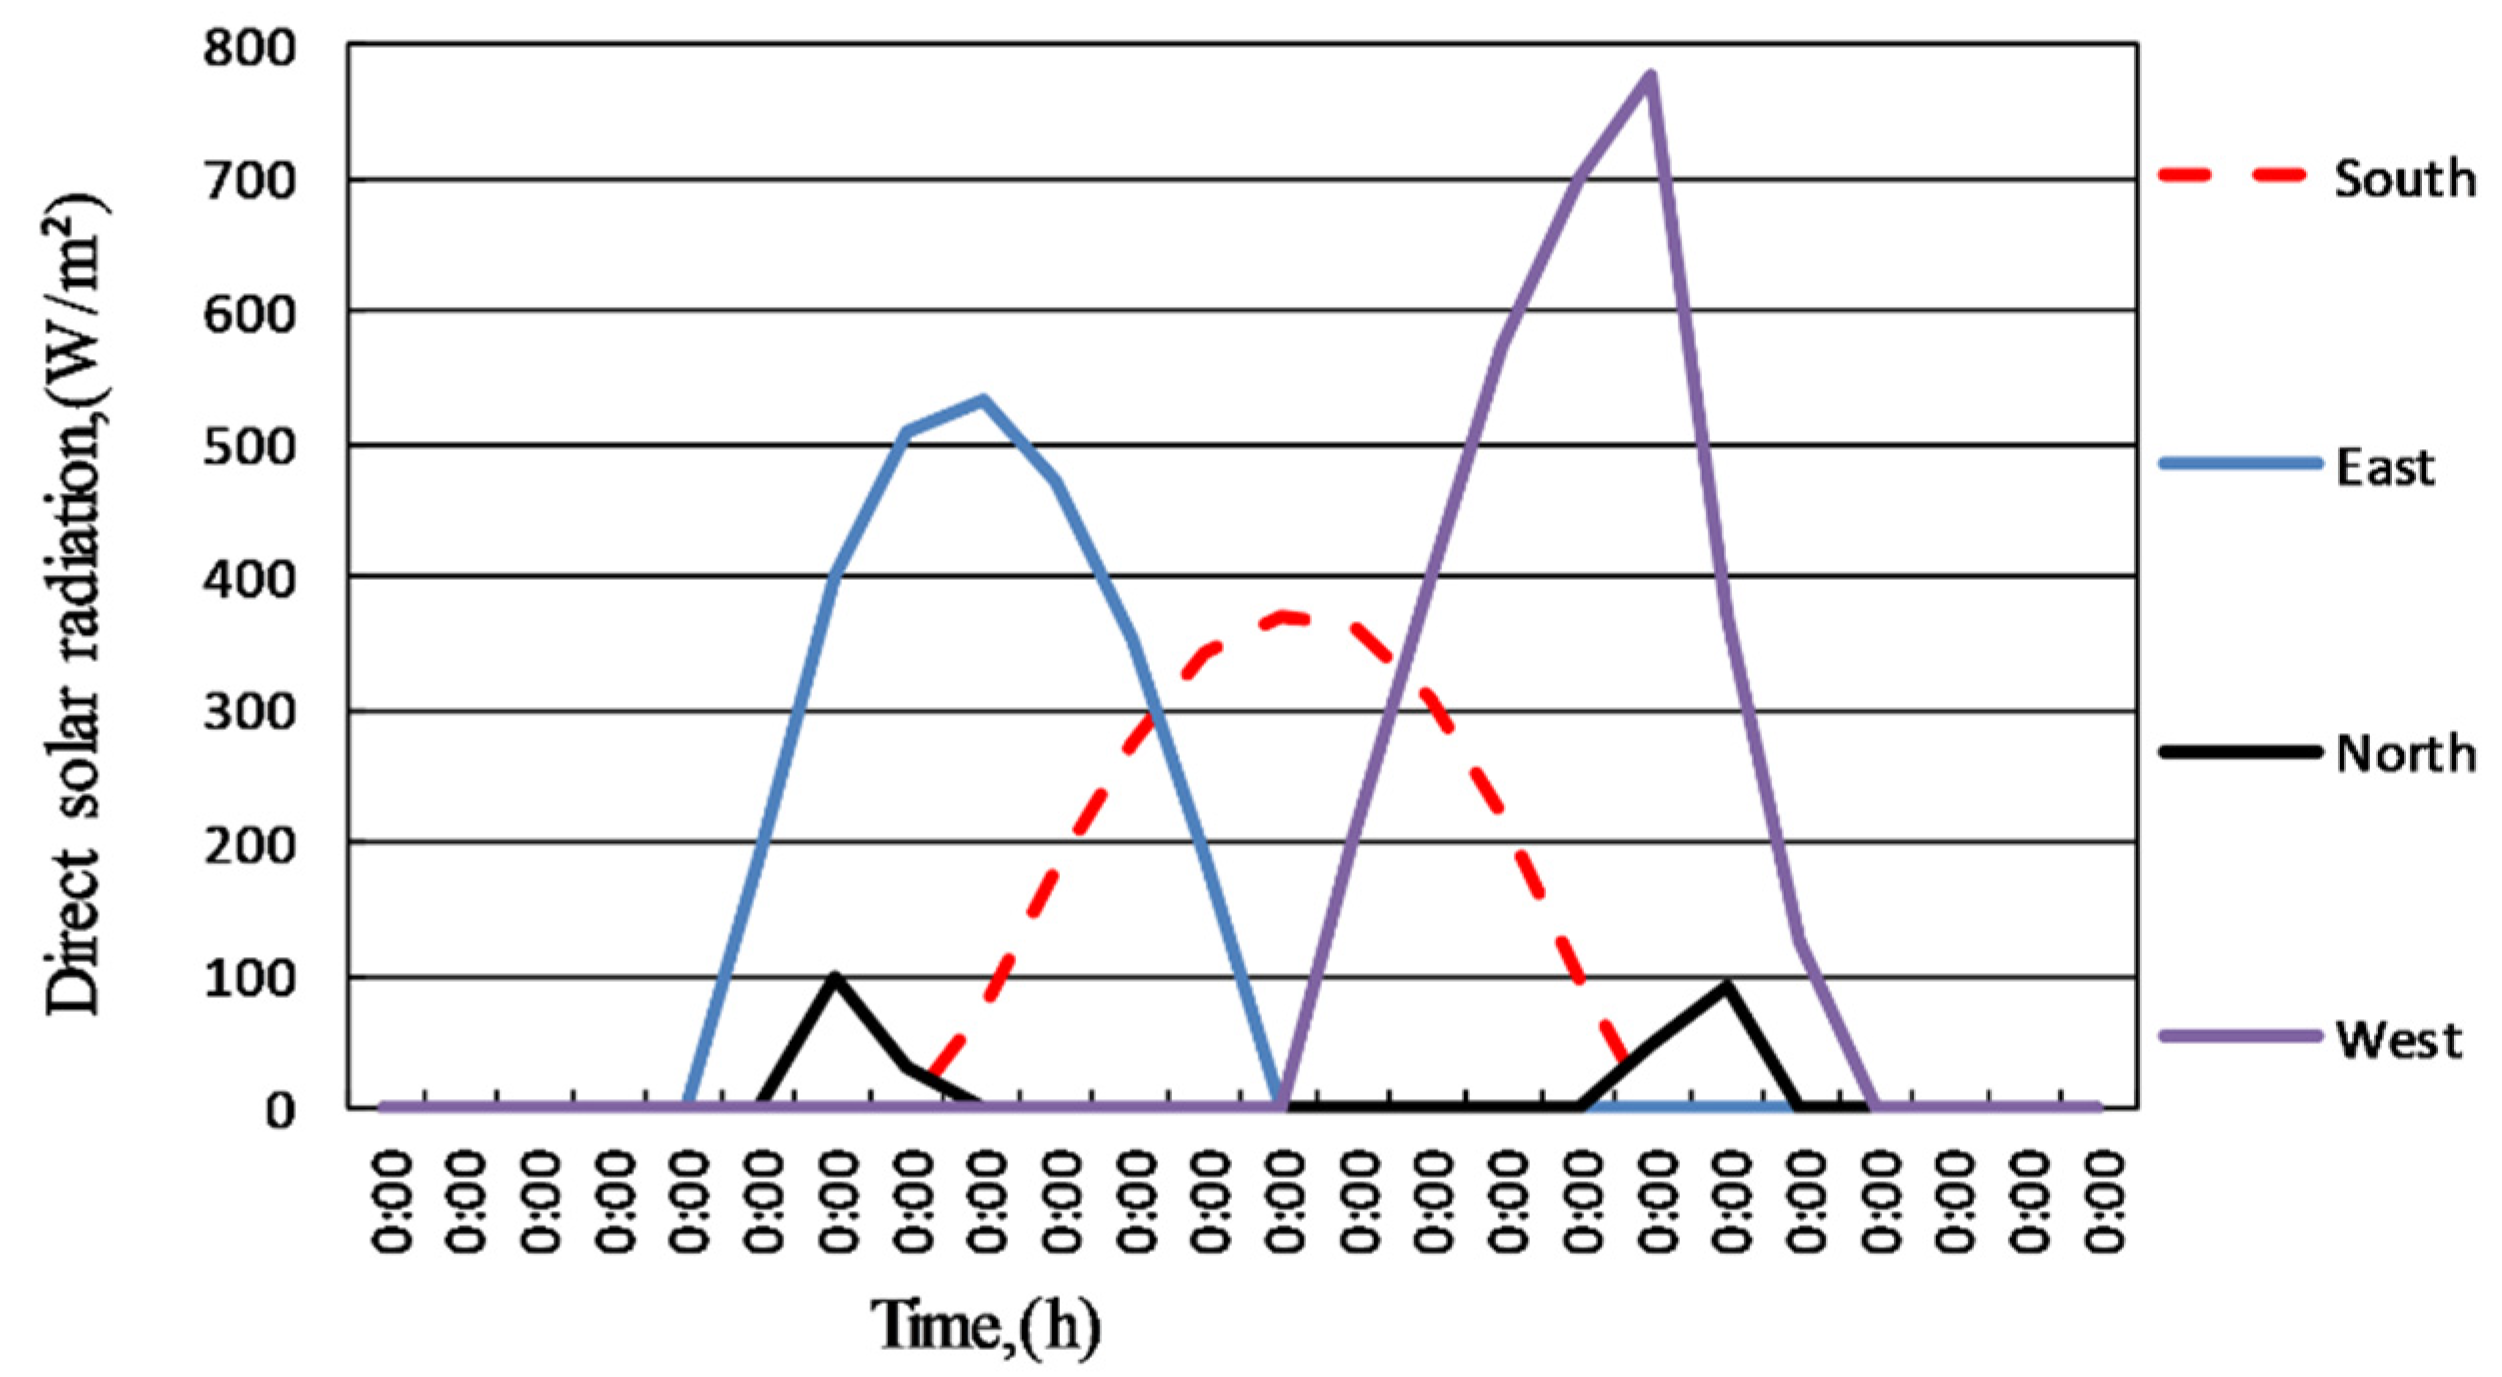
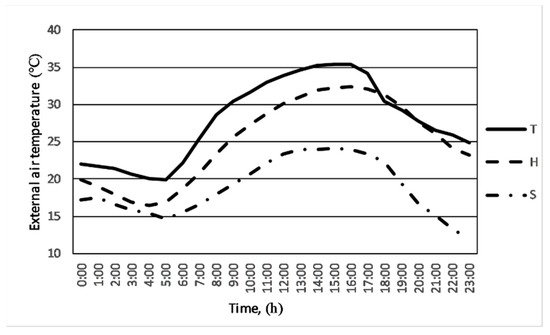
Figure A6.
External air temperature, S, H, T days.
Methods for Calculation of the Operative Temperature and Energy Need for Cooling
Calculation of the Operative Temperature

Figure A7.
Heavy construction, 50% window (summer, hot, torrid day), south orientation.
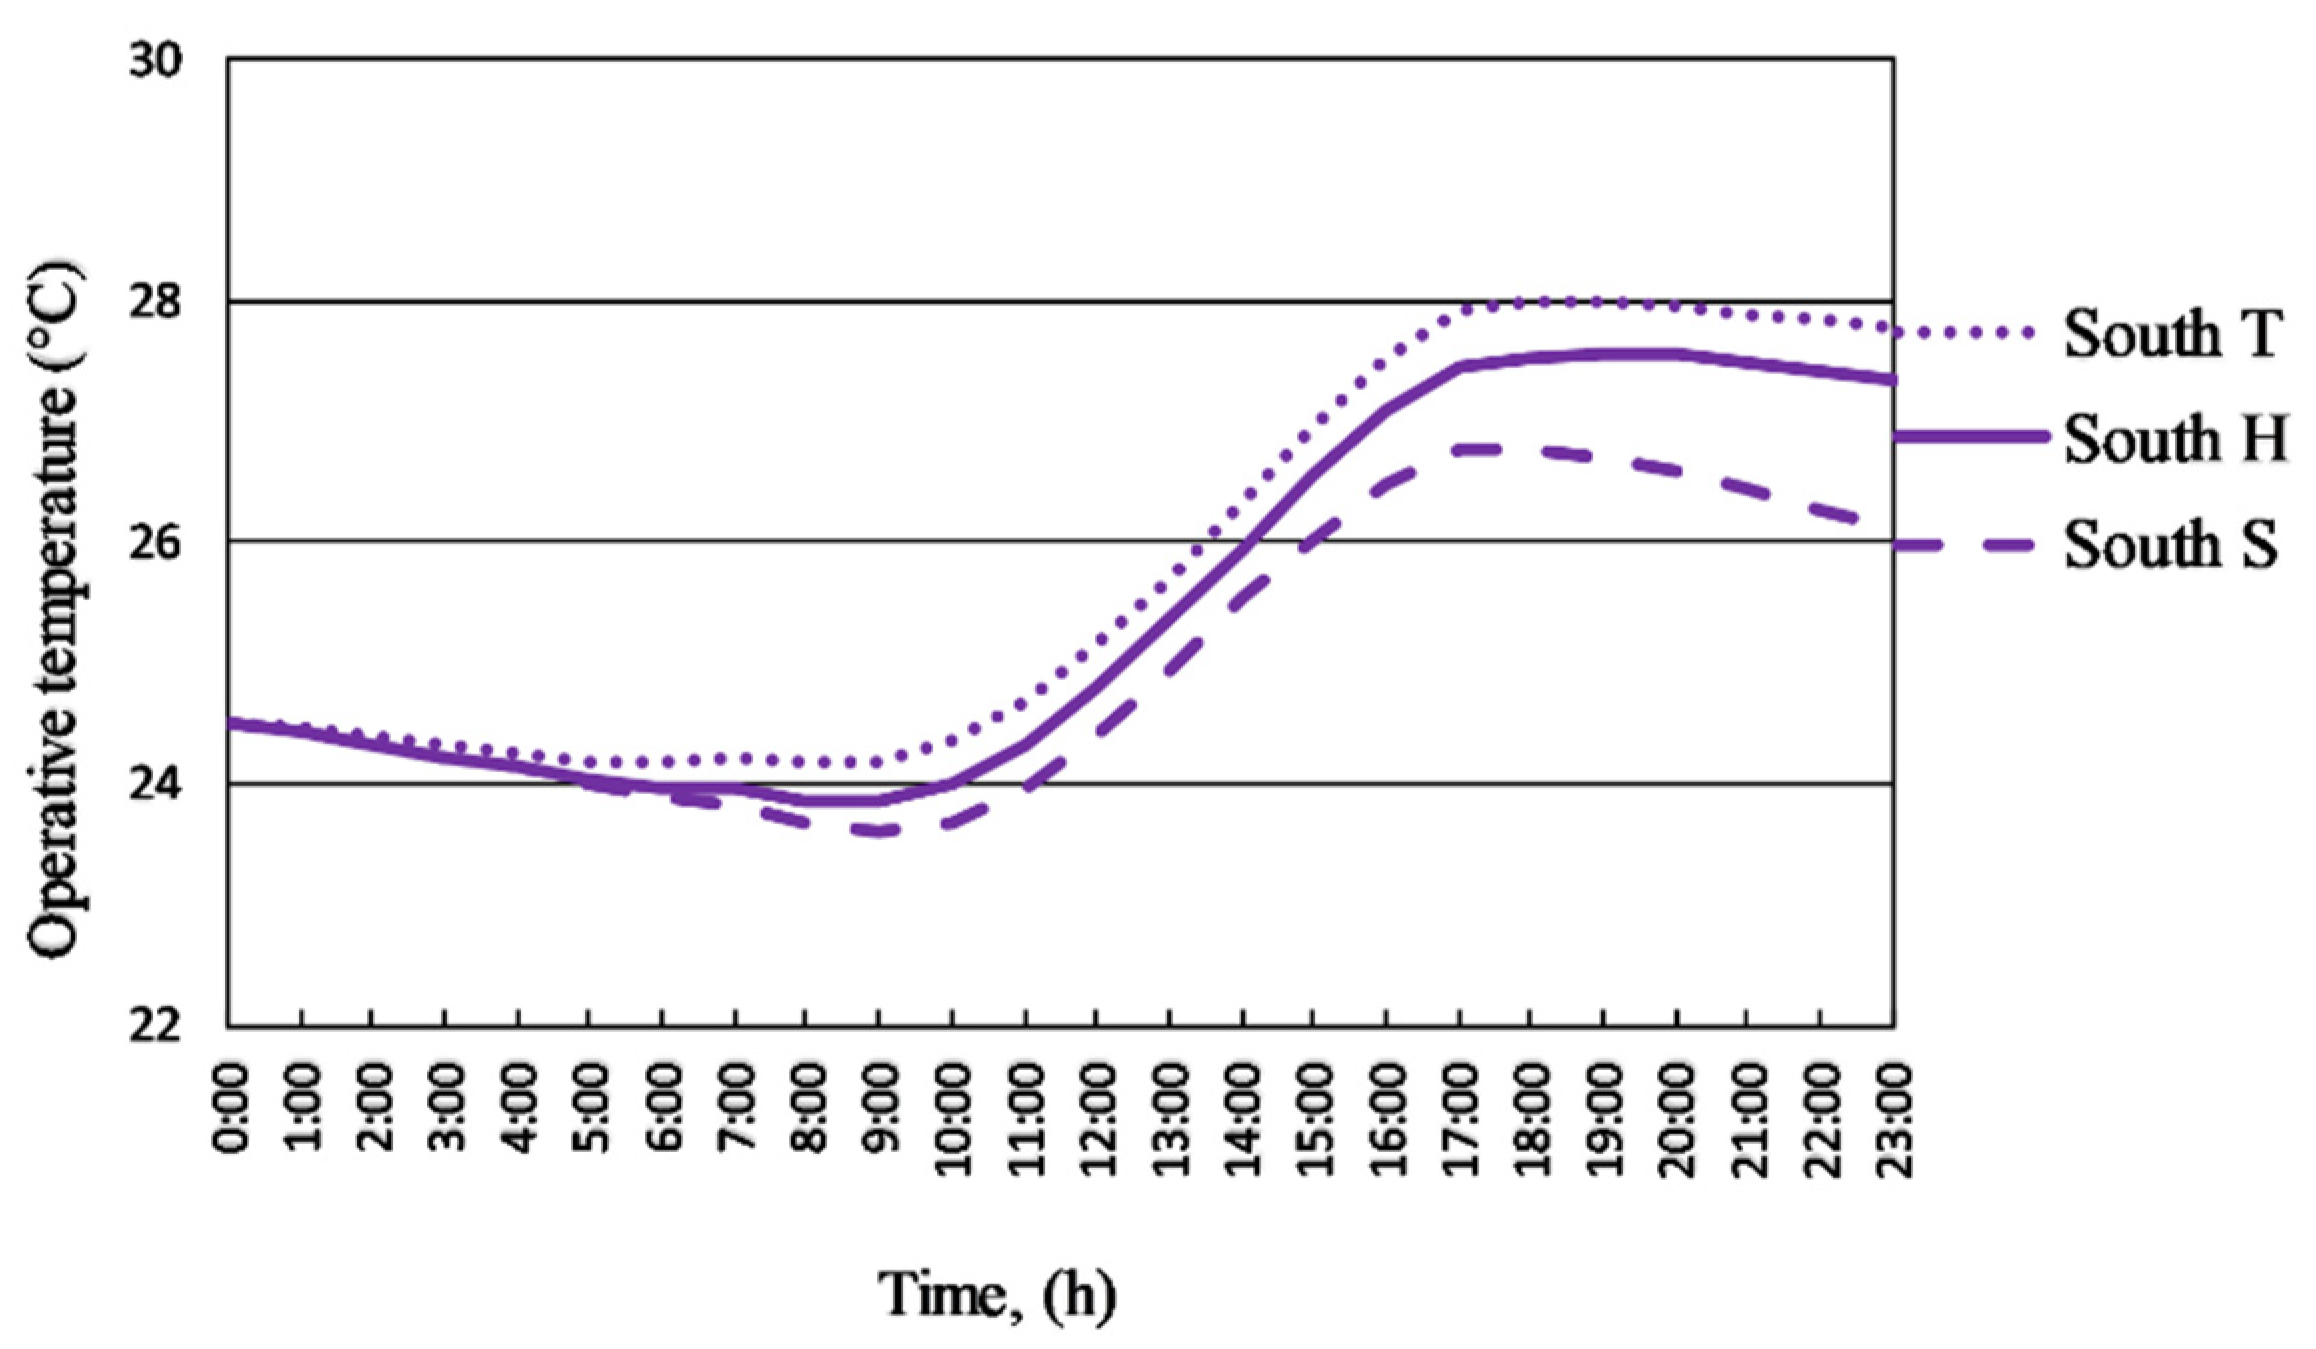
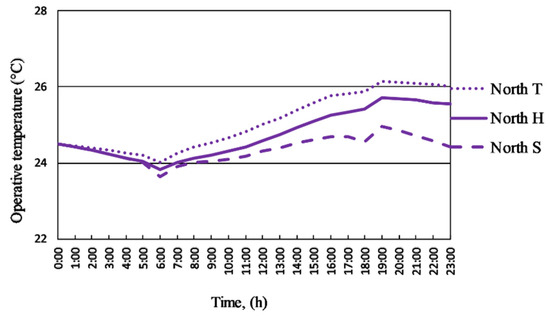
Figure A8.
Heavy construction, 50% window (summer, hot, torrid day), north orientation.
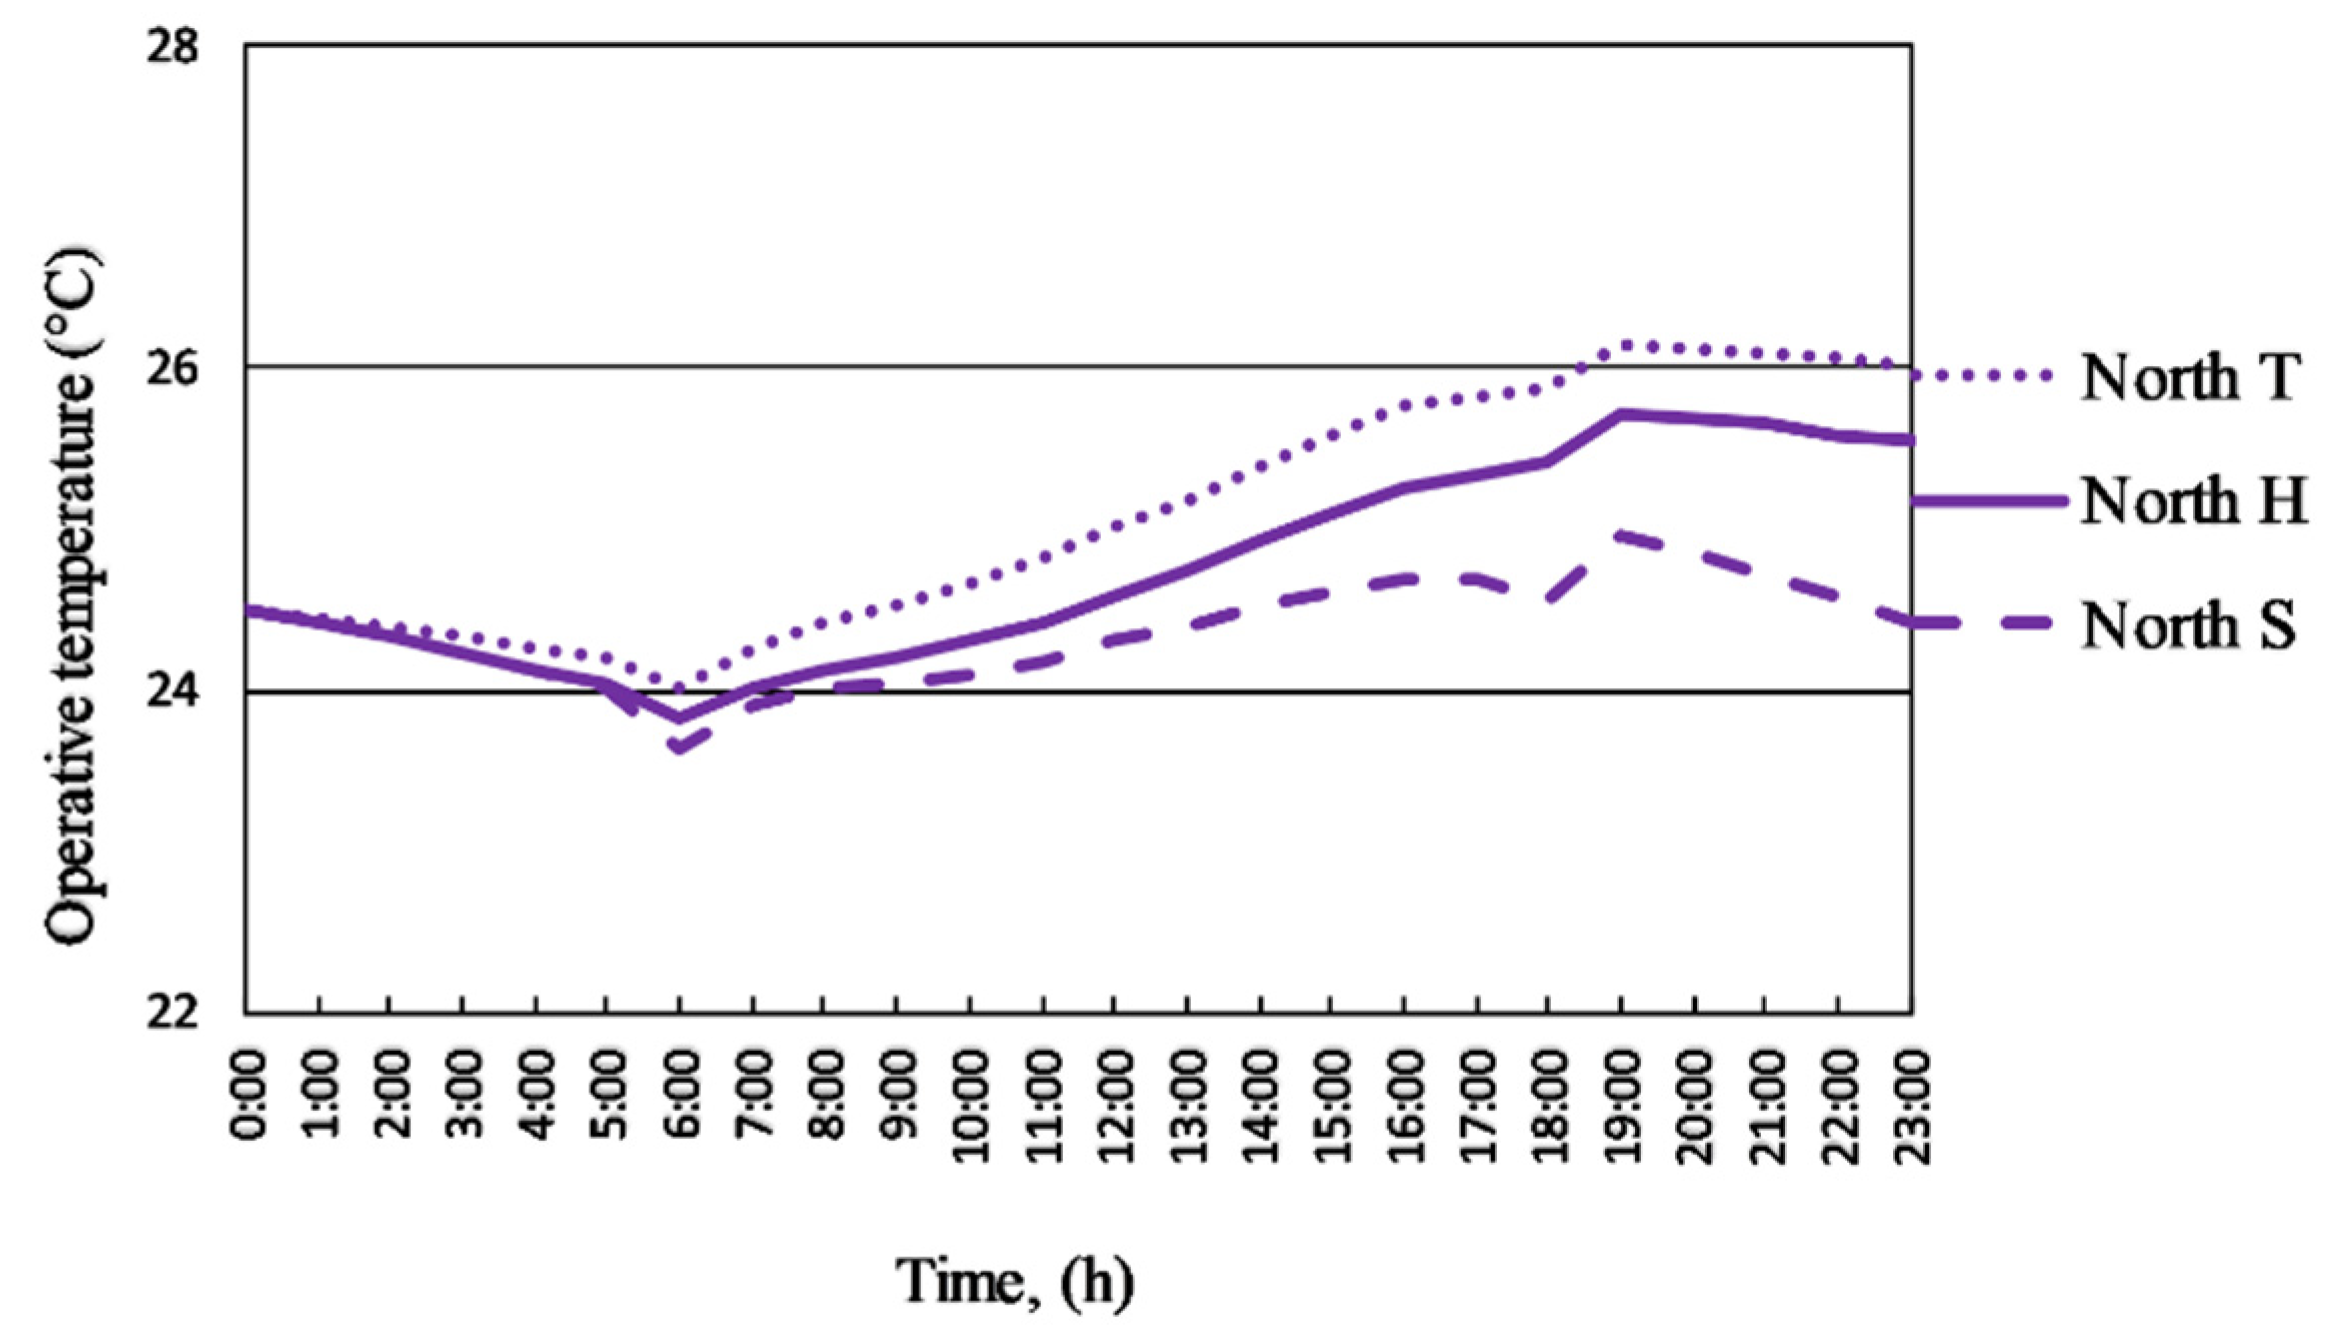
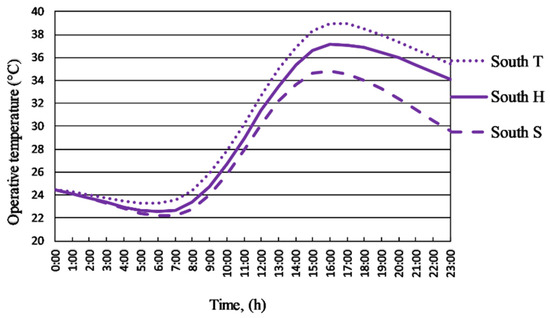
Figure A9.
Light construction, 50% window (summer, hot, torrid day), south orientation.

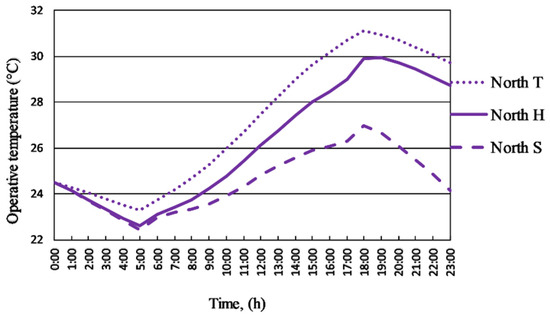
Figure A10.
Light construction, 50% window (summer, hot, torrid day), north orientation.

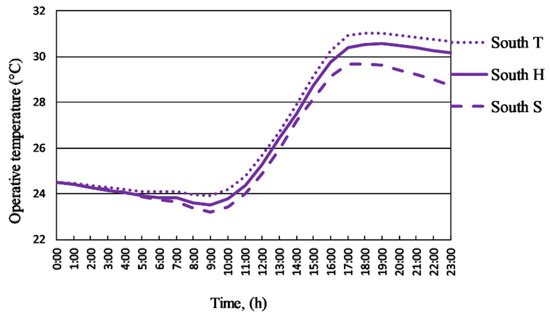
Figure A11.
Heavy construction, 100% window (summer, hot, torrid day), south orientation.

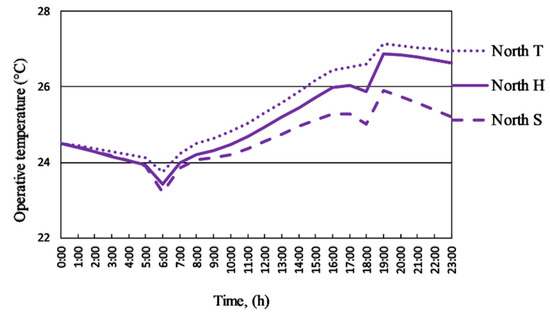
Figure A12.
Heavy construction, 100% window (summer, hot, torrid day), north orientation.

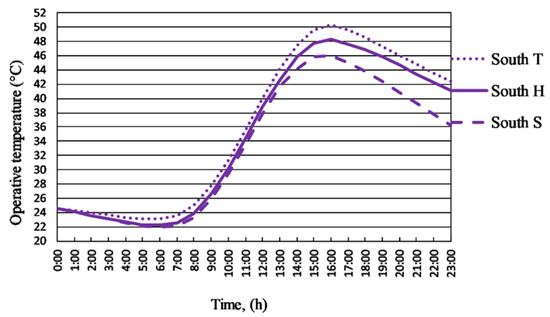
Figure A13.
Light construction, 100% window (summer, hot, torrid day), south orientation.
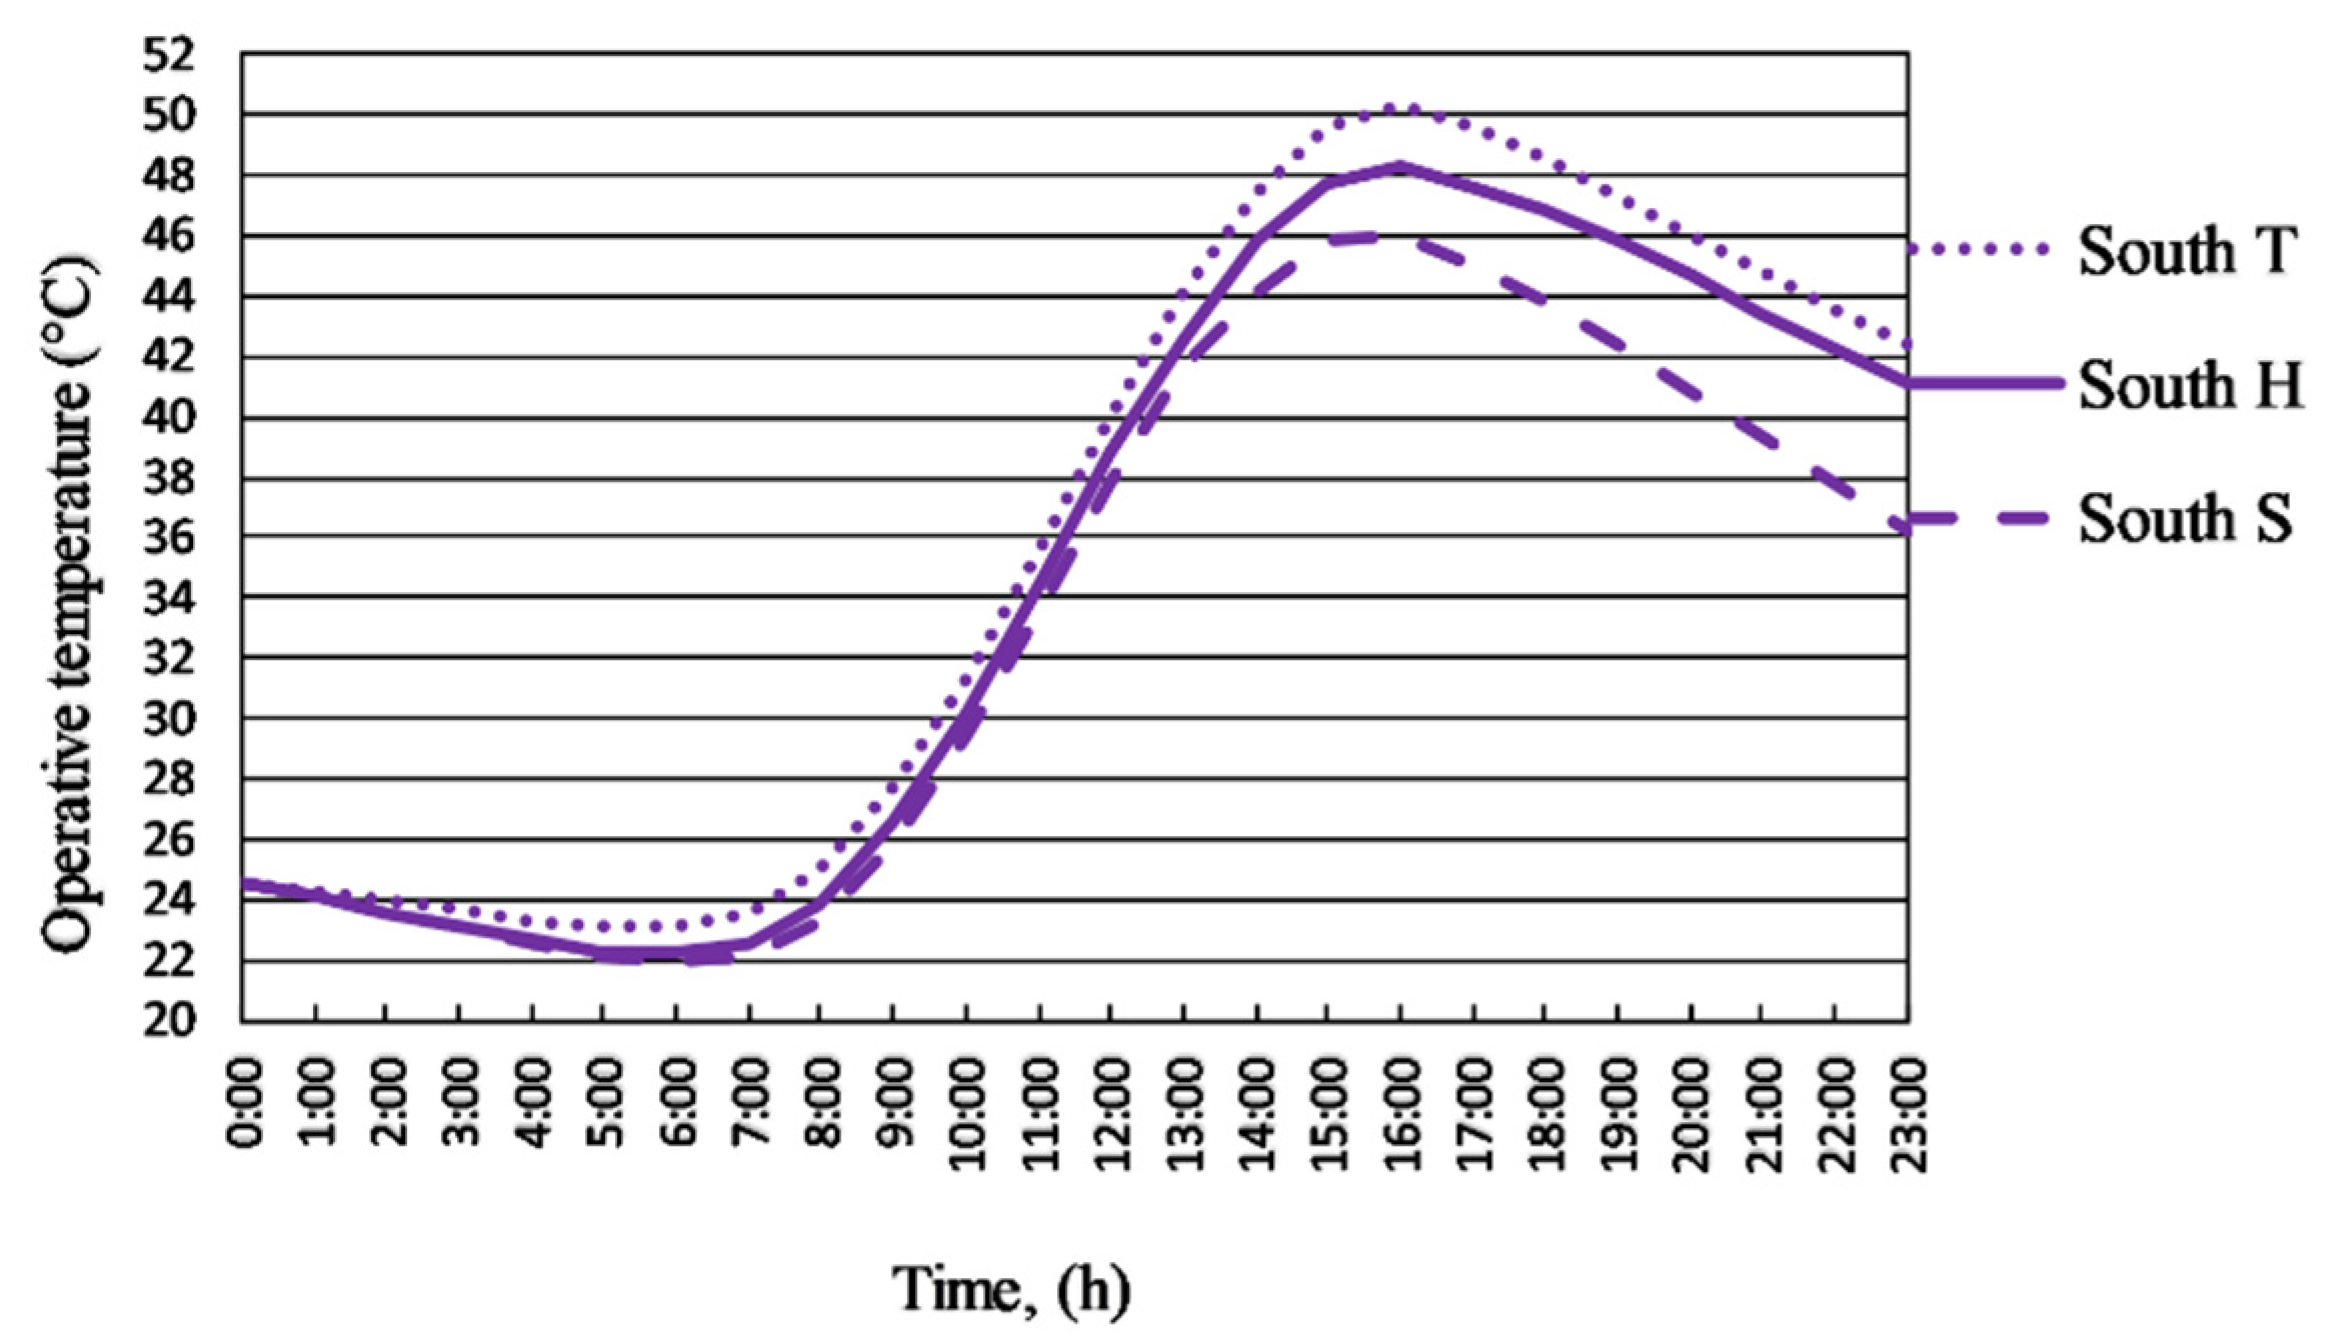
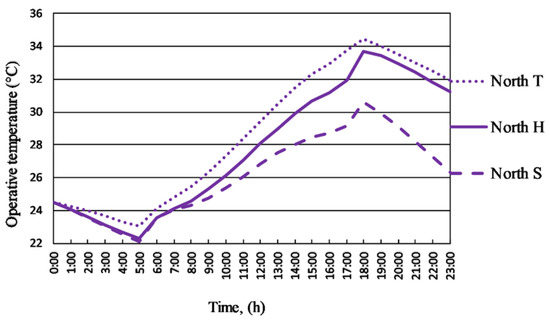
Figure A14.
Light construction, 100% window (summer, hot, torrid day), north orientation.

References
- Szabó, L.G.; Kalmár, F. Parametric Analysis of Buildings’ Heat Load Depending on Glazing: Hungarian Case Study. Energies 2018, 11, 12. [Google Scholar] [CrossRef] [Green Version]
- Szabó, L.G.; Kalmár, F. Investigation of energy and exergy performances of radiant cooling systems in buildings: A design approach. Energy 2019, 185, 449–462. [Google Scholar] [CrossRef]
- Manfren, M.; Nastasi, B.; Piana, E.; Tronchin, L. On the link between energy performance of building and thermal comfort: An example. AIP Conf. Proc. 2019, 2123, 020066. [Google Scholar] [CrossRef]
- Majewski, G.; Orman, L.J.; Telejko, M.; Radek, N.; Pietraszek, J.; Dudek, A. Assessment of Thermal Comfort in the Intelligent Buildings in View of Providing High Quality Indoor Environment. Energies 2020, 13, 1973. [Google Scholar] [CrossRef]
- Kalmár, T.; Kalmár, F. Investigation of natural aeration in home offices during the heating season: Case study. J. Build. Eng. 2021, 35, 102052. [Google Scholar] [CrossRef]
- Bullová, I.; Kapolo, P.; Katunský, D. Quantification of Air Change Rate by Selected Methods in a Typical Apartment Building. Buildings 2021, 11, 174. [Google Scholar] [CrossRef]
- Santamouris, M. Cooling the buildings—Past, presents and future. Energy Build. 2016, 128, 617–638. [Google Scholar] [CrossRef]
- Huang, K.-T.; Hwang, R.-L. Future trends of residential building cooling energy and passive adaptation measures to counteract climate change: The case of Taiwan. Appl. Energy 2016, 184, 1230–1240. [Google Scholar] [CrossRef]
- Mousavi Motlagh, S.F.; Sohani, A.; Djavad Saghafi, M.; Sayyaadi, H.; Nastasi, B. The Road to Developing Economically Feasible Plans for Green, Comfortable and Energy Efficient Buildings. Energies 2021, 14, 636. [Google Scholar] [CrossRef]
- European Commission. Commission Staff Working Document Evaluation of Directive 2010/31/EU on the Energy Performance of Buildings. Available online: https://ec.europa.eu/info/sites/default/files/swd-2016-408-final_en_0.pdf (accessed on 15 July 2021).
- Hungarian Energy and Public Utility Regulatory Authority. Available online: http://www.mekh.hu/evrol-evre-no-a-legkondicionalo-berendezesek-villamosenergia-fogyasztasa (accessed on 19 July 2021).
- Long, L.; Ye, H. The roles of thermal insulation and heat storage in the energy performance of the wall materials: A simulation study. Sci. Rep. 2016, 6, 24181. [Google Scholar] [CrossRef] [PubMed]
- Bazazzadeh, H.; Pilechiha, P.; Nadolny, A.; Mahdavinejad, M.; Hashemi Safaei, S.S. The Impact Assessment of Climate Change on Building Energy Consumption in Poland. Energies 2021, 14, 4084. [Google Scholar] [CrossRef]
- Reilly, A.; Kinnane, O. The impact of thermal mass on building energy consumption. Appl. Energy 2017, 198, 108–121. [Google Scholar] [CrossRef] [Green Version]
- ISO: 52000-1. Energy Performance of Buildings—Overarching EPB Assessment—Part 1: General Framework and Procedures; International Standardization Organization: Geneva, Switzerland, 2017. [Google Scholar]
- ISO: EN 13790:2008. Energy Performance of Buildings—Calculation of Energy Use for Space Heating and Cooling; European Committee for Standardization: Brussels, Belgium, 2008. [Google Scholar]
- Csáky, I.; Kalmar, F. Effects solar asymmetry on building’s cooling energy needs. J. Build. Phys. 2015, 1, 35–54. [Google Scholar]
- Csáky, I.; Kalmár, F. Effect of thermal mass, ventilation, and glazing orientation on indoor air temperature in buildings. J. Build. Phys. 2015, 39, 189–204. [Google Scholar] [CrossRef] [Green Version]
- Oh, S.; Song, S. Detailed Analysis of Thermal Comfort and Indoor Air Quality Using Real-Time Multiple Environmental Monitoring Data for a Childcare Center. Energies 2021, 14, 643. [Google Scholar] [CrossRef]
- The Testo Saveris Measurement System. Measurement Data Monitoring with Testo Saveris Professional Edition, Instruction Manual. Available online: https://www.testo.com/hu-HU/saveris-bazis-gsm-modullal/p/0572-0221 (accessed on 9 June 2021).
- Halverson, R.; Hart, R.; Athalye, W. ANSI/ASHRAE/IES Standard 90.1—2013 Determination of Energy Savings: Qualitative Analysis; Pacific Nortwest National Laboratory (PNNL): Richland, WA, USA, 2014. [Google Scholar]
- Baumann, M.; Csoknyai, T.; Kalmár, F.; Magyar, Z.; Majoros, A.; Osztroluczky, M.; Szalay, Z. Building Energetics; PTE Pollack Mihály Műszaki Kar: Pécs, Hungary, 2009. [Google Scholar]
- Guo, H.; Huang, L.; Song, W.; Wang, X.; Wang, H.; Zhao, X. Evaluation of the Summer Overheating Phenomenon in Reinforced Concrete and Cross Laminated Timber Residential Buildings in the Cold and Severe Cold Regions of China. Energies 2020, 13, 6305. [Google Scholar] [CrossRef]
- Csáky, I.; Kalmár, T. Analysis of degree day and energy need for cooling in educational buildings. Environ. Eng. Manag. J. 2014, 13, 2765–2770. [Google Scholar] [CrossRef]
- Hungarian Meteorological Services. Evaluation of Extreme Climate Indices. Available online: http://www.met.hu/en/omsz/tevekenysegek/klimamodellezes/szelsosegek/ (accessed on 18 February 2015).
- MSZ 04-140-2. Power Engineering. In Dimensioning Calculus of Buildings and Building Envelope Structures; Power Engineering: Budapest, Hungary, 1992. [Google Scholar]
- Urban INCD Incerc; Ministry of Regional Development and Tourism. Statistics of Romania Meteorological Data for Air Conditioning Equipment; Contract nr. 483/2011; Ministry of Regional Development and Tourism: Bucharest, Romania, 2011. [Google Scholar]
- DIN 4710 Statistics on German Meteorological Data for Calculating the Energy Requirements for Heating and Air Conditioning Equipment; Deutsches Institut für Normung: Berlin, Germany, 2003.
- Carlucci, S. Thermal Comfort Assessment of Buildings; Springer Briefs in Applied Science and Technology Series; Springer: Berlin/Heidelberg, Germany, 2013. [Google Scholar]
- Carlucci, S.; Pagliano, L. A review of indices for the long-term evaluation of the general thermal comfort conditions in buildings. Energy Build. 2012, 53, 194–205. [Google Scholar] [CrossRef]
- Lee, V.W.; Steemers, K. Exposure duration in overheating assessments: A retrofit modelling study. Build. Res. Inf. 2016, 45, 60–82. [Google Scholar] [CrossRef] [Green Version]
- CEN-CR 1752: Ventilation for Buildings. Design Criteria for the Indoor Environment; CEN/TC 156; European Committee for Standardization: Brussels, Belgium, 1998.
- Katunský, D.; Lopušniak, M. Impact of shading structure on energy demand and on risk of summer overheating ina low energy building. Energy Procedia 2012, 14, 1311–1316. [Google Scholar] [CrossRef] [Green Version]


Publisher’s Note: MDPI stays neutral with regard to jurisdictional claims in published maps and institutional affiliations. |
© 2021 by the author. Licensee MDPI, Basel, Switzerland. This article is an open access article distributed under the terms and conditions of the Creative Commons Attribution (CC BY) license (https://creativecommons.org/licenses/by/4.0/).