
Cooking Fuel Usage in Sub-Saharan Urban Households

 ,
,  ,
, 
Abstract
:
1. Introduction
2. Cooking Fuel Use in the Literature
3. Materials and Methods
3.1. Data
3.2. Estimation Approach
4. Results
4.1. Survey Results
4.2. Empirical Model Estimation Results
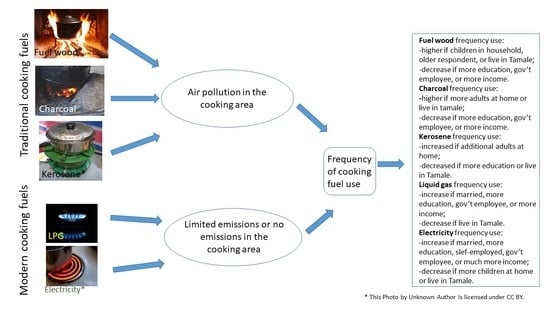
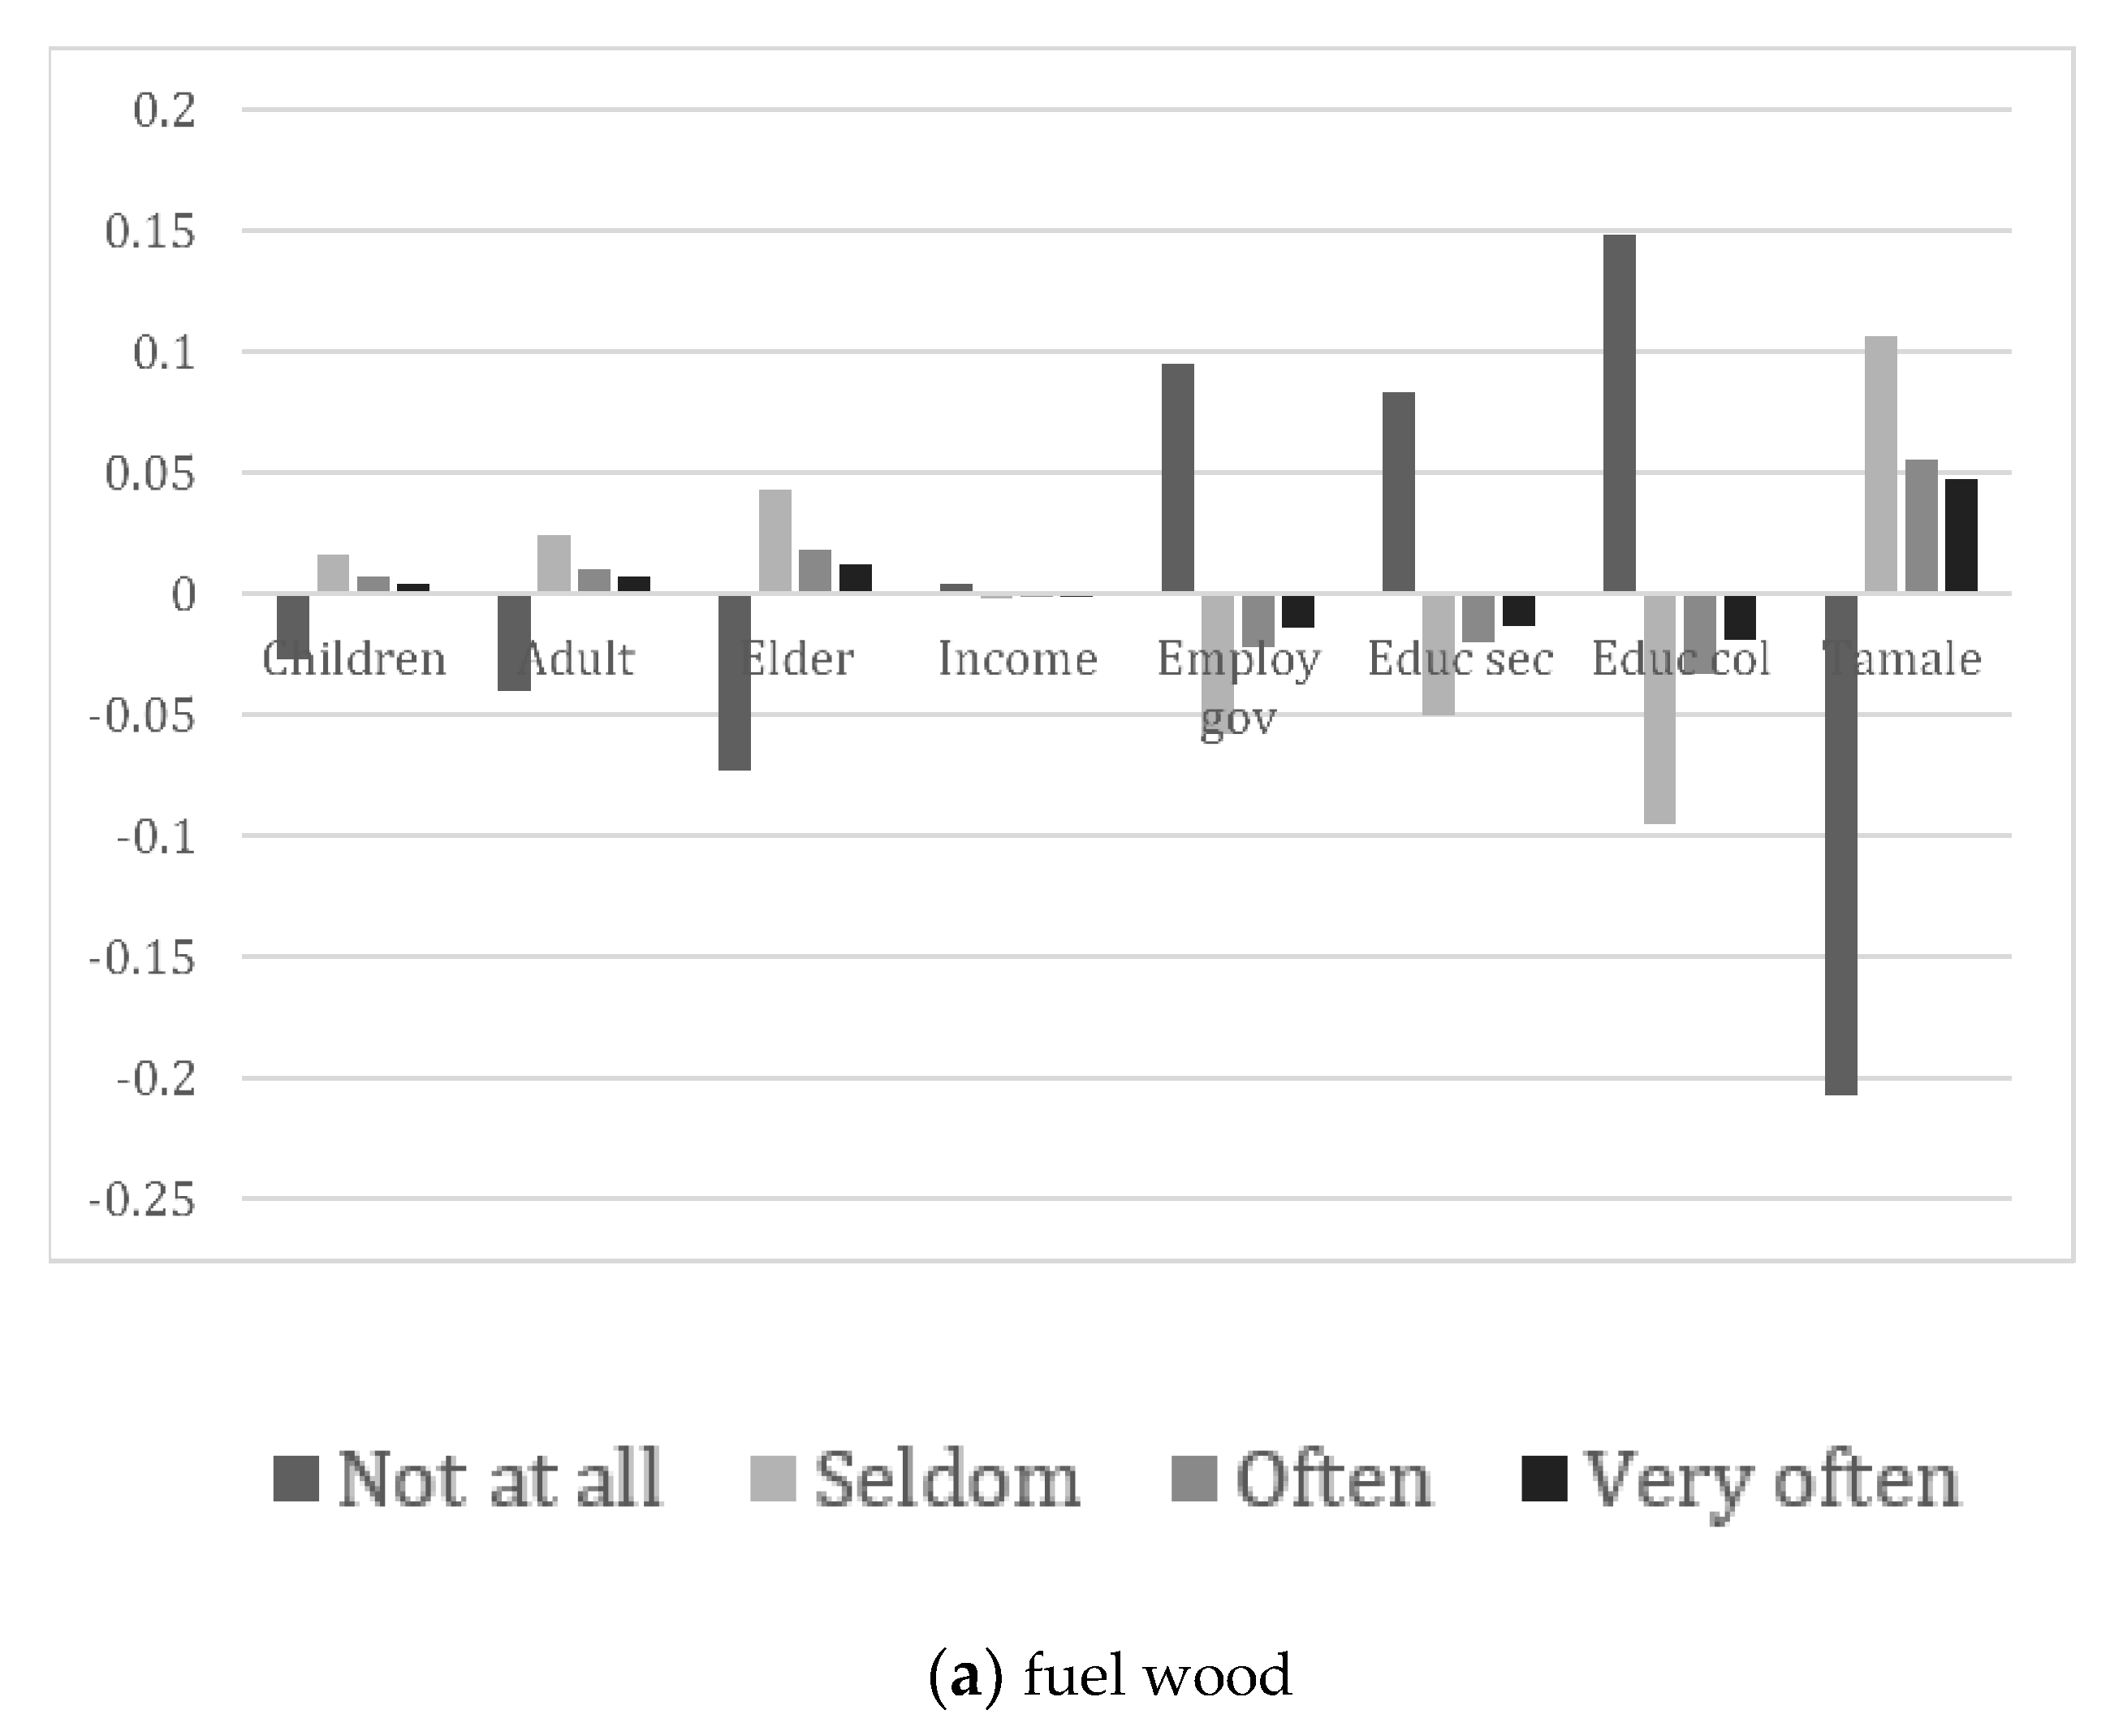
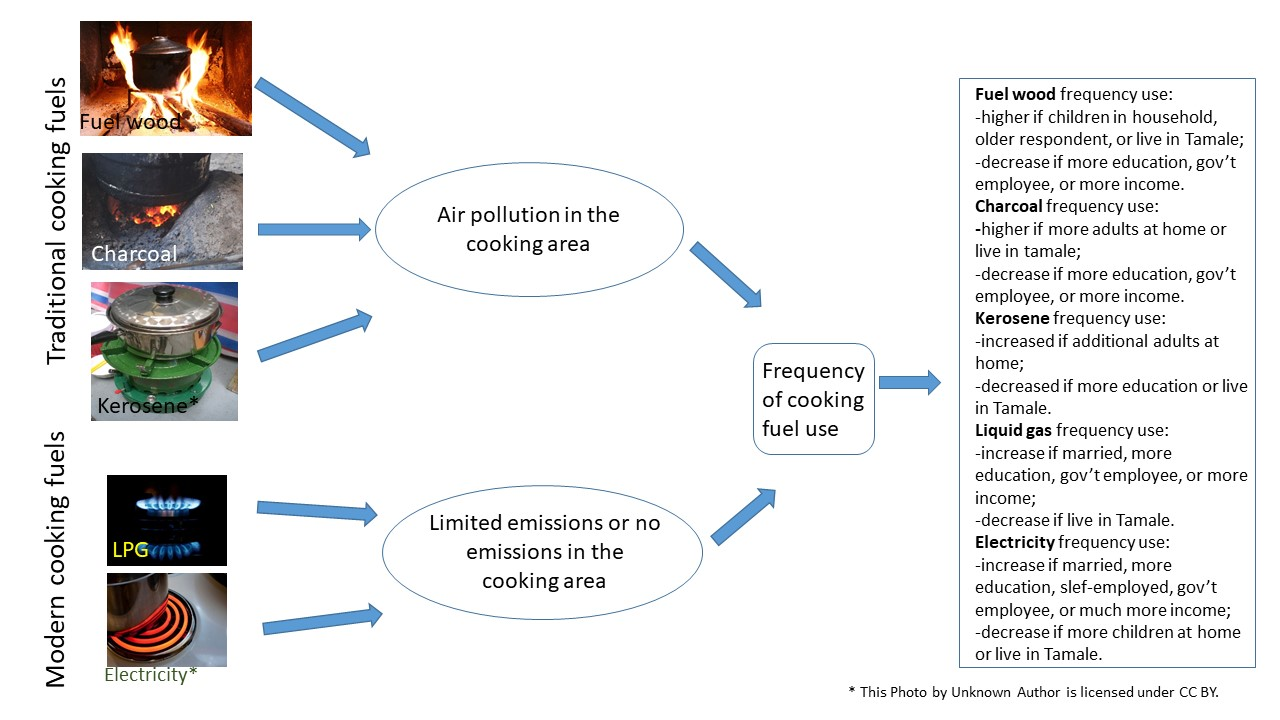
4.2.1. Wood
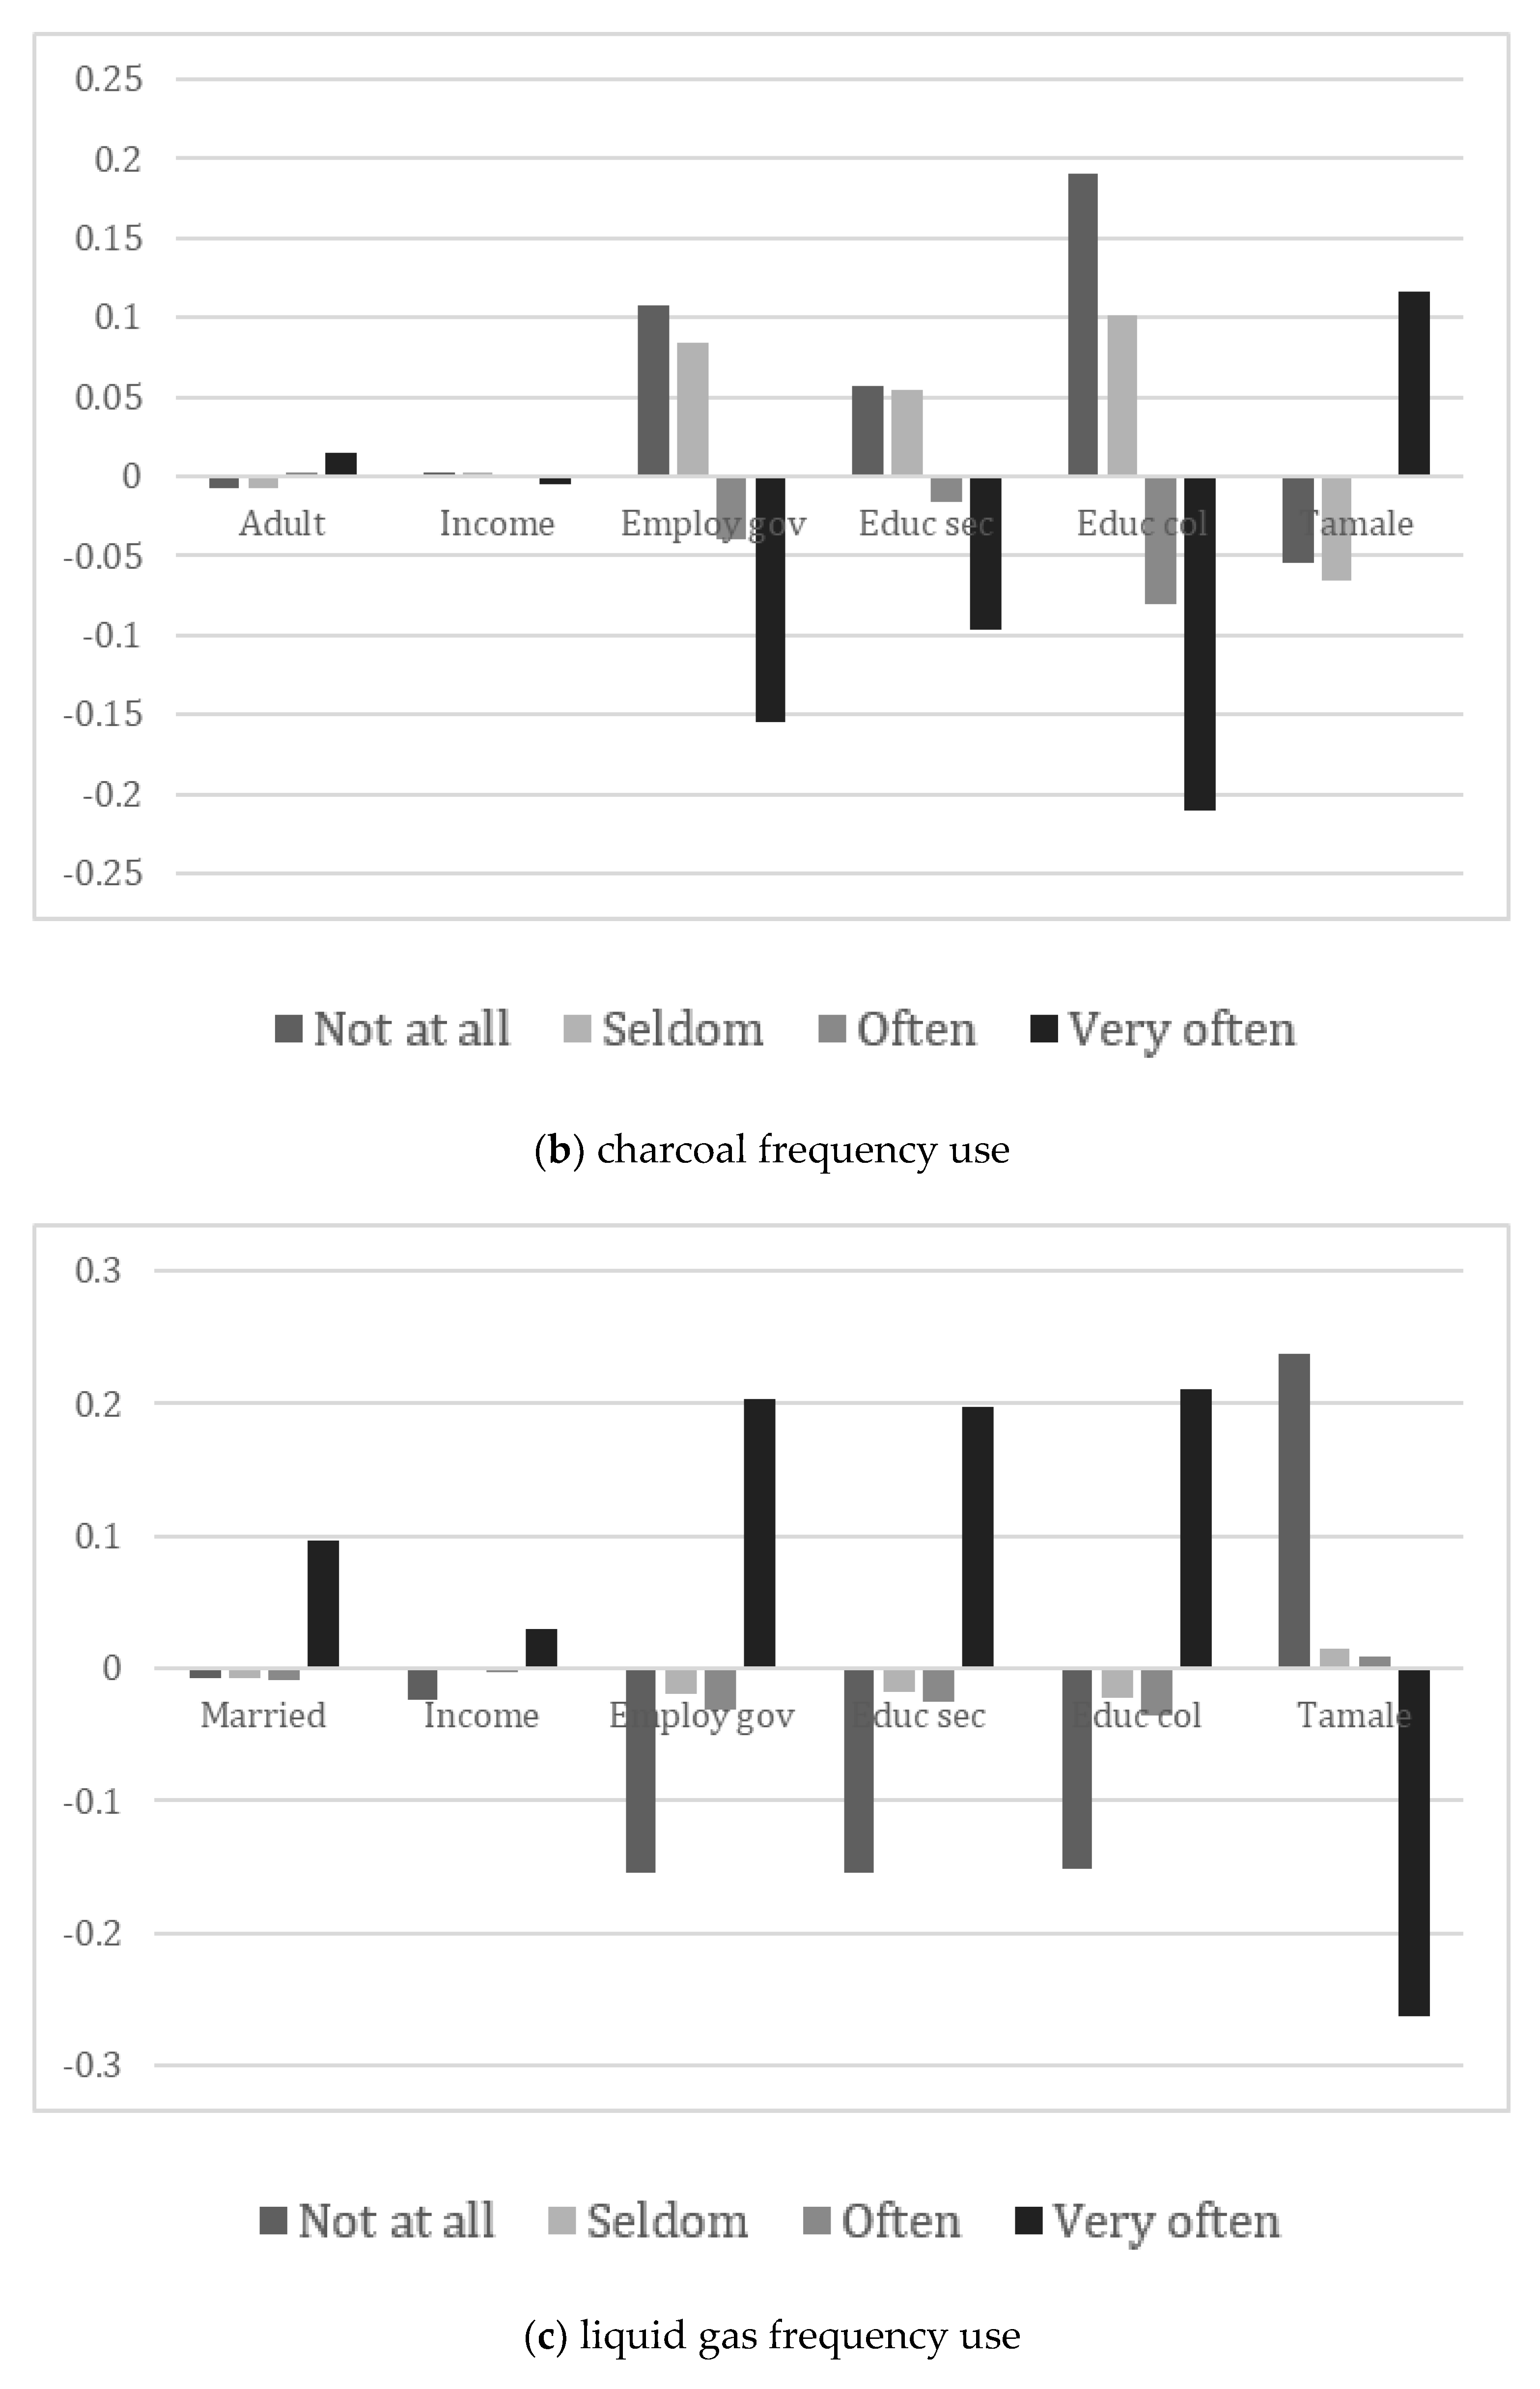
4.2.2. Charcoal
4.2.3. Liquid Gas
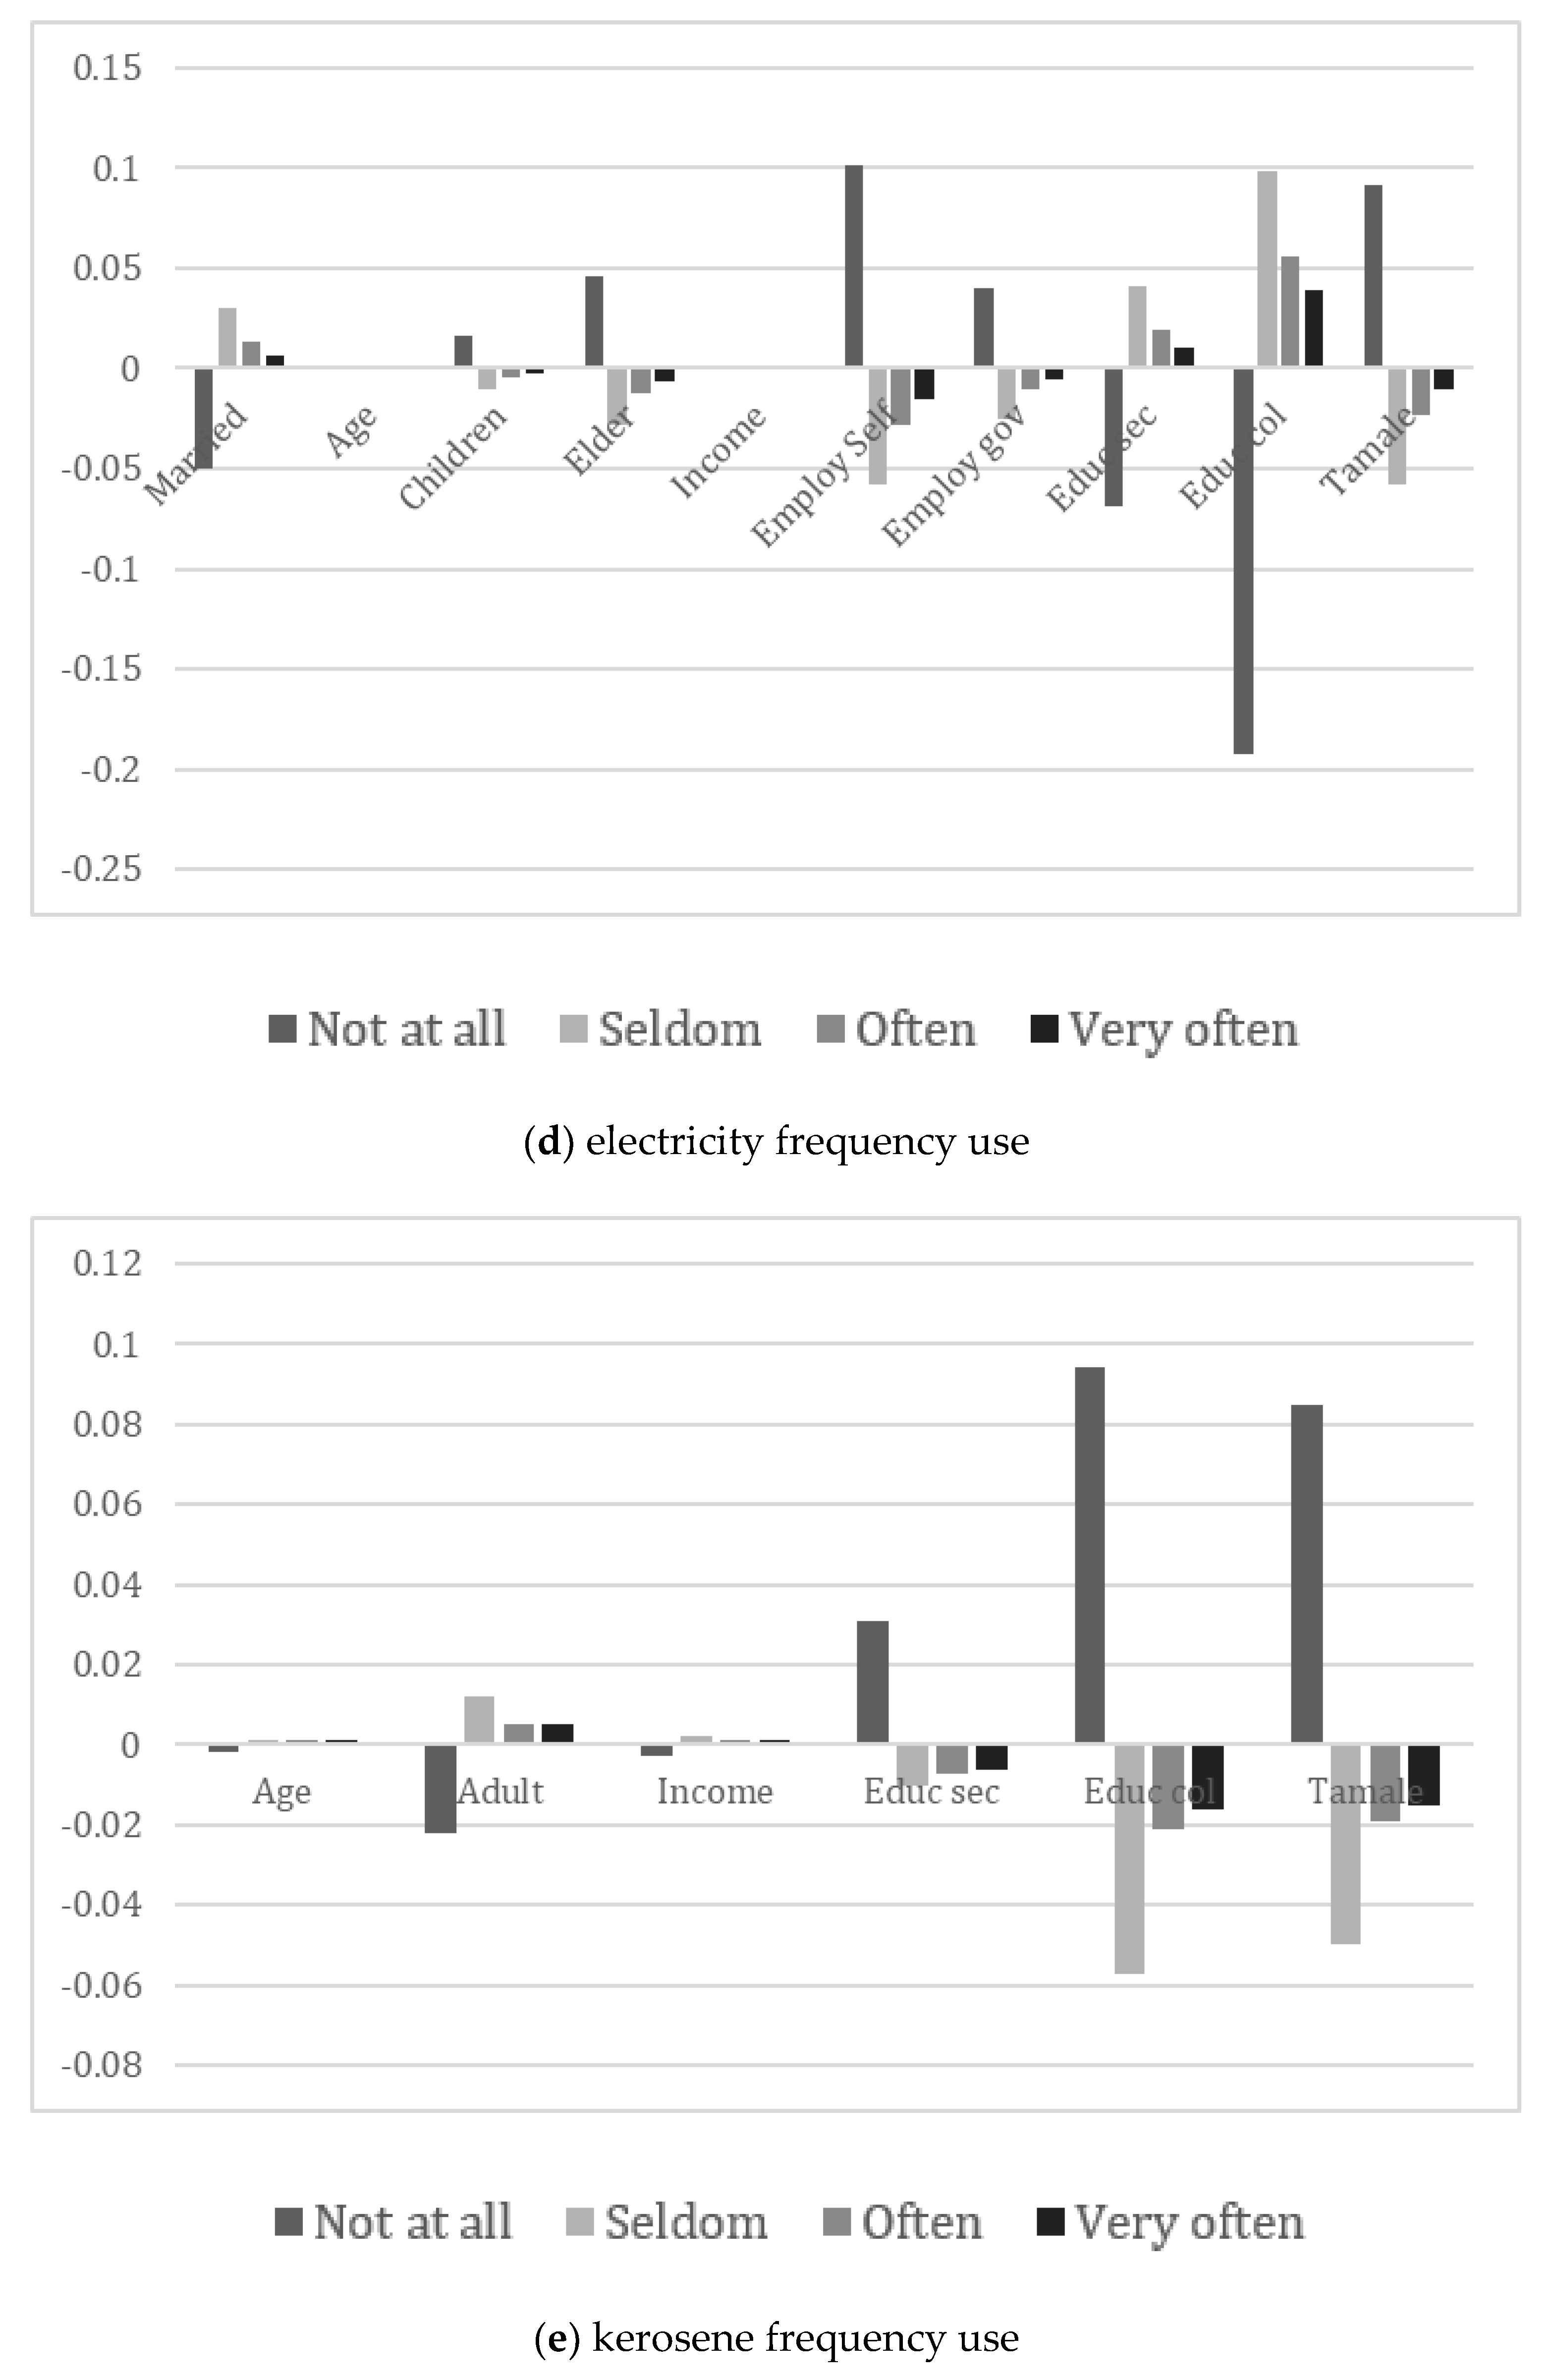
4.2.4. Electricity
4.2.5. Kerosene
5. Discussion
6. Conclusions
Author Contributions
Funding
Institutional Review Board Statement
Informed Consent Statement
Data Availability Statement
Acknowledgments
Conflicts of Interest
References
- Heltberg, R. Fuel switching: Evidence from eight developing countries. Energy Econ. 2004, 26, 869–887. [Google Scholar] [CrossRef]
- Choudhuri, P.; Desai, S. Gender inequalities and household fuel choice in India. J. Clean. Prod. 2020, 265, 121487. [Google Scholar] [CrossRef]
- Prasad, G. Improving access to energy in sub-Saharan Africa. Curr. Opin. Environ. Sustain. 2011, 3, 248–253. [Google Scholar] [CrossRef]
- Brew-Hammond, A. Energy access in Africa: Challenges ahead. Energy Policy 2010, 38, 2291–2301. [Google Scholar] [CrossRef]
- Ensure Access to Affordable, Reliable, Sustainable and Modern Energy for All. 2020. Available online: https://unstats.un.org/sdgs/report/2019/goal-07/ (accessed on 8 December 2020).
- Nabukalu, C.; Gieré, R. Charcoal as an Energy Resource: Global Trade, Production and Socioeconomic Practices Observed in Uganda. Resources 2019, 8, 183. [Google Scholar] [CrossRef] [Green Version]
- IEA. World Energy Outlook 2006; International Energy Agency: Paris, France, 2006. [Google Scholar]
- Food and Agricultural Organization. Forestry Production and Trade; FAO: Rome, Italy, 2019; Volume 2019. [Google Scholar]
- Collins, B. Africa’s $40B Market for Cooking Fuel Is Being Cleaned Up: Q&A. 2019. Available online: https://about.bnef.com/blog/africas-40b-market-cooking-fuel-cleaned-qa/ (accessed on 9 December 2020).
- Dalaba, M.; Alirigia, R.; Mesenbring, E.; Coffey, E.; Brown, Z.; Hannigan, M.; Wiedinmyer, C.; Oduro, A.; Dickinson, K.L. Liquified Petroleum Gas (LPG) Supply and Demand for Cooking in Northern Ghana. EcoHealth 2018, 15, 716–728. [Google Scholar] [CrossRef] [Green Version]
- Foell, W.; Pachauri, S.; Spreng, D.; Zerriffi, H. Household cooking fuels and technologies in developing economies. Energy Policy 2011, 39, 7487–7496. [Google Scholar] [CrossRef]
- Lacey, F.G.; Henze, D.K.; Lee, C.J.; van Donkelaar, A.; Martin, R.V. Transient climate and ambient health impacts due to national solid fuel cookstove emissions. Proc. Natl. Acad. Sci. USA 2017, 114, 1269–1274. [Google Scholar] [CrossRef] [Green Version]
- WHO. Indoor Air Pollution and Health. 2011. Available online: http://www.who.int/mediacenter/factsheetts/fs292/en (accessed on 11 January 2013).
- Jetter, J.J.; Kariher, P. Solid-fuel household cook stoves: Characterization of performance and emissions. Biomass Bioenergy 2009, 33, 294–305. [Google Scholar] [CrossRef]
- Lim, S.S.; Vos, T.; Flaxman, A.D.; Danaei, G.; Shibuya, K.; Adair-Rohani, H.; AlMazroa, M.A.; Amann, M.; Anderson, H.R.; Andrews, K.G.; et al. A comparative risk assessment of burden of disease and injury attributable to 67 risk factors and risk factor clusters in 21 regions, 1990–2010, a systematic analysis for the Global Burden of Disease Study 2010. Lancet 2012, 380, 2224–2260. [Google Scholar] [CrossRef] [Green Version]
- National Energy Policy; Ministry of Energy: Accra, Ghana, 2010.
- Yiridoe, E.K.; Nanang, D.M. An Econometric Analysis of the Causes of Tropical Deforestation: Ghana; American Agricultural Economics Association: Chicago, IL, USA, 2001. [Google Scholar]
- Anang, B.T.; Kkuriba, M.A.; Alerigesane, A.A. Charcoal production in Gushegu District, Northern Region, Ghana: Lessons for sustainable forest management. Int. J. Environ. Sci. 2011, 1, 1944–1953. [Google Scholar]
- World Bank. The Little Green Data Book 2017; World Bank: Washington, DC, USA, 2017. [Google Scholar] [CrossRef]
- Edwards, R.D.; Smith, K.R.; Zhang, J.; Ma, Y. Implications of changes in household stoves and fuel use in China. Energy Policy 2004, 32, 395–411. [Google Scholar] [CrossRef]
- Bond, T.C.; Sun, H.L. Can reducing black carbon emissions counteract global warming? Environ. Sci. Technol. 2005, 39, 5921–5926. [Google Scholar] [CrossRef] [PubMed] [Green Version]
- Rehfuess, E.; Mehta, S.; Prüss-Üstün, A. Assessing Household Solid Fuel Use: Multiple Implications for the Millennium Development Goals. Environ. Health Perspect. 2006, 114, 373–378. [Google Scholar] [CrossRef] [PubMed] [Green Version]
- Blackburn-Dwyer, B. The Top 10 Fastest Growing Cities in The World. 2016. Available online: https://www.globalcitizen.org/en/content/world-fastest-growing-cities/?template=next (accessed on 18 June 2021).
- Carrión, D.; Dwommoh, R.; Tawiah, T.; Agyei, O.; Agbokey, F.; Twumasi, M.; Mujtaba, M.; Jack, D.; Asante, K.P. Enhancing LPG adoption in Ghana (ELAG): A factorial cluster-randomized controlled trial to Enhance LPG Adoption & Sustained use. BMC Public Health 2018, 18, 1–11. [Google Scholar] [CrossRef]
- Brew-Hammond, A.; Kemausuor, F. Energy for all in Africa–to be or not to be?! Curr. Opin. Environ. Sustain. 2009, 1, 83–88. [Google Scholar] [CrossRef]
- Mensah, J.T.; Adu, G. An empirical analysis of household energy choice in Ghana. Renew. Sustain. Energy Rev. 2015, 51, 1402–1411. [Google Scholar] [CrossRef]
- Louw, K.; Conradie, B.; Howells, M.; Dekenah, M. Determinants of electricity demand for newly electrified low-income African households. Energy Policy 2008, 36, 2812–2818. [Google Scholar] [CrossRef]
- Ouedraogo, B. Household energy preferences for cooking in urban Ouagadougou, Burkina Faso. Energy Policy 2006, 34, 3787–3795. [Google Scholar] [CrossRef]
- Pope, D.; Bruce, N.; Higgerson, J.; Hyseni, L.; Stanistreet, D.; Mbatchou, B.; Puzzolo, E. Household Determinants of Liquified Petroleum Gas (LPG) as a Cooking Fuel in SW Cameroon. EcoHealth 2018, 15, 729–743. [Google Scholar] [CrossRef] [Green Version]
- Sharma, B.P. Household Fuel Transition and Determinants of Firewood Demand in Nepal. Econ. J. Dev. Issues 2019, 83–95. [Google Scholar] [CrossRef] [Green Version]
- Giri, M.; Goswami, B. Determinants of Household’s Choice of Fuel for Cooking in Developing Countries: Evidence from Nepal. J. Dev. Policy Pract. 2018, 3, 137–154. [Google Scholar] [CrossRef]
- Acharya, B.; Marhold, K. Determinants of household energy use and fuel switching behavior in Nepal. Energy 2019, 169, 1132–1138. [Google Scholar] [CrossRef]
- Paudel, U.; Khatri, U.; Pant, K.P. Understanding the determinants of household cooking fuel choice in Afghanistan: A multinomial logit estimation. Energy 2018, 156, 55–62. [Google Scholar] [CrossRef]
- Wickramasinghe, A. Energy access and transition to cleaner cooking fuels and technologies in Sri Lanka: Issues and policy limitations. Energy Policy 2011, 39, 7567–7574. [Google Scholar] [CrossRef]
- Clemens, H.; Bailis, R.; Nyambane, A.; Ndung’U, V. Africa Biogas Partnership Program: A review of clean cooking implementation through market development in East Africa. Energy Sustain. Dev. 2018, 46, 23–31. [Google Scholar] [CrossRef] [PubMed]
- Vigolo, V.; Sallaku, R.; Testa, F. Drivers and Barriers to Clean Cooking: A Systematic Literature Review from a Consumer Behavior Perspective. Sustainability 2018, 10, 4322. [Google Scholar] [CrossRef] [Green Version]
- Prasad, G. Energy sector reform, energy transitions and the poor in Africa. Energy Policy 2008, 36, 2806–2811. [Google Scholar] [CrossRef]
- World Bank Group. Rising through Cities in Ghana: Ghana Urbanization Review Overview Report; World Bank: Washington, DC, USA, 2015; Available online: https://openknowledge.worldbank.org/handle/10986/22020 (accessed on 23 April 2021).
- Sajaia, Z. Maximum Likelihood Estimation of a Bivariate Ordered Probit Model: Implementation and Monte Carlo Simulations. Stata J. 2008, 4, 1–18. Available online: http://www.ecreee.org/sites/default/files/event-att/ghana_national_strategies_for_cooking_fuels._burkina_2013_1.pdf (accessed on 6 October 2014).
- Barnes, D.F.; Qian, L. Urban Interfuel Substitution, Energy Use, and Equity in Developing Countries; Series Papers 53; World Bank, Industry and Energy Department: Washington, DC, USA, 1992. [Google Scholar]
- Leach, G. The energy transition. Energy Policy 1992, 20, 116–123. [Google Scholar] [CrossRef]
- Zulu, L.C.; Richardson, R. Charcoal, livelihoods, and poverty reduction: Evidence from sub-Saharan Africa. Energy Sustain. Dev. 2013, 17, 127–137. [Google Scholar] [CrossRef]
- Ghana Web. 2013. Available online: http://www.ghanaweb.com/GhanaHomePage/economy/forex.php (accessed on 12 January 2013).
- Ahiotoku-Togoba, W. National cooking energy strategies–lessons from Ghana. In Proceedings of the WACCA Workshop, Ouagadougou, Burkina Faso, 23–25 April 2013. [Google Scholar]
- Sokona, Y.; Mulugetta, Y.; Gujba, H. Widening energy access in Africa: Towards energy transition. Energy Policy 2012, 47, 3–10. [Google Scholar] [CrossRef]
- Heimann, J.; Dresch, A.R.; Almeida, A.N. The demand by the United States of America for the Brazilian charcoal. Ciência Florest. 2015, 25, 437–445. [Google Scholar]
- Boafo-Mensah, G.; Ampomah-Benefo, K.; Animpong, M.A.B.; Oduro, W.O.; Kotey, E.N.; Akufo-Kumi, K.; Laryea, G.N. Thermal efficiency of charcoal fired cookstoves in Ghana. GARJETI 2013, 2, 102–110. [Google Scholar]
- GDP per Capita (Current US$)—Ghana. 2021. Available online: https://data.worldbank.org/indicator/NY.GDP.PCAP.CD?locations=GS (accessed on 20 July 2021).
- Kim, K.-H.; Jahan, S.A.; Kabir, E. A review of diseases associated with household air pollution due to the use of biomass fuels. J. Hazard. Mater. 2011, 192, 425–431. [Google Scholar] [CrossRef]
- Van Vliet, E.D.S.; Asante, K.; Jack, D.W.; Kinney, P.L.; Whyatt, R.M.; Chillrud, S.N.; Abokyi, L.; Zandoh, C.; Owusu-Agyei, S. Personal exposures to fine particulate matter and black carbon in households cooking with biomass fuels in rural Ghana. Environ. Res. 2013, 127, 40–48. [Google Scholar] [CrossRef] [PubMed] [Green Version]


| Variable Name | Variable Description/Units of Measurement | Mean | Std Dev |
|---|---|---|---|
| Dependent variables 1 | |||
| Frequency of cooking with wood | How often do you use wood to cook your main meal of the day? 1 = not at all; 2 = seldom; 3 = often; 4 = very often | 1.365 | 0.807 |
| Frequency of cooking with charcoal | How often do you use charcoal to cook your main meal of the day? 1 = not at all; 2 = seldom; 3 = often; 4 = very often | 2.779 | 1.037 |
| Frequency of cooking with liquid gas | How often do you use liquid gas to cook your main meal of the day? 1 = not at all; 2 = seldom; 3 = often; 4 = very often | 2.848 | 1.345 |
| Frequency of cooking with electricity | How often do you use electricity to cook your main meal of the day? 1 = not at all; 2 = seldom; 3 = often; 4 = very often | 1.175 | 0.553 |
| Frequency of cooking with kerosene | How often do you use kerosene to cook your main meal of the day? 1 = not at all; 2 = seldom; 3 = often; 4 = very often | 1.260 | 0.649 |
| Independent variables | |||
| Demographic factors | |||
| Married | =1 if a respondent is married | 0.753 | 0.431 |
| Age | Actual age in years | 39.222 | 10.656 |
| Children | Number of household members between 13–18 years old | 0.983 | 1.205 |
| Adult | Number of household members between 19–60 years old | 2.087 | 1.751 |
| Elder | Number of household members 61 years old or older | 0.153 | 0.505 |
| Socio-economic factors | |||
| Income | Household income in the month preceding the survey/in Ghanaian cedis | 646.070 | 785.081 |
| Self employed | =1 if a respondent is self-employed | 0.642 | 0.480 |
| Government or civil employed | =1 if a respondent is gov/civil employee | 0.243 | 0.429 |
| Secondary Education | =1 if a respondent has a secondary education (including Senior high/GCE O-A level, Vocational school, Technical school, Teacher training) | 0.382 | 0.486 |
| College Education | =1 if a respondent has a college education (including Senior high/GCE O-A level, Vocational school, Technical school, Teacher training, University, or postgraduate) | 0.134 | 0.340 |
| Location | |||
| Tamale | =1 if a household is in Tamale | 0.186 | 0.389 |
| Takoradi | =1 if a household is in Takoradi | 0.208 | 0.406 |
| Fuel | Not at All | Seldom | Often | Very Often |
|---|---|---|---|---|
| Tamale | ||||
| Wood (n = 179) | 54.75 | 17.88 | 9.50 | 17.88 |
| Charcoal (n = 185) | 8.65 | 20.00 | 23.78 | 47.57 |
| Liquid gas (n = 177) | 61.02 | 3.95 | 6.21 | 28.81 |
| Electricity (n = 172) | 98.26 | 0 | 1.16 | 0.58 |
| Kerosene (n = 172) | 89.53 | 6.98 | 0.58 | 2.91 |
| Takoradi | ||||
| Wood (n = 207) | 86.47 | 8.21 | 2.90 | 2.42 |
| Charcoal (n = 210) | 13.81 | 33.81 | 17.62 | 34.76 |
| Liquid gas (n = 209) | 25.84 | 7.18 | 7.18 | 59.81 |
| Electricity (n = 207) | 89.86 | 4.83 | 3.38 | 1.93 |
| Kerosene (n = 206) | 80.58 | 14.56 | 2.91 | 1.94 |
| Accra | ||||
| Wood (n = 570) | 86.32 | 8.77 | 3.33 | 1.58 |
| Charcoal (n = 608) | 14.80 | 28.29 | 32.57 | 24.34 |
| Liquid gas (n = 603) | 22.89 | 4.15 | 13.93 | 59.04 |
| Electricity (n = 562) | 84.34 | 9.79 | 3.74 | 2.14 |
| Kerosene (n = 562) | 81.14 | 11.39 | 4.8 | 2.67 |
| Characteristic | Wood | Charcoal | Liquid Gas | Electricity | Kerosene |
|---|---|---|---|---|---|
| Demographic Factors | |||||
| Married | 0.79 | 0.71 | 0.79 | 0.84 | 0.76 |
| Age | 43.05 | 39.34 | 39.18 | 43.69 | 42.70 |
| Children | 1.51 | 1.03 | 0.90 | 1.22 | 1.14 |
| Adult | 2.74 | 2.17 | 2.05 | 2.61 | 2.50 |
| Elder | 0.40 | 0.13 | 0.13 | 1.15 | 0.19 |
| Socio-economic factors | |||||
| Income | 617.07 | 432.93 | 845.99 | 1116.86 | 896.47 |
| Self employed | 0.65 | 0.74 | 0.57 | 0.60 | 0.69 |
| Government employed | 0.22 | 0.10 | 0.34 | 0.29 | 0.20 |
| Secondary Education | 0.38 | 0.31 | 0.45 | 0.43 | 0.37 |
| College Education | 0.03 | 0.03 | 0.20 | 0.13 | 0.06 |
| Location | |||||
| Tamale | 0.41 | 0.29 | 0.11 | 0.20 | 0.22 |
| Takoradi | 0.08 | 0.23 | 0.23 | 0.08 | 0.09 |
| N | 100 | 316 | 553 | 86 | 94 |
| Variable Name | Wood n = 956 | Charcoal n = 1003 | Liquid Gas n = 989 | Electricity n = 941 | Kerosene n = 940 |
|---|---|---|---|---|---|
| Demographic factors | |||||
| Married | 0.1895 (0.1244) | −0.0260 (0.0831) | 0.2432 ** (0.0952) | 0.3993 *** (0.1470) | −0.1523 (0.1113) |
| Age | 0.0042 (0.0050) | 0.0013 (0.0036) | −0.0013 (0.0041) | 0.0117 ** (0.0058) | 0.0094 * (0.0048) |
| Children | 0.1188 *** (0.0396) | 0.0458 (0.0306) | −0.0356 (0.0351) | −0.1171 ** (0.0591) | 0.0090 (0.0410) |
| Adult | 0.1782 *** (0.0279) | 0.0434 ** (0.0218) | −0.0406 (0.0265) | 0.0609 (0.0384) | 0.0900 *** (0.0280) |
| Elder | 0.3274 *** (0.0900) | −0.0312 (0.0685) | −0.0876 (0.0811) | −0.3248 ** (0.1637) | −0.0701 (0.1039) |
| Socio−economic factors | |||||
| Income(100 cedi) | −0.0179 ** (0.0082) | −0.01352 *** (0.0050) | 0.07495 *** (0.0111) | 0.0126 * (0.0072) | 0.01137 * (0.0066) |
| Employ_self | −0.1225 (0.1414) | −0.1662 (0.1140) | 0.0022 (0.1288) | −0.6144 *** (0.1704) | −0.2352 (0.1441) |
| Employ_gov | −0.4879 *** (0.1999) | −0.4936 *** (0.1335) | 0.5376 *** (0.1571) | −0.3169 * (0.1921) | −0.0797 (0.1749) |
| Educ_sec | −0.3897 *** (0.1196) | −0.2873 *** (0.0816) | 0.5085 *** (0.0927) | 0.4430 *** (0.1426) | −0.1294 (0.1127) |
| Educ_col | −0.9952 *** (0.2760) | −0.7488 *** (0.1306) | 0.5666 *** (0.1652) | 0.8895 *** (0.1897) | −0.4550 ** (0.1962) |
| Location | |||||
| Tamale | 0.7463 *** (0.1292) | 0.3226 *** (0.1028) | −0.6749 *** (0.1229) | −0.9639 *** (0.2555) | −0.3922 *** (0.1522) |
| Takoradi | −0.1196 (0.1435) | 0.0343 (0.0930) | 0.0666 (0.1081) | −0.1854 (0.1482) | −0.0315 (0.1262) |
| Parameters | |||||
| Cut1 | 1.4452 (0.2704) | −1.5130 (0.2010) | 0.1049 (0.2250) | 1.8263 (0.3134) | 1.1277 (0.2644) |
| Cut2 | 2.0867 (0.2761) | −0.5343 (0.1983) | 0.2783 (0.2253) | 2.3704 (0.3187) | 1.7650 (0.2686) |
| Cut3 | 2.5563 (0.2841) | 0.2612 (0.1970) | 0.6420 (0.2258) | 2.8728 (0.2873) | 2.185371 (0.2739) |
| Log Likelihood | −532.60 | −1265.23 | −914.25 | −391.37 | −559.06 |
| Likelihood test (p-value) with DF = 12 | 260.20 (<0.001) | 167.19 (<0.001) | 316.52 (<0.001) | 118.00 (<0.001) | 43.89 (<0.001) |
Publisher’s Note: MDPI stays neutral with regard to jurisdictional claims in published maps and institutional affiliations. |
© 2021 by the authors. Licensee MDPI, Basel, Switzerland. This article is an open access article distributed under the terms and conditions of the Creative Commons Attribution (CC BY) license (https://creativecommons.org/licenses/by/4.0/).
Share and Cite
Meng, T.; Florkowski, W.J.; Sarpong, D.B.; Chinnan, M.; Resurreccion, A.V.A. Cooking Fuel Usage in Sub-Saharan Urban Households. Energies 2021, 14, 4629. https://doi.org/10.3390/en14154629
Meng T, Florkowski WJ, Sarpong DB, Chinnan M, Resurreccion AVA. Cooking Fuel Usage in Sub-Saharan Urban Households. Energies. 2021; 14(15):4629. https://doi.org/10.3390/en14154629
Chicago/Turabian StyleMeng, Ting, Wojciech J. Florkowski, Daniel B. Sarpong, Manjeet Chinnan, and Anna V. A. Resurreccion. 2021. "Cooking Fuel Usage in Sub-Saharan Urban Households" Energies 14, no. 15: 4629. https://doi.org/10.3390/en14154629
APA StyleMeng, T., Florkowski, W. J., Sarpong, D. B., Chinnan, M., & Resurreccion, A. V. A. (2021). Cooking Fuel Usage in Sub-Saharan Urban Households. Energies, 14(15), 4629. https://doi.org/10.3390/en14154629