Article

Hydraulic Conductivity of Rock Masses Surrounding Water Curtain Boreholes for Underground Oil Storage Caverns

1
Three Gorges Research Center for Geohazards of the Ministry of Education, China University of Geosciences, Wuhan 430074, China
2
School of Civil, Environmental & Mining Engineering, The University of Western Australia, Crawley 6009, Australia
3
Changjiang River Scientific Research Institute, Wuhan 430010, China
*
Author to whom correspondence should be addressed.
Energies 2021, 14(15), 4588; https://doi.org/10.3390/en14154588
Submission received: 9 June 2021 / Revised: 17 July 2021 / Accepted: 20 July 2021 / Published: 29 July 2021
(This article belongs to the Section D: Energy Storage and Application)

Abstract

:
The assessment of the groundwater flow rate around the cavern periphery is a critical requirement for the design of underground water-sealed oil storage caverns and commonly made through seepage analysis, where a reasonable estimation of the hydraulic conductivity of the host rock is the key issue. However, it is a challenge to accurately determine the hydraulic conductivity of natural rock masses owing to their heterogeneous and anisotropic nature. The underground storage cavern project has a unique favorable condition in that there is a water curtain system that can provide considerable hydraulic test data for inferring hydraulic parameters; however, no well-established method has ever been proposed to exploit these data for characterizing heterogeneity in hydraulic conductivity. This study presents a new approach to evaluate the spatial variation of hydraulic conductivity using water curtain borehole data. This approach treats the peripheral region of each borehole as a homogenous unit with a particular equivalent permeability coefficient that can be back-calculated from the measured injection flow rate of the borehole using a numerically established empirical formula. Besides, the impact of curtain gallery drainage, occurring in the construction stage, on the seepage field was investigated while the effect of the rock fracture configuration on hydraulic conductivity assessment was examined. The proposed method enables robust and accurate mapping of heterogeneity in the hydraulic conductivity of host rocks and provides a new idea of effectively utilizing hydro-geological test data to derive the hydraulic conductivity of rock masses surrounding water-sealed storage caverns.

Graphical Abstract

1. Introduction

Compared with an above-ground container tank, the underground water-sealed oil/gas storage cavern has many advantages in cost, land consumption, environmental protection, and operation safety and, therefore, has become an important means for oil/gas storage. These underground caverns are usually constructed in a selected site with good geological conditions, where the natural groundwater level is shallow and stable while the surrounding rocks are as hard and intact as possible. There are two fundamental and critical issues related to the construction and operation of a storage cavern project: namely, rock stability and groundwater flow characterization. The former, normally, does not constitute a real challenge for practitioners to deal with as most storage caverns are built within rocks of comparatively good quality, whereas the latter is more intractable and complicated, which is reflected in how to objectively assess the efficiency of the water-sealing system and to effectively control water inflow into the caverns.
Water sealing, or hydraulic containment, is an indispensable condition to ensure the safe operation of an underground storage cavern project. The water-sealing measures include utilizing natural groundwater and constructing an artificial water curtain system [1]. Åberg [2] postulated that if the vertical hydraulic gradient around the storage caverns is greater than 1.0, the stored products will not leak through the surrounding rock mass. Goodall et al. [3] proposed that no leakage would occur as long as the water pressure gradients along all possible escape paths are positive. By reexamining the commonly employed water-sealing criterion, Zhang et al. [4] argued that the oil/gas leakage can be prevented provided that the hydraulic head gradient in the surrounding rocks is greater than 0, instead of greater than 1. It follows from this criterion that the critical hydraulic pressure gradient over the caverns (in the vertically downward direction) and under the caverns (in the vertically upward direction) should be greater than −1 and 1, respectively. Apart from the water-sealing criterion, extensive studies have been conducted on various aspects of underground oil/gas storage caverns. Li et al. [5] performed physical model tests to evaluate the performance of an artificial water curtain system. Kurose et al. [6] reported the site-scale hydraulic and air tightness tests in an underground liquid petroleum gas (LPG) storage cavern. Many investigations were dedicated to the three-dimensional (3-D) seepage flow in rock masses surrounding storage caverns using numerical methods [7,8,9,10,11,12,13,14,15]. In addition, the site investigation, design, and construction practice for multiple underground storage cavern projects around the world have been reported [16,17,18,19,20,21,22].
The water flow rate into caverns is directly related to the cost of water pumping during the operation period and is restricted by the wastewater treatment capacity. An earlier Chinese standard for the design of underground oil storage in rock caverns (GB 50455-2008) suggested that the water inflow rate per one million cubic meters of cavern should not exceed 100 m3/d [23]. However, this restriction on the water inflow is hard to follow in engineering practice and has been relaxed in the latest version of the design standard (GB/T 50455-2020), which recommends an upper limit value for the inflow rate of 200 m3/d [24]. In fact, a problem commonly encountered is that while effective water sealing can be reasonably assured using the current design principle and methodology, the water inflow rate of caverns tends to exceed the stipulated limit. To control an excessive inflow rate, the following three aspects should be of concern: (1) a geologically stable construction site with hard rock mass of high integrity should be selected; (2) the water inflow rate into the storage caverns needs to be accurately predicted; and (3) proper grouting is required for some local areas with extremely high permeability so as to inhibit the inflow rate. Among them, accurate prediction of the inflow rate relies upon the reliability of the seepage analysis results. It is worth mentioning that the flow rate and water pressure are two main concerns for a seepage analysis of a practical project and that, in many cases, the calculation results of water pressure are more reliable than those for the flow rate. Nevertheless, unlike the water conservancy and hydropower projects, where more attention is paid to the distribution of groundwater pressure, underground storage cavern projects, as mentioned above, have a higher demand for accurate determination and control of the flow rate.
Reasonable assessment of the hydraulic conductivity of the surrounding rock masses is of utmost importance to the accuracy of flow analysis results. However, it is challenging to determine the hydraulic conductivity of fractured rock masses [25,26] due to their heterogeneous and anisotropic natures stemming from the presence of various types of uncertain randomly distributed discontinuities, such as joints, faults, and interlayer weak planes, among others. As such, the hydraulic conductivity in different parts of rock masses may vary significantly; the water permeability in highly fractured zones can be tens of thousands of times larger than that in relatively intact zones, and concentrated leakage channels may even exist. For most rock engineering projects, the hydraulic parameters of rock masses are investigated by carrying out hydraulic or hydro-geological tests, such as the injection/falloff test, pumping test, drawdown-buildup test, and cross-hole (hydraulic connection) test. However, the fairly high expenses related to in situ tests usually lead to a limited number of tests being implemented on several selected locations in rock masses. By exploiting these hydro-geological test data, many methods have been proposed to characterize the heterogeneity in the hydraulic conductivity of fractured rock masses, such as kriging of small-scale hydraulic test data [27,28], stochastic simulation [27,29,30], geostatistical inverse modeling of a single cross-hole pumping or injection test [31], and hydraulic tomography [32]. It is worth mentioning that the hydraulic tomography is considered one of the most promising methods for depicting the spatial variability of rock hydraulic conductivity due to the fact that it relies upon the sequential or simultaneous inverse modeling of multiple cross-hole pumping or injection tests conducted at different locations [32]. It is of note that the hydraulic conductivity is commonly observed to depend on the measurement scale [33,34]. The usual pattern is that the measured hydraulic conductivity increases with the scale of testing. For example, the estimate of hydraulic conductivity (k) can be larger for pumping tests compared to small-scale tests, such as Lugeon and slug tests, in fractured rocks. Many studies linked this scale dependency to heterogeneity, albeit in different manners [35,36,37]. Based on the detailed information of rock heterogeneity provided by hydraulic (and pneumatic) tomography, Illman [32] suggested that the scale effect may be an artifact of treating the fractured rock as a homogeneous medium.
Hydro-geological and hydraulic borehole tests are widely adopted means to determine the hydraulic conductivity of fractured rock masses and have been investigated from various aspects, including test principles and methods, test equipment development, test procedure improvement, experimental data processing and interpretation, error analysis, affecting factors, numerical modeling and validation, and so forth [29,30,38,39,40,41,42,43,44]. In the Chinese industrial standard ‘specification of hydro-geological tests for underground oil storage in rock caverns’ (SH/T 3195-2017), the following hydro-geological tests are recommended: the Lugeon test, injection test, slug test, pumping test, water curtain efficiency test (interconnectivity test between two boreholes), and full-size efficiency test of the water curtain system [45]. Overall, the complexity of rock masses and the limitations associated with current surveying technologies and analysis methods, coupled with the high cost of hydraulic tests, make it very difficult to ensure the accuracy of the obtained hydraulic conductivity of rock masses.
In terms of an underground water-sealed storage cavern project, the water curtain system was usually constructed and completely covers the caverns, and hydro-geological tests conducted in water curtain boreholes during the construction period can provide considerable data sources for inferring the hydraulic conductivity of rocks peripheral to each tested borehole. Despite the existence of such advantageous conditions provided by water curtain boreholes, how to effectively utilize hydraulic test data of water curtain boreholes to characterize the heterogeneity in the hydraulic conductivity of the surrounding rock mass has not yet been well established. Using the Huangdao underground water-sealed storage cavern project as a case study, this paper proposes a new approach to characterize the spatial variation of hydraulic conductivity using water-curtain borehole test data. The method presented in this study can serve as an effective idea of utilizing hydro-geological test data to robustly and accurately map the heterogeneity in the hydraulic conductivity of host rocks surrounding water-sealed storage caverns.

2. Hydro-Geological Tests of the Water Curtain System in the Huangdao Project

The Huangdao project is the first large-scale underground water-sealed oil storage project in China and is located in Qingdao city in eastern Shandong Province. It was constructed for the purpose of national strategic energy reserve storage and has a designed storage capacity of 3 × 10⁶ m3 by using nine parallel storage caverns. Each cavern has a span of 20 m and a height of 30 m with a net spacing between caverns of approximately 30–40 m. The caverns were constructed at an elevation of between −20 m and −50 m, and the water curtain system, which is composed of water curtain galleries and boreholes, is located 25 m above the cavern roof. The boreholes are 10 m in spacing and 120 mm in diameter, and most of them are approximately 100 m in length. The pressure of the water curtain system is 300 kPa (30 m water pressure head). The axis of the water curtain gallery is perpendicular to that of the storage cavern while the boreholes are parallel to the axis of the cavern. The water curtain system covers the entire cavern zone. In order to detect the efficiency of the water curtain system and to assess the hydraulic conductivity of the surrounding rock masses, four kinds of hydro-geological tests were implemented for the Huangdao project, involving the single-borehole injection-falloff test, interconnectivity test between two boreholes [4,46], steady injection test for all boreholes [46], and full-size efficiency test of the water curtain system. These tests were carried out by mainly drawing on the engineering experiences of GEOSTOCK Company in the storage cavern design.
Among the above-mentioned four kinds of hydraulic testes, the steady water injection testing of all water curtain boreholes can be used for long-term observation of the water pressure and flow rate. This test commences immediately after the completion of the single-borehole injection-falloff test and is maintained throughout the whole construction period. The water injection pressure applied in this test is usually set slightly in excess of the hydrostatic pressure corresponding to the borehole elevation, and the water pressure together with the flow rate of each borehole is recorded daily. Compared with the single-borehole injection-falloff test, the steady injection test is more convenient to operate and can provide a large amount of observation data. Moreover, the long observation time of this test can avoid the problem of insufficient time to monitor the transition from unsteady-state flow to steady flow encountered in the single-borehole injection-falloff test. In what follows, a series of numerical analysis are conducted to develop a method of utilizing steady injection test data to estimate the equivalent hydraulic conductivity of rocks surrounding water curtain boreholes.

3. Method for Analyzing Equivalent Hydraulic Conductivity

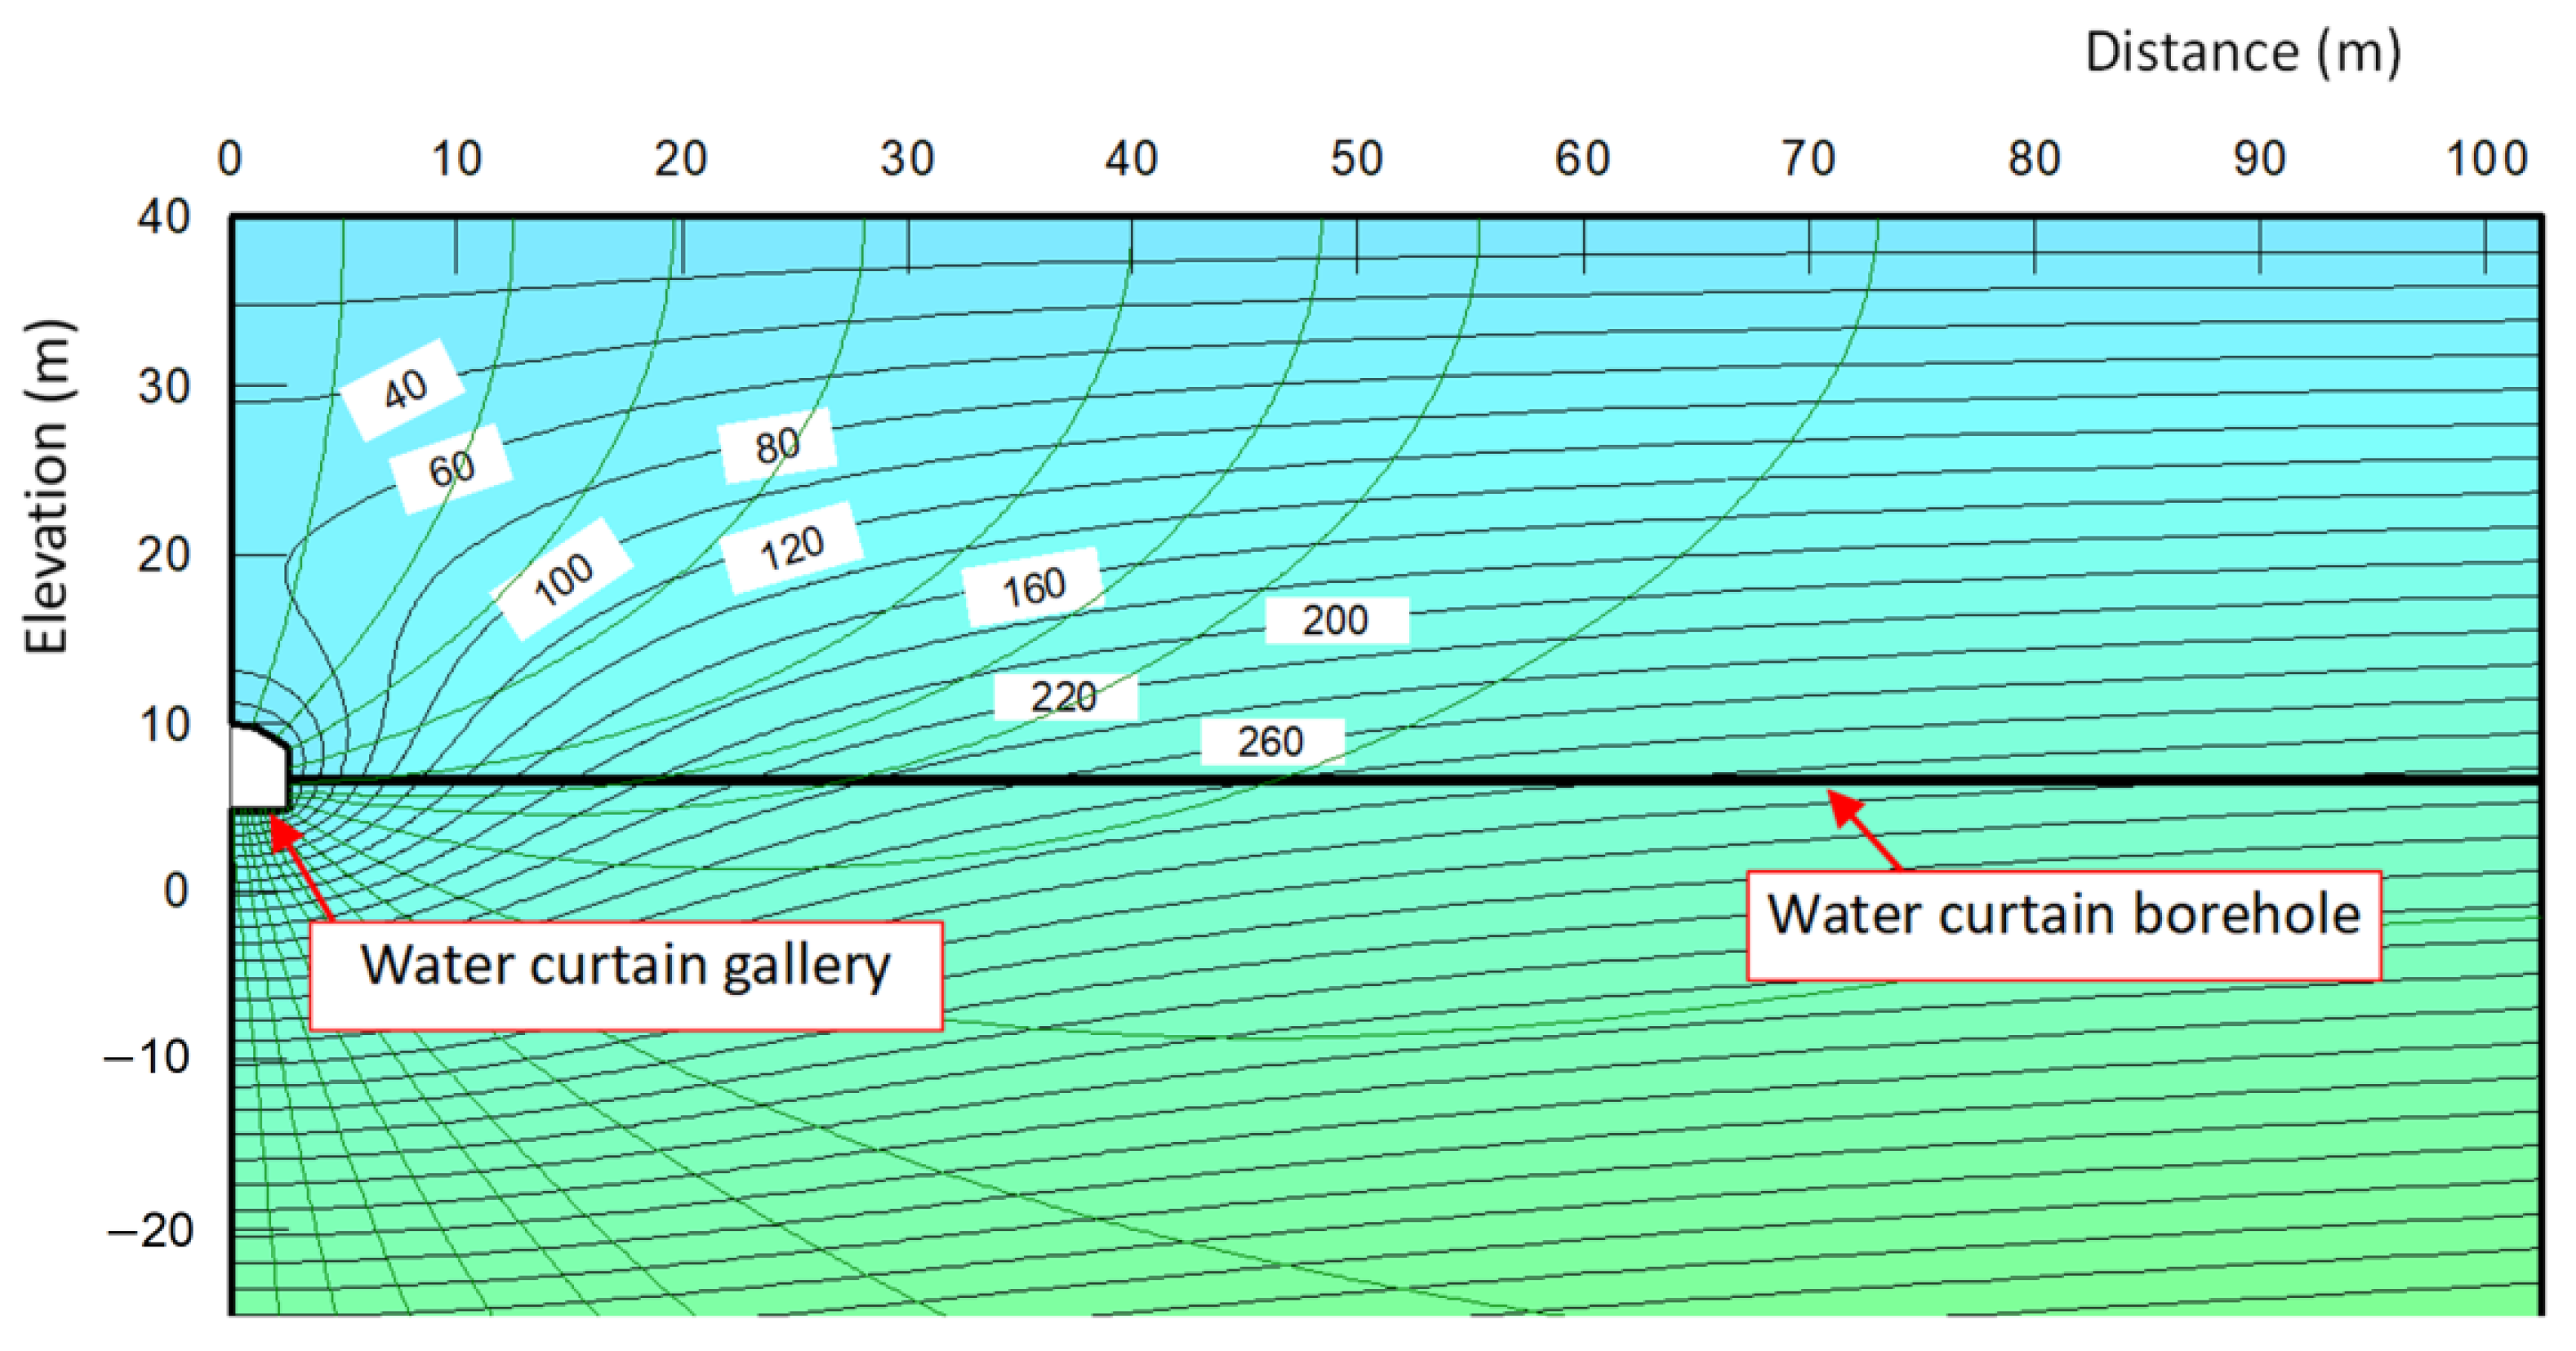
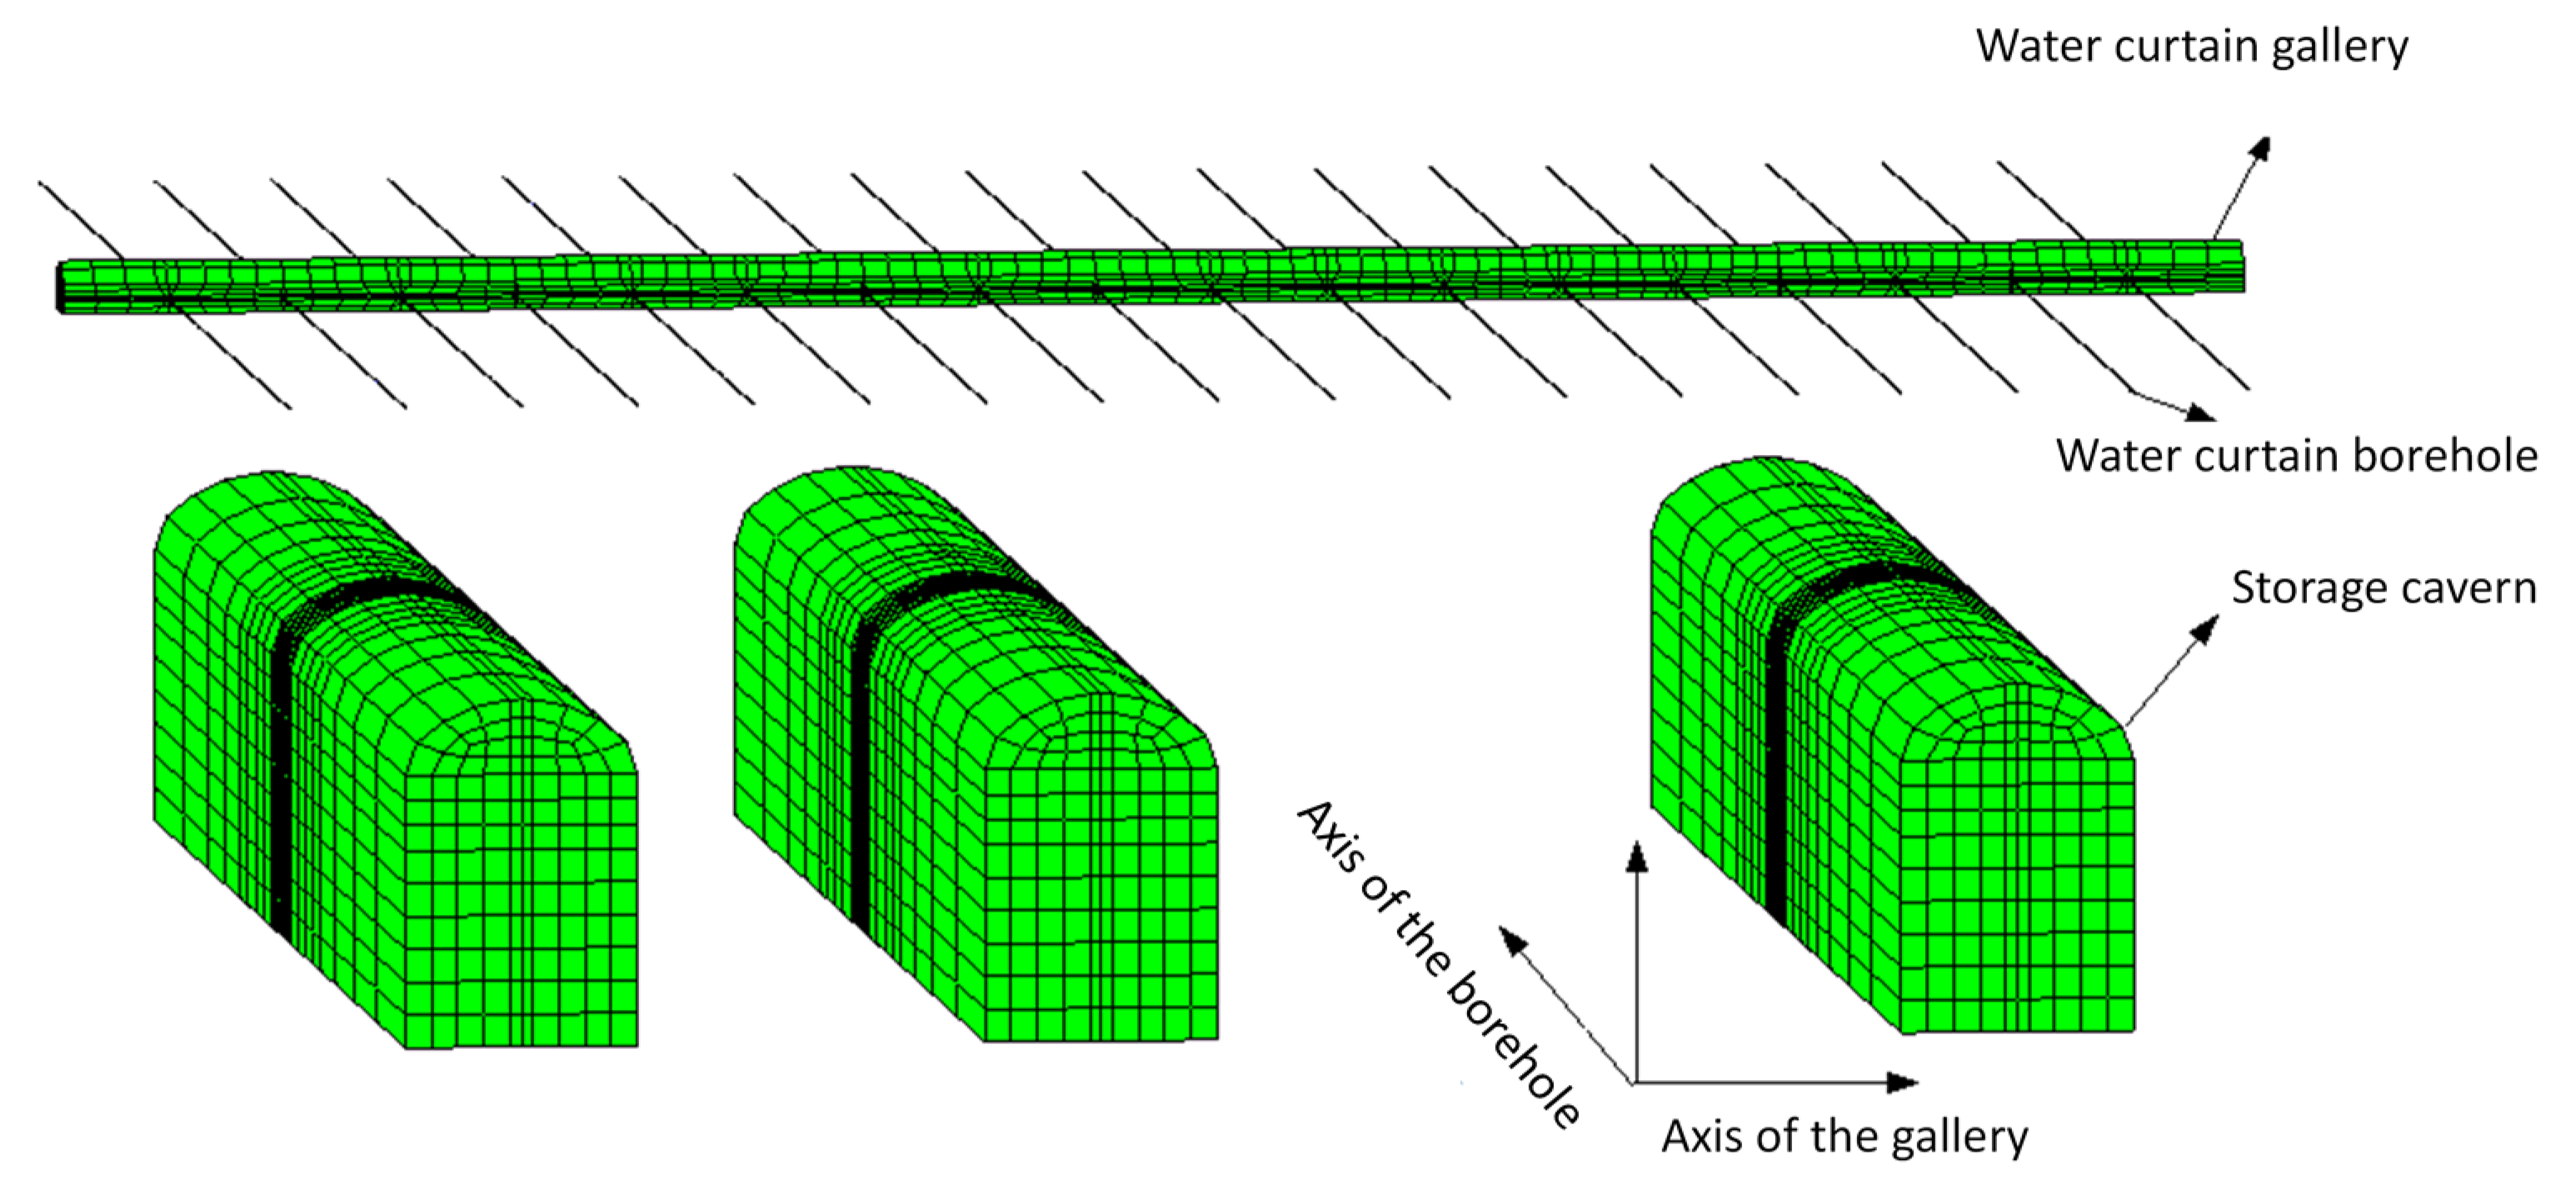
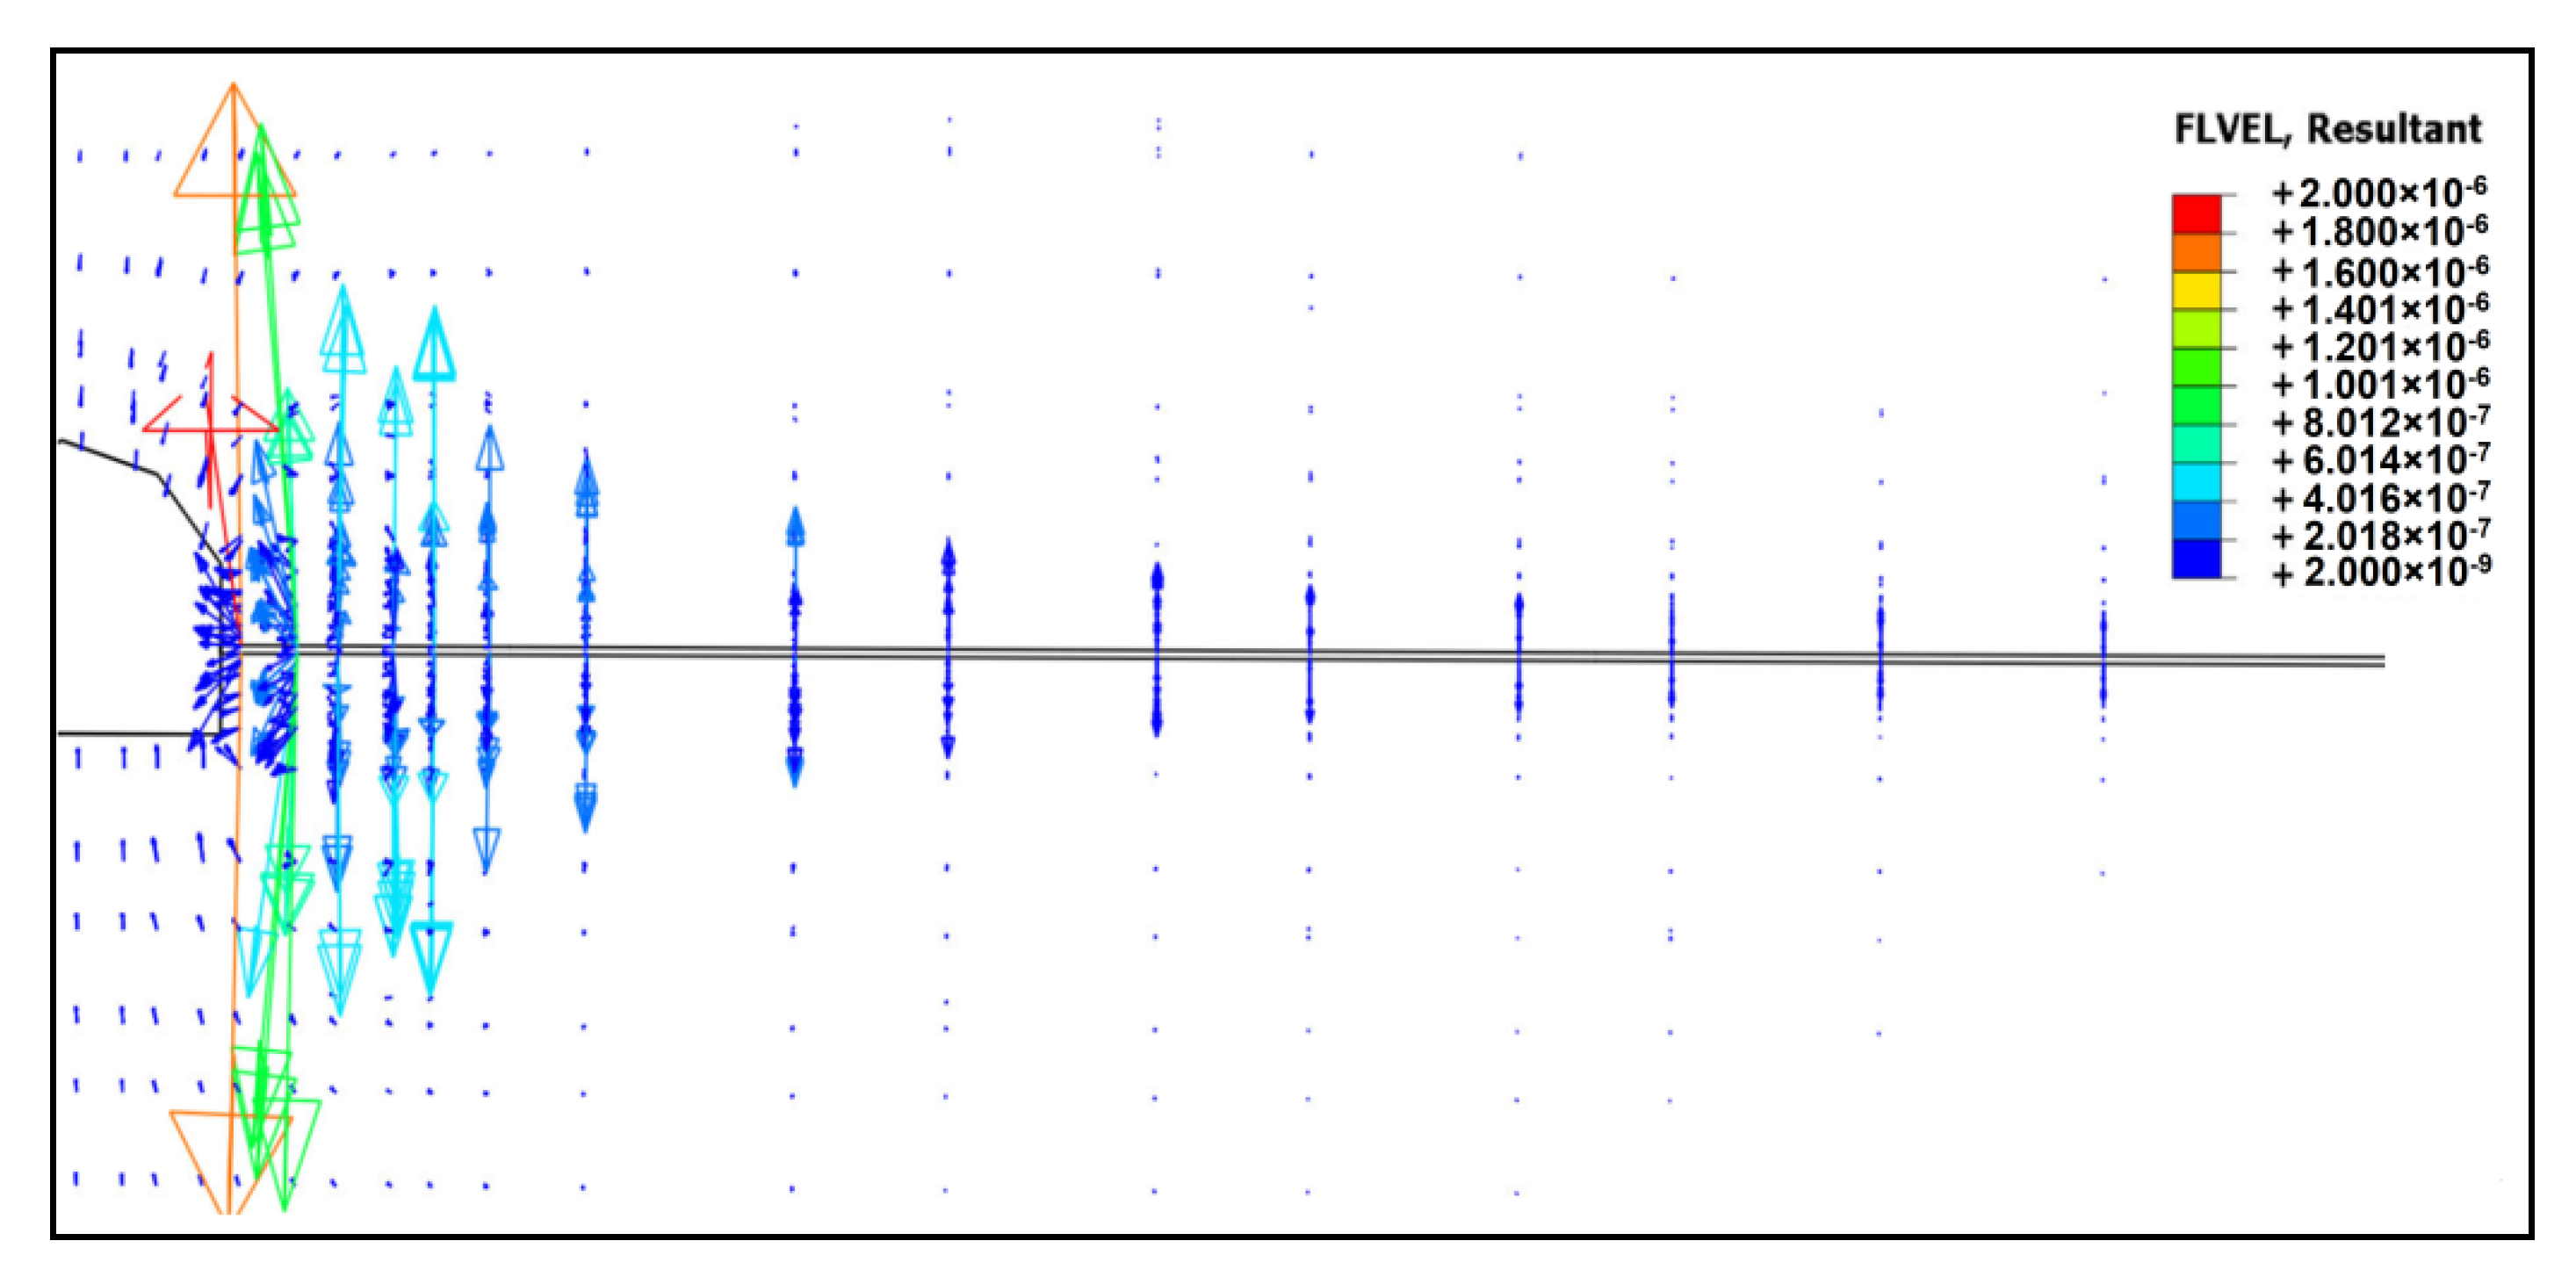
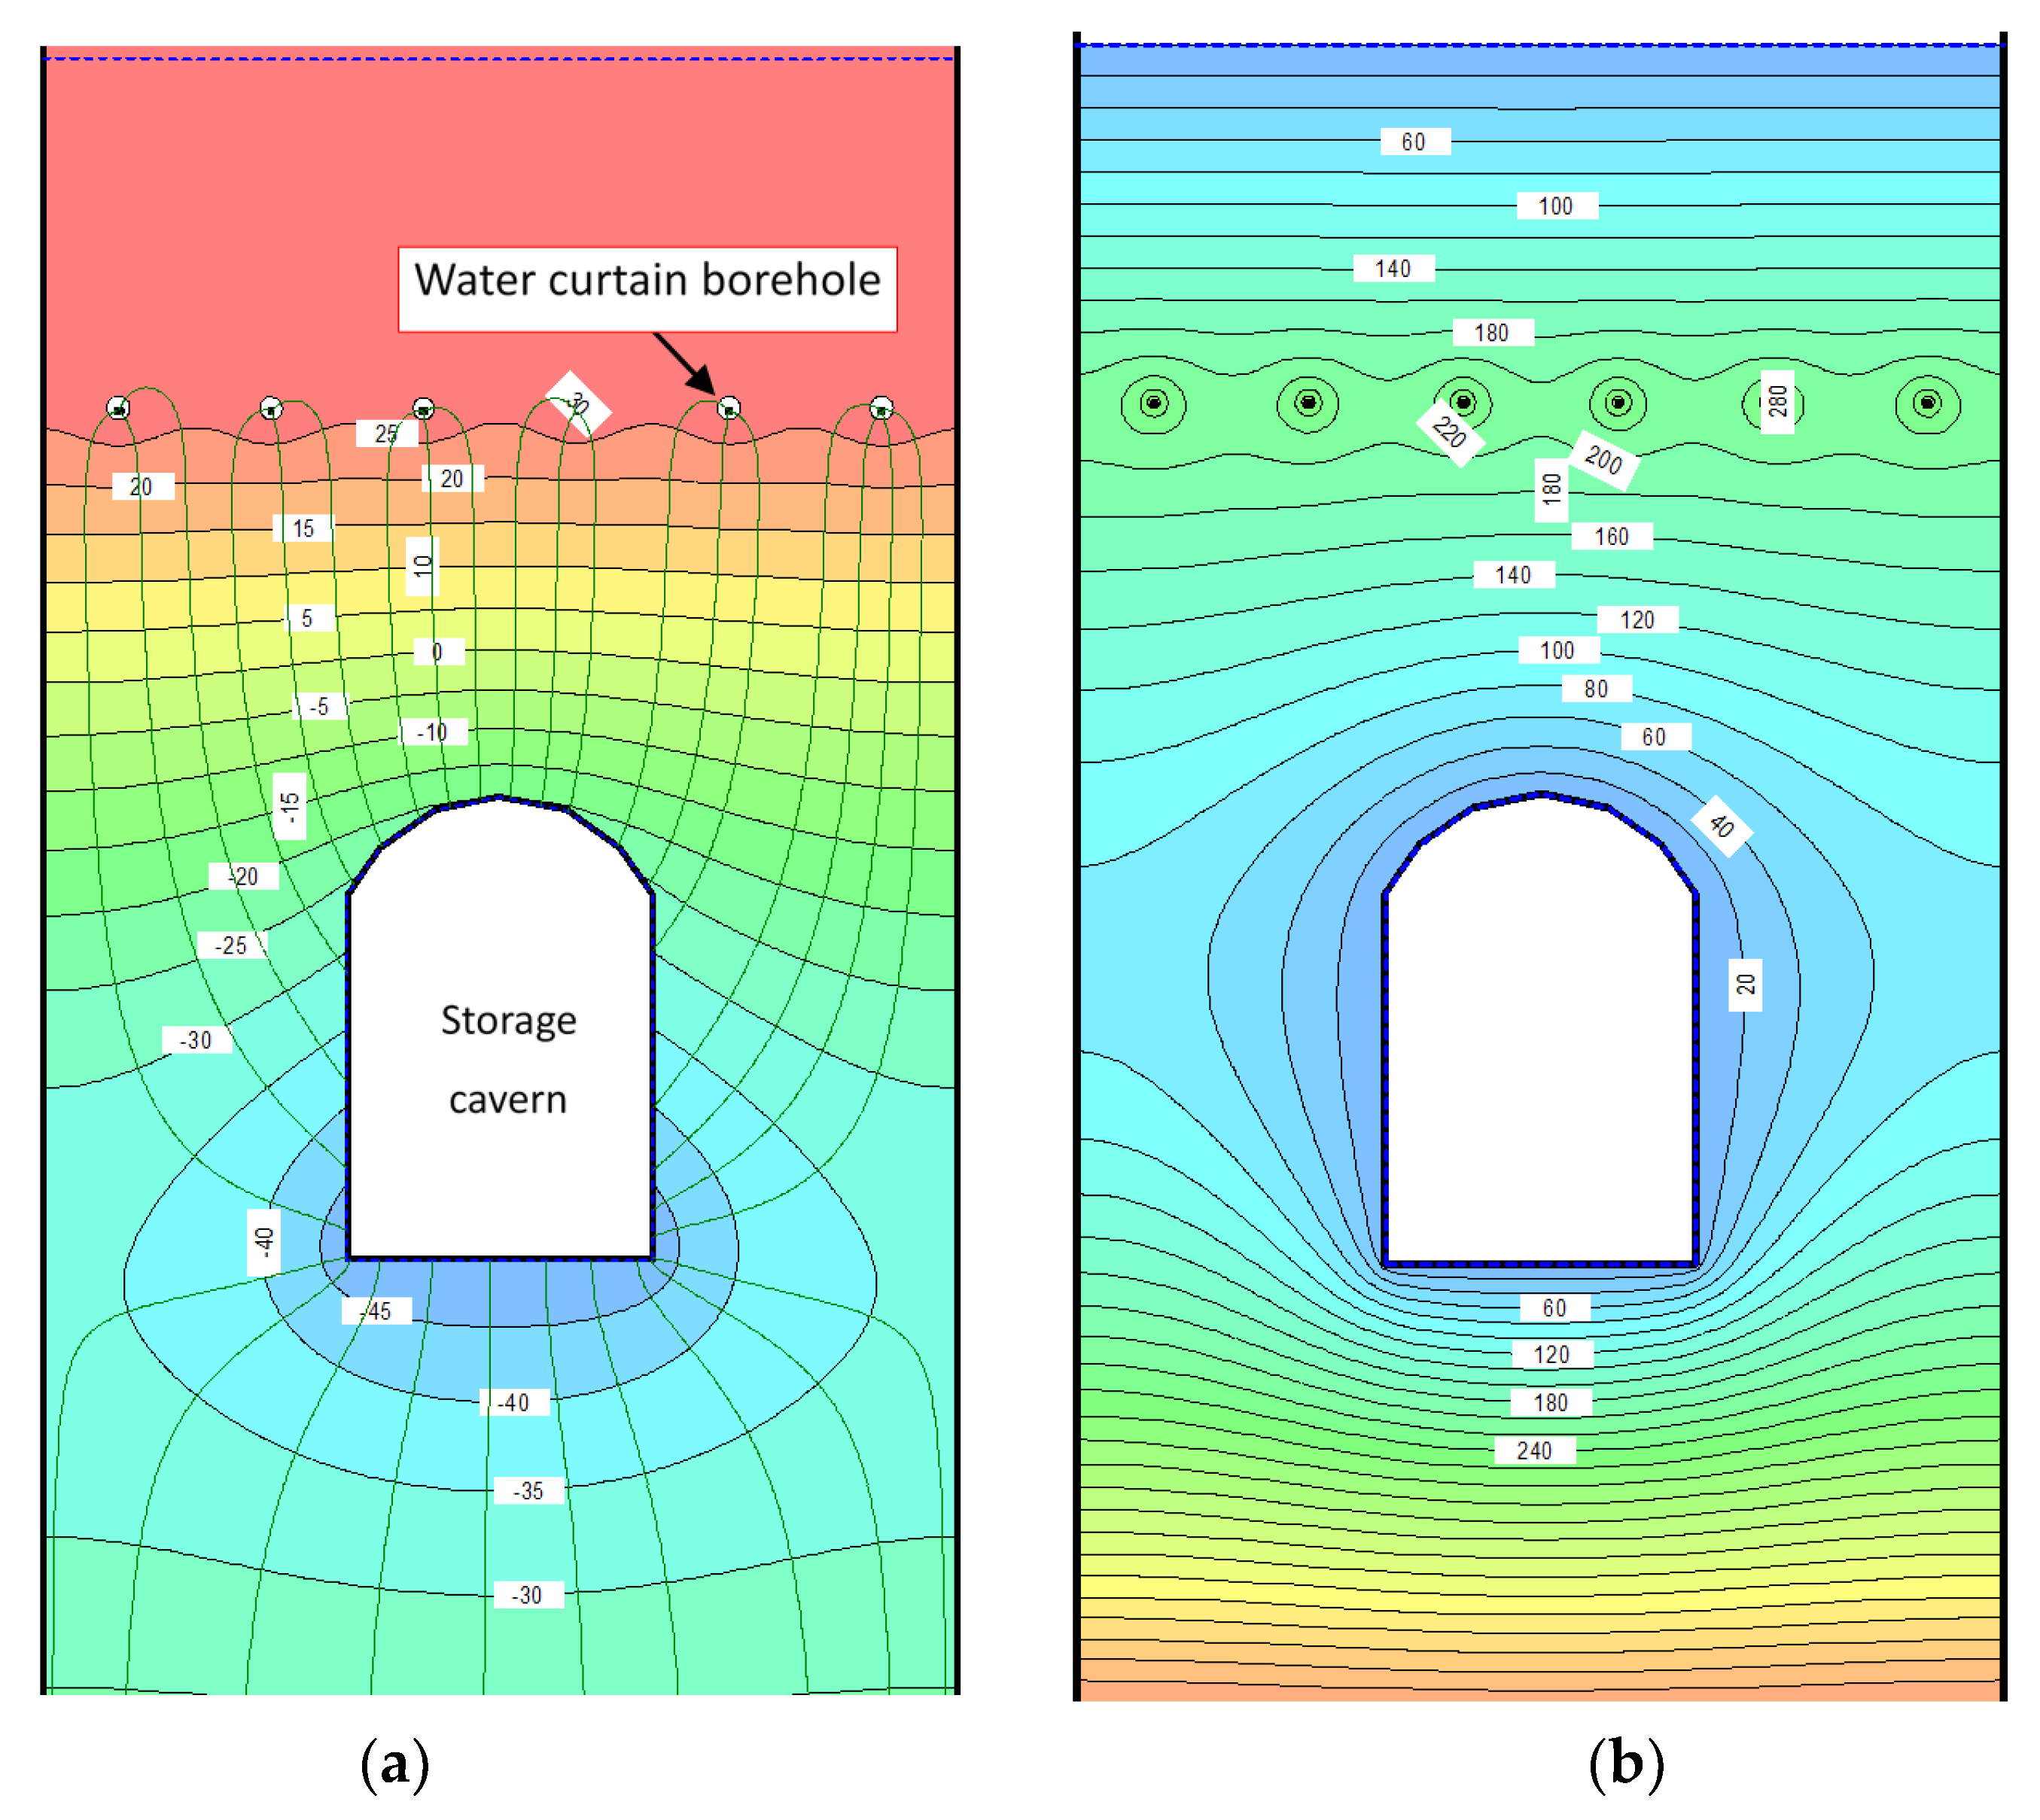
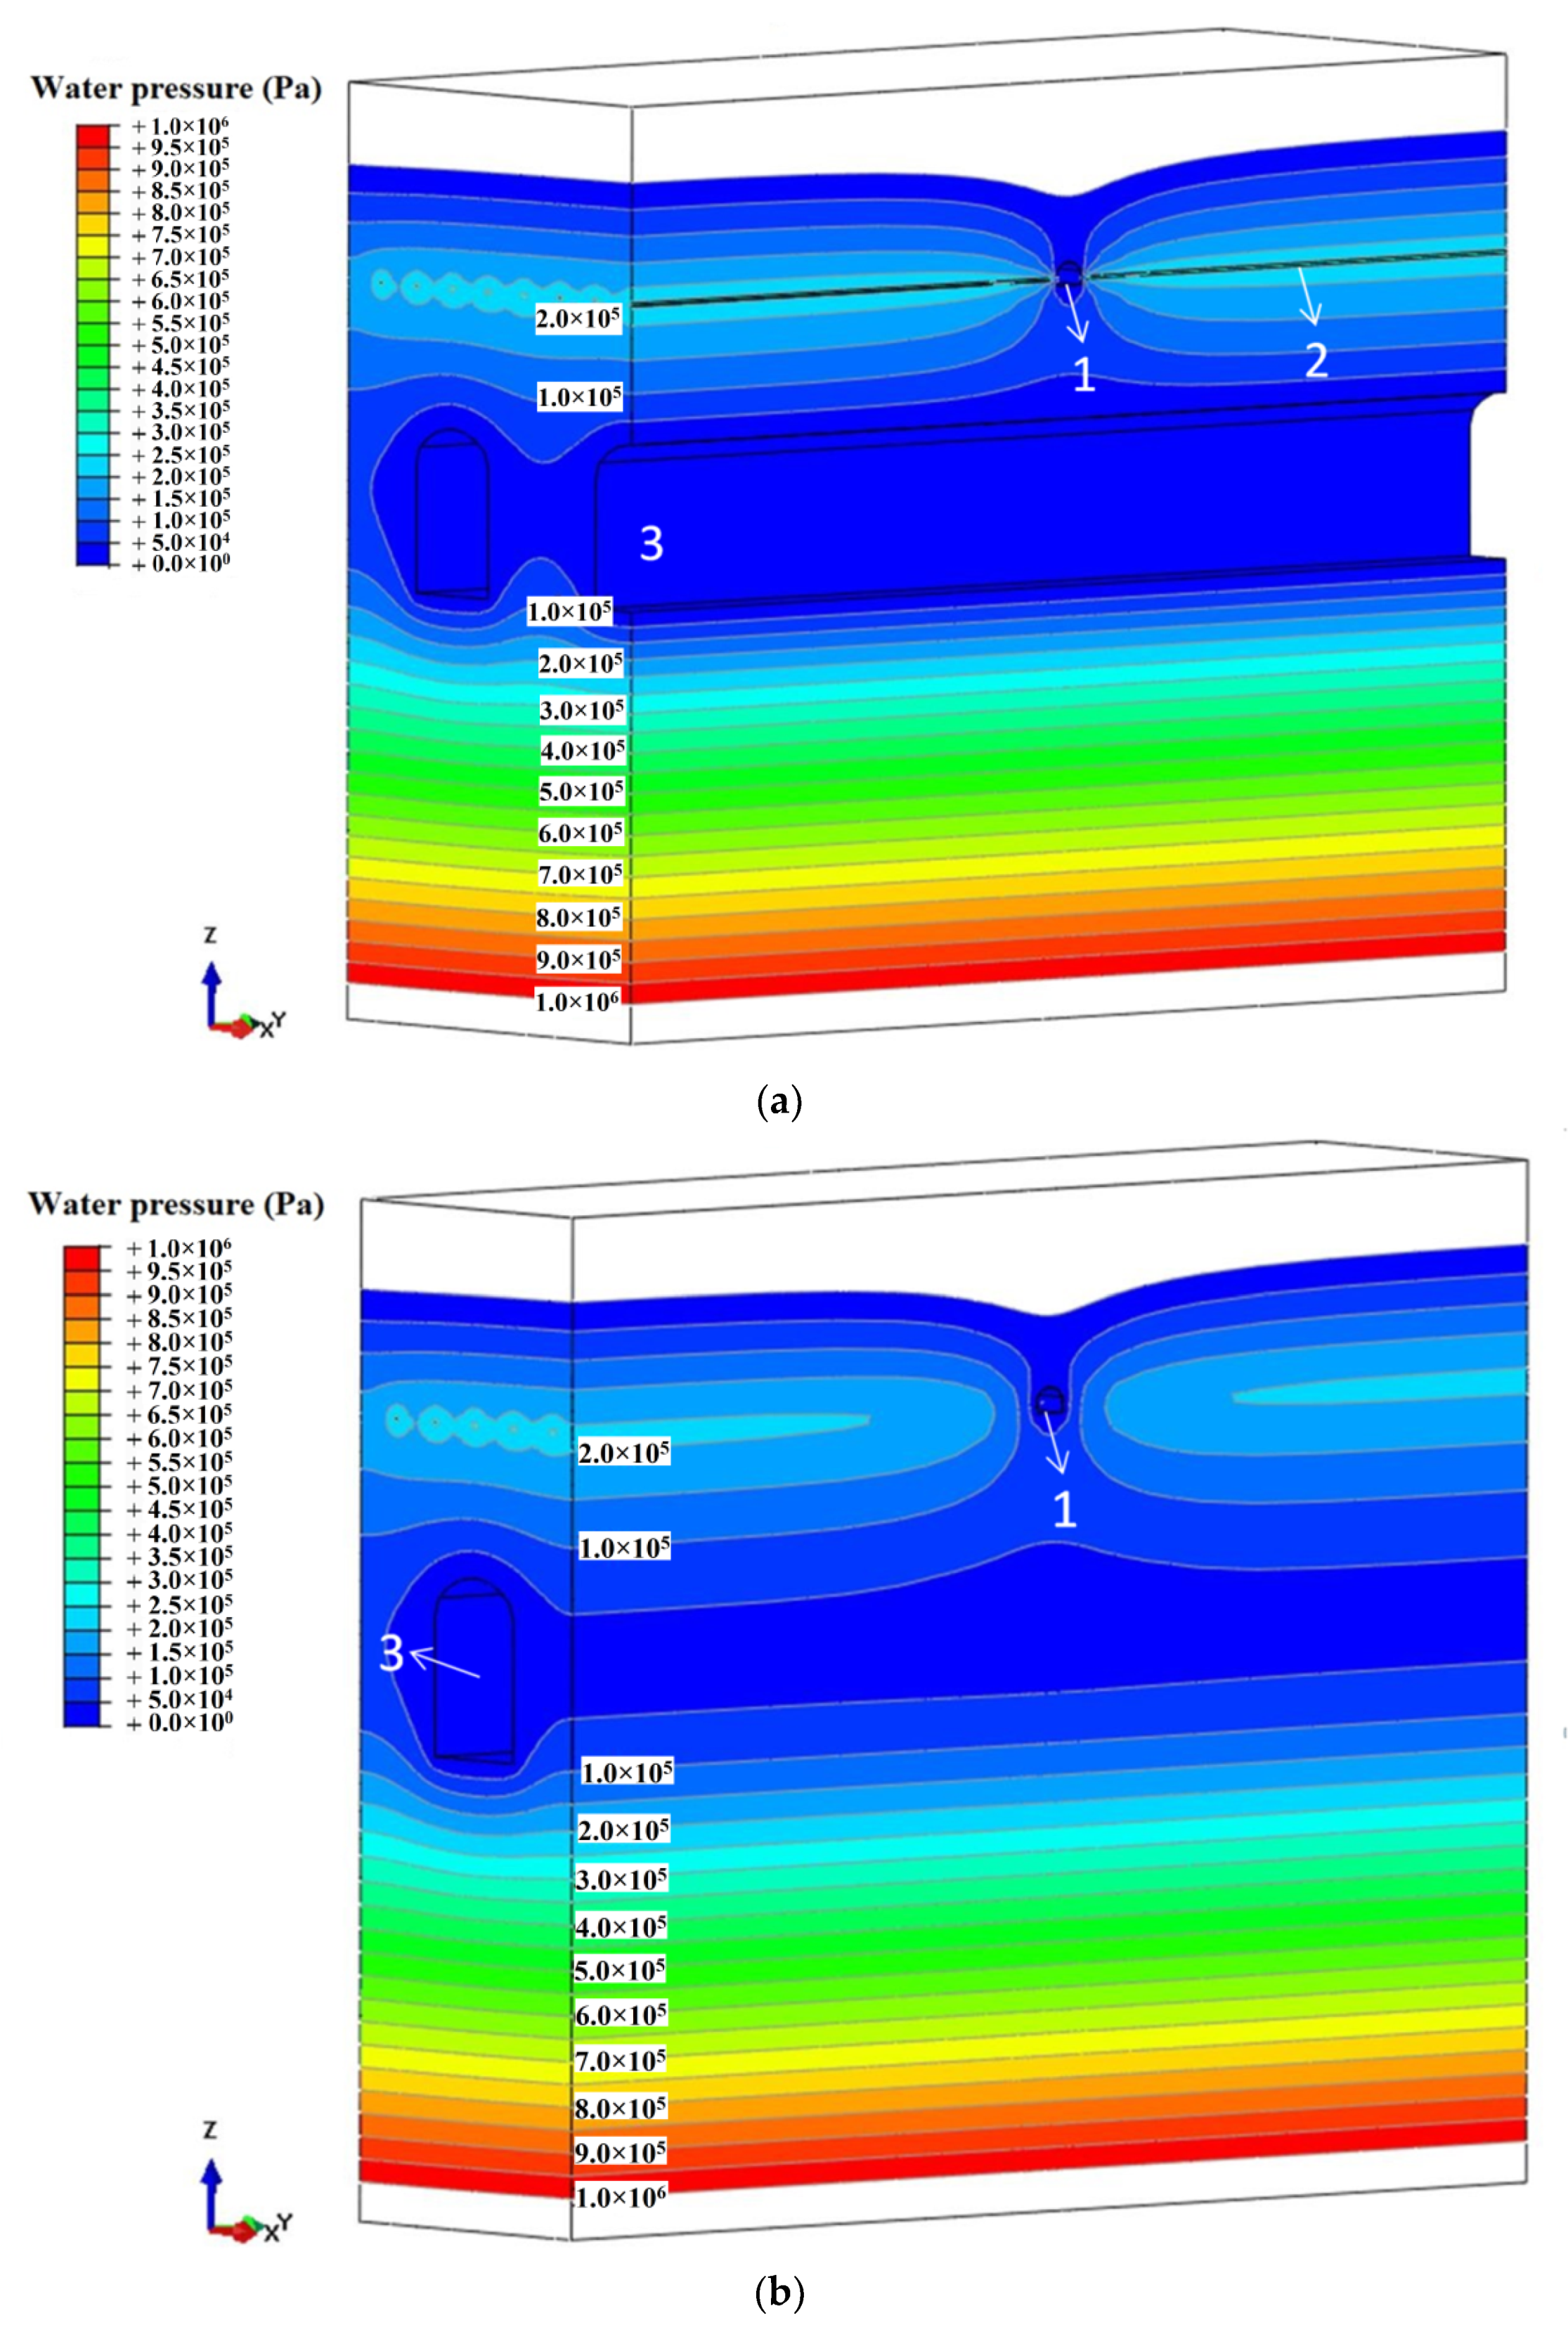
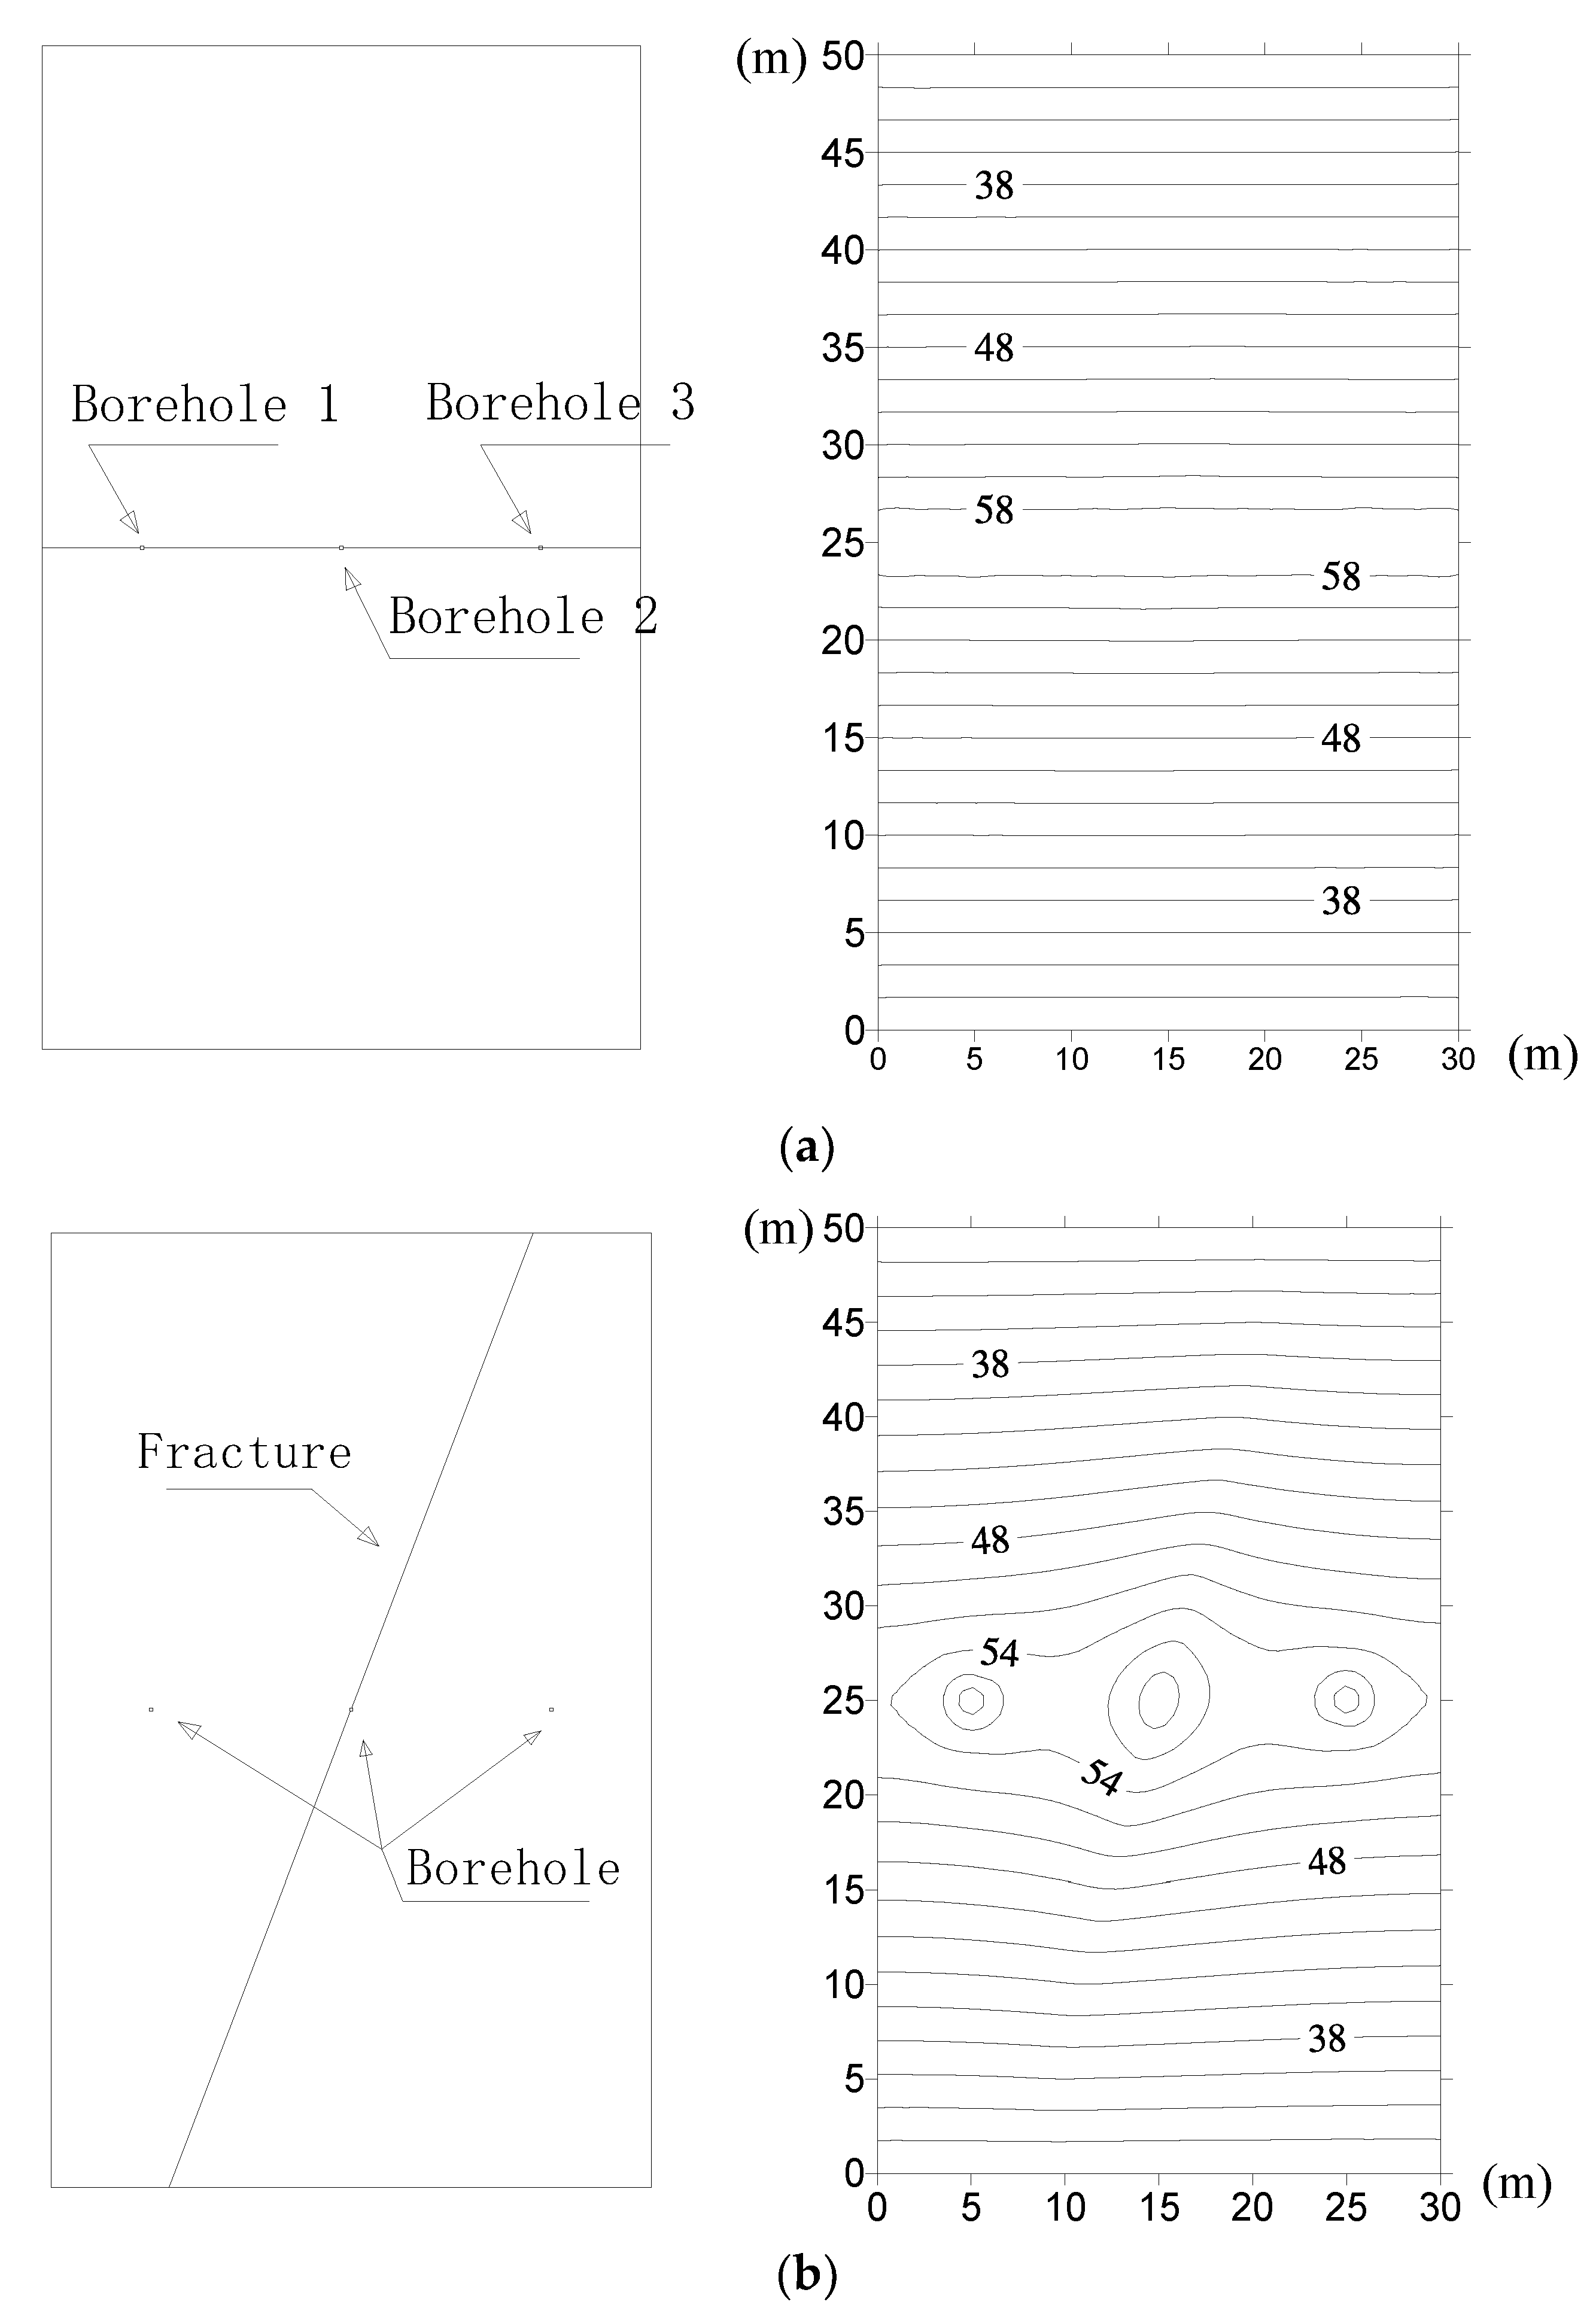
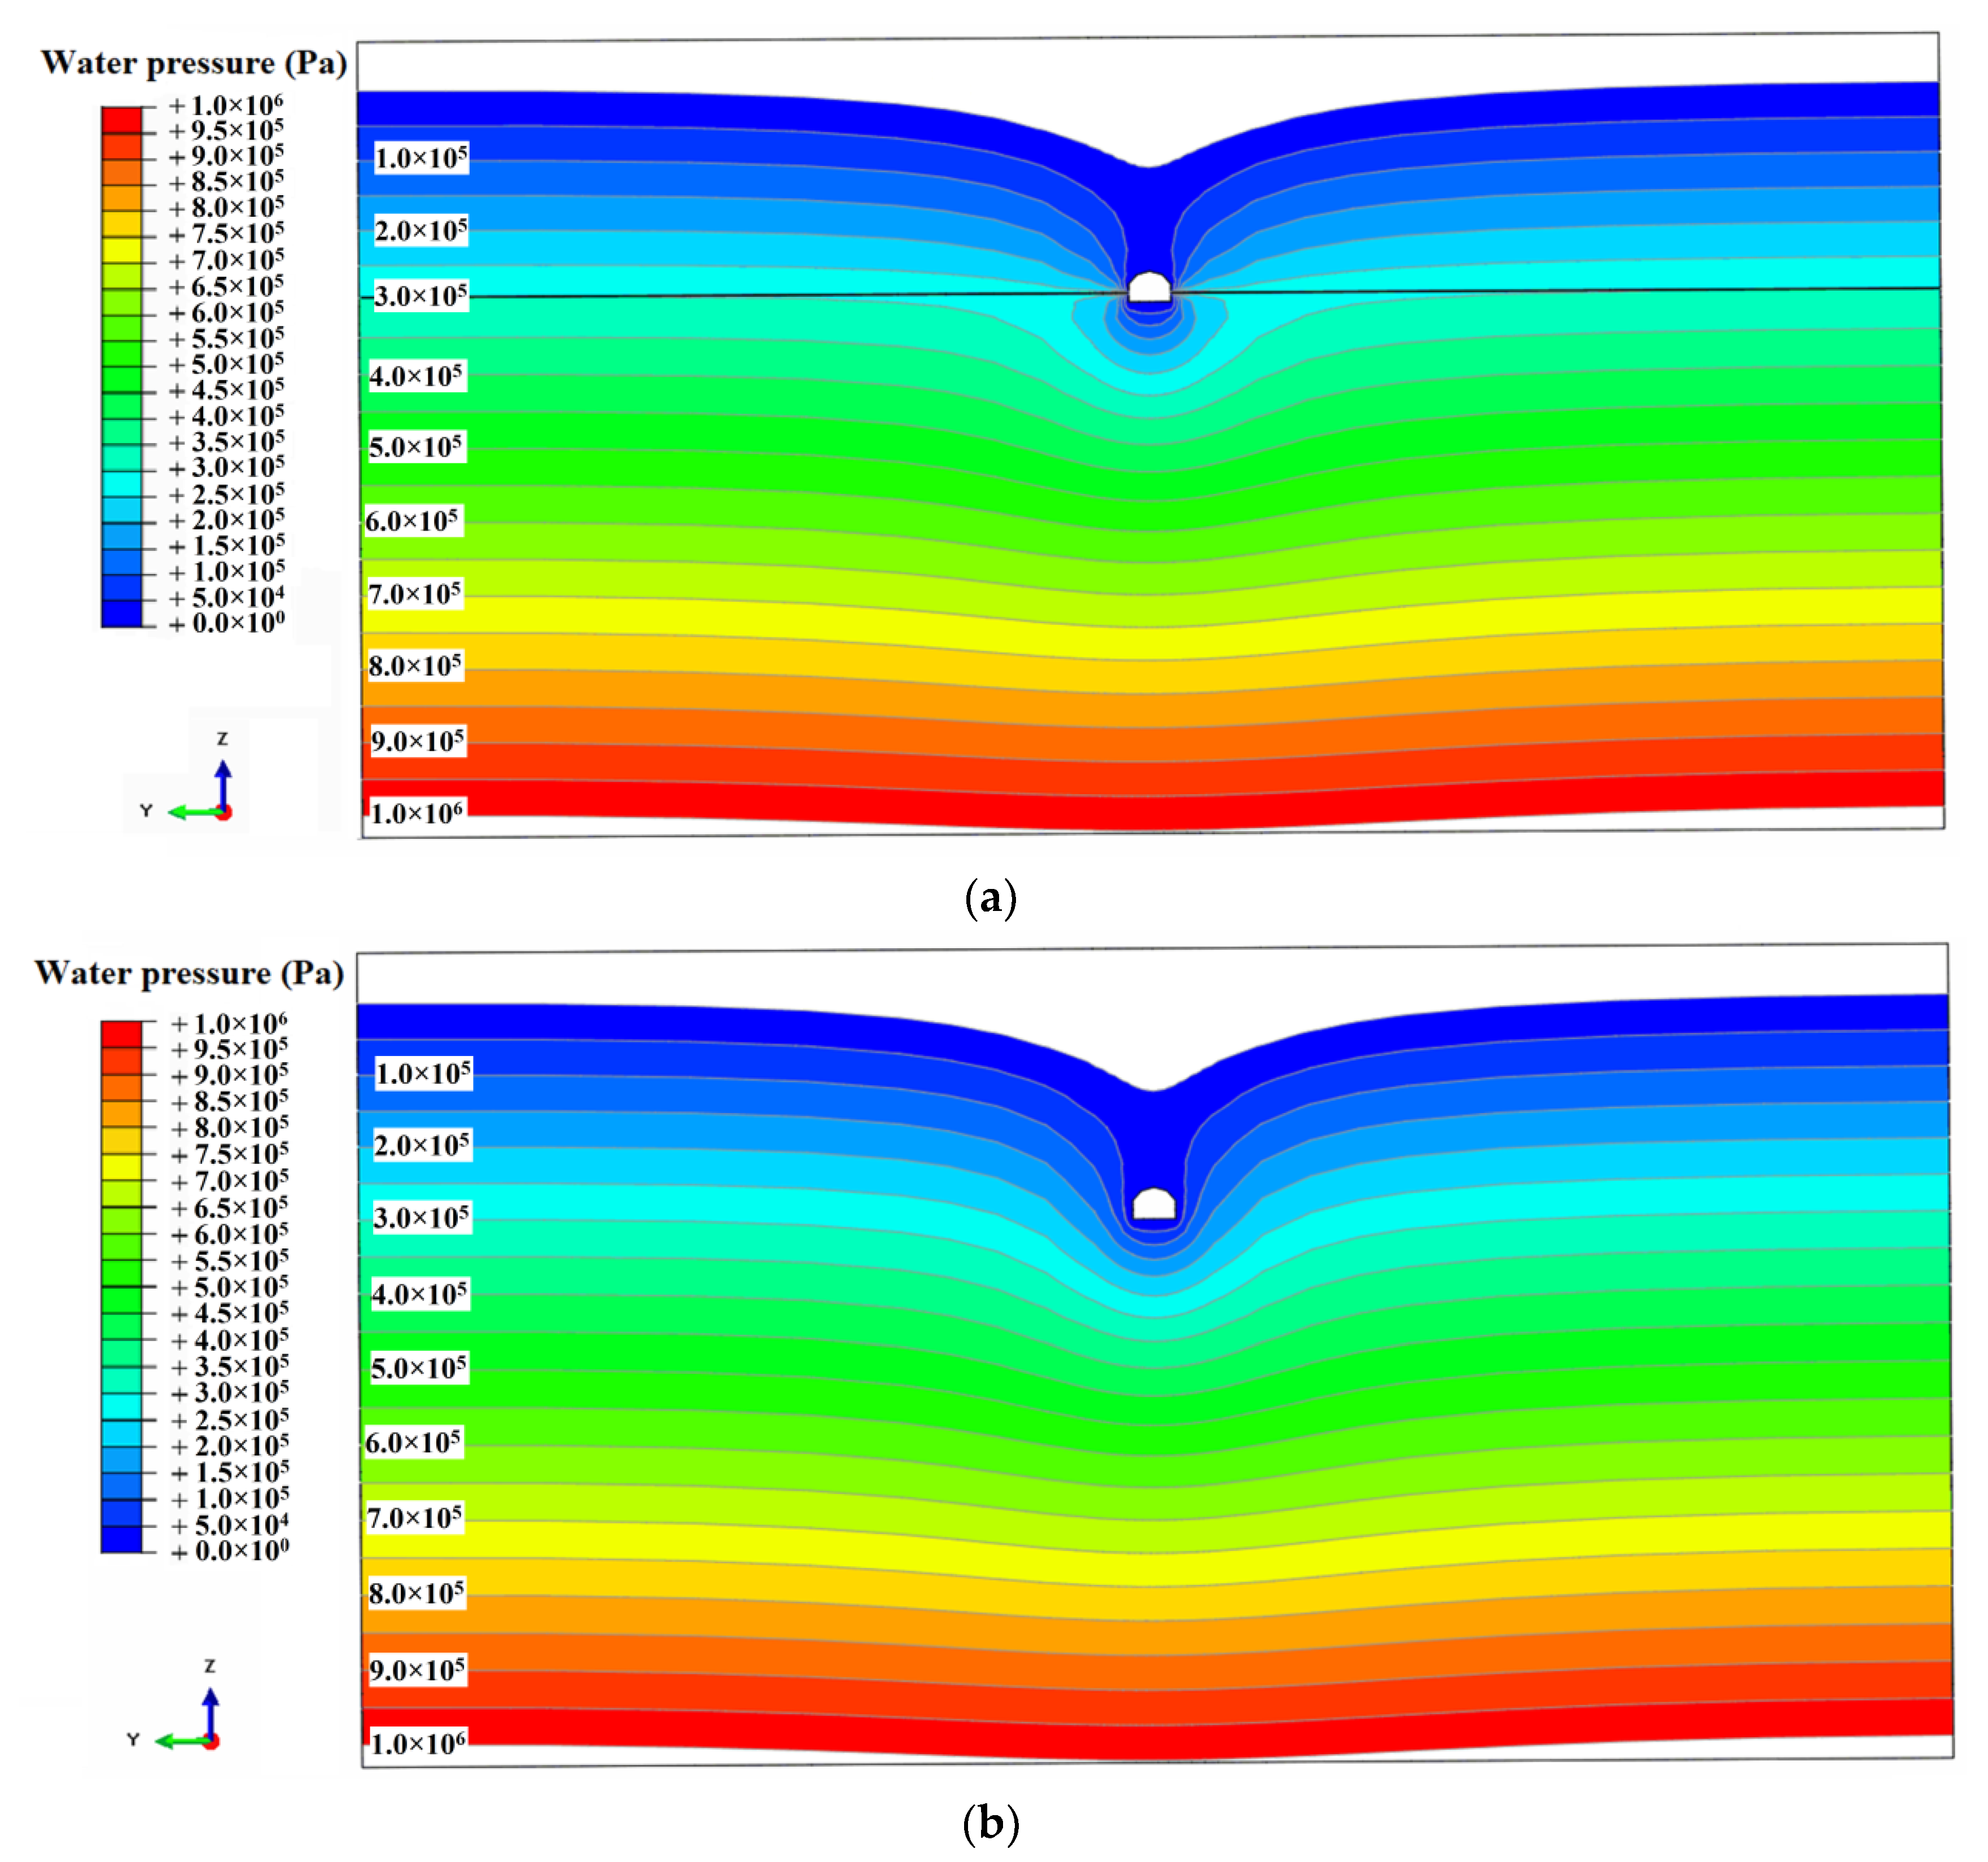
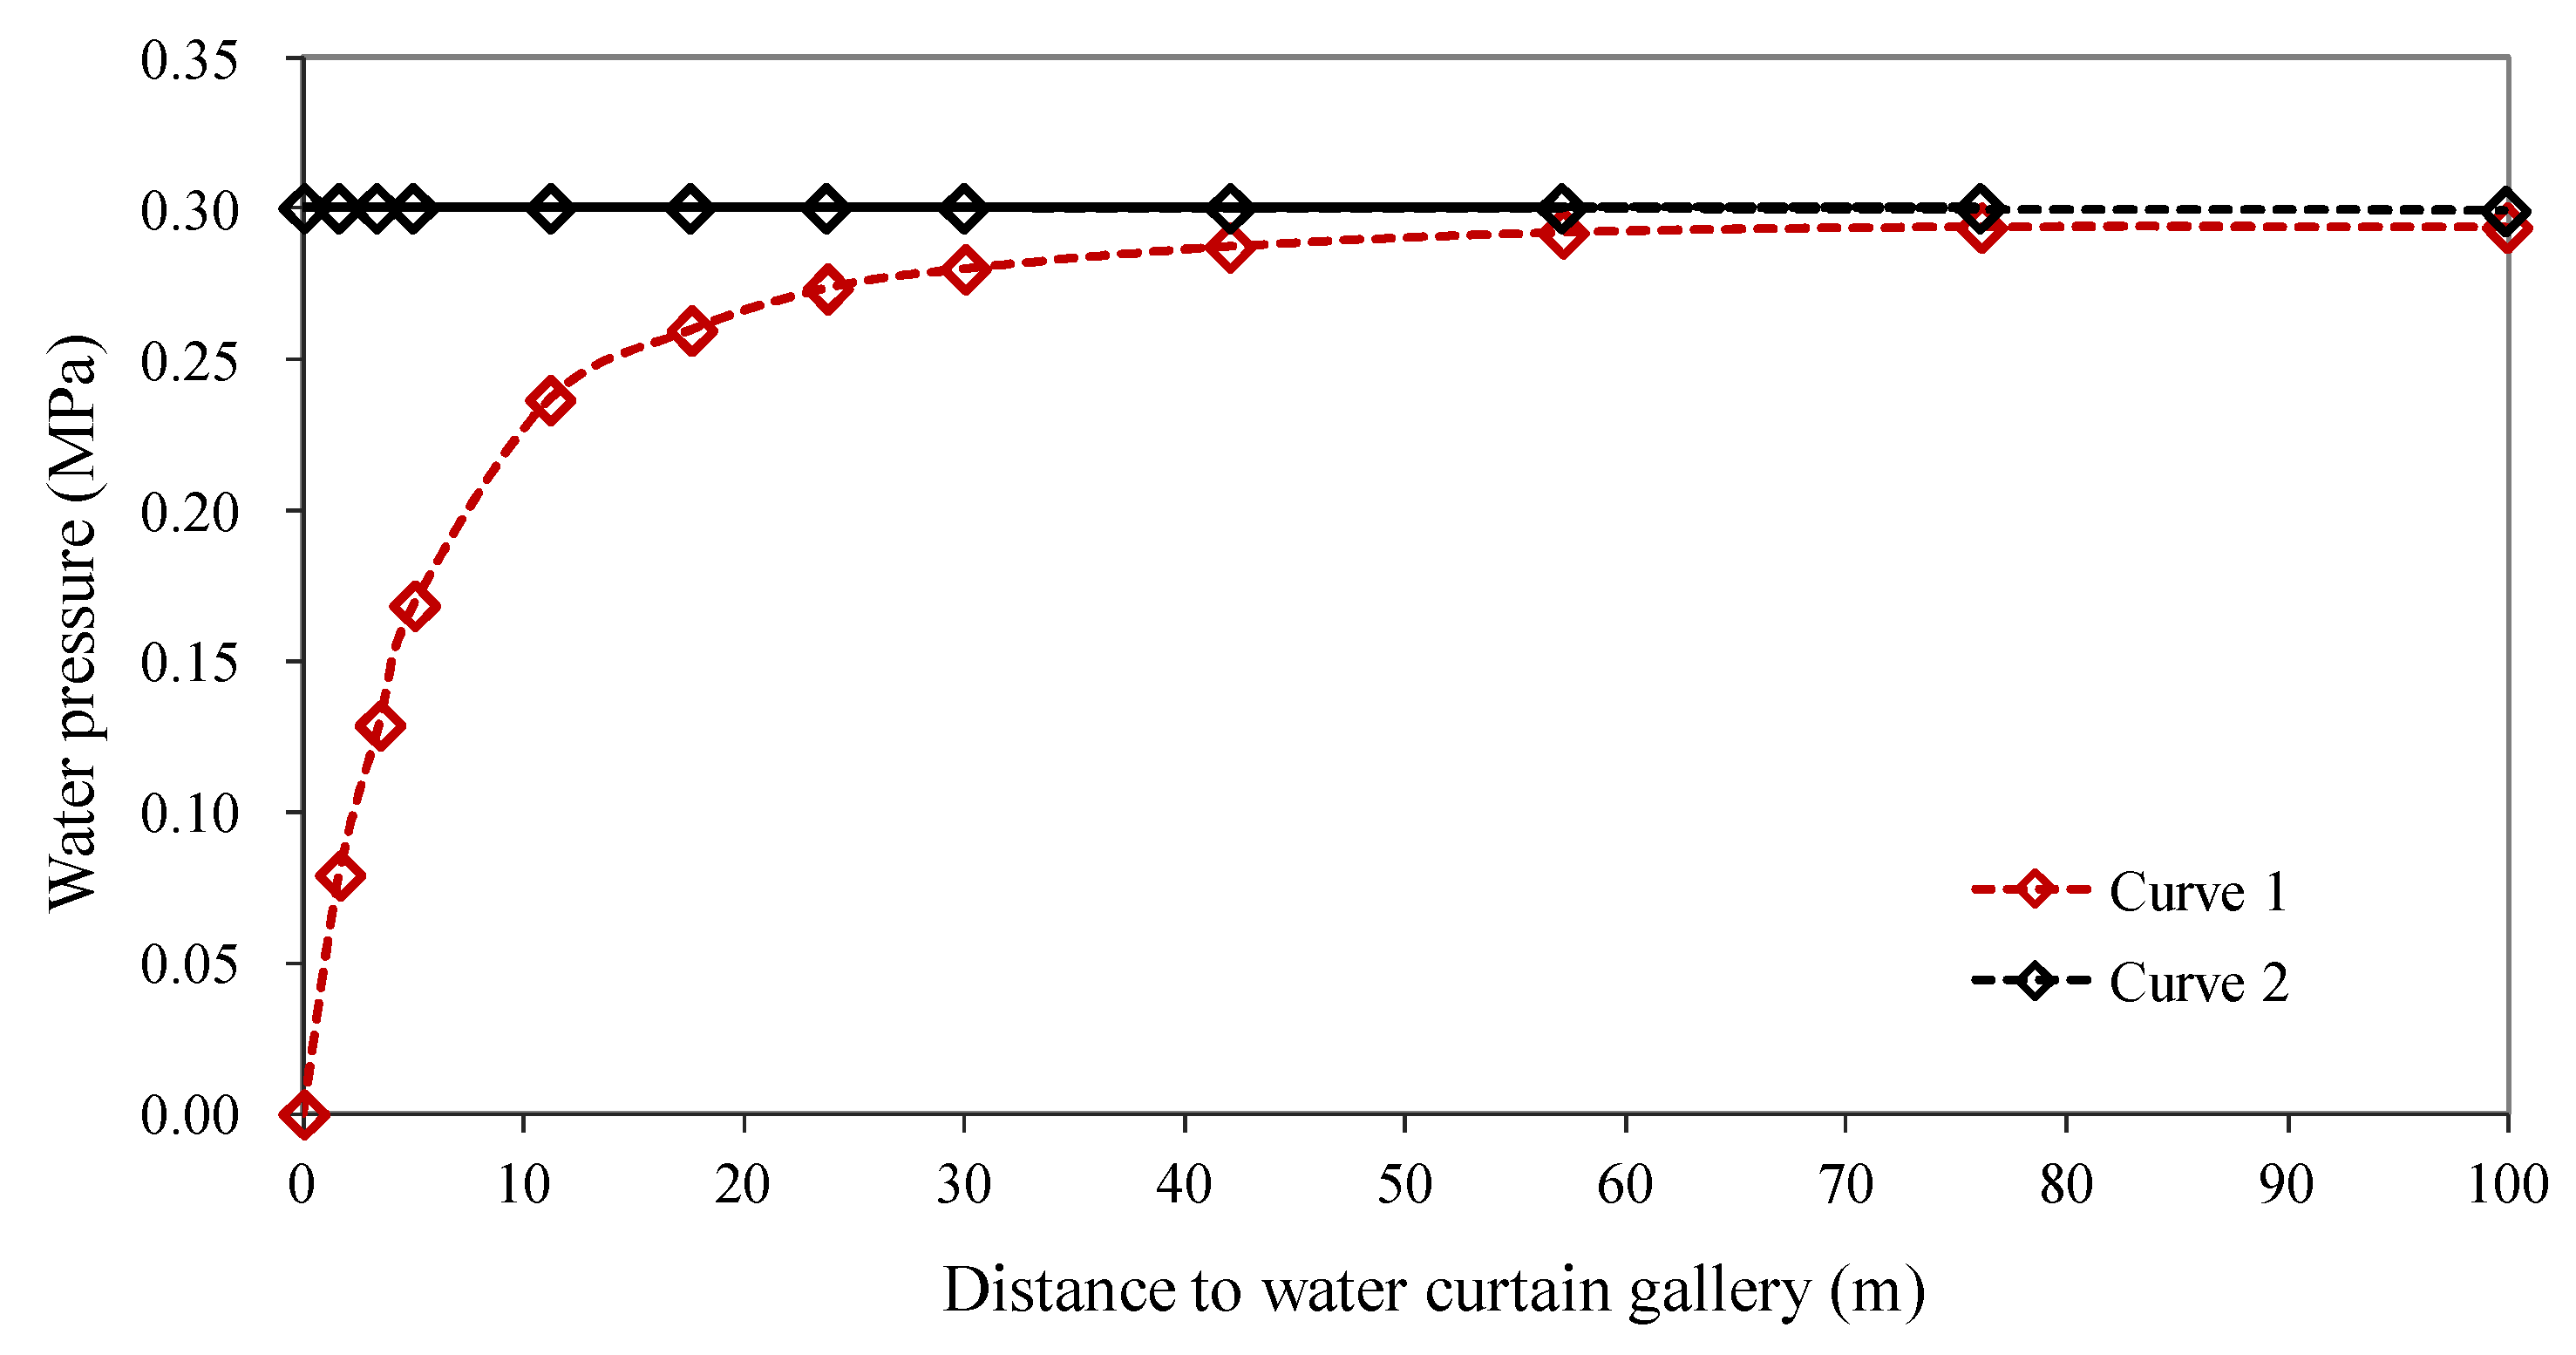
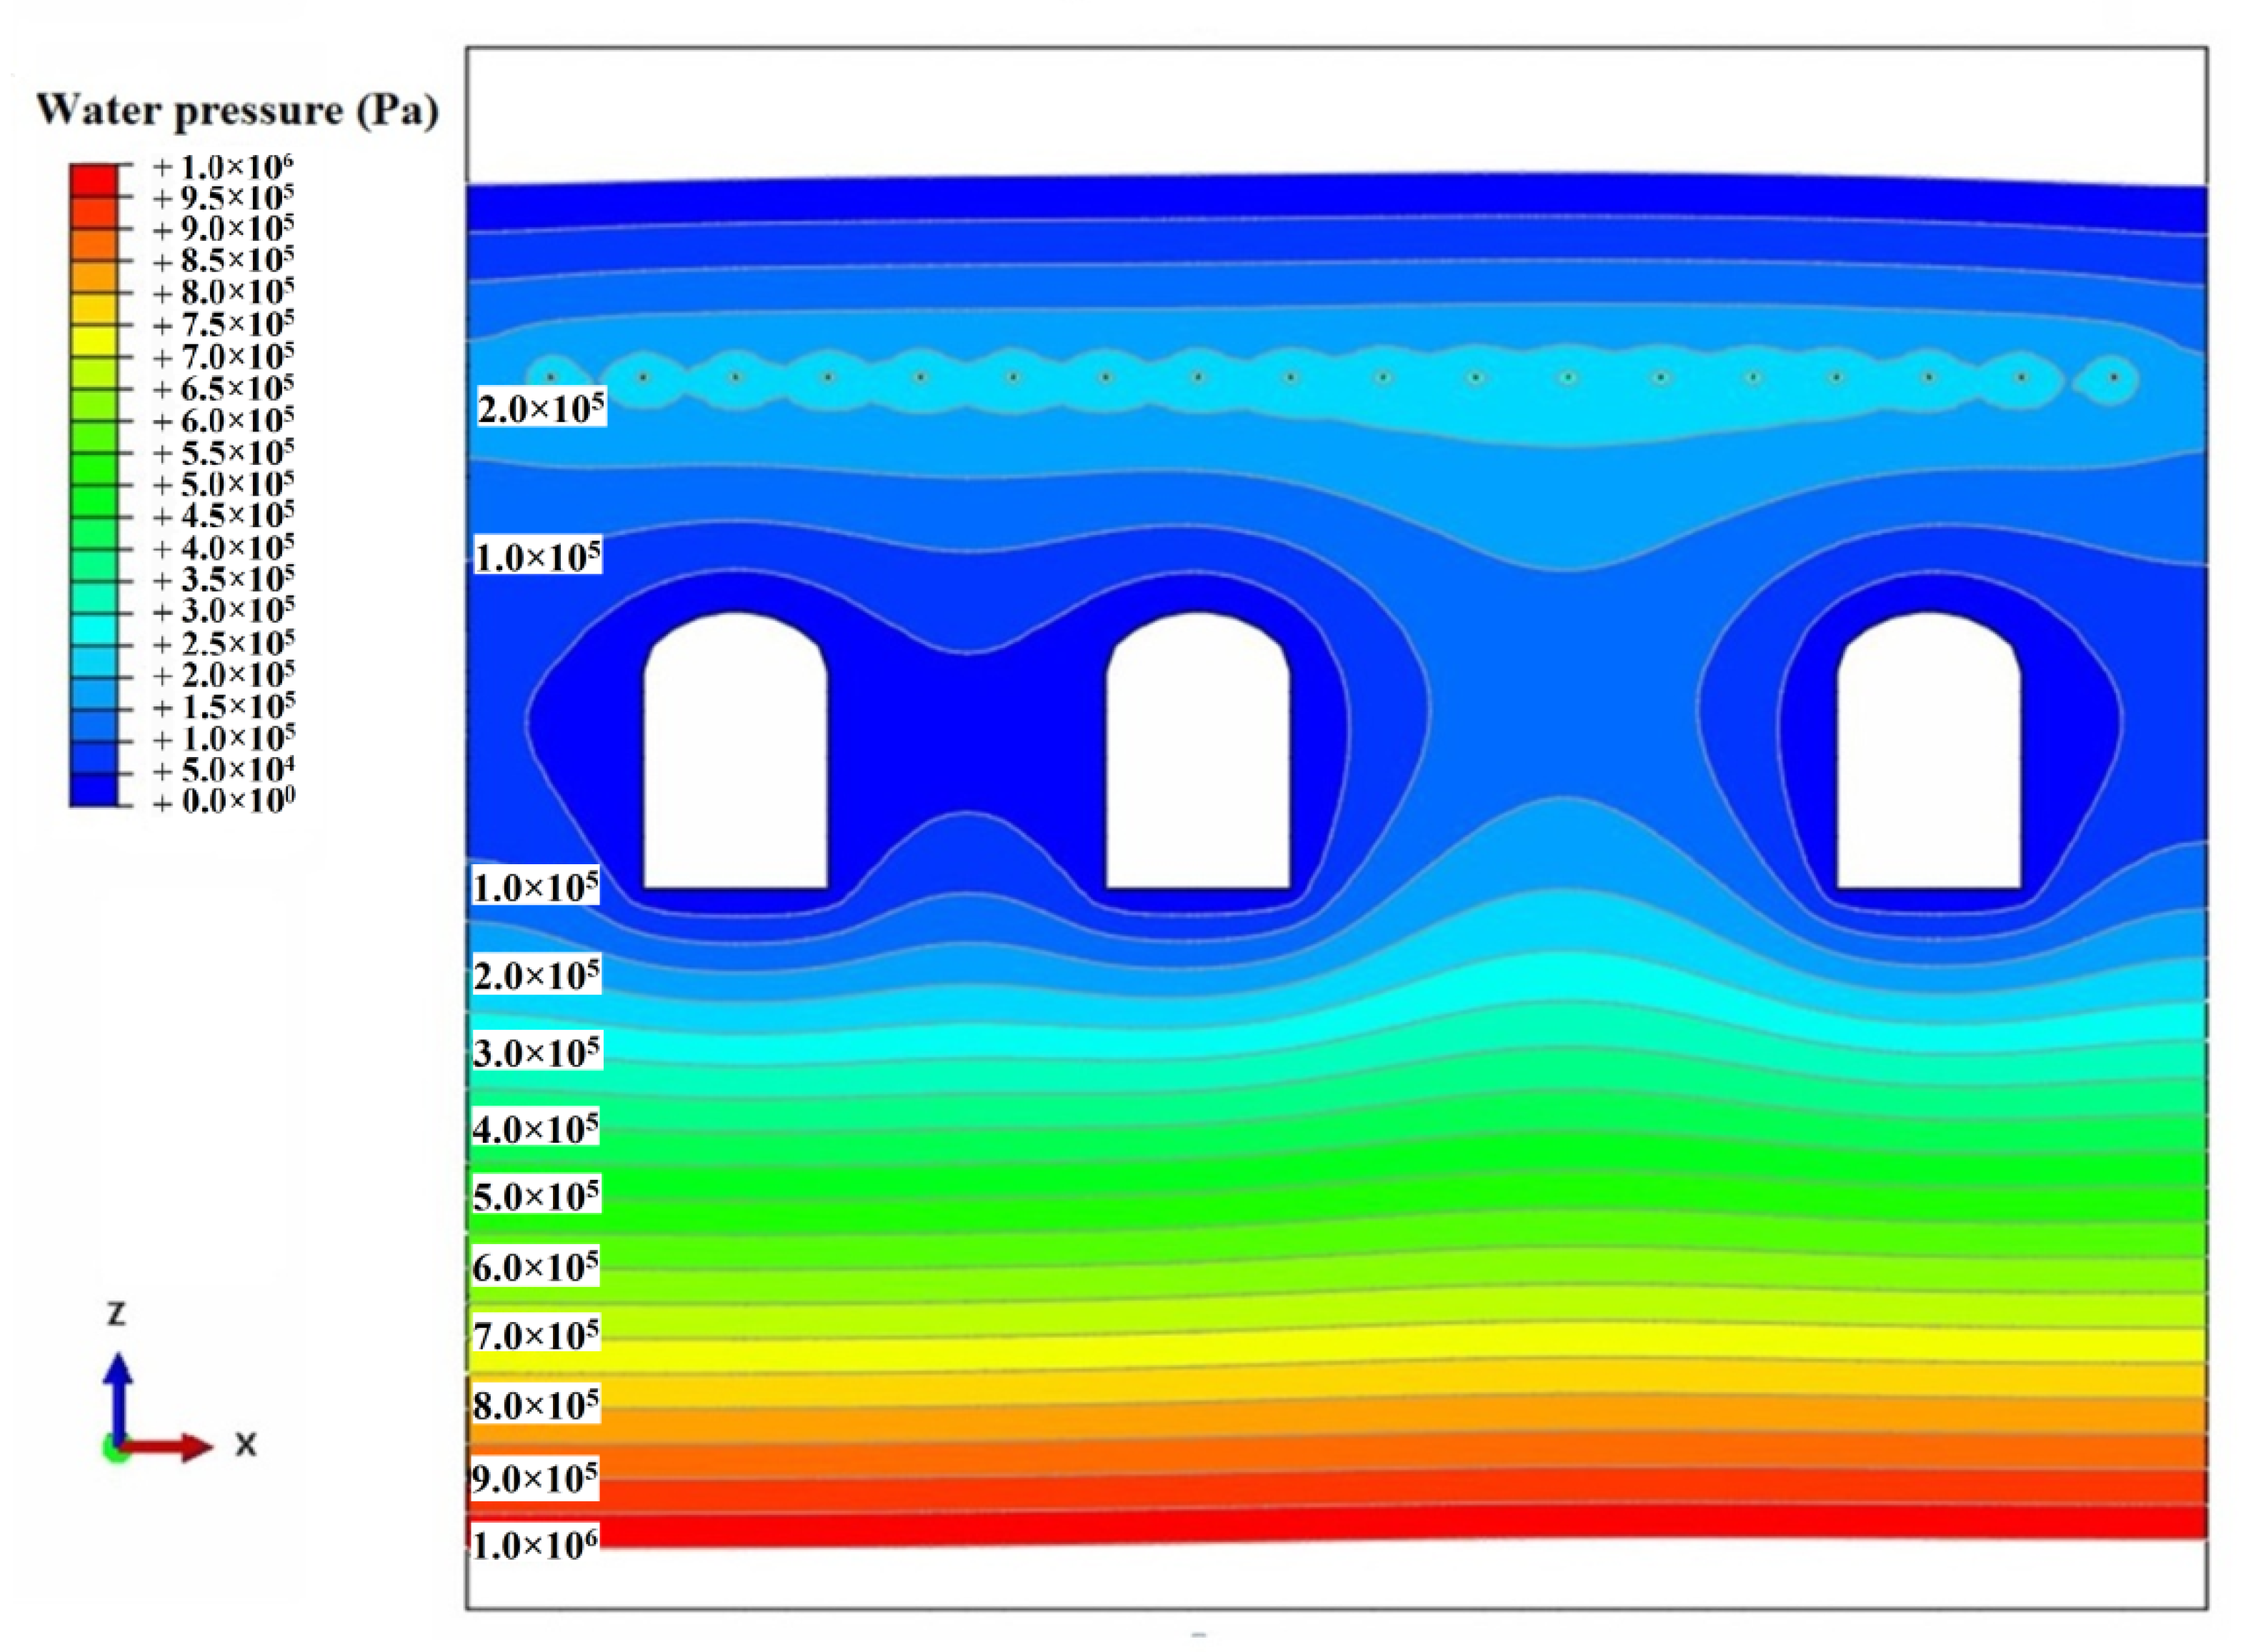
3.1. Influence of Water Curtain Gallery Drainage on the Seepage Field

Unlike the formal operation stage when the water curtain gallery is filled with water, in the construction phase, the surfaces of water curtain galleries can be considered as drainage boundaries for seepage analysis. Four kinds of hydro-geological tests mentioned in the foregoing, except for the overall efficiency test of the water curtain, are performed and completed in the situation that the water curtain gallery is an effective drainage boundary. The common phenomenon observed during these tests is that the hydrostatic pressure in water curtain boreholes, which is less than the hydrostatic pressure corresponding to the original natural groundwater level at the elevation of the water curtain system, may be very low or even approximate zero. Such a phenomenon is apparently caused by the drainage from the water curtain gallery. For example, if a fracture lies between a water curtain borehole and the side wall of the gallery, the hydraulic connectivity between this borehole and gallery will greatly increase, resulting in the hydrostatic pressure in the tested borehole dissipating to almost zero. However, in the overall efficiency test of the water curtain system, the galleries and boreholes are all filled with water, and the water injection pressure in the boreholes is easily maintained at the prescribed value (e.g., the design value of 300 kPa for Huangdao project). In this situation, the change in the seepage field induced by transient gallery drainage will be eliminated after a certain period of time, and the seepage field could gradually recover to approximately that of the nature condition. In short, the boundary conditions for different hydraulic tests need to be carefully considered in seepage analysis. Thus, it is necessary to examine the influence of gallery drainage on the seepage field prior to presenting a method that utilizes hydro-geological test data of water curtain boreholes.
In the field of groundwater dynamics, many analytical formulae for interpreting wellbore hydraulic tests were established based on idealized boundary conditions. For example, the basic assumption made in the formulae for calculating hydraulic conductivity, derived from the water injection test, is that the water flows purely along the radial direction within an unbounded domain (i.e., the axial flow is neglected), which is similar to the situation of water flow in a confined aquifer [47]. This assumption is, however, too idealized to be applicable for practical analysis. Rehbinder [48] indicated that the mathematical difficulties associated with interpreting hydraulic test results stem from the facts that the solution is of three dimensions and that these tests have mixed rather than ideal boundary conditions. When the water curtain gallery is an available drainage outlet, the groundwater in the vicinity of water curtain boreholes would preferentially discharge to the galleries, which may affect the water flow direction within the borehole, making it not perpendicular to the borehole axis. Therefore, a question is beginning to emerge: is it reasonable to use the existing formulae developed for the wellbore test, which often provides an analytic solution and has strict requirements for boundary conditions, to analyze the equivalent hydraulic conductivity of rocks surrounding water curtain boreholes? To address this question, 2-D and 3-D numerical simulations were carried out to investigate the impact of gallery drainage on the seepage field around the borehole periphery.
As shown in Figure 1, a representative cross-section, in parallel to a cavern (i.e., perpendicular to the water curtain gallery) in the middle of the cavern zone, was selected to conduct 2-D finite element modeling. The model was constructed in line with the design scheme of the Huangdao project, where the elevation of the water curtain boreholes is 5 m. Based on the symmetric principle, two lateral boundaries of the model are impermeable. The very bottom of the model is set as the boundary with a constant hydraulic head of 35 m, which is equivalent to the long-term stable groundwater level. The conductivity of the host rock (granite) was assigned a representative value of 5 × 10⁻⁹ m/s, and the pressure in boreholes was set to be 300 kPa. It is of note that the fluctuation of the water level induced by natural rainfall would not have an obvious effect on the water pressure in the rock mass located above the caverns due to the isolation function of the water curtain system. Therefore, the recharge from rainfall was not considered here. The numerical analysis was performed using the equivalent porous medium method and the results are presented in Figure 1. Before the excavation of the water curtain gallery, the water pressure in natural rock masses is equal to the hydrostatic pressure, and the water head distribution is consistent throughout the model. When the excavation of the water curtain gallery is completed, a drainage boundary with a constant pressure of zero is formed and the water flows into the gallery, leading to a notable change of the water pressure distribution, as shown in Figure 1.
As the water curtain boreholes are parallel to the caverns and perpendicular to the water curtain galleries, the influence of gallery drainage on the seepage field in the vicinity of boreholes can be presented if the studied 2-D model section is perpendicular to the galleries, as shown in Figure 1. However, such a kind of 2-D section cannot reflect the influence of the caverns. If, on the other hand, the modeled 2-D section is set as perpendicular to the boreholes and caverns to incorporate the influences from the caverns, the effect of gallery drainage cannot be taken into account because the model section is parallel to the galleries. To avoid this issue induced by 2-D modeling, a 3-D FEM-based equivalent porous medium flow model [14] was established, which includes three storage caverns (labeled as the number 4, 5, and 6 cavern in the Huangdao project, respectively), as shown in Figure 2. The elevation of the caverns is between −20 m and −50 m while that for the water curtain boreholes is 5 m. The top of the model was set at the ground elevation while the elevation of the model bottom was −200 m, and the model has a width of 200 m considering that the length of the water curtain borehole on each side of the water curtain gallery is about 100 m. During the construction period, the water pressure on the boundaries of the galleries and caverns all equal zero, and the water injection pressure in the boreholes is 300 kPa. The boundary condition for the very bottom of the 3-D model as well as the hydraulic conductivity of rock masses are the same as those used in the 2-D model. Likewise, the rainfall effect is not considered, and the four lateral sides of the model are all set as impermeable based on the symmetric principle.
It should be noted that if the numerical model involves the cavern located at either end of a cavern group, there is, in fact, water flow transfer between this cavern and the boundaries of the model. In this case, the lateral boundaries of the model cannot be considered as impermeable. Besides, although the surrounding rock mass, a crystalline granite, has relatively high intactness, discontinuities, such as faults, joints, and densely fractured zones, still exist; therefore, the seepage field is significantly affected by discontinuity conditions.
Figure 3 shows the distribution of the water pressure in two parallel cross-sections selected along the axial direction of the water curtain borehole, referred to as Section 1 and Section 2. Section 1 passes right through the axis of a borehole while Section 2 lies in the middle of two neighboring boreholes. It is clear that the distribution of water pressure is affected by the gallery drainage, and this influence is more profound in the region that is closer to the gallery. Figure 4 illustrates the velocity vectors of water flow in the vicinity of a borehole. It can be seen that most of the flow velocity vectors are orthogonal to the axial direction of the borehole, but the velocity vectors near the intersection between the borehole and the gallery deviate from being perpendicular to the borehole axis and incline towards the side wall of the gallery. Furthermore, the magnitude of flow velocity increases as the rock gets closer to the gallery. Overall, the increase of the flow velocity is in evidence within 20 m of the water curtain gallery, with the flow direction inclining increasingly towards the gallery.
The variation of the water pressure in the rock mass with the distance to the gallery is indicated in Figure 5, where curve 1 represents the sites right on the borehole axis (i.e., on Section 1) while curve 2 represent the sites that have the same elevation as the borehole axis on Section 2. It is seen from curve 1 of Figure 5 that the water pressure within the water curtain borehole has a constant value of 300 kPa and is not affected by gallery drainage, whereas the water pressure of the rock masses in the middle of two neighboring boreholes is obviously influenced by gallery drainage, as shown by curve 2. The water pressure is about 0.27 MPa at a position that is 20 m away from the gallery, and gradually decreases as it approaches the gallery. Figure 5 shows that the difference between two selected water pressure profiles (represented by curves 1 and 2) gradually decreases as the distance from the gallery increases. Based on the numerical results above, it can be inferred that the effect of water curtain gallery drainage on the hydraulic test cannot be neglected, given the fact that most hydro-geological tests are implemented in the construction stage when the water curtain gallery is an effective drainage boundary.

3.2. Method of Estimating Hydraulic Conductivity from Steady Water Injection Test Data

The hydraulic conductivity of the surrounding rocks can be estimated by analyzing plenty of the flow rate and pressure data obtained from steady water-injection tests conducted in all water curtain boreholes. Water injection tests, such as the Lugeon test, are commonly performed using pneumatic packers to isolate a section of the borehole for water injection and hence are also termed packer tests [49]. In most cases, the test is conducted in a portion of a borehole isolated by two packers (straddle packers). The Chinese industry standard entitled ‘Code of water pressure test in borehole for hydropower and water resources engineering’ (DL/T 5331-2005) suggests that the isolated portion of the borehole in the water injection test should be around 5 m in length [50].
Unlike packer tests, the steady water injection test is carried out in an entire borehole. For example, the steady water injection tests for the Huangdao project were conducted in approximately 100-m-long water curtain boreholes, and in this case, the obtained hydraulic conductivity value represents the average or equivalent hydraulic conductivity of the 100-m-long section of rock mass. Despite being somewhat long compared with the isolated portion of a borehole in conventional packer tests, a 100-m-long water curtain borehole and its adjacent rocks only represents a very small area of the host rocks of the storage cavern zone. In this sense, it is reasonable to assume that the peripheral rock of each water curtain borehole is a homogeneous body with a unique hydraulic conductivity. In this way, the issue on the spatial variation in hydraulic conductivity of the whole host rock is simplified into the determination of the equivalent hydraulic conductivity for each of these homogeneous rock units.
In the following, a method of back-calculating the equivalent rock permeability peripheral to each water curtain borehole from the water injection rate is presented. This method is developed by establishing the relationship between the hydraulic conductivity of rock mass and the flow rate in the tested borehole through equivalent porous flow analysis. First, a finite element (FE) model of the 2-D cross-section perpendicular to the water curtain boreholes was constructed. The configuration and geometry parameters of the boreholes and the cavern employed in the model are in compliance with the practical design scheme. Due to the symmetry principle, two sides of the model were set as impermeable. The very bottom of the model was set as the boundary with a constant hydraulic head of 35 m. During the construction period, the water pressure on the boundaries of the storage caverns is zero, and the water injection pressure in the water curtain boreholes is 300 kPa. The hydraulic conductivity of rock mass is specified as 2 × 10⁻⁹ m/s. The results of the numerical analysis are presented in Figure 6. It is seen that under the ideal conditions (i.e., the rock mass is assumed as isotropic, and the lateral boundaries of the model are set as impermeable for the case of the model not being located on the boundary region of the cavern group), the streamlines are nearly vertically distributed and all the water flows into the caverns, with the water beneath the cavern flowing towards the cavern base. Given that the 2-D model cannot consider the effect of gallery drainage on the seepage field in the construction stage, a 3-D FE model shown in Figure 2 was established for numerical analysis. The employed boundary conditions are the same with those of the 3-D model constructed in Section 3.1, and the hydraulic conductivity of the rock mass was specified to be 2 × 10⁻⁹ m/s. The water pressure distributions after cavern excavation are illustrated in Figure 7 and Figure 8, which show an evident decrease in water pressure in the nearby zone of the water curtain gallery.
The 3-D simulation results indicate that at a specified hydraulic conductivity value of 2 × 10⁻⁹ m/s, the average water injection rate in a single borehole was 4.60 × 10⁻⁶ m3/s after the cavern excavation was completed. Based on large-scale performance tests in the LPG storage cavern, Lindblom [51] indicated that the water curtain pressure exerts only a marginal effect on the water inflow into the caverns and that there is a linear relationship between the water curtain pressure and the discharge from the water curtain system. Assuming that the fluid flow in the tested water curtain borehole follows Darcy law, a linear relationship exists between the water injection pressure and the borehole discharge for each borehole in the water certain system. It follows that an empirical formula like Equation (1) can be established to relate the borehole discharge with the hydraulic conductivity of rock mass peripheral to the borehole:
k = Q L a
where Q is the water injection rate (borehole discharge) (m3/s); k is the isotropic equivalent rock hydraulic conductivity around the borehole periphery (m/s); L is the borehole length (expressed in meters, m); and a represents the coefficient of proportionality and its value is affected by many factors, including the influence of gallery drainage during the construction period, borehole spacing, elevation difference between the cavern and water curtain system, natural groundwater level, and water injection pressure of the borehole.
Unlike the conventional formula developed based on Darcian flow, the term hydraulic gradient (or head difference between the water injection pressure of the borehole and natural ground water level) is not explicitly present in Equation (1) but is implicitly in coefficient a. The main reason for this is based on two considerations. The first one is that, once the design scheme for a practical storage cavern project is finalized, the water injection pressure of a water curtain borehole (or hydraulic gradient) is fixed; therefore, we opted not to present the hydraulic gradient in Equation (1) in the form of an independent variable. Second, and more importantly, the coefficient a was found to be almost but not perfectly linear proportional with the hydraulic gradient. Hence, coefficient a was not directly expressed as the product of the hydraulic gradient and another coefficient.
Two basic premises underlying Equation (1) are that the water flow in the rock mass can be simplified into a stable Darcian flow and that the water injection pressures in neighboring boreholes are similar. When the water injection pressure of different boreholes is obviously inconsistent or differs significantly from the specified injection pressure of 0.3 MPa, the proportional coefficient a needs to be re-fitted. The empirical Equation (1) has a very simple format and its significance lies in two aspects: (a) if the peripheral zone of influence for each borehole is defined as an area with a width of 10 m (i.e., half of the borehole spacing), a length of approximately 100 m (i.e., borehole length), and a height equivalent to the elevation difference between the cavern roof and the borehole, such a zone is indeed small in comparison with the whole caverns zone and hence can be regarded as an equivalent-continuum body. Then, the hydraulic conductivity of each of these equivalent-continuum bodies (i.e., the peripheral rock of each water curtain borehole) can be back-calculated from the measured borehole discharge Q using Equation (1) and a known a value, and on this basis, it is possible to obtain a zoning map of the hydraulic conductivity of the whole host rocks according to plenty of back-calculated k values. (b) The numerical derivation of Equation (1) takes full account of the influence of gallery drainage during the construction period and other factors in 3-D scale. Obviously, if a simplified or idealized hydrodynamic analytic method that ignores the influence from water curtain gallery drainage is employed to carry out seepage analysis, it will lead to unreasonable results.
Equation (1) shows that the borehole discharge is proportional to the rock hydraulic conductivity around the borehole periphery, even though the borehole discharge is affected by many factors. It is interesting to compare Equation (1) with the following Equation (2) reported by Lindblom [51]. In Equation (2), the discharge from the water curtain system, qwc, is proportional to the difference between the applied hydraulic potential in the water curtain system, hwc, and the hydraulic head of the natural groundwater, hw:
q w c = F c k ( h w c h w )
where Fc is a constant representing geometrical factor. It is of note that the coefficient of proportionality a in Equation (1) and constant geometrical factor Fc in Equation (2) are essentially similar and both of them reflect the complexity and uncertainty of the relationship between the borehole discharge and rock hydraulic conductivity.
Based on the obtained water injection rates from numerical simulation, the proportional coefficient, a, is calculated and equals 20.2 after completing the excavation of the upper bench of the cavern while it is equal to 21.5 in the situation that the entire cavern excavation is finished. Using these a values, the equivalent rock hydraulic conductivity around the periphery of each borehole could be determined based on the injection rate of each of the water curtain boreholes measured in the steady water-injection test. In addition, it is worth mentioning that as per the Chinese standard “code for design of underground oil storage in rock caverns (GB 50455-2008)” [23], the water inflow rate per one million cubic meters of cavern should not exceed 100 m3/d. Based on numerical study and Equation (1), this requirement can be met as long as the average hydraulic conductivity of the host rock masses is less than 6.6 × 10⁻⁹ m/s.

3.3. Influence of the Rock Fracture Configuration on the Equivalent Hydraulic Conductivity

During the process of the steady water-injection test, it may be observed that the water injection rates in some water curtain boreholes are abnormally large while a sudden drop in the water pressures can be detected for some boreholes. These phenomena imply a very high hydraulic connectivity in the nearby area of these boreholes and are primarily caused by the presence of rock fractures. In this section, a 2-D fractured porous flow model [52] was used to study the causes for these phenomena. Five representative simplified conceptual models were established and are shown in Figure 9, each with different fracture configurations. Each model has an area of 30 m × 50 m and includes three water curtain boreholes in its middle. As illustrated in Figure 9, the simulated rock fracture conditions are distinct between five models in terms of the interconnectivity of fractures or the intersection of fractures with boreholes. The upper and lower sides of the model are far away from the boreholes and hence can be regarded as boundaries with a constant water head. As per the symmetry principle, the left and right sides of the model are set as impermeable. The water-injection pressure head in the boreholes was 60 m and the pressure heads of the upper and lower boundaries were 30 m.
Based on the experiences gained from field investigation, the fracture aperture was specified as 0.05 mm, and the hydraulic conductivity of the fractures was obtained according to the ‘cubic law’. The hydraulic conductivity of the rock blocks (i.e., rock matrix) was specified as 1 × 10⁻¹⁰ m/s. The calculated result for the injection rate in each of the boreholes is provided in Table 1. Considering that the model boundary condition and the fracture configuration have a more significant influence on the water flow in the vicinity of boreholes 1 and 3 than on that in the vicinity of borehole 2, only the equivalent hydraulic conductivity of rock nearby the middle borehole 2 is calculated and listed in Table 1.
In model 1, there is a horizontal fracture passing through all of three boreholes. However, this fracture is not connected with the upper and lower model boundaries; thus, the water injected into the boreholes is not able to flow through this fracture to the upper and lower permeable boundaries. In this case, the facture cannot serve as an effective path for preferential flow and the water injection rate in the boreholes was very small. As a result, the calculated hydraulic conductivity of rock near borehole 2 is close to the prescribed hydraulic conductivity of the rock matrix. In model 2, due to the fact that the fracture connects with the upper and lower permeable boundaries, the water injection rate in borehole 2 as well as the hydraulic conductivity increase significantly. The water injection rate of borehole 2 in model 3 is identical to that in model 2, whereas there is a noticeable increase in the water injection rate of boreholes 1 and 3 in model 3. This arises because there is a horizontal fracture that links borehole 1 with borehole 3 and hence the water injected into boreholes 1 and 3 can flow through this fracture and then via another oblique fracture (see Figure 9c) to the upper and lower permeable boundaries of the model. In terms of model 4, the flow rate of borehole 2 is the same as those in models 2 and 3, but borehole 3 has a larger injection rate than borehole 1 as the water flow in this borehole can reach the upper and lower permeable boundaries via borehole 2. As for model 5, due to the existence of many stochastic fractures, the flow rate in each of the three boreholes increases significantly together with an increase in the hydraulic conductivity of the rocks surrounding the three boreholes.
These results indicate that the interconnection status between the fractures, boreholes, and permeable boundaries is the fundamental reason accounting for the drastic variation in the water injection rates of boreholes. As indicated in Table 1, when rock fractures are isolated from permeable boundaries, the back-calculated equivalent hydraulic conductivity of rock mass nearby the borehole is close to the hydraulic conductivity of rock blocks (i.e., approximate 1 × 10⁻¹⁰ m/s). On the contrary, when rock fractures effectively connect with permeable boundaries and boreholes, the water injection rate will increase by two orders of magnitude. If a borehole was linked to another one or permeable boundaries via rock fractures, the water injection rate of the borehole, along with the hydraulic conductivity in the borehole vicinity, can considerably increase.

4. Application of the Proposed Method to Assess Hydraulic Conductivity

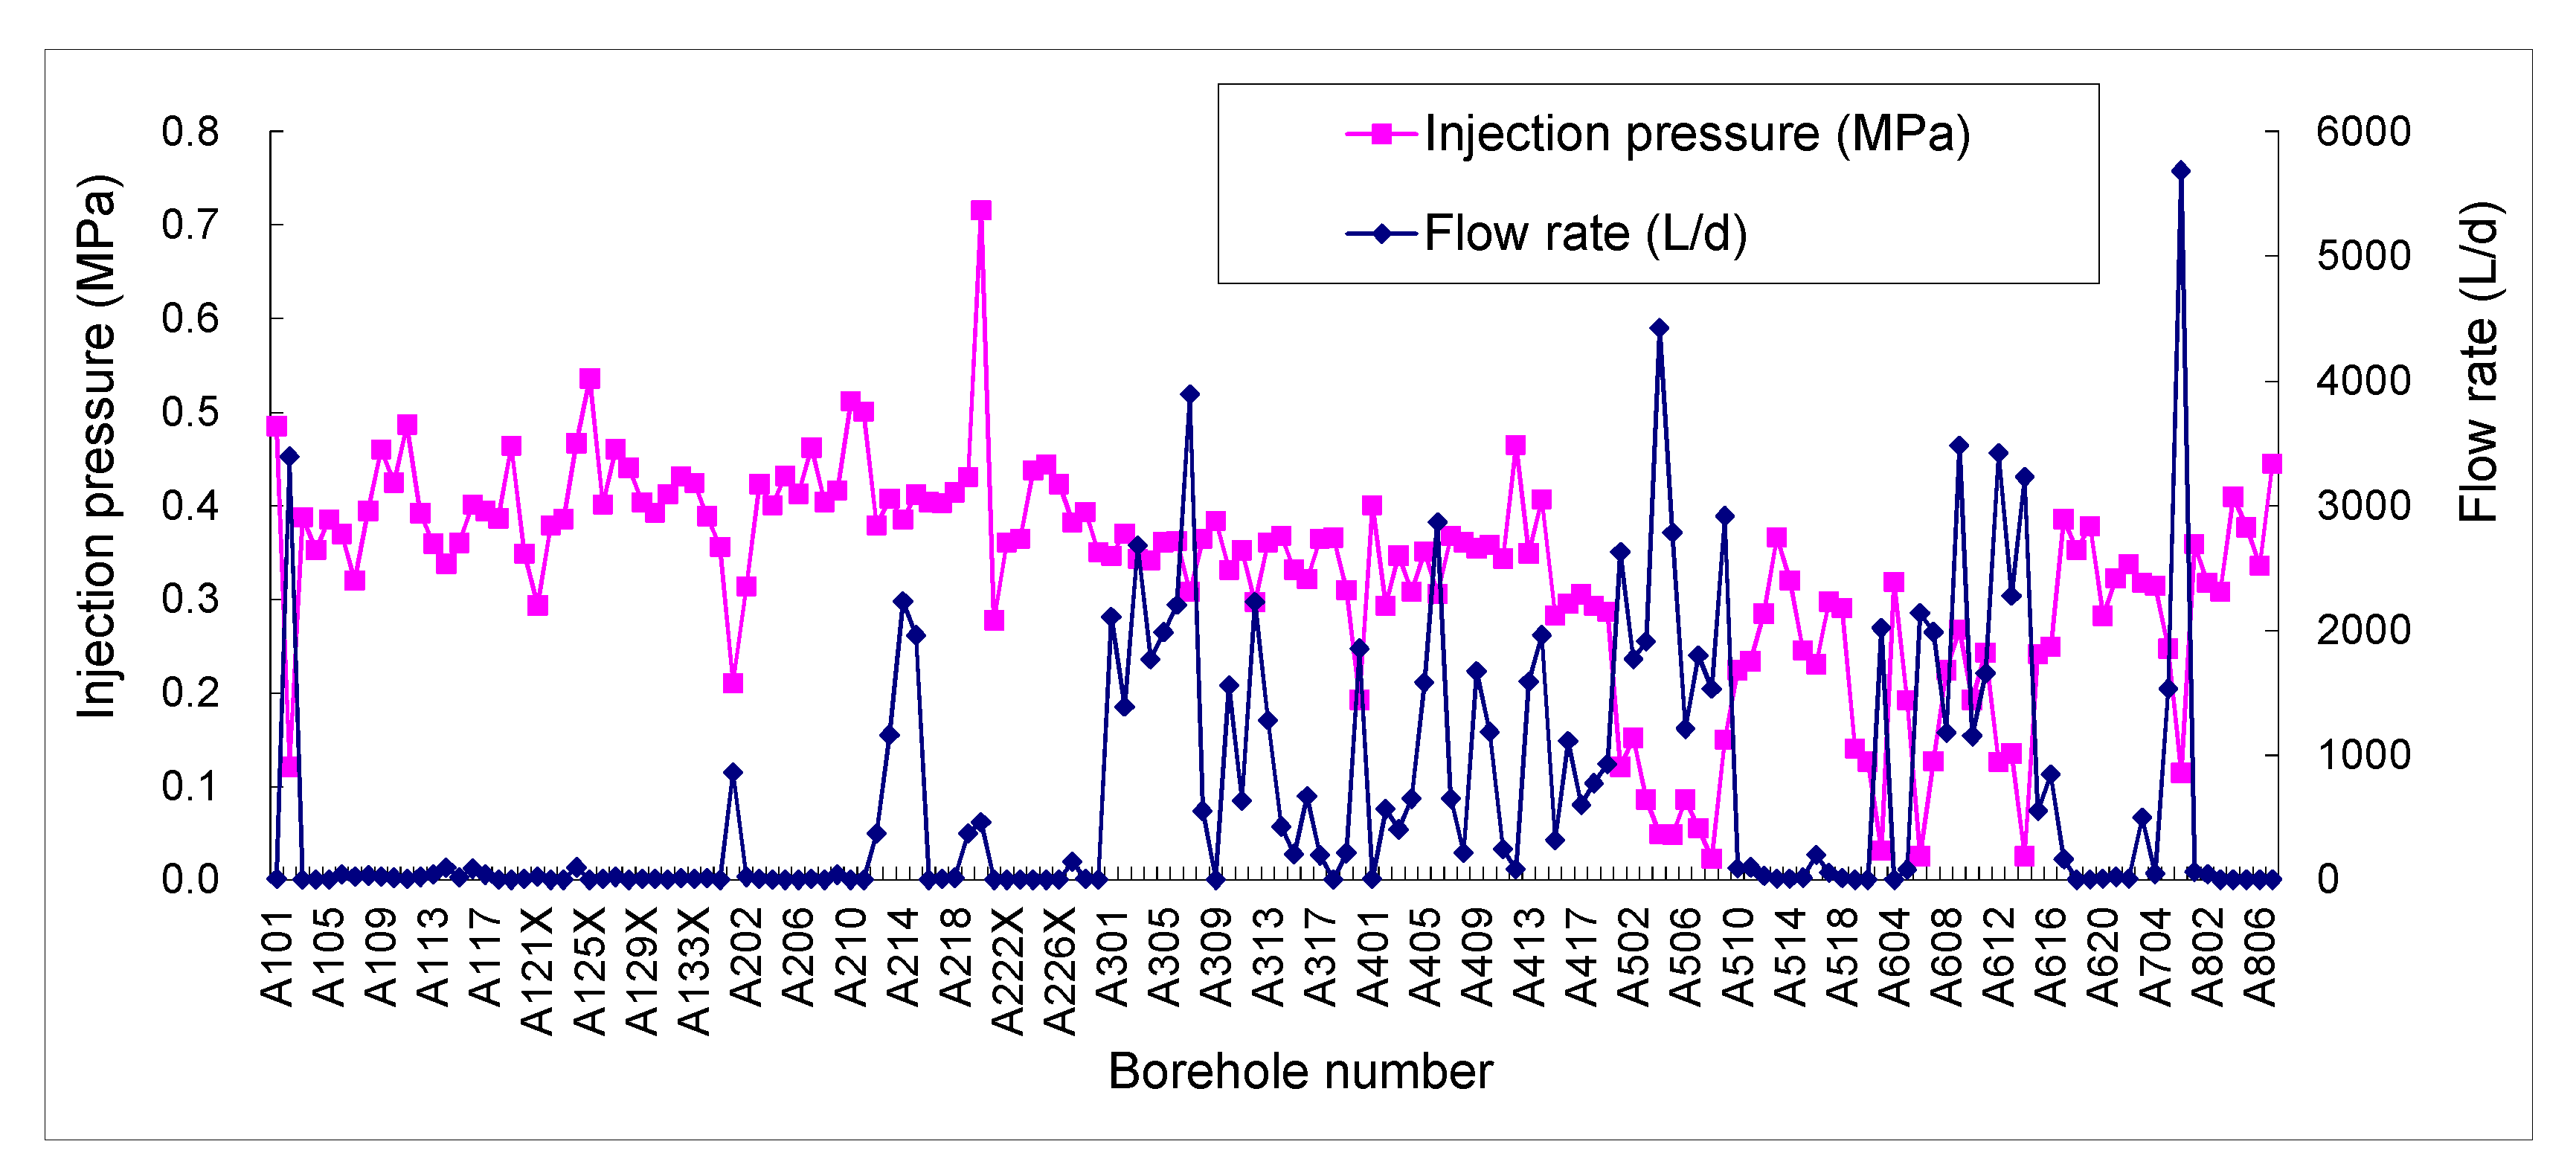
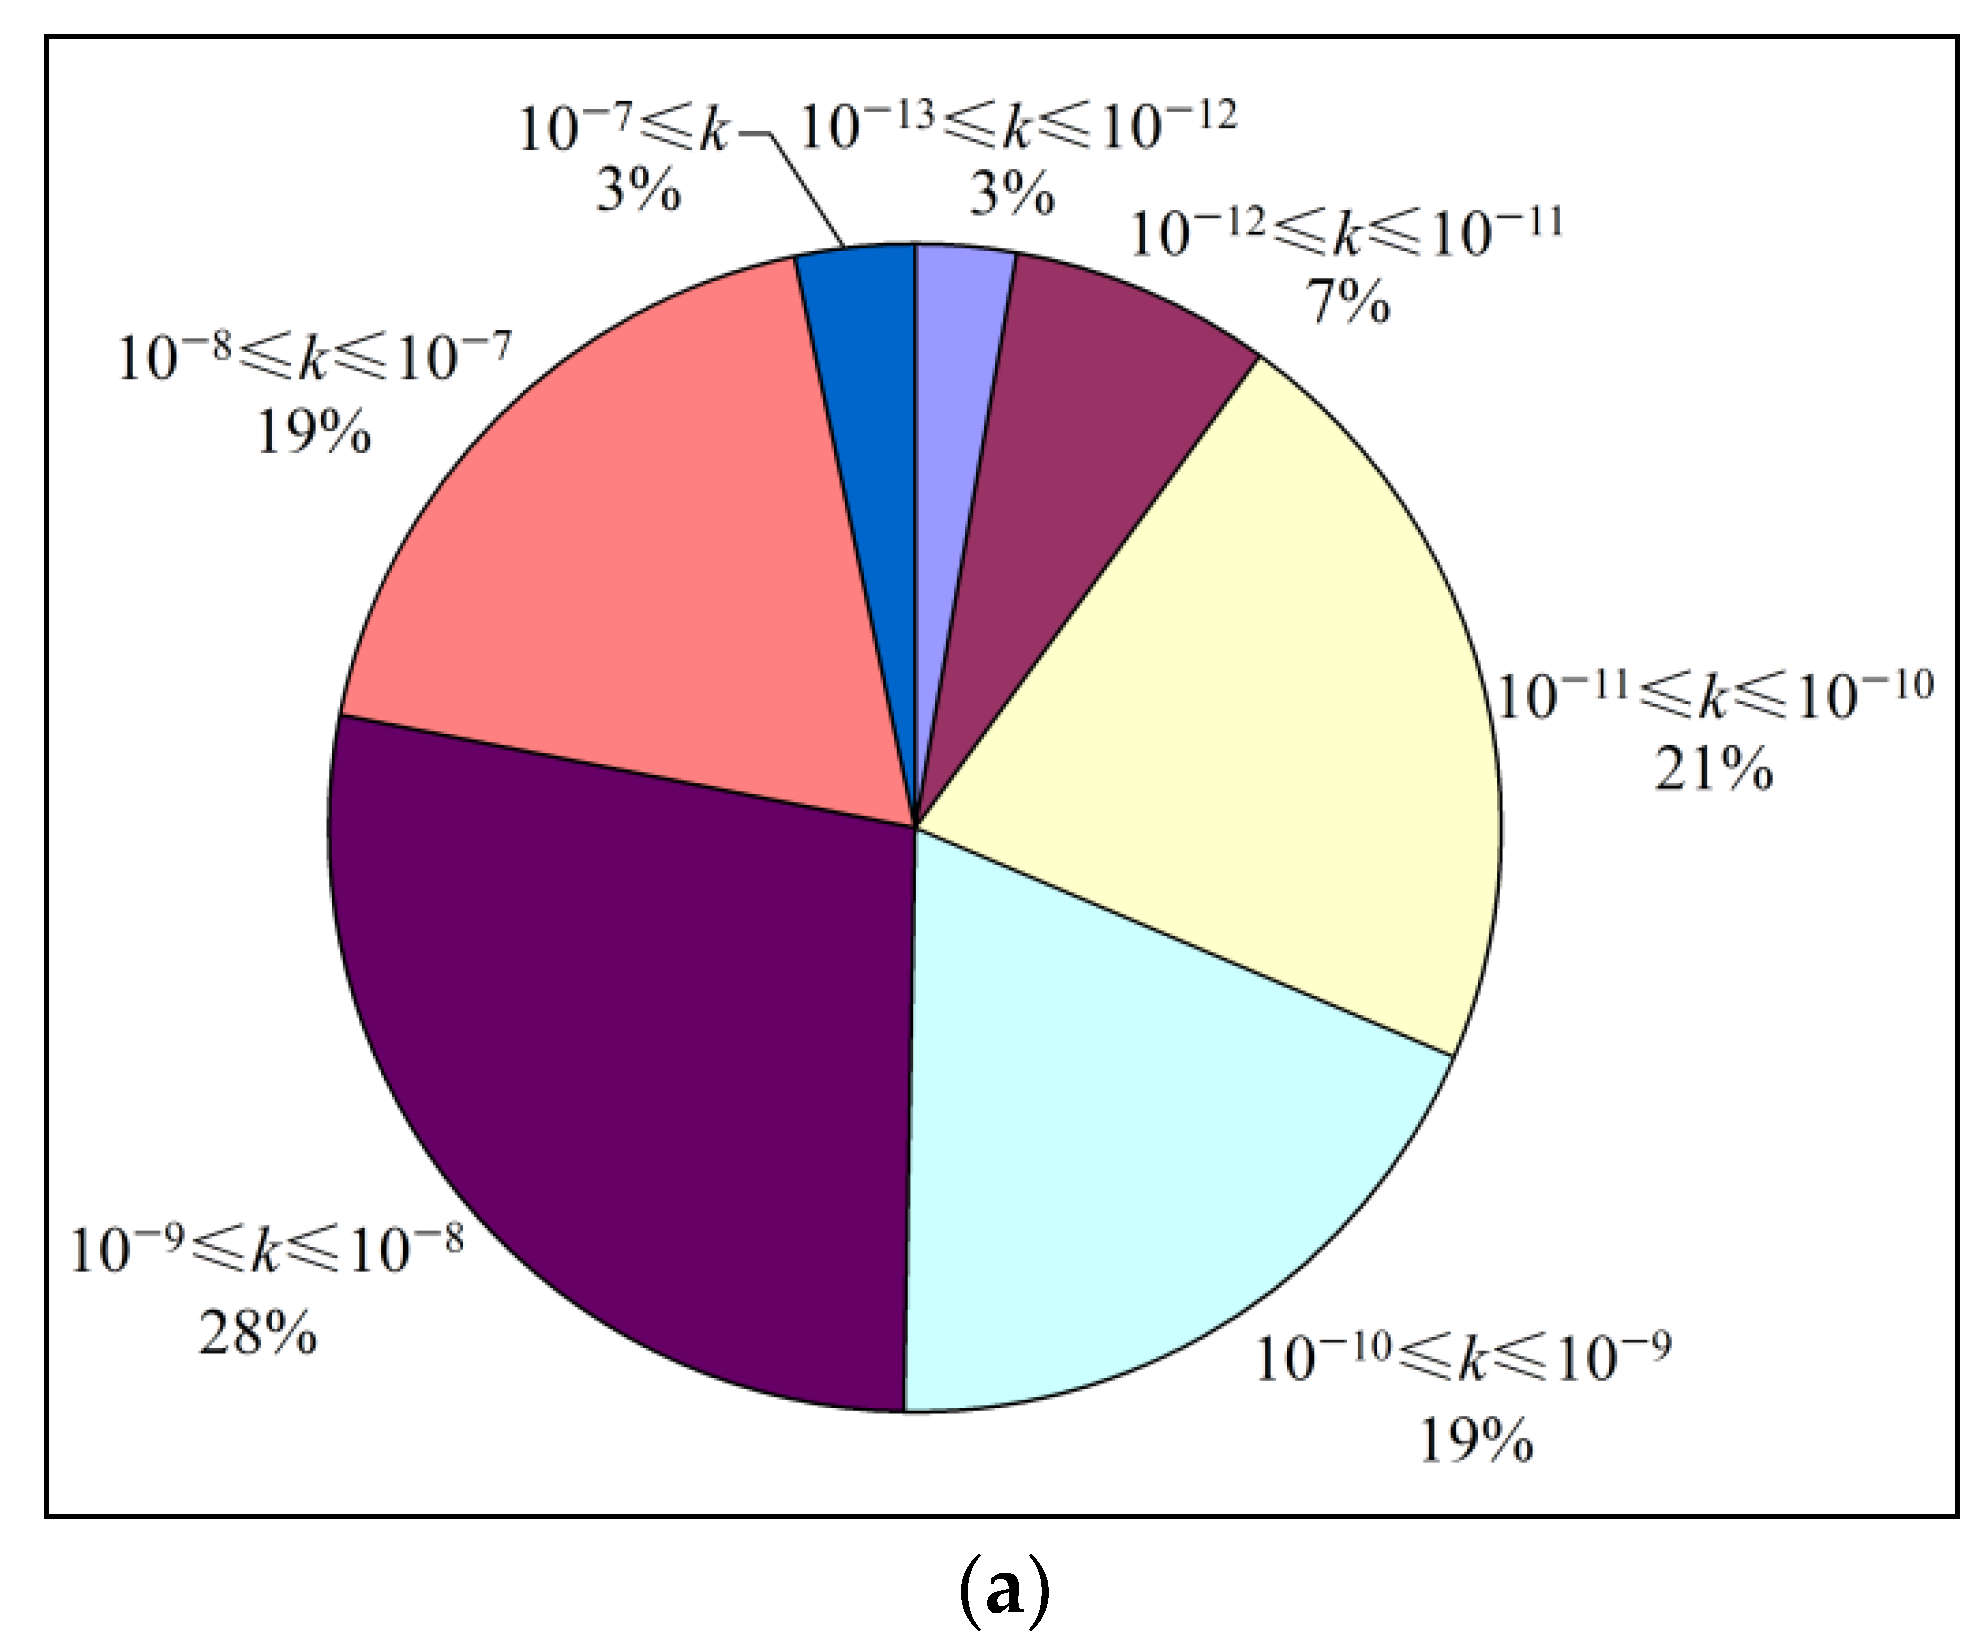
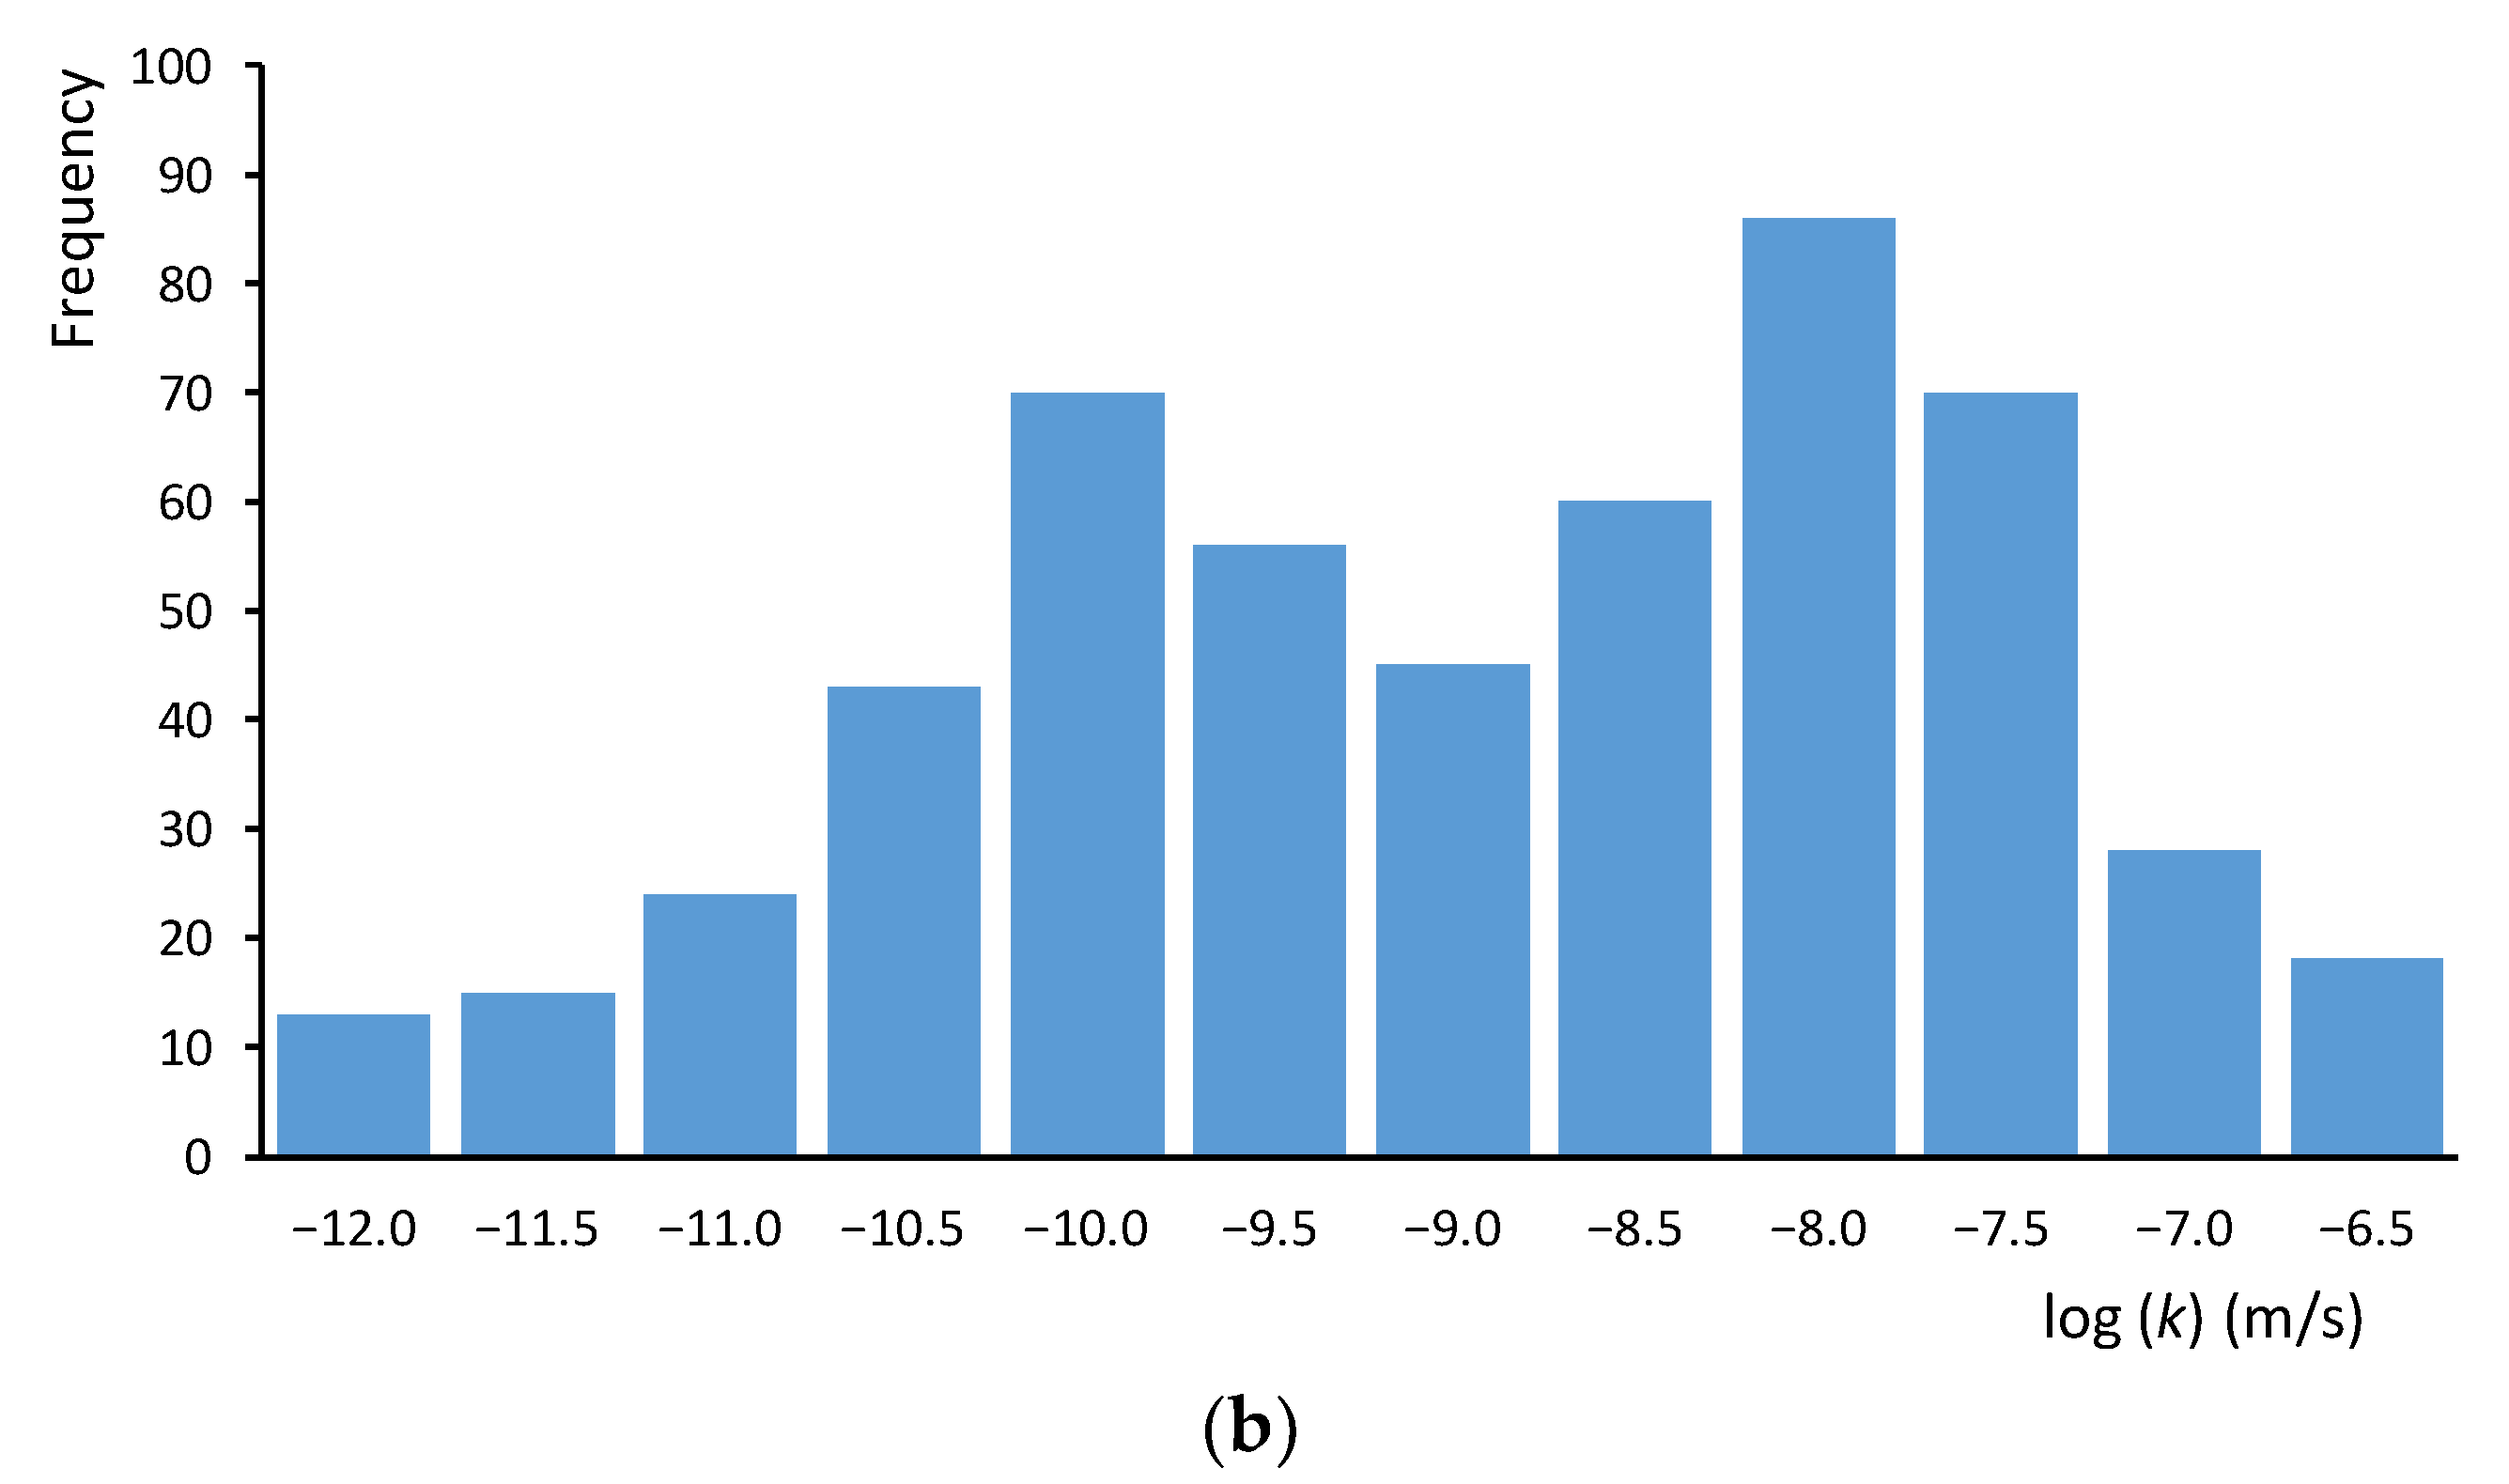
4.1. Statistical Analysis of Water Injection Test Data

For the Huangdao project, the steady water injection tests were performed on a total of 529 water curtain boreholes from July 2012 to December 2012, and these data were statistically analyzed, as shown in Figure 10 (noting that only part of the test data are presented due to space limitation). Figure 10 indicates that the water injection pressure in a vast majority of the boreholes was maintained between 0.3 and 0.4 MPa. However, a small number of boreholes have higher water injection rates and lower water pressure, indicating that the hydraulic conductivity in the nearby area of these boreholes is very high.
The maximum flow rate measured in a single borehole was 9 m3/d while the minimum flow rate was less than 0.0001 m3/d. The total injection rate for all of 529 water curtain boreholes was 431.12 m3/d. The layout of the storage caverns is shown in Figure 11, where the whole area is divided into three zones along the direction of the cavern axis (i.e., Zone A to Zone C) and into eight partitions along the direction perpendicular to the cavern axis (i.e., P-1 to P-8). Statistical analysis indicates that the water injection rate of the borehole can be roughly divided into three levels: high, medium, and low. The water injection rates in subzones C7 and C8 (note that C7 denotes the overlapping region between Zone C and P-7 and C8 refers to the overlapping region between Zone C and P-8, and so forth) are at a high level while the subzones A3, A4, A6, B2 to B5, B7, C5, C6, and some boreholes in subzone A5 are all at a medium level, with the injection rates for the rest of the boreholes at a low level.

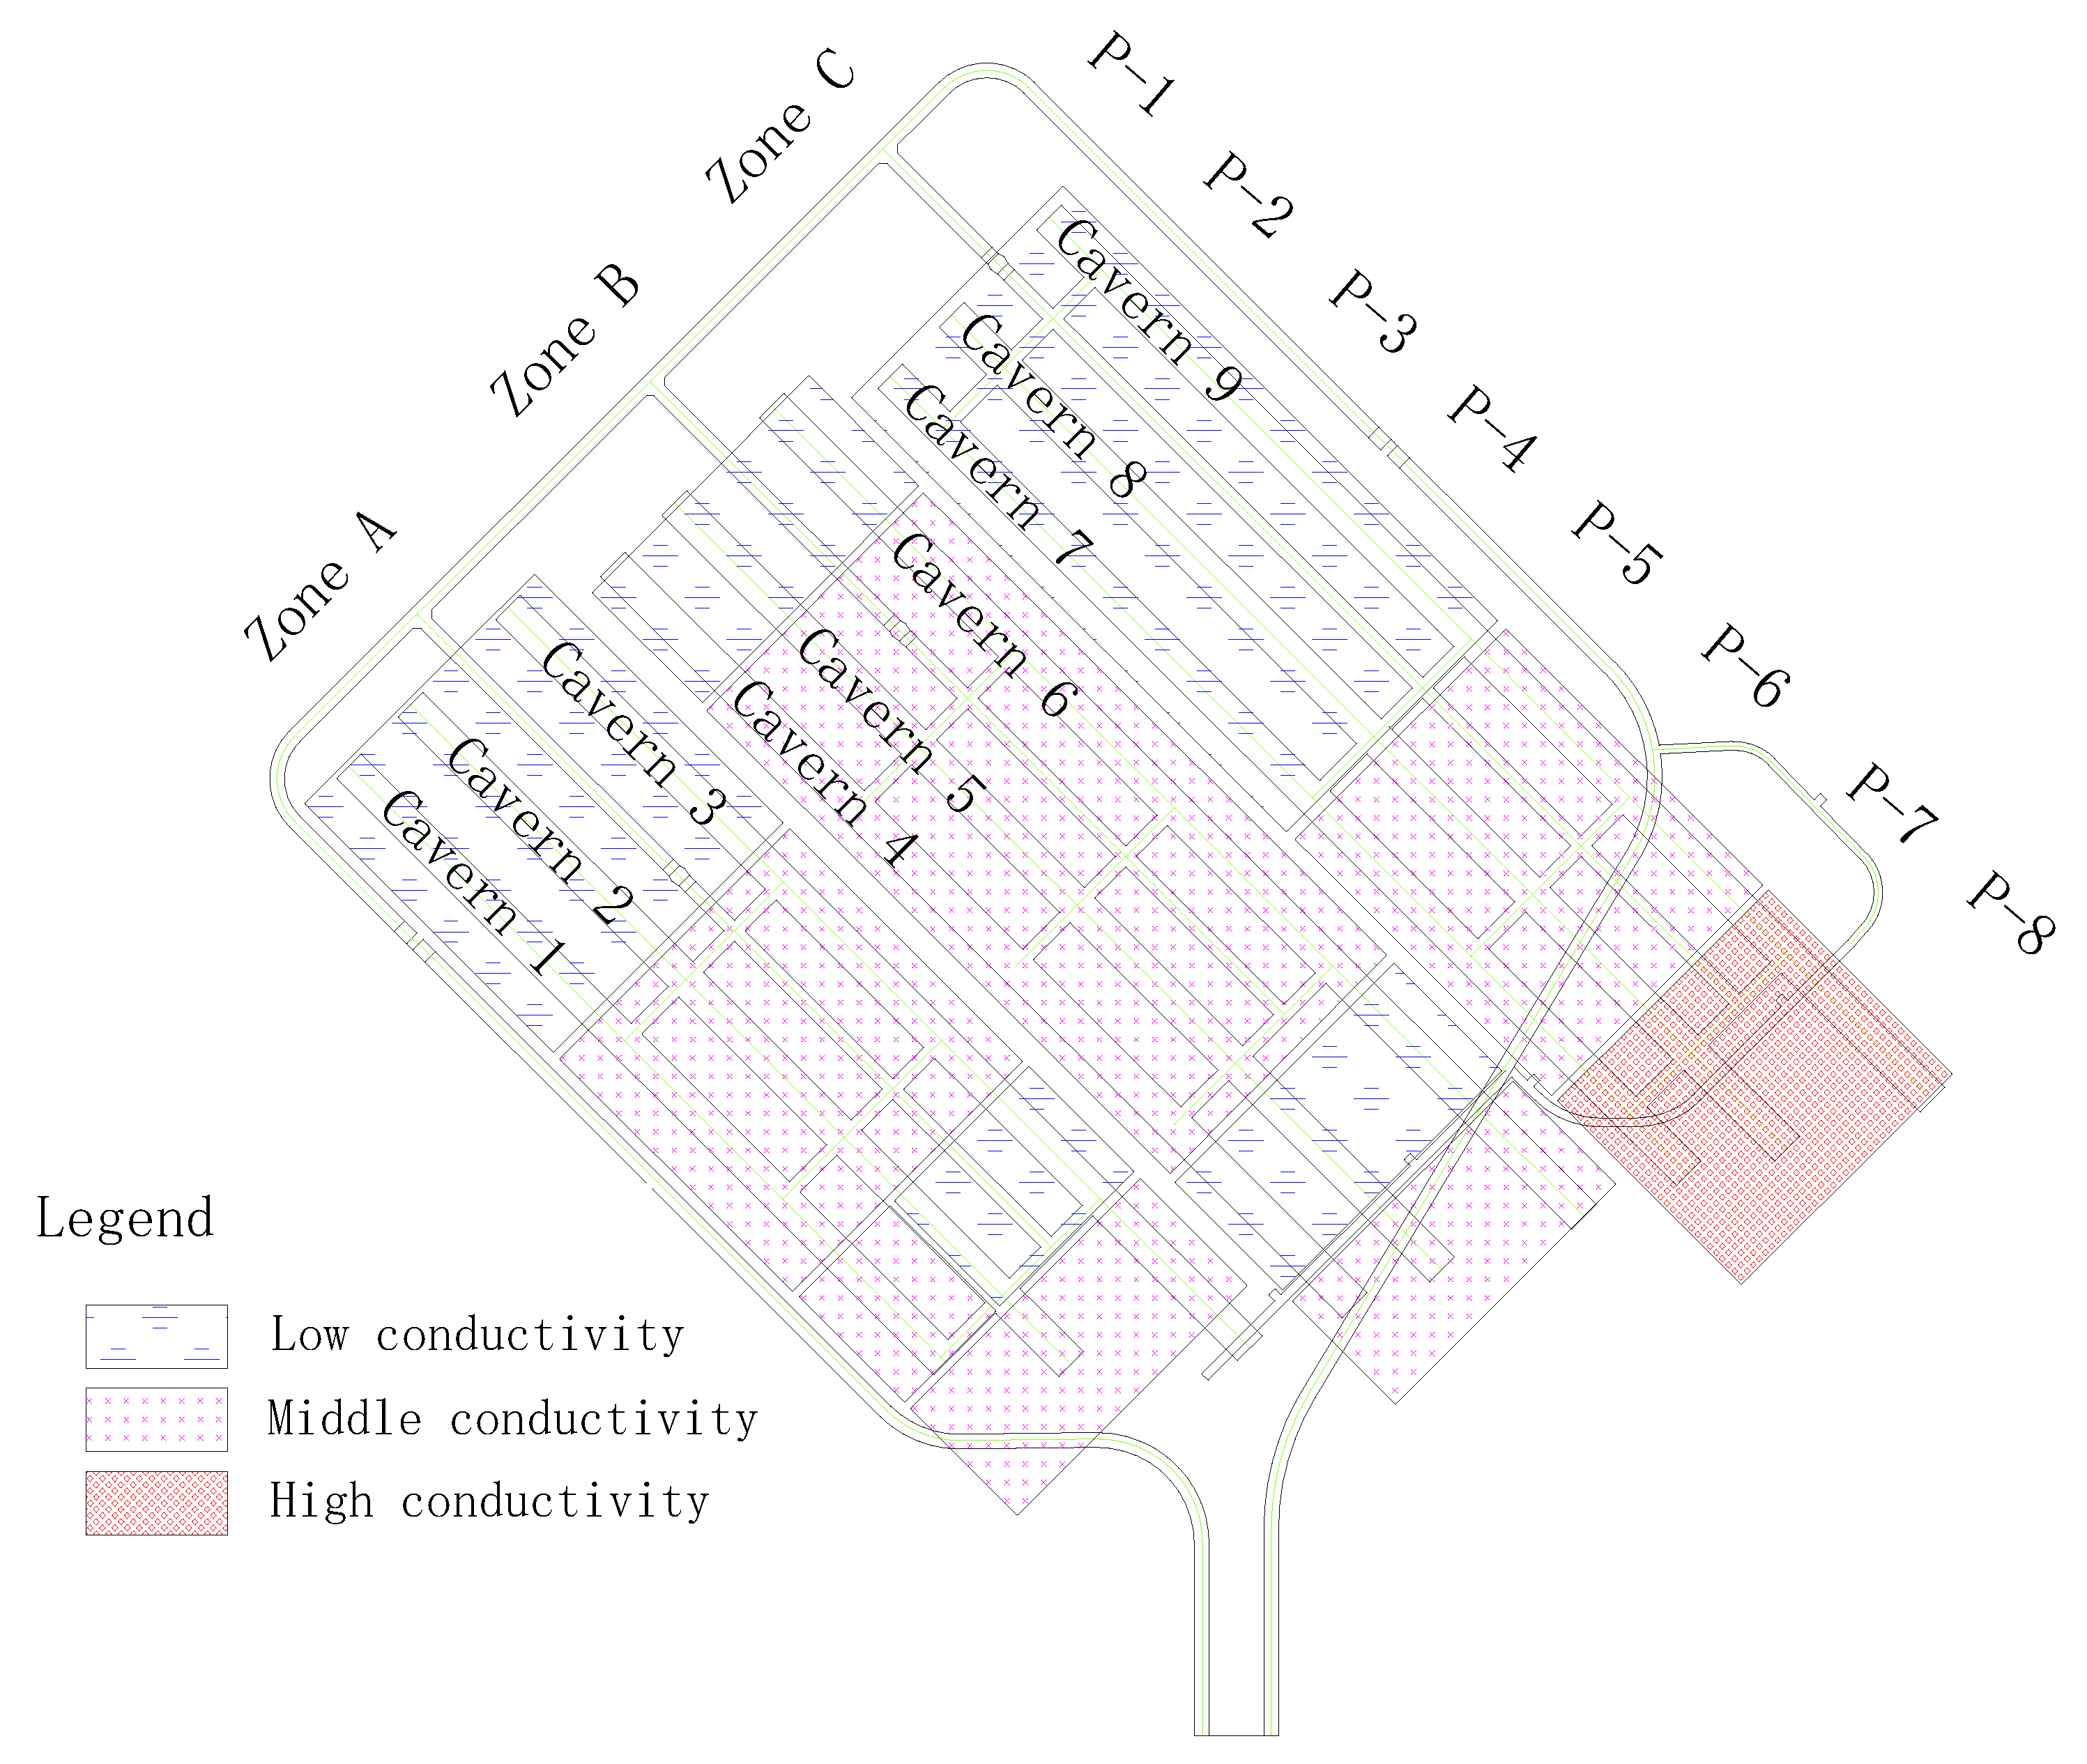
4.2. Assessment of the Hydraulic Conductivity of Host Rocks

Using the numerically derived empirical Equation (1), the hydraulic conductivity of rock mass peripheral to each water curtain borehole can be back-calculated from the measured water injection rate in the borehole. Considering that the cavern excavation was nearly completed during the water injection testing (observation) period, the parameter a in Equation (1) takes the value of 21.5 (see Section 3.2). The results from a statistical analysis of the computed equivalent hydraulic conductivity values are shown in Figure 12. On this basis, a zoning map of hydraulic conductivity is obtained, as shown in Figure 11.
Statistics show that the arithmetic mean value of the equivalent hydraulic conductivity of the host rock around water curtain boreholes is 1.52 × 10⁻⁸ m/s with a variance of 2.85 × 10⁻¹⁵ m/s. The peripheral rocks for 87% of the boreholes have hydraulic conductivity values ranging from 1.0 × 10⁻¹¹ to 1.0 × 10⁻⁷ m/s while the hydraulic conductivities of peripheral rocks of 3% of the boreholes are more than 1.0 × 10⁻⁷ m/s with those of the remaining 10% of the boreholes less than 1.0 × 10⁻¹¹ m/s. Figure 12b indicates that the log10 k follows a bimodal distribution and the two modes (i.e., order of magnitude of k that occurs most frequently) are −10 and −8, respectively. As shown in Figure 6a, when all the boreholes were simultaneously supplied with water during the testing and observation period, the direction of the water flow velocity is approximately vertical. Therefore, the obtained equivalent hydraulic conductivity mainly represents the permeability of the rock mass in the vertical direction.
After acquiring the above results, it is then necessary to compare the zoning map of rock hydraulic conductivity with the geological information on the distribution of geological defects (e.g., faults, fold, large-scale discontinuities, densely fractured zone, and others), and to investigate the linkage between the zones of high-level hydraulic conductivity and geological defects. Besides, the connectivity of the fractures is also quite important and can be determined through cross-hole pumping or injection tests. All these investigations lead to a further determination of the high-permeability zones that require grouting or other seepage-control measures for the purpose of reducing excessive water inflow of storage caverns.

5. Conclusions and Further Work

The underground water-sealed storage cavern project has a higher demand for accurate determination of the flow rate, which relies upon reasonable estimation of the rock hydraulic conductivity. For such a kind of rock cavern project, hydro-geological test data of water curtain boreholes offer advantageous conditions for evaluating the hydraulic conductivity. However, there is a lack of an effective and well-established method of exploiting these borehole data to characterize the heterogeneity in the hydraulic conductivity of host rocks. This study presents a new method for accurately mapping the spatial variability of the hydraulic conductivity of rock masses surrounding water curtain boreholes. The method was developed using 3-D numerical seepage analysis, and an empirical relationship was numerically established, which enables an estimate of the hydraulic conductivity from the flow rate of the water curtain borehole measured in a steady water injection test. The numerical results indicate that the water curtain gallery drainage, occurring during the construction period, has a significant influence on the seepage field around water curtain boreholes; such an influence was fully considered in the development of the proposed method. Besides, the effect of the rock fracture configuration on hydraulic conductivity assessment was examined, and the results highlight the fundamental importance of the interconnection between the fractures, boreholes, and permeable boundaries in understanding the heterogeneity of the hydraulic conductivity as well as the groundwater flow patterns around the cavern.
It may be worth mentioning that there are still some issues or shortcomings related to hydro-geological tests and seepage analysis, such as an incomplete testing scheme, lack of standardization for the test procedure, lack of a robust theoretical basis for data analysis, uncertainties associated with the parameterization of hydraulic properties, and determination of the connectivity of hydraulic parameters in fractured rocks. In order to improve the accuracy of seepage analysis and water flow prediction, these issues need to be further studied.

Author Contributions

Conceptualization, Q.-H.Z. and Q.-B.L.; methodology, Q.-H.Z., Q.-B.L. and A.-J.S.; validation, Q.-B.L., A.-J.S. and Y.-J.L.; formal analysis, Q.-H.Z. and Y.-J.L. and Y.-H.Z.; investigation, Q.-H.Z., Q.-B.L., Y.-J.L. and Y.-H.Z.; resources, Q.-B.L., A.-J.S. and Y.-H.Z.; data curation, Q.-H.Z., Y.-J.L. and Y.-H.Z.; writing—original draft preparation, Q.-H.Z., Q.-B.L. and Y.-J.L.; writing—review and editing, Q.-B.L. and A.-J.S.; visualization, Q.-H.Z., Y.-J.L. and Y.-H.Z.; supervision, A.-J.S.; project administration, Q.-B.L. and Y.-H.Z.; funding acquisition, Q.-H.Z., Q.-B.L. and A.-J.S.; All authors have read and agreed to the published version of the manuscript.

Funding

This work was supported by the National Natural Science Foundation of China (Grant Nos. 52079129, 41972298, and 51679012) and the National Key Research and Development Program of China (Grant No. 2017YFC1501305).

Institutional Review Board Statement

Not applicable.

Informed Consent Statement

Not applicable.

Data Availability Statement

The data presented in this study are available on request from the corresponding author.

Conflicts of Interest

The authors declare no conflict of interest.

References

  1. Kjørholt, H.; Broch, E. The water curtain—A successful means of preventing gas leakage from high-pressure, unlined rock caverns. Tunn. Undergr. Space Technol. 1992, 7, 127–132. [Google Scholar] [CrossRef]
  2. Åberg, B. Prevention of gas leakage from unlined reservoirs in rock. In Proceedings of the First International Symposium on Storage in Excavated Rock Caverns, Stockholm, Sweden, 5–8 September 1977; pp. 399–413. [Google Scholar]
  3. Goodall, D.C.; Åberg, B.; Brekke, T.L. Fundamental of gas containment in unlined rock caverns. Rock Mech. Rock Eng. 1988, 21, 235–258. [Google Scholar] [CrossRef]
  4. Zhang, Q.; Liu, Q.; He, G. Reexamining the necessity of adding water curtain borehole with improved understanding of water sealing criterion. Rock Mech. Rock Eng. 2020, 53, 4623–4638. [Google Scholar] [CrossRef]
  5. Li, Z.; Wang, K.; Wang, A.; Liu, H. Experimental study of water curtain performance for gas storage in an underground cavern. J. Rock Mech. Geotech. Eng. 2009, 1, 89–96. [Google Scholar] [CrossRef] [Green Version]
  6. Kurose, H.; Ikeya, S.; Chang, C.S.; Maejima, T.; Shimaya, S.; Tanaka, T.; Aoki, K. Construction of Namikata underground LPG storage cavern in Japan. Int. J. JCRM. 2014, 10, 15–24. [Google Scholar]
  7. Rehbinder, G.; Karlsson, R.; Dahlkild, A. A study of a water curtain around a gas store in rock. Appl. Sci. Res. 1988, 45, 107–127. [Google Scholar] [CrossRef]
  8. Lee, Y.N.; Yun, S.P.; Kim, D.Y.; Nam, H.K. Design and construction aspects of unlined oil storage caverns in rock. In Proceedings of the South East Asian Symposium on Tunneling and Underground Space Development, (SEASTUD), Bangkok, Thailand, 18–19 January 1995; pp. 18–19. [Google Scholar]
  9. Park, J.J.; Jeon, S.; Chung, Y.S. Design of Pyongtaek LPG storage terminal underneath Lake Namyang: A case study. Tunn. Undergr. Space Technol. 2005, 20, 463–478. [Google Scholar] [CrossRef]
  10. Ivars, D.M. Water inflow into excavations in fractured rock—A three-dimensional hydro-mechanical numerical study. Int. J. Rock Mech. Min. Sci. 2006, 43, 705–725. [Google Scholar] [CrossRef]
  11. Yu, C.; Deng, S.C.; Li, H.B.; Li, J.C.; Xia, X. The anisotropic seepage analysis of water-sealed underground oil storage caverns. Tunn. Undergr. Space Technol. 2013, 38, 26–37. [Google Scholar] [CrossRef]
  12. Li, S.; Wang, Z.; Ping, Y.; Zhou, Y.; Zhang, L. Discrete element analysis of hydro-mechanical behavior of a pilot underground crude oil storage facility in granite in China. Tunn. Undergr. Space Technol. 2014, 40, 75–84. [Google Scholar] [CrossRef]
  13. Lin, F.; Ren, F.; Luan, H.; Ma, G.; Chen, S. Effectiveness analysis of water-sealing for underground LPG storage. Tunn. Undergr. Space Technol. 2016, 51, 270–290. [Google Scholar] [CrossRef]
  14. Li, Y.; Chen, Y.; Zhang, G.; Liu, Y.; Zhou, C. A numerical procedure for modeling the seepage field of water-sealed underground oil and gas storage caverns. Tunn. Undergr. Space Technol. 2017, 66, 56–63. [Google Scholar] [CrossRef]
  15. Ravandi, E.G.; Rahmannejad, R.; Karimi-Nasab, S.; Sarrafi, A.; Raoof, A. Water curtain system pre-design for crude oil storage URCs: A numerical modeling and genetic programming approach. Geotech. Geol. Eng. 2018, 36, 813–826. [Google Scholar] [CrossRef]
  16. Lindblom, U. Design criteria for the Brooklyn gas storage caverns at JFK airport, New York. Int. J. Rock Mech. Min. Sci. 1997, 34, 179–195. [Google Scholar] [CrossRef]
  17. Makita, T.; Miyanaga, Y.; Iguchi, K.; Hatano, T. Underground oil storage facilities in Japan. Eng. Geol. 1993, 35, 191–198. [Google Scholar] [CrossRef]
  18. Liang, J.; Lindblom, U. Analyses of gas storage capacity in unlined rock caverns. Rock Mech. Rock Eng. 1994, 27, 115–134. [Google Scholar] [CrossRef]
  19. Kim, T.; Lee, K.-K.; Ko, K.S.; Chang, H.W. Groundwater flow system inferred from hydraulic stresses and heads at an underground LPG storage cavern site. J. Hydrol. 2000, 236, 165–184. [Google Scholar] [CrossRef]
  20. Benardos, A.G.; Kaliampakos, D.G. Hydrocarbon storage in unlined rock caverns in Greek limestone. Tunn. Undergr. Space Technol. 2005, 20, 175–182. [Google Scholar] [CrossRef]
  21. Shi, L.; Zhang, B.; Wang, L.; Wang, H.; Zhang, H. Functional efficiency assessment of the water curtain system in an underground water-sealed oil storage cavern based on time-series monitoring data. Eng. Geol. 2018, 239, 79–95. [Google Scholar] [CrossRef]
  22. Lemieux, A.; Sharp, K.; Shkarupin, A. Preliminary assessment of underground hydrogen storage sites in Ontario, Canada. Int. J. Hydrogen Energ. 2019, 44, 15193–15204. [Google Scholar] [CrossRef]
  23. The National Standard of the People’s Republic of China. Code for Design of Underground Oil Storage in Rock Caverns (GB50455-2008); China Planning Press: Beijing, China, 2009. (In Chinese) [Google Scholar]
  24. The National Standard of the People’s Republic of China. Code for Design of Underground Oil Storage in Rock Caverns (GB50455-2020); China Planning Press: Beijing, China, 2020. (In Chinese) [Google Scholar]
  25. Neuman, S.P. Trends, prospects and challenges in quantifying flow and transport through fractured rocks. Hydrogeol. J. 2005, 13, 124–147. [Google Scholar] [CrossRef]
  26. Allen, D.M.; Michel, F.A. Evaluation of multi-well test data in a faulted aquifer using linear and radial flow models. Ground Water 2010, 36, 938–948. [Google Scholar] [CrossRef]
  27. Tsang, Y.W.; Tsang, C.F.; Hale, F.V.; Dverstorp, B. Tracer transport in a stochastic continuum model of fractured media. Water Resour. Res. 1996, 32, 3077–3092. [Google Scholar] [CrossRef]
  28. Chen, G.; Illman, W.A.; Thompson, D.L.; Vesselinov, V.V.; Neuman, S.P. Geostatistical, type curve and inverse analyses of pneumatic injection tests in unsaturated fractured tuffs at the Apache Leap Research Site near Superior, Arizona. In Dynamics of Fluids in Fractured Rocks. Geophysical Monograph Series; Faybishenko, B., Witherspoon, P.A., Benson, S.M., Eds.; AGU: Washington, DC, USA, 2000; Volume 122, pp. 73–98. [Google Scholar]
  29. Park, B.Y.; Kim, K.S.; Kwon, S.; Kim, C.; Bae, D.S.; Hartley, L.J.; Lee, H.K. Determination of the hydraulic conductivity components using a three-dimensional fracture network model in volcanic rock. Eng. Geol. 2002, 66, 127–141. [Google Scholar] [CrossRef]
  30. Voeckler, H.; Allen, D.M. Estimating regional-scale fractured bedrock hydraulic conductivity using discrete fracture network (DFN) modeling. Hydrogeol. J. 2012, 20, 1081–1100. [Google Scholar] [CrossRef]
  31. Llopis-Albert, C.; Capilla, J.E. Stochastic inverse modelling of hydraulic conductivity fields taking into account independent stochastic structures: A 3D case study. J. Hydrol. 2010, 391, 277–288. [Google Scholar] [CrossRef]
  32. Illman, W.A. Hydraulic tomography offers improved imaging of heterogeneity in fractured rocks. Groundwater 2014, 52, 659–684. [Google Scholar] [CrossRef]
  33. Rovey, C.W., II; Cherkauer, D.S. Scale dependency of hydraulic conductivity measurements. Ground Water 1995, 33, 769–780. [Google Scholar] [CrossRef]
  34. Illman, W.A. Strong field evidence of directional permeability scale effect in fractured rock. J. Hydrol. 2006, 319, 227–236. [Google Scholar] [CrossRef]
  35. Rovey, C.W. Assessing flow systems in carbonate aquifers using scale effects in hydraulic conductivity. Environ. Geol. 1994, 24, 244–253. [Google Scholar] [CrossRef]
  36. Schulze-Makuch, D.; Cherkauer, D.S. Variations in hydraulic conductivity with scale of measurements during aquifer tests in heterogeneous, porous carbonate rock. Hydrogeol. J. 1998, 6, 204–215. [Google Scholar] [CrossRef]
  37. Vesselinov, V.V.; Neuman, S.P.; Illman, W.A. Threedimensional numerical inversion of pneumatic cross-hole tests in unsaturated fractured tuff: 2. Equivalent parameters, high-resolution stochastic imaging and scale effects. Water Resour. Res. 2001, 12, 3019–3042. [Google Scholar] [CrossRef] [Green Version]
  38. Quinn, P.; Cherry, J.A.; Parker, B.L. Hydraulic testing using a versatile straddle packer system for improved transmissivity estimation in fractured-rock boreholes. Hydrogeol. J. 2012, 20, 1529–1547. [Google Scholar] [CrossRef]
  39. Aydin, A. Theory of single-well tests in acute fracture-wellbore systems. J. Hydrol. 1997, 194, 201–220. [Google Scholar] [CrossRef]
  40. Wei, Z.Q.; Egger, P.; Descoeudres, F. Permeability predictions for jointed rock masses. Int. J. Rock Mech. Min. Sci. Geomech. Abstr. 1995, 32, 251–261. [Google Scholar] [CrossRef]
  41. El-Naqa, A. The hydraulic conductivity of the fractures intersecting Cambrian sandstone rock masses, central Jordan. Environ. Geol. 2001, 40, 973–982. [Google Scholar] [CrossRef]
  42. Sun, J.; Zhao, Z. Effects of anisotropic permeability of fractured rock masses on underground oil storage caverns. Tunn. Undergr. Space Technol. 2010, 25, 629–637. [Google Scholar] [CrossRef]
  43. Hitchmough, A.M.; Riley, M.S.; Herbert, A.W.; Tellam, J.H. Estimating the hydraulic properties of the fracture network in a sandstone aquifer. J. Contam. Hydrol. 2007, 93, 38–57. [Google Scholar] [CrossRef]
  44. Hu, C.; Chen, H.; Chen, G.; Liu, J. Detection of low-efficiency zones of water curtain system for underground LPG storage by a discrete fracture network model. Environ. Earth Sci. 2019, 78, 11. [Google Scholar] [CrossRef]
  45. The Standard for Petrochemical Industry of the People’s Republic of China. Specification of Hydrogeological Tests for Underground Oil Storage in Rock Caverns; (SH/T 3195-2017); China Petrochemical Industry Press: Beijing, China, 2018. (In Chinese) [Google Scholar]
  46. Wang, Z.; Li, S.; Qiao, L. Design and test aspects of a water curtain system for underground oil storage caverns in China. Tunn. Undergr. Space Technol. 2015, 48, 20–34. [Google Scholar] [CrossRef]
  47. Bredehoeft, J.D.; Papadopulos, S.S. A method for determining the hydraulic properties of tight formations. Water Resour. Res. 1980, 16, 233–238. [Google Scholar] [CrossRef]
  48. Rehbinder, G. The double packer permeameter with narrow packers. Analytical solution for non-steady flow. Appl. Sci. Res. 1996, 56, 255–279. [Google Scholar] [CrossRef]
  49. US Bureau of Reclamation. Permeability tests in individual drill holes and wells. In Ground Water Manual, Dept of the Interior; US Bureau of Reclamation: Washington, DC, USA, 1977; pp. 317–342. [Google Scholar]
  50. The Standard for Electric Power Industry of the People’s Republic of China. Code of Water Pressure Test in Borehole for Hydropower and Water Resources Engineering; (DL/T5331-2005); China Electric Power Press: Beijing, China, 2005. (In Chinese) [Google Scholar]
  51. Lindblom, U. The performance of water curtains surrounding rock caverns used for gas storage. Int. J. Rock Mech. Min. Sci. Geomech. Abstr. 1989, 26, 85–97. [Google Scholar] [CrossRef]
  52. Zhang, Q.; Xu, W.; Yin, J. Two-dimensional fractured porous flow model of arbitrary fracture network and its two solution methods. Chin. J. Rock Mech. Eng. 2012, 31, 216–227. (In Chinese) [Google Scholar]
Figure 1. The effect of water curtain gallery drainage on the water pressure distribution.
Energies 14 04588 g001
Figure 2. The 3-D model of the water curtain gallery, water curtain boreholes, and storage caverns.
Energies 14 04588 g002
Figure 3. Water pressure distribution in two parallel cross-sections selected along the axial direction of the water curtain borehole: (a) Section 1 passing right through the borehole axis; (b) Section 2 located in the middle of two neighboring boreholes.
Energies 14 04588 g003
Figure 4. Flow velocity vectors along the axis of the water curtain borehole.
Energies 14 04588 g004
Figure 5. Variation of the water pressure with the distance to the water curtain gallery (curve 1 represents the sites in Section 1 that are right on the borehole axis; curve 2 represents the sites in Section 2 that have the same elevation as the borehole axis).
Energies 14 04588 g005
Figure 6. Seepage field at the borehole spacing of 10 m: (a) distribution of water head (unit: m) and streamline; (b) distribution of water pressure (unit: kPa).
Energies 14 04588 g006
Figure 7. The 3-D water pressure field after the excavation of storage caverns is completed: (a) the demonstrated model is cut out along the borehole axis; (b) the demonstrated model is cut out between two adjacent water curtain boreholes (Legend: 1—Water curtain gallery; 2—Water curtain borehole; 3—Storage cavern).
Energies 14 04588 g007
Figure 8. Distribution of water pressure (unit: Pa) in the model cross-section after the excavation of storage caverns is completed.
Energies 14 04588 g008
Figure 9. Representative and simplified conceptual models of rock fractures (left) and numerically derived water head distribution for different models (right): (a) Model 1: one horizontal fracture passing through three boreholes; (b) Model 2: one fracture passing through one borehole and connecting with permeable boundaries; (c) Model 3: one horizontal fracture passing through three boreholes and intersecting with another oblique fracture; (d) Model 4: one horizontal fracture passing through two boreholes and intersecting with another oblique fracture; (e) Model 5: stochastic fracture network including one horizontal fracture passing through all three boreholes.
Energies 14 04588 g009aEnergies 14 04588 g009b
Figure 10. Statistical data of the water injection pressure and flow rate for 154 water curtain boreholes in Zone A.
Energies 14 04588 g010
Figure 11. Layout of storage caverns showing the zoning of the hydraulic conductivity of the surrounding rock.
Energies 14 04588 g011
Figure 12. Statistical results of the equivalent hydraulic conductivity (k) of rocks surrounding water curtain boreholes: (a) the number of boreholes corresponding to varying magnitudes of k; (b) the distribution of log10 k.
Energies 14 04588 g012aEnergies 14 04588 g012b
Table 1. Numerical results for rock mass with different fracture configurations.
Model
Designation
Water Injection Rate (m3/s)Hydraulic Conductivity
Nearby Borehole 2 (m/s)
Borehole 1Borehole 2Borehole 3
No. 12.27 × 10−92.14 × 10−92.27 × 10−91.34 × 10−10
No. 22.87 × 10−102.09 × 10−72.81 × 10−101.31 × 10⁻⁸
No. 32.26 × 10−92.09 × 10−72.26 × 10−91.31 × 10−8
No. 42.79 × 10−102.09 × 10−72.14 × 10−91.31 × 10⁻⁸
No. 52.94 × 10−82.75 × 10−72.93 × 10−71.72 × 10−8
Publisher’s Note: MDPI stays neutral with regard to jurisdictional claims in published maps and institutional affiliations.

