Article

A Theoretical Study on Reversible Solid Oxide Cells as Key Enablers of Cyclic Conversion between Electrical Energy and Fuel

by
Saheli Biswas
1,
Shambhu Singh Rathore
2,
Aniruddha Pramod Kulkarni
1,*,
Sarbjit Giddey
2 and
Sankar Bhattacharya
1
1
Department of Chemical Engineering, Monash University, Melbourne, VIC 3800, Australia
2
CSIRO Energy, Clayton South, Melbourne, VIC 3169, Australia
*
Author to whom correspondence should be addressed.
Energies 2021, 14(15), 4517; https://doi.org/10.3390/en14154517
Submission received: 25 June 2021 / Revised: 21 July 2021 / Accepted: 23 July 2021 / Published: 26 July 2021

Abstract

:
Reversible solid oxide cells (rSOC) enable the efficient cyclic conversion between electrical and chemical energy in the form of fuels and chemicals, thereby providing a pathway for long-term and high-capacity energy storage. Amongst the different fuels under investigation, hydrogen, methane, and ammonia have gained immense attention as carbon-neutral energy vectors. Here we have compared the energy efficiency and the energy demand of rSOC based on these three fuels. In the fuel cell mode of operation (energy generation), two different routes have been considered for both methane and ammonia; Routes 1 and 2 involve internal reforming (in the case of methane) or cracking (in the case of ammonia) and external reforming or cracking, respectively. The use of hydrogen as fuel provides the highest round-trip efficiency (62.1%) followed by methane by Route 1 (43.4%), ammonia by Route 2 (41.1%), methane by Route 2 (40.4%), and ammonia by Route 1 (39.2%). The lower efficiency of internal ammonia cracking as opposed to its external counterpart can be attributed to the insufficient catalytic activity and stability of the state-of-the-art fuel electrode materials, which is a major hindrance to the scale-up of this technology. A preliminary cost estimate showed that the price of hydrogen, methane and ammonia produced in SOEC mode would be ~1.91, 3.63, and 0.48 $/kg, respectively. In SOFC mode, the cost of electricity generation using hydrogen, internally reformed methane, and internally cracked ammonia would be ~52.34, 46.30, and 47.11 $/MWh, respectively.

1. Introduction

Issues related to fossil fuel depletion and global warming continue to be the decade’s greatest concern. In spite of limited reserves [1], fossil fuel still dominates the energy sector [1,2] resulting in massive greenhouse gas (GHG) emission that leads to global warming. This calls for either optimization of the existing fossil fuel resources or development of renewable energy (RE) sources like wind, solar, tidal, geothermal, etc. There has been notable advancement in the RE sector during the last two decades [3,4]. According to International Energy Agency (IEA) reports [5], in 2020, the global use of RE increased by 1.5% as compared to 2019, and the share of renewables in global electricity generation jumped to nearly 28% in 2020 from 26% in 2019.
In spite of these impressive numbers, RE is still faced with the problems of intermittency, storage, and transportation that have restricted its large-scale commercial application, causing an imbalance in the energy supply-demand. This has led to the emergence of power-to-X technology [6,7], whereby renewable energy can be converted into storable and transportable fuels and chemicals (denoted here as X) like hydrogen, methane, ammonia, syngas, formic acid, and methanol (Figure 1). Power-to-gas will gain even more attention in the near future since the demand for ‘green gases’ like hydrogen, ammonia, and synthetic natural gas (SNG) from RE will always prevail in order to sustain various industrial processes like the reduction process in the steel industry, fertilizer production, etc. In addition, it can directly fit into the existing NG infrastructure, thereby reducing infrastructure transition costs. An added advantage of power-to-X technology is that it can utilize CO2 that makes it more compatible with the existing infrastructure both for transportation and for large-scale energy production. Thus, it stands out to be an excellent way of not only RE utilization and storage but also effective CO2 recycling. CO2 can be either sourced from local emission-intensive industries using adsorption technologies or it can be directly captured from the air. Although the current cost for direct air capture is high ($0.094–$0.232 per kg of CO2), further R&D is expected to drive down the same [8]. According to the literature [9,10,11], power-to-X could eventually lead to the production of gasoline, diesel, and even jet fuel. In fact, the International Renewable Energy Agency has predicted that by 2050, power-to-X may cover 28% of global energy demand [12].
Undoubtedly, the advantages of power-to-X technology are multi-faceted; however, the integration of such technology with the existing power infrastructure requires one-step facile conversion of the chemical energy stored in the product gases to electrical energy. Reversible fuel cells (RFC) are one such device capable of efficient cyclic conversion between electrical and chemical energy [13,14,15,16,17,18,19,20,21,22]. The RFC setup consists of reactant and product storage tanks connected to a solid oxide cell that can be operated either in fuel cell mode to generate electricity (Equation (1)) or in the electrolyser mode (Equation (2)) to produce fuels like hydrogen or syngas.
H2 + ½ O2 → H2O + heat + electricity
H2O + heat + electricity → H2 + ½ O2
RFC can be based on either proton exchange membrane (PEM) cells or solid oxide cells (SOC).
Compared to the recent commercially available PEM cells, SOCs can fundamentally achieve low resistance and high efficiency (~95%) at the system level [23] and are expected to reduce capital costs. Thus, reversible solid oxide cell (rSOC)-based plants are expected to be more cost-effective due to an increased annual utilization [24] and prolonged cell (stack) lifetime [17]. The interests in rSOC have increased in the last few years, usually focusing on hydrogen and methane pathways, but with little focus on ammonia. This work compares the round-trip energy efficiency of hydrogen, methane, and ammonia-fueled rSOC as key enablers of cyclic conversion between electrical and chemical energy. It also provides a basic economic assessment of the three processes.

2. Current Electrical Energy Storage Technologies

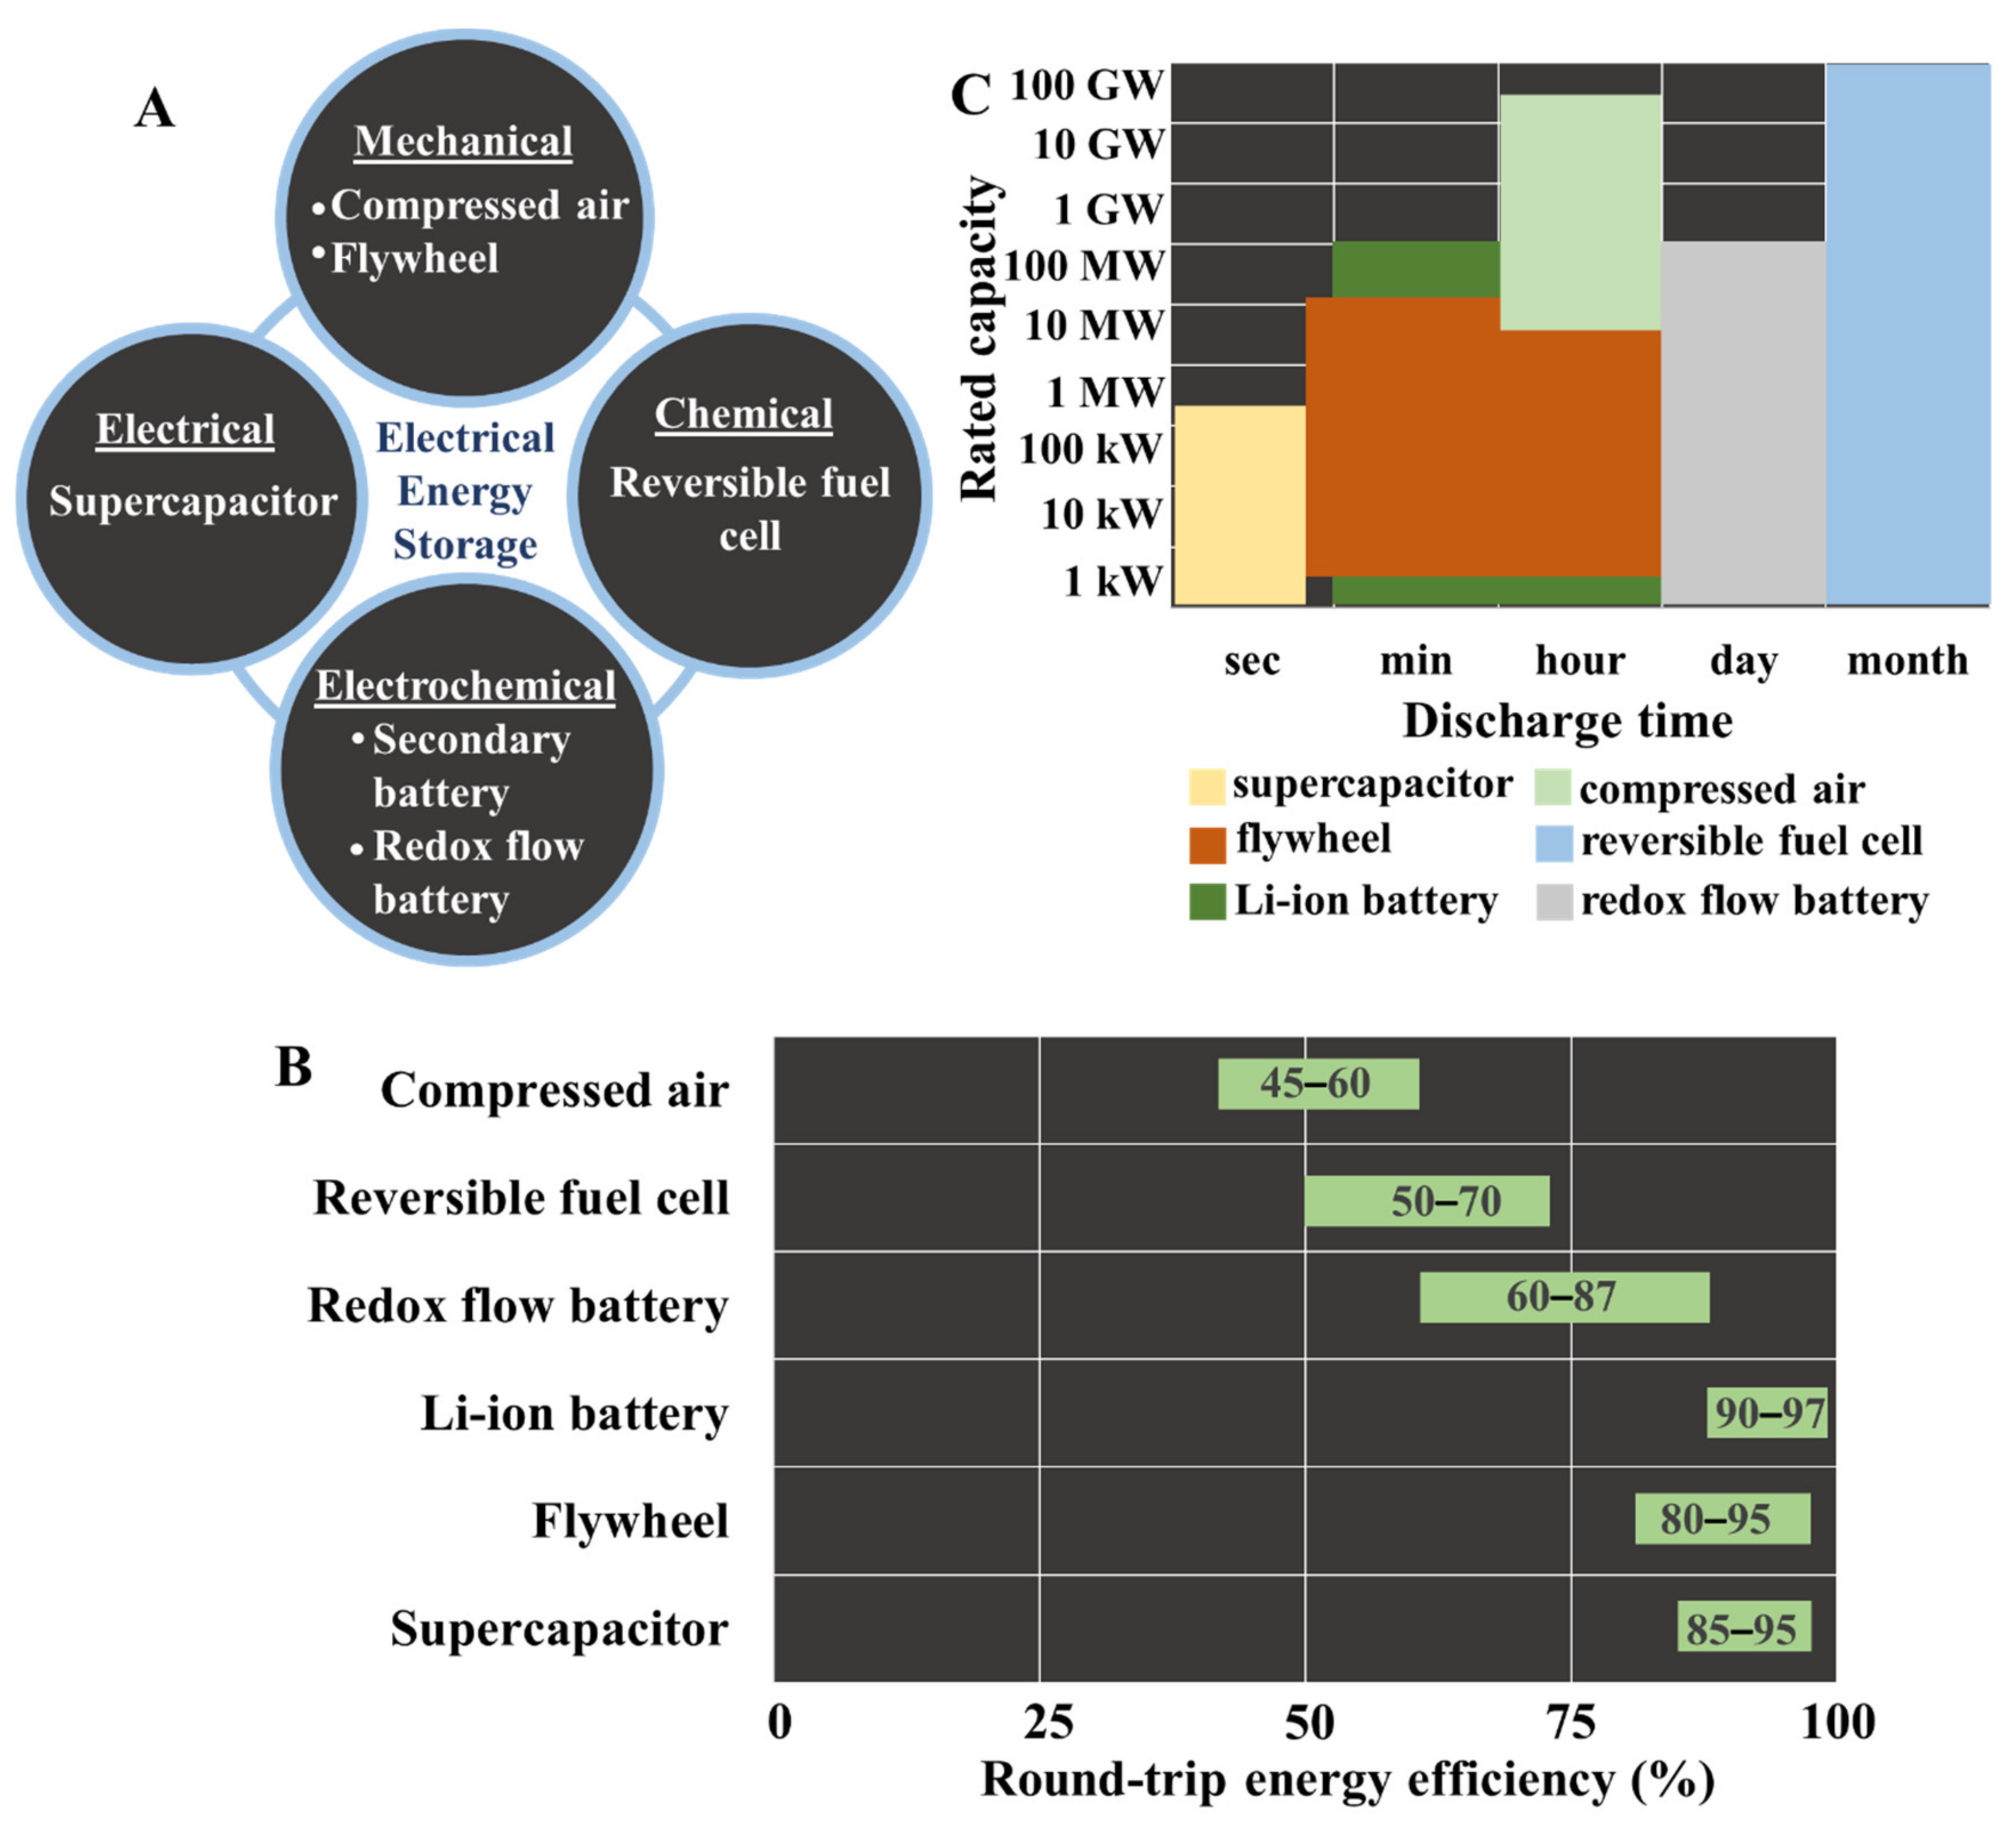
Electrical energy storage (EES), especially renewable energy (RE), has encountered a great expansion over the last few decades, and various techniques are available for efficient conversion of electrical energy to a storable form that can be reserved in a medium for future use (Figure 2A). Amongst those mediums, the most prominent ones are supercapacitors, flywheels, flow batteries, compressed air, and hydrogen-containing gases [25,26]. Supercapacitors have long cycling times (~1 × 10⁵ cycles) with high round-trip efficiency (~85–95%) (Figure 2B) and exhibit high power and energy densities [27]. However, they are limited by a very fast self-discharging rate that makes them suitable for only small-scale and short-term energy storage. In comparison, batteries, compressed air, and flywheel guarantee higher energy storage capacity coupled with slower discharge rates (Figure 2C). Compressed air energy storage (CAES) has the flexibility to operate from small to large-scale capacities, exhibits good partial-load performance, and can be integrated with intermittent RE sources like wind power.
However, the major barriers to the commercialization of CAES are the identification of appropriate geographical locations and relatively low round-trip efficiency of ~54% (Figure 2B) [28]. Flywheel energy storage (FES) [29] has a storage capacity from a few kilowatts to 10 MW with an appreciable round-trip efficiency (Figure 2B), and their integration to solar PV and wind farms is currently being investigated. Their major drawbacks are a comparatively low operational lifetime and the idling loss encountered while the flywheel is on standby, causing a relatively high self-discharge of ~20% of the stored capacity per hour [26]. Batteries like the Li-ion ones exhibit high power density and longer discharge times while retaining a high round-trip efficiency in the range of 90–97% (Figure 2B) [30]. They are most suited for applications requiring a high response time, lightweight, and a small dimension of the energy storage medium. However, their low durability coupled with a high overall cost places a bar on their scale-up and commercialization [31], especially for large-scale grid storage. Redox flow batteries (RFB) have been proposed as an alternative [32,33]. Unlike conventional batteries where reactants are stored within the cell, RFBs are equipped with external tanks for storing electrochemical reactants dissolved in electrolytic solutions that are circulated over the electrode while the cell is in operation. Enlargement of the storage tanks guarantees superior energy storage capacity with a longer lifetime as compared to conventional batteries. However, the large volume of electrolytic solution considerably reduces the specific energy of the system.
The energy density of RFB ranges from 25–35 Wh L−1, almost an order of magnitude less than that of Li-ion batteries [33] with round-trip efficiency between 60–87% (Figure 2B). Moreover, this technology is still at a nascent stage that needs to address issues pertaining to fabrication, installation, and maintenance cost reduction, performance improvement, and reduction of cell degradation [33,34]. In view of the challenges posed by the above-mentioned energy storage technologies, power-to-X appears to be a promising alternative where RE is electrochemically converted to and stored as chemical energy in the form of hydrogen or other hydrogen-containing fuels and chemicals. It offers the highest energy storage capacity and longest lifetime that makes it even more appropriate for integration to electricity/gas grids or for direct application as a chemical like in the case of power-to-ammonia. One of the major pillars of power-to-X technology is a reversible fuel cell (RFC), and most of the recent R&D activities have been directed towards appropriate electrocatalyst development, electrode material development, and cell-size optimization in order to improve round-trip efficiency.

3. Reversible Solid Oxide Cells as a Key Enabler of Cyclic Energy Conversion

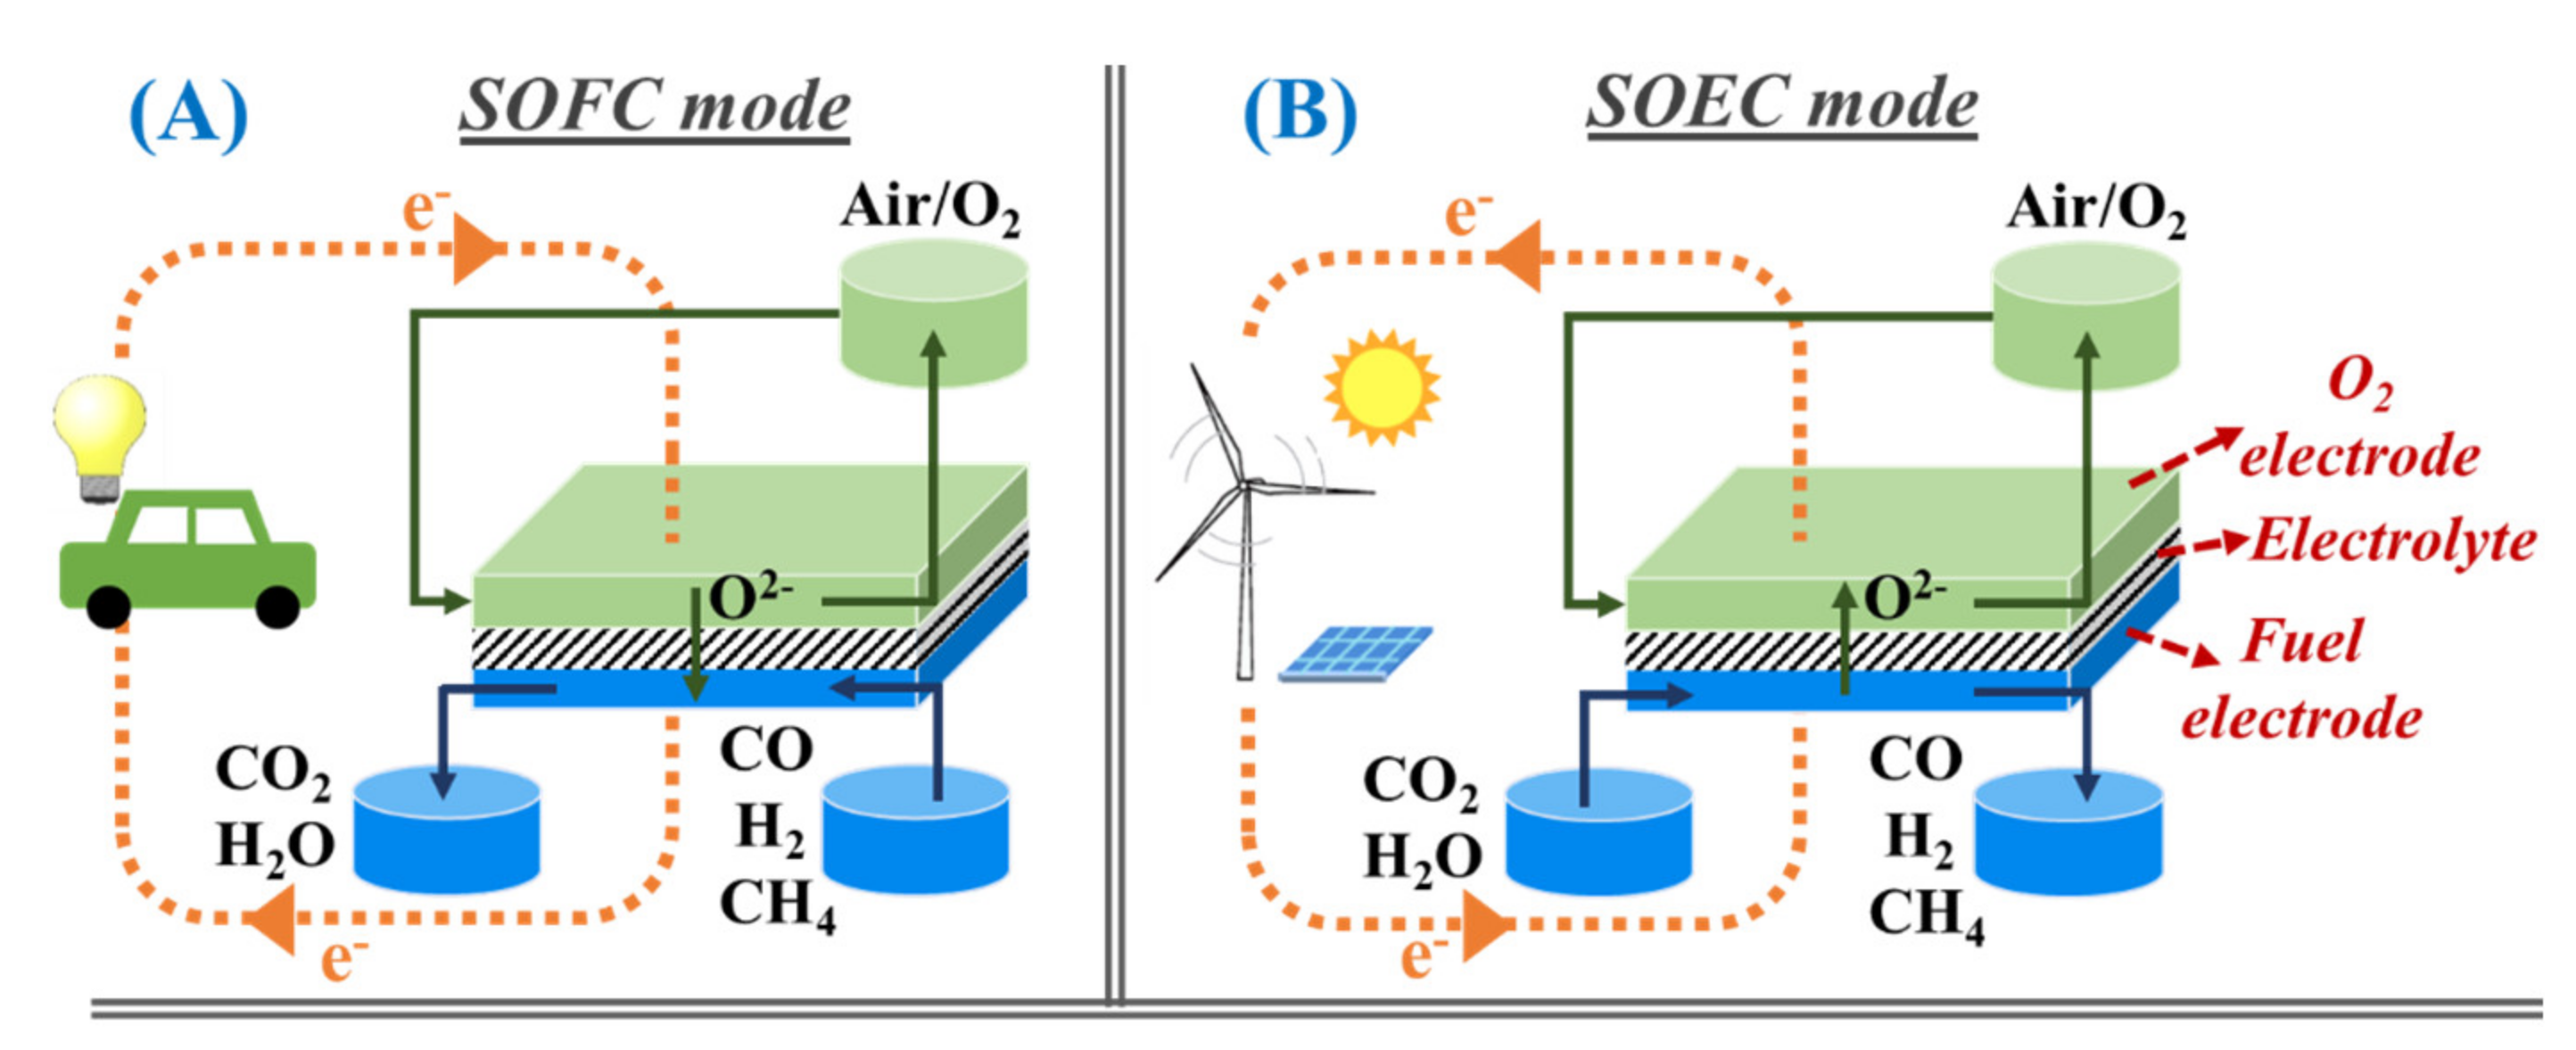
The first RFC was developed in 2003 for a NASA project, which was tested for 1700 (10 min each) charge-discharge cycles [13]. They can be either proton exchange membrane (PEM) based [14,15,16,35,36] or solid oxide electrolyte based depending on the nature of the electrolyte being used. Although PEM cells are commercially available and the first RFC was PEM based, its drawbacks include high cost due to the use of expensive electrocatalysts, low durability, insufficient understanding of the degradation mechanisms in the gas diffusion layer, bipolar plates and membrane, development of novel materials for redox stable oxygen electrode, and high area-specific internal cell resistance leading to retarded cell efficiency [15,37,38,39]. In this context, solid oxide cells (SOC) appear to be more attractive due to a high energy conversion efficiency of ~95% [40,41]. Compared to the 40–50% round-trip efficiency of reversible PEM cells, reversible SOCs offer round-trip efficiency of 60–80% [42]. Moreover, SOCs are capable of electrolysing CO2 to CO [43,44] or even co-electrolysing steam/CO2 to a mixture of H2/CO [45,46,47]. Thus, their reversible mode operation allows renewables powered fuel production through a carbon-neutral process followed by subsequent utilization of those fuels for electricity generation [17,18,19]. In electrolysis mode (Figure 3A), water or CO2 molecules are reduced at the negative electrode (cathode) producing hydrogen (Equation (3i)) and CO (Equation (3ii)), respectively, along with oxide (O2−) ions. The hydrogen or CO is released at the cathode and the O2− ions are transported through the solid oxide electrolyte to the positive electrode (anode) where they release electrons and evolve as oxygen (Equation (4)). Fuel cell mode involves reverse operation (Equations (5) and (6)) as illustrated in Figure 3B.
Electrolysis mode
Cathode: H2O + 2e → H2 + O2−     (ΔH1023K = 248.1 kJ mol−1)
CO2 + 2e → CO + O2−     (ΔH1023K = 248.1 kJ mol−1)
Anode: O2− → ½ O2 + 2e
Fuel cell mode
Anode: H2(g) + O2− → H2O + 2e     (ΔH1023 K = −248.1 kJ mol−1)
Cathode: ½ O2 + 2e → O2−
Ideally, an accurate adjustment of the inlet steam/CO2 ratio under appropriate operating conditions will succeed in producing syngas with desired H2/CO ratio of 1.4 to 3 (v/v). The as-produced syngas can be either stored and utilized as a fuel when the SOC is operated under the fuel cell mode for electricity generation, or else it can be used to produce methane through methanation reaction (Equation (7)) or other liquid fuels (methanol and hydrocarbons) through Fischer Tropsch synthesis. In fact, steam electrolysis in SOC (Equation (3i)) can be integrated with a Haber Bosch reactor for ammonia synthesis (Equation (8)), which can be either transported as a chemical or stored onboard as a hydrogen carrier to generate electricity when the SOC is operated reversibly [48,49]. Ammonia as an energy vector has gained much attention in recent years since it provides a carbon-free economy [50,51]. The high temperature of SOC is conducive to the internal reforming of these hydrogen carriers (methane, ammonia, etc.) within the stack itself, which eliminates the use of a separate reformer or cracker and enhances overall system efficiency along with cost reduction. According to energy balance calculations by Blum et al. [52], planar SOFCs operating on methane exhibit 63% electrical efficiency with at least 80% fuel utilization because of internal reforming, which further increases to 90% in case of anode off-gas recycling. Another recent study on ammonia-fueled rSOC shows a power-to-NH3 efficiency of 66% and NH3-to-power efficiency of 58.2% at current densities of 0.7 and 0.4 A cm−2, respectively [49].
CO + 3H2 = CH4 + H2O     (ΔH1023 K = −206.1 kJ mol−1)
N2 + 3H2 = 2NH3     (ΔH1023 K = −91.8 kJ mol−1)
Thus, reversible SOCs continue to be a topic of fervent research in the field of RE storage and utilization.

4. Theoretical Round-Trip Energy Efficiency of rSOC with Hydrogen, Methane, and Ammonia

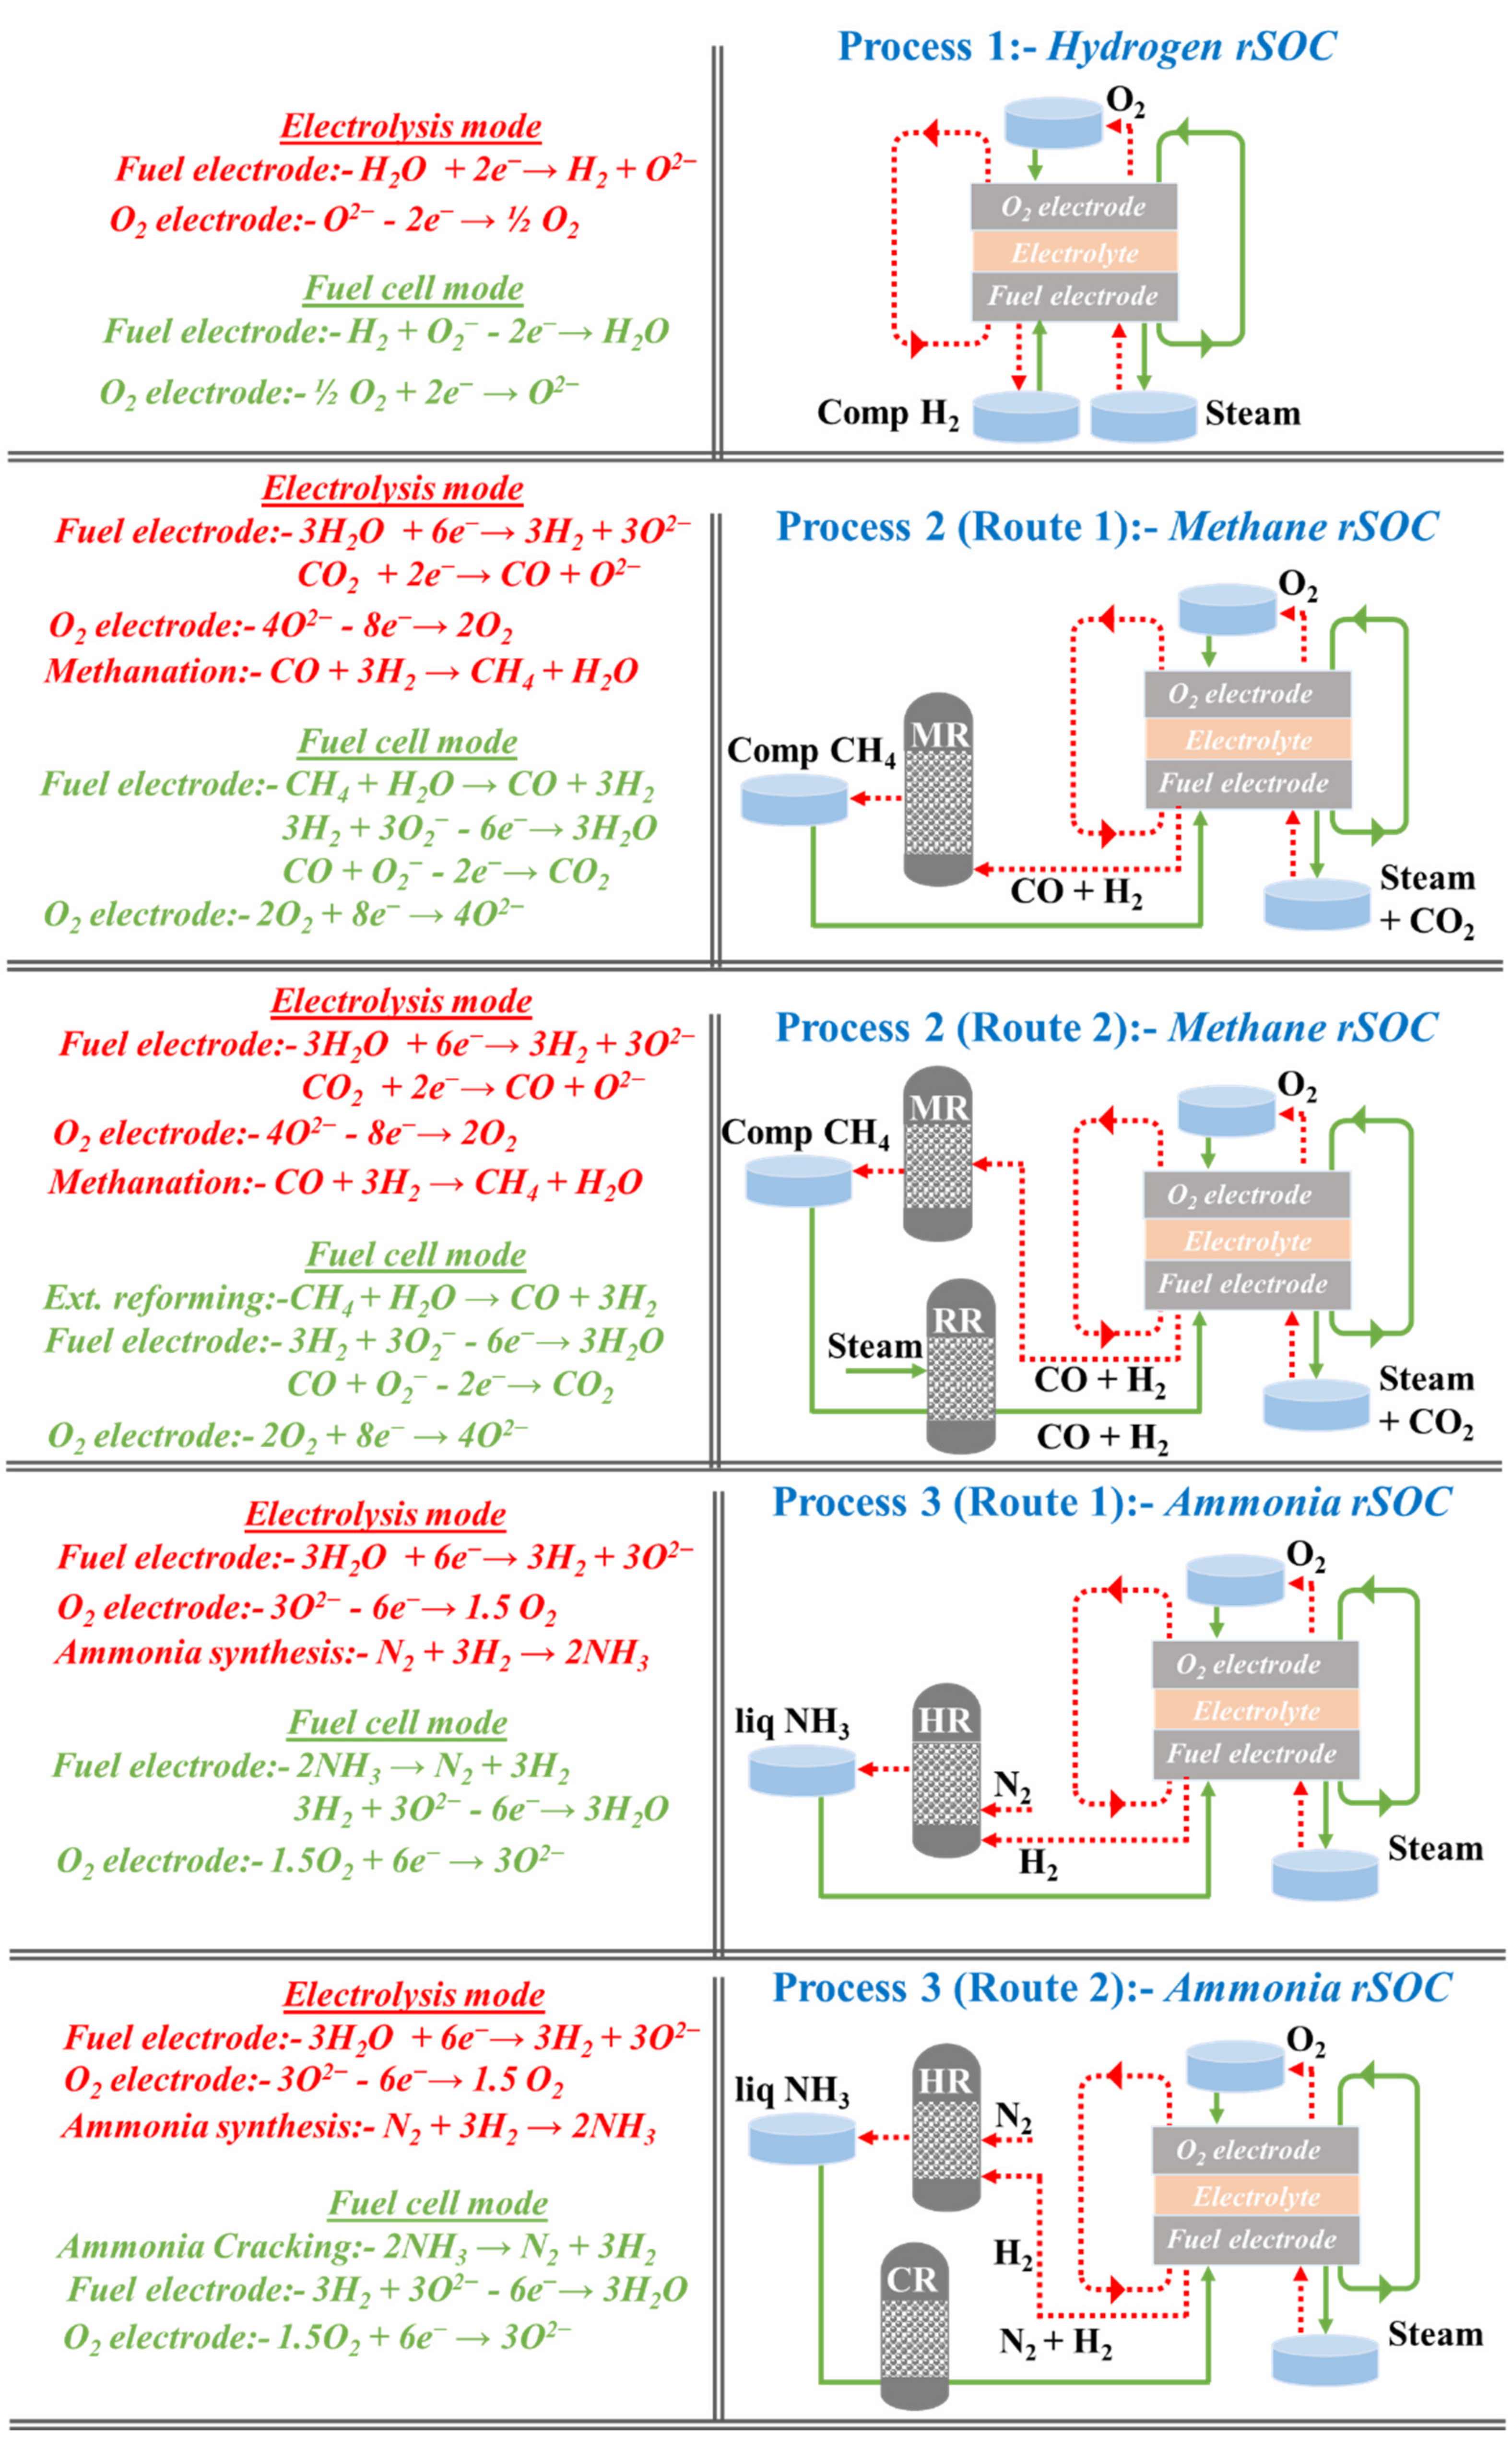
A theoretical approach towards the application of rSOC for the synthesis (in SOEC mode) and utilization (in SOFC mode) of three important fuels (hydrogen, methane, ammonia) have been presented here (Figure 4).
In process 1, hydrogen is produced from steam electrolysis in SOEC mode. This hydrogen is then stored under compression at 700 bars and used as fuel while operating the cell in SOFC mode, where it undergoes oxidation with the simultaneous release of electrons. Process 2 involves the co-electrolysis of steam and CO2 with the formation of syngas (H2/CO) that undergoes methanation in a subsequent thermochemical reactor (MR). The methane produced is compressed to 350 bars and stored for its utilization in SOFC mode. During fuel cell operation, this methane undergoes either internal reforming within the SOC itself (Route 1) or external reforming in a separate reformer (RR) connected to the SOC (Route 2). For Route 1, the stored methane along with steam is directly supplied to the fuel electrode of the SOC where they react to produce hydrogen and CO. Contrarily, for Route 2, methane undergoes steam reforming in a separate reactor, and the exit gas (hydrogen/CO mixture) is fed to the SOC. The next step is the oxidation of the hydrogen/CO mixture in SOC along with the discharge of electrons, which is the same for both modes. In process 3, steam supplied to the cell gets electrolysed to hydrogen that reacts with N2 in a separate Haber Bosch reactor (HR) to generate NH3, which is liquefied and stored at −33 °C. In fuel cell mode, this NH3 is cracked either internally (Route 1) or externally (Route 2), producing hydrogen and N2. For Route 1, the stored NH3 is directly supplied to the fuel electrode of the SOC where it cracks to produce hydrogen and N2. The hydrogen is oxidized along with the release of electrons. Contrarily, for Route 2, NH3 undergoes cracking in an external cracker (CR). The exit gas (hydrogen/N2 mixture) is purified and a pure H2 stream is fed to the SOC.

4.1. Methodology

The efficiency of rSOC depends on the interactions of the electrochemical reactions, thermochemical reactions, and plant-wise heat integration. It is to be noted that during electrolysis, SOC provides the opportunity to recycle back the exothermic heat of methanation (Equation (7)) and ammonia synthesis (Equation (8)) reactions. For fuel cell mode operation, heat recovered from downstream cooling processes can be recycled back to maintain the SOC temperature. This work compares the energy efficiencies of electrolysis mode (SOEC) operation (ηX) and fuel cell mode (SOFC) operation (ηP) along with the round-trip efficiency (ηRTE) for each process by using basic energy balance:
η X = Energy   of   product   formed Total   energy   input   × 100
η P = Electrical   energy   generated   Total   energy   input   × 100
η RTE = η PtX × η XtP
Our calculations are based on the following major assumptions:
  • SOC is in thermal equilibrium with the feed (steam or steam/CO2 mixture) and is thermally insulated so as to avoid any heat losses to the ambient.
  • Energy efficiencies are based on heat recycled back from the HR or MR to the SOC.
  • LHV has been used for methane (50.0 KJ/g), ammonia (18.6 KJ/g), and hydrogen (120.0 KJ/g).
For the electrolysis mode operation of each of the processes, we considered the LHV of the corresponding fuel as the energy output. For calculating the energy input, we considered the overall energy required for steam electrolysis (in the case of hydrogen and ammonia) or steam/CO2 co-electrolysis (in the case of methane) at 90% SOEC efficiency. This overall energy comprises heat energy required for producing steam at 800 °C (in the case of hydrogen and ammonia), energy for heating CO2 to 800 °C (in the case of methane), and the electrical energy required for steam electrolysis or steam/CO2 co-electrolysis. On top of these, we also took into account the energy penalty for methanation process efficiency of 75% and Haber Bosch process efficiency of 66%. Finally, we incorporated the energy gained through exothermic methanation (Equation (7)) and ammonia synthesis (Equation (8)) reactions at a heat pump efficiency of 90%.
For fuel cell mode operation of each process, the energy input was calculated by considering the LHV of the corresponding fuel being consumed and the energy required to heat it to the SOC temperature (in the case of hydrogen, methane via internal reforming, ammonia via internal cracking) or reformer temperature (in the case of external methane reforming) or cracker temperature (in the case of external ammonia cracking). We also considered the energy penalty coming from internal methane reforming conversion of 90%, internal ammonia cracking conversion of 85%, external methane reforming process efficiency of 78%, and external ammonia cracking process efficiency of 90%. For calculating the energy output of each process, we considered the electrical energy produced at 50% SOFC efficiency.
Detailed operational conditions along with process parameters considered for this work have been provided in Table 1 and Figure 5 shows a block diagram describing the methodology of the energy calculation for each of the processes described here.
It is to be noted that during actual cell operation, voltage and current density would dictate the electrical energy and thus the energy efficiency. These are governed by the partial pressure of oxygen at the fuel electrode [59] and the area-specific resistance of the cell [59,60]. However, what we have reported here are calculations based on thermodynamics, so no current density is involved. Thus, the contribution from Joule’s heating [60,61] has also not been considered, which would otherwise be quite significant, especially for electrode supported cells where the current density can be as high as 1 A cm−2 [60,62].

4.2. Results

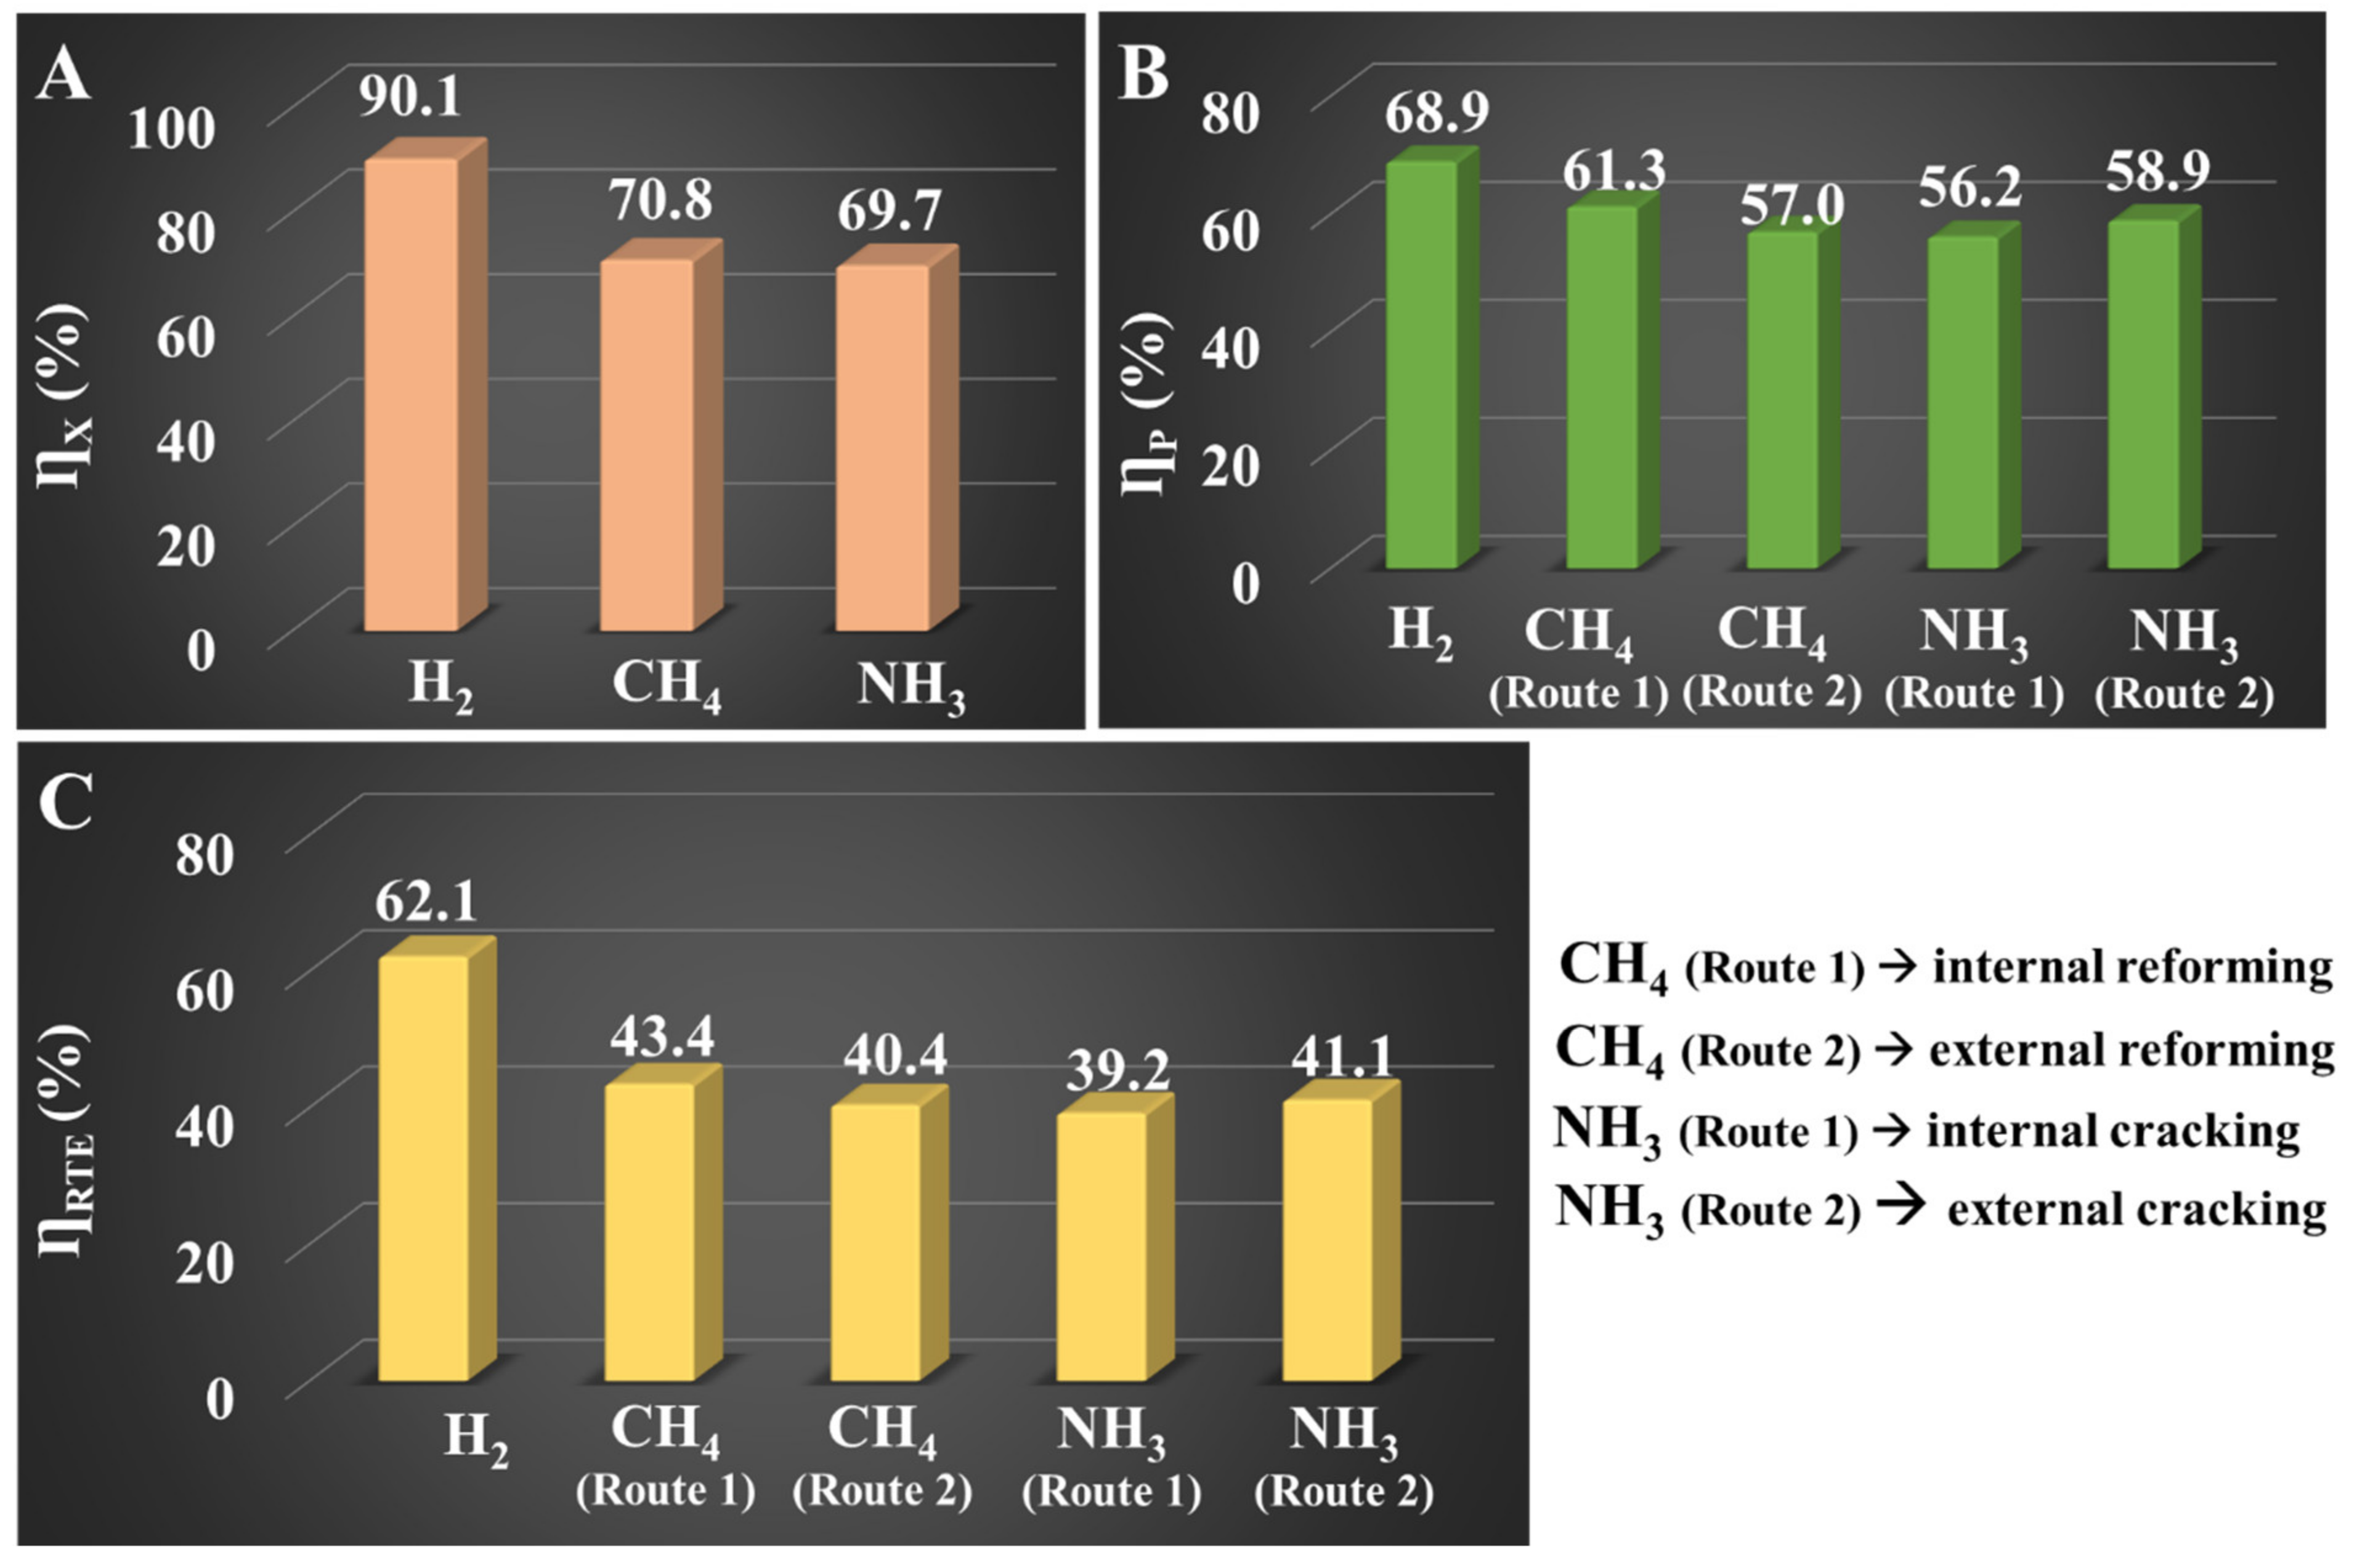
As shown in Figure 6A, ηX (Equation (9)) is the highest for hydrogen (90.1%), followed by methane (70.8%) and ammonia (69.7%). Wang et al. [62] reported ηX of 83% for steam electrolysis at 650 °C. Giglio et al. [63] reported ηX of 76% for synthetic natural gas production using a SOEC stack (operated at 850 °C and 33 bars) coupled with a methanator. Another recent study [64] on fuel gas (CH4, CO, CO2, H2) fed rSOC reported ηRTE in the range of 55 to 60% depending on cell temperature and pressure. In our work, ηP (Figure 6B) as calculated from Equation (10), follows the order hydrogen (68.9%) > methane by Route 1 (61.3%) > ammonia by Route 2 (58.9%) > methane by Route 2 (57.0%) > ammonia by Route 1 (56.2%). Peters et al. [65] obtained ηP of ~60% at 750 °C for hydrogen-fueled SOFC. For natural gas or methane fueled SOFC, ηP usually ranges from 42 to 64% [65,66,67] depending on temperature, pressure, current density, reactant utilization, anode off-gas recycling, and balance of plant (BOP) components. For ammonia, ηP varies between 40 to 60% as is widely reported [68,69,70]. For our processes, ηRTE (Figure 6C) as calculated from Equation 11, follows the order hydrogen (62.1%) > methane by Route 1 (43.4%) > ammonia by Route 2 (41.1%) > methane by Route 2 (40.4%) > ammonia by Route 1 (39.2%). Recently, Wang et al. [48] have reported ηRTE in the range of 37 to 45% for hydrogen, 37 to 54% for methane, and 27 to 43% for ammonia by varying the current density, stack outlet temperature, and reactant utilization. Another recent work [71] has predicted ηRTE of 60% for hydrogen-based rSOC with an active cell area of 500 cm2, operated at 1.28 V and 850 °C. Giddey et al. [70] reported ηRTE between 36 to 50% for ammonia fueled SOFC, considering ammonia synthesis in a Haber Bosch reactor by utilizing H2 produced from a renewables-powered proton exchange membrane electrolyser that typically requires 8 to 10 kWh/kg ammonia.
In the present work, for both the routes of process 2, 19.40 kWh/Kg methane is the energy requirement for syngas generation from steam/CO2 co-electrolysis and an additional 3.47 kWh/Kg is required for the methanation process. However, with the integration of the exothermic heat (3.2 kWh/Kg) of methanation reaction, the net energy requirement comes down to 19.61 kWh/Kg of methane. This value can be further reduced by operating the SOC at 25 bars, thus eliminating the requirement for syngas compression that costs ~1.17 kWh/Kg of methane [72]. The resultant ηX would increase by almost 5.6% and matches with what has been reported by a recent study [63]. However, pressurized systems require more expensive devices, which may partly offset the economic advantages linked to the higher energy efficiency. Moreover, high-pressure co-electrolysis implies lower current density at thermoneutral voltage, demanding a higher cell area [64]. The electrical energy generated in fuel cell mode is 13.5 kWh/Kg of methane for both internal (Route 1) and external reforming (Route 2). However, the energy consumed is 22.0 and 23.7 kWh/Kg of methane for Route 1 and Route 2, respectively. External reforming involves methane compression to 25 bars causing an energy penalty of ~0.5 kWh/Kg, which is a major contributor to the higher energy consumption of Route 2. Nonetheless, one of the major challenges of internal reforming is the development of fuel electrode material with appreciable catalytic activity towards both methane reforming and electrochemical reactions [73,74]. With such a material, the energy consumption can be reduced to ~20.9 kWh/Kg methane with ηP and ηRTE values of 65% and 43%, respectively.
For both the routes of process 3, 6.5 kWh/Kg ammonia is the energy requirement for hydrogen generation, 1.6 kWh/Kg is needed for the Haber Bosch process (out of which ~20% contribution comes from compression [75]) and the exothermic heat (0.7 kWh/Kg) of ammonia synthesis reaction can be recycled back, bringing the net energy requirement to 7.4 kWh/Kg ammonia. The electrical energy generated in fuel cell mode is 4.7 kWh/Kg of ammonia for both internal (Route 1) and external reforming (Route 2). However, the energy consumed is 8.5 and 8.1 kWh/Kg of ammonia for Route 1 and Route 2, respectively. The additional energy penalty for internal cracking (Route 1) comes from a lower cracking conversion. In fact, this is one of the major challenges posed by ammonia-fueled SOFC with internal cracking; the fuel electrode should have good catalytic activity towards both ammonia cracking and electrolysis apart from being tolerant to nitride poisoning [76,77]. Haldor Topsoe is developing a green ammonia production plant, estimated to produce ammonia at 7.2 kWh/kg [78] with overall process efficiency of ~70%. They are using SOEC for the generation of pure N2 from the air at the cathode to replace conventional air separation units, which otherwise contribute notably to the final energy cost of ammonia [79].
Since technology related to rSOC is still under development, and large demonstration units for long-term operation are still not available, it is difficult to make a precise and definite cost assessment due to uncertainties related to cost components like CAPEX, stack lifetime, and stability of the electrode material under different gaseous environments ammonia, methane and H2/CO2 mixture. For our preliminary economic assessment of the three processes discussed above, these parameters have been adopted from state-of-the-art SOEC/SOFC technologies. For the well-established processes of methanation, Haber Bosch, and ammonia cracking, economical parameters have been taken from the literature. Our simplistic calculations show that costs of hydrogen (SOEC mode) and electricity (SOFC mode) production via process 1 are 1.91 $/kg hydrogen and 52.34 $/MWh, respectively (Table 2). Costs of methane (SOEC mode) and electricity (SOFC mode with internal reforming) production via process 2 are 3.63 $/kg methane and 46.30 $/MWh, respectively (Table 3). External reforming would require an additional 372 $/kW [80,81], out of which ~17% is CAPEX. This increases the cost of electricity production to ~84.86 $/MWh. Thus, external reforming-based methane-fueled SOC appears to be economically less profitable. Similar calculations show that costs of ammonia (SOEC mode) and electricity (SOFC mode) production via process 3 are 0.48 $/kg ammonia and 47.11 $/MWh, respectively (Table 4). External cracking would require an additional 82.9 $/ton of ammonia cracked, which increases the cost of electricity production to ~70.18 $/MWh. For all three processes, improving the capacity factor, reducing the SOC CAPEX and system integration with RE sources can further reduce the cost figures.

5. Discussion

Reversible solid oxide cells provide a promising and efficient way of cyclic conversion between electrical and chemical energy in the form of fuels and chemicals. Amongst the different fuels under investigation, hydrogen, methane, and ammonia have gained immense attention as key energy vectors due to their varied applications. Here we have compared the energy efficiency and the energy demand of rSOC based on these three fuels. For the SOFC mode operations, two different routes have been considered for both methane and ammonia; Routes 1 and 2 involve internal reforming (in the case of methane) or cracking (in the case of ammonia) and external reforming or cracking, respectively. Hydrogen gave the highest round-trip efficiency (62.1%) followed by methane by Route 1 (43.4%), ammonia by Route 2 (41.1%), methane by Route 2 (40.4%), and ammonia by Route 1 (39.2%). Apparently, internal reforming and external cracking showed higher energy efficiency and lower energy requirements. However, an adequate upgrade of the electrode materials would ensure even higher catalytic activity and stability of the fuel electrode, which are expected to improve rSOC performance.
The state-of-the-art SOC materials include 8 mol% Yttria stabilized Zirconia (YSZ) as an electrolyte, a cermet of Ni on YSZ (Ni-YSZ) as the fuel electrode, and the perovskite Strontium doped Lanthanum Manganite (La0.8Sr0.2MnO3-δ) as the oxygen electrode. With this composition, the extent of cell passivation has been reported to be much higher in the electrolysis mode that further worsens at high current density, high water partial pressure, and low temperature [20,83]. Use of ferrite-based mixed ionic electronic conductors (MIEC) like Strontium and Cobalt doped Lanthanum Ferrite (LSCF) and Strontium doped Lanthanum Ferrite (LSF) instead of LSM reduces the extent of such degradation, but cannot assure complete mitigation. Fuel electrode material also seeks sufficient improvement due to the inherent challenges related to conventional Ni-YSZ cermets like Ni oxidation at high temperatures, Ni migration to the triple-phase boundary (TPB), layer peeling and particle coarsening, limited activity for CO2 electrolysis, and instability in presence of CO [45,84,85,86,87,88,89]. Perovskites such as La0.7Sr0.3VO3-δ (LSV), La0.8Sr0.2Cr0.5Mn0.5O3-δ (LSCM), La0.3Sr0.7TiO3-δ (LST), and La0.3Sr0.3Cr0.3Fe0.7O3-δ (LSCrF) have gained attention due to their low area-specific resistance (ASR), low polarization resistance, high chemical stabilities against carbon coking and sulfur poisoning [90,91,92,93,94,95]. Other major challenges include manufacturing costs, and stack design and assemblage. Regarding manufacturing costs, the single-step co-firing process has become an alternative that reduces the production steps and overall energy consumption [96,97,98]. Additionally, for composite electrodes, this technique increases porosity and reduces ASR as compared to mechanically mixed composites. Thus, several critical issues need to be addressed, which include oxygen electrode performance and reversibility, development of redox stable electrode materials, and appropriate cell/stack and system designs capable of demonstrating large-scale technological feasibility.

6. Conclusions

Hydrogen, methane, and ammonia have been investigated here as fuels for rSOC, and they have been compared in terms of energy efficiency, the energy demand of rSOC, and preliminary economic assessment. In the fuel cell mode of operation, two different routes have been considered for both methane and ammonia; Routes 1 and 2 involve internal reforming (in the case of methane) or cracking (in the case of ammonia) and external reforming or cracking, respectively. Hydrogen gave the highest round-trip efficiency (62.1%) followed by methane by Route 1 (43.4%), ammonia by Route 2 (41.1%), methane by Route 2 (40.4%), and ammonia by Route 1 (39.2%). Energy demand for SOEC mode was highest for hydrogen (37 kWh/Kg), followed by methane (19.6 kWh/Kg), and ammonia (7.4 kWh/Kg). Energy consumed for SOFC mode was highest for hydrogen (38.9 kWh/Kg), followed by methane via Route 2 (23.7 kWh/Kg), methane via Route 1 (22.0 kWh/Kg), ammonia via Route 1 (8.5 kWh/Kg), and ammonia via Route 2 (8.1 kWh/Kg). Preliminary cost estimate showed that the price of hydrogen, methane, and ammonia produced in SOEC mode would be ~1.91, 3.63, and 0.48 $/kg, respectively. In SOFC mode, the cost of electricity generation using hydrogen, internally reformed methane, and internally cracked ammonia would be ~52.34, 46.30, and 47.11 $/MWh, respectively.

Author Contributions

Conceptualization: A.P.K.; methodology: A.P.K. and S.B. (Saheli Biswas); validation: S.B. (Saheli Biswas), A.P.K., S.G. and S.S.R.; formal analysis: S.B. (Saheli Biswas) and A.P.K.; writing—original draft preparation: S.B. (Saheli Biswas); writing—review and editing: A.P.K., S.G., S.B. (Sankar Bhattacharya) and S.S.R.; visualization: S.B. (Saheli Biswas); supervision: A.P.K., S.G. and S.B. (Sankar Bhattacharya); funding acquisition: A.P.K., S.G. and S.B. (Sankar Bhattacharya); All authors have read and agreed to the published version of the manuscript.

Funding

This work received funding from the Australian Renewable Energy Agency (ARENA) as part of ARENA’s Research and Development Program—Renewable Hydrogen for Export, and also from CSIRO Hydrogen Energy Systems Future Science Platform and CSIRO Research Office. The funders were not involved in study design; collection, analysis and interpretation of data; writing of the manuscript; or the decision to submit it for publication.

Institutional Review Board Statement

Not applicable.

Informed Consent Statement

Not applicable.

Data Availability Statement

Not Applicable.

Conflicts of Interest

The authors declare no conflict of interest.

References

  1. Shafiee, S.; Topal, E. When will fossil fuel reserves be diminished? Energy Policy 2009, 37, 181–189. [Google Scholar] [CrossRef]
  2. Newell, R.; Iler, S.; Raimi, D. Global Energy Outlook Comparison Methods: 2019 Update; Resources for the Future: Washington, DC, USA, 2018. [Google Scholar]
  3. Murdock, H.E.; Gibb, D.; André, T. Renewables 2019 Global Status Report; Ren21: Paris, France, 2019. [Google Scholar]
  4. Shaughnessy, E.J.; Heeter, J.S.; Gattaciecca, J.; Sauer, J.; Trumbull, K.; Chen, E.I. Community Choice Aggregation: Challenges, Opportunities, and Impacts on Renewable Energy Markets; National Renewable Energy Lab.: Golden, CO, USA, 2019. [Google Scholar]
  5. International Energy Agency. Global Energy Review 2020; OECD Publishing: Paris, France, 2020. [Google Scholar]
  6. Rego de Vasconcelos, B.; Lavoie, J.-M. Recent advances in Power-to-X technology for the production of fuels and chemicals. Front. Chem. 2019, 7, 392. [Google Scholar] [CrossRef] [Green Version]
  7. Foit, S.R.; Vinke, I.C.; de Haart, L.G.; Eichel, R.A. Power-to-Syngas: An Enabling Technology for the Transition of the Energy System? Angew. Chem. Int. Ed. 2017, 56, 5402–5411. [Google Scholar] [CrossRef]
  8. Fasihi, M.; Efimova, O.; Breyer, C.J. Techno-economic assessment of CO2 direct air capture plants. J. Clean. Prod. 2019, 224, 957–980. [Google Scholar] [CrossRef]
  9. Choi, Y.H.; Jang, Y.J.; Park, H.; Kim, W.Y.; Lee, Y.H.; Choi, S.H.; Lee, J.S. Carbon dioxide Fischer-Tropsch synthesis: A new path to carbon-neutral fuels. Appl. Catal. B Environ. 2017, 202, 605–610. [Google Scholar] [CrossRef]
  10. Wei, J.; Ge, Q.; Yao, R.; Wen, Z.; Fang, C.; Guo, L.; Xu, H.; Sun, J. Directly converting CO2 into a gasoline fuel. Nat. Commun. 2017, 8, 1–9. [Google Scholar] [CrossRef] [Green Version]
  11. Schmidt, P.; Batteiger, V.; Roth, A.; Weindorf, W.; Raksha, T. Power-to-Liquids as Renewable Fuel Option for Aviation: A Review. Chem. Ing. Tech. 2018, 90, 127–140. [Google Scholar] [CrossRef]
  12. IRENA International Renewable Energy Agency. Renewable Energy Target Setting; The International Renewable Energy Agency: Abu Dhabi, United Arab Emirates, 2018. [Google Scholar]
  13. Burke, K.A. Unitized Regenerative Fuel Cell System Development. In Proceedings of the 1st International Energy Conversion Engineering Conference (IECEC), Portsmouth, VA, USA, 17–21 August 2003. [Google Scholar]
  14. Mitlitsky, F.; Myers, B.; Weisberg, A.H.; Molter, T.M.; Smith, W.F. Reversible (unitised) PEM fuel cell devices. Fuel Cells Bull. 1999, 2, 6–11. [Google Scholar] [CrossRef]
  15. Gabbasa, M.; Sopian, K.; Fudholi, A.; Asim, N. A review of unitized regenerative fuel cell stack: Material, design and research achievements. Int. J. Hydrogen Energy 2014, 39, 17765–17778. [Google Scholar] [CrossRef]
  16. Park, S.; Shao, Y.; Liu, J.; Wang, Y. Oxygen electrocatalysts for water electrolyzers and reversible fuel cells: Status and perspective. Energy Environ. Sci. 2012, 5, 9331–9344. [Google Scholar] [CrossRef]
  17. Fang, Q.; Packbier, U.; Blum, L. Long-term tests of a Jülich planar short stack with reversible solid oxide cells in both fuel cell and electrolysis modes. Int. J. Hydrogen Energy 2013, 38, 4281–4290. [Google Scholar]
  18. Guan, J.; Ramamurthi, B.; Ruud, J.; Hong, J.; Riley, P.; Minh, N. High Performance Flexible Reversible Solid Oxide Fuel Cell; Final Report for DOE Cooperative Agreement DE-FC36-04GO-14351; GE Global Research Center: Niskayuna, NY, USA, 2006. [Google Scholar]
  19. Tang, E.; Wood, T.; Benhaddad, S.; Brown, C.; He, H.; Nelson, J.; Grande, O.; Nuttall, B.; Richards, M.; Petri, R. Advanced Materials for RSOFC Dual Operation with Low Degradation; Report for United States Department of Energy; Versa Power Systems: Littleton, CO, USA, 2012. [Google Scholar]
  20. Erdle, E.; Dönitz, W.; Schamm, R.; Koch, A. Reversibility and polarization behaviour of high temperature solid oxide electrochemical cells. Int. J. Hydrogen Energy 1992, 17, 817–819. [Google Scholar] [CrossRef]
  21. Shimaki, R.; Okamoto, M.; Yanagi, C.; Kikuoka, Y.; Ueda, S.; Nakamori, N.; Kugimiya, K.; Yoshino, M.; Tokura, M.; Suda, S. Feasibility study on hydrogen-utilized electric power storage systems. In Proceedings of the World Hydrogen Energy Conference, Paris, France, 22–25 June 1992; Societe des Ingenieurs et Scientifiques de France: Paris, France, 1993; Volume 3, pp. 1927–1935. [Google Scholar]
  22. Kusunoki, D.; Kikuoka, Y.; Yanagi, V.; Kugimiya, K.; Yoshino, M.; Tokura, M.; Watanabe, K.; Miyamoto, H.; Ueda, S.; Tokunaga, S.; et al. Development of Mitsubishi-planar reversible cell—Fundamental test on hydrogen-utilized electric power storage system. Int. J. Hydrogen Energy 1995, 20, 831–834. [Google Scholar] [CrossRef]
  23. Biswas, S.; Kulkarni, A.; Giddey, S.; Bhattacharya, S.J.E.R. A Review on Synthesis of Methane as a Pathway for Renewable Energy Storage with a Focus on Solid Oxide Electrolytic Cell-Based Processes. Front. Front. Energy Res. 2020, 8, 570112. [Google Scholar] [CrossRef]
  24. Wendel, C.H.; Braun, R.J. Design and techno-economic analysis of high efficiency reversible solid oxide cell systems for distributed energy storage. Appl. Energy 2016, 172, 118–131. [Google Scholar] [CrossRef]
  25. Luo, X.; Wang, J.; Dooner, M.; Clarke, J. Overview of current development in electrical energy storage technologies and the application potential in power system operation. Appl. Energy. 2015, 137, 511–536. [Google Scholar] [CrossRef] [Green Version]
  26. Hadjipaschalis, I.; Poullikkas, A.; Efthimiou, V. Overview of current and future energy storage technologies for electric power applications. Renew. Sustain. Energy Rev. 2009, 13, 1513–1522. [Google Scholar] [CrossRef]
  27. Liu, S.; Wei, L.; Wang, H. Review on reliability of supercapacitors in energy storage applications. Appl. Energy 2020, 278, 115436. [Google Scholar] [CrossRef]
  28. Olabi, A.; Wilberforce, T.; Ramadan, M.; Abdelkareem, M.A.; Alami, A.H. Compressed air energy storage systems: Components and operating parameters–A review. J. Energy Storage 2020, 34, 102000. [Google Scholar] [CrossRef]
  29. Li, X.; Palazzolo, A. A review of flywheel energy storage systems: State of the art and opportunities. arXiv 2021, arXiv:210305224. preprint. [Google Scholar]
  30. Valøen, L.O.; Shoesmith, M.I. The effect of PHEV and HEV duty cycles on battery and battery pack performance. In Proceedings of the Plug-In Hybrid Electric Vehicle Conference: Where the Grid Meets the Road, Winnipeg, MB, Canada, 1–2 November 2007. [Google Scholar]
  31. El Kharbachi, A.; Zavorotynska, O.; Latroche, M.; Cuevas, F.; Yartys, V.; Fichtner, M. Exploits, advances and challenges benefiting beyond Li-ion battery technologies. J. Alloys Compd. 2020, 817, 153261. [Google Scholar] [CrossRef]
  32. Weber, A.Z.; Mench, M.M.; Meyers, J.P.; Ross, P.N.; Gostick, J.T.; Liu, Q. Redox flow batteries: A review. J. Appl. Electrochem. 2011, 41, 137. [Google Scholar] [CrossRef] [Green Version]
  33. Sánchez-Díez, E.; Ventosa, E.; Guarnieri, M.; Trovò, A.; Flox, C.; Marcilla, R.; Soavi, F.; Mazur, P.; Aranzabe, E.; Ferret, R. Redox flow batteries: Status and perspective towards sustainable stationary energy storage. J. Power Source 2021, 481, 228804. [Google Scholar] [CrossRef]
  34. Martinez-Bolanos, J.R.; Udaeta, M.E.M.; Gimenes, A.L.V.; da Silva, V.O. Economic feasibility of battery energy storage systems for replacing peak power plants for commercial consumers under energy time of use tariffs. J. Energy Storage 2020, 29, 101373. [Google Scholar] [CrossRef]
  35. Song, S.; Zhang, H.; Ma, X.; Shao, Z.-G.; Zhang, Y.; Yi, B. Bifunctional oxygen electrode with corrosion-resistive gas diffusion layer for unitized regenerative fuel cell. Electrochem. Commun. 2006, 8, 399–405. [Google Scholar] [CrossRef]
  36. Yim, S.D.; Lee, W.Y.; Yoon, Y.G.; Sohn, Y.J.; Park, G.G.; Yang, T.H.; Kim, C.S. Optimization of bifunctional electrocatalyst for PEM unitized regenerative fuel cell. Electrochim. Acta 2004, 50, 713–718. [Google Scholar] [CrossRef]
  37. Carmo, M.; Fritz, D.L.; Mergel, J.; Stolten, D. A comprehensive review on PEM water electrolysis. Int. J. Hydrogen Energy 2013, 38, 4901–4934. [Google Scholar] [CrossRef]
  38. Yao, W.; Yang, J.; Wang, J.; Nuli, Y. Chemical deposition of platinum nanoparticles on iridium oxide for oxygen electrode of unitized regenerative fuel cell. Electrochem. Commun. 2007, 9, 1029–1034. [Google Scholar] [CrossRef]
  39. Wu, J.; Yuan, X.Z.; Martin, J.J.; Wang, H.; Zhang, J.; Shen, J.; Merida, W.; Wu, S. A review of PEM fuel cell durability: Degradation mechanisms and mitigation strategies. J. Power Source 2008, 184, 104–119. [Google Scholar] [CrossRef]
  40. Doenitz, W.; Schmidberger, R. Concepts and design for scaling up high temperature water vapour electrolysis. Int. J. Hydrogen Energy 1982, 7, 321–330. [Google Scholar] [CrossRef]
  41. Hauch, A.; Jensen, S.H.; Ramousse, S.; Mogensen, M. Performance and durability of solid oxide electrolysis cells. J. Electrochem. Soc. 2006, 153, A1741–A1747. [Google Scholar] [CrossRef] [Green Version]
  42. Wang, Y.; Leung, D.Y.; Xuan, J.; Wang, H. A review on unitized regenerative fuel cell technologies, part-A: Unitized regenerative proton exchange membrane fuel cells. Renew. Sustain. Energy Rev. 2016, 65, 961–977. [Google Scholar] [CrossRef]
  43. Ebbesen, S.D.; Mogensen, M. Electrolysis of carbon dioxide in solid oxide electrolysis cells. J. Power Sources 2009, 193, 349–358. [Google Scholar] [CrossRef]
  44. Xu, S.; Li, S.; Yao, W.; Dong, D.; Xie, K. Direct electrolysis of CO2 using an oxygen-ion conducting solid oxide electrolyzer based on La0. 75Sr0. 25Cr0. 5Mn0. 5O3−δ electrode. J. Power Sources 2013, 230, 115–121. [Google Scholar] [CrossRef]
  45. Laguna-Bercero, M. Recent advances in high temperature electrolysis using solid oxide fuel cells: A review. J. Power Sources 2012, 203, 4–16. [Google Scholar] [CrossRef] [Green Version]
  46. Graves, C.; Ebbesen, S.D.; Mogensen, M. Co-electrolysis of CO2 and H2O in solid oxide cells: Performance and durability. Solid State Ionic. 2011, 192, 398–403. [Google Scholar] [CrossRef]
  47. Smart, W.; Weissbart, J. Study of Electrolytic Dissociation of Co2-H2o Using a Solid Oxide Electrolyte; NASA: Washington, DC, USA, 1967. [Google Scholar]
  48. Ilbas, M.; Kumuk, B.; Alemu, M.A.; Arslan, B. Numerical investigation of a direct ammonia tubular solid oxide fuel cell in comparison with hydrogen. Int. J. Hydrogen Energy 2020, 45, 35108–35117. [Google Scholar] [CrossRef]
  49. Wang, L.; Zhang, Y.; Pérez-Fortes, M.; Aubin, P.; Lin, T.E.; Yang, Y.; Maréchal, F. Reversible solid-oxide cell stack based power-to-x-to-power systems: Comparison of thermodynamic performance. Appl. Energy 2020, 275, 115330. [Google Scholar] [CrossRef]
  50. Lan, R.; Irvine, J.T.; Tao, S. Ammonia and related chemicals as potential indirect hydrogen storage materials. Int. J. Hydrogen Energy 2012, 37, 1482–1494. [Google Scholar] [CrossRef]
  51. Aziz, M.; Wijayanta, A.T.; Nandiyanto, A.B.D. Ammonia as effective hydrogen storage: A review on production, storage and utilization. Energies 2020, 13, 3062. [Google Scholar] [CrossRef]
  52. Blum, L.; Deja, R.; Peters, R.; Stolten, D. Comparison of efficiencies of low, mean and high temperature fuel cell systems. Int. J. Hydrogen Energy 2011, 36, 11056–11067. [Google Scholar] [CrossRef]
  53. Rönsch, S.; Schneider, J.; Matthischke, S.; Schlüter, M.; Götz, M.; Lefebvre, J.; Prabhakaran, P.; Bajohr, S. Review on methanation–From fundamentals to current projects. Fuel 2016, 166, 276–296. [Google Scholar] [CrossRef]
  54. Meloni, E.; Martino, M.; Palma, V. A short review on Ni based catalysts and related engineering issues for methane steam reforming. Catalysts 2020, 10, 352. [Google Scholar] [CrossRef] [Green Version]
  55. Gür, T.M. Comprehensive review of methane conversion in solid oxide fuel cells: Prospects for efficient electricity generation from natural gas. Prog. Energy Combust. Sci. 2016, 54, 1–64. [Google Scholar] [CrossRef] [Green Version]
  56. Hacker, V.; Kordesch, K. Ammonia Crackers. In Handbook of Fuel Cells; John Wiley & Sons, Inc.: Hoboken, NJ, USA, 2010. [Google Scholar] [CrossRef]
  57. Fournier, G.G.M.; Cumming, I.W.; Hellgardt, K. High performance direct ammonia solid oxide fuel cell. J. Power Sources 2006, 162, 198–206. [Google Scholar] [CrossRef]
  58. Ruhnau, O.; Hirth, L.; Praktiknjo, A. Time series of heat demand and heat pump efficiency for energy system modeling. Sci. Data 2019, 6, 1–10. [Google Scholar] [CrossRef]
  59. Dokiya, M. SOFC system and technology. Solid State Ionic. 2002, 152, 383–392. [Google Scholar] [CrossRef]
  60. Hauch, A.; Küngas, R.; Blennow, P.; Hansen, A.B.; Hansen, J.B.; Mathiesen, B.V.; Mogensen, M.B. Recent advances in solid oxide cell technology for electrolysis. Science 2020, 370, eaba6118. [Google Scholar] [CrossRef]
  61. Wang, Z.; Mori, M.; Araki, T. Steam electrolysis performance of intermediate-temperature solid oxide electrolysis cell and efficiency of hydrogen production system at 300 Nm3 h−1. Int. J. Hydrogen Energy 2010, 35, 4451–4458. [Google Scholar] [CrossRef]
  62. Diethelm, S.; Herle, J.V.; Montinaro, D.; Bucheli, O. Electrolysis and Co-electrolysis performance of SOE short stacks. Fuel Cells 2013, 13, 631–637. [Google Scholar] [CrossRef]
  63. Giglio, E.; Lanzini, A.; Santarelli, M.; Leone, P. Synthetic natural gas via integrated high-temperature electrolysis and methanation: Part I—Energy performance. J. Energy Storage 2015, 1, 22–37. [Google Scholar] [CrossRef]
  64. Santhanam, S.; Heddrich, M.P.; Riedel, M.; Friedrich, K.A. Theoretical and experimental study of Reversible Solid Oxide Cell (r-SOC) systems for energy storage. Energy 2017, 141, 202–214. [Google Scholar] [CrossRef]
  65. Peters, R.; Deja, R.; Engelbracht, M.; Frank, M.; Blum, L.; Stolten, D. Efficiency analysis of a hydrogen-fueled solid oxide fuel cell system with anode off-gas recirculation. J. Power Source 2016, 328, 105–113. [Google Scholar] [CrossRef]
  66. Peters, R.; Blum, L.; Deja, R.; Hoven, I.; Tiedemann, W.; Küpper, S.; Stolten, D. Operation experience with a 20 kW SOFC system. Fuel Cells 2014, 14, 489–499. [Google Scholar] [CrossRef]
  67. Liso, V.; Olesen, A.C.; Nielsen, M.P.; Kær, S.K. Performance comparison between partial oxidation and methane steam reforming processes for solid oxide fuel cell (SOFC) micro combined heat and power (CHP) system. Energy 2011, 36, 4216–4226. [Google Scholar] [CrossRef]
  68. Baniasadi, E.; Dincer, I. Energy and exergy analyses of a combined ammonia-fed solid oxide fuel cell system for vehicular applications. Int. J. Hydrogen Energy 2011, 36, 11128–11136. [Google Scholar] [CrossRef]
  69. Kishimoto, M.; Muroyama, H.; Suzuki, S.; Saito, M.; Koide, T.; Takahashi, Y.; Okabe, A.; Ueguchi, S.; Jun, M.; Eguchi, K.; et al. Development of 1 kW-class Ammonia-fueled Solid Oxide Fuel Cell Stack. Fuel Cells 2020, 20, 80–88. [Google Scholar] [CrossRef]
  70. Giddey, S.; Badwal, S.; Munnings, C.; Dolan, M. Ammonia as a renewable energy transportation media. ACS Sustain. Chem. Eng. 2017, 5, 10231–10239. [Google Scholar] [CrossRef]
  71. Perna, A.; Minutillo, M.; Jannelli, E. Designing and analyzing an electric energy storage system based on reversible solid oxide cells. Energy Convers. Manag. 2018, 159, 381–395. [Google Scholar] [CrossRef]
  72. Clausen, L.R. Energy efficient thermochemical conversion of very wet biomass to biofuels by integration of steam drying, steam electrolysis and gasification. Energy 2017, 125, 327–336. [Google Scholar] [CrossRef] [Green Version]
  73. Laosiripojana, N.; Assabumrungrat, S. Catalytic steam reforming of methane, methanol, and ethanol over Ni/YSZ: The possible use of these fuels in internal reforming SOFC. J. Power Source 2007, 163, 943–951. [Google Scholar] [CrossRef]
  74. Andersson, M.; Paradis, H.; Yuan, J.; Sundén, B. Review of catalyst materials and catalytic steam reforming reactions in SOFC anodes. Int. J. Energy Res. 2011, 35, 1340–1350. [Google Scholar] [CrossRef] [Green Version]
  75. Guerra, C.F.; Reyes-Bozo, L.; Vyhmeister, E.; Caparrós, M.J.; Salazar, J.L.; Clemente-Jul, C. Technical-economic analysis for a green ammonia production plant in Chile and its subsequent transport to Japan. Renew. Energy 2020, 157, 404–414. [Google Scholar] [CrossRef]
  76. Yang, J.; Molouk, A.F.S.; Okanishi, T.; Muroyama, H.; Matsui, T.; Eguchi, K. A stability study of Ni/Yttria-stabilized zirconia anode for direct ammonia solid oxide fuel cells. ACS Appl. Mater. Interfaces 2015, 7, 28701–28707. [Google Scholar] [CrossRef]
  77. Hashinokuchi, M.; Zhang, M.; Doi, T.; Inaba, M. Enhancement of anode activity and stability by Cr addition at Ni/Sm-doped CeO2 cermet anodes in NH3-fueled solid oxide fuel cells. Solid State Ion. 2018, 319, 180–185. [Google Scholar] [CrossRef]
  78. Brown, T. Green Ammonia: Haldor Topsoe’s Solid Oxide Electrolyzer; Ammonia Industry: Brooklyn, NY, USA, 2019. [Google Scholar]
  79. MacFarlane, D.R.; Cherepanov, P.V.; Choi, J.; Suryanto, B.H.; Hodgetts, R.Y.; Bakker, J.M.; Ferrero Vallana, F.M.; Simonov, A.N. A roadmap to the ammonia economy. Joule 2020, 4, 1186–1205. [Google Scholar] [CrossRef]
  80. Cormos, A.-M.; Szima, S.; Fogarasi, S.; Cormos, C.-C. Economic assessments of hydrogen production processes based on natural gas reforming with carbon capture. Chem. Eng. Trans. 2018, 70, 1231–1236. [Google Scholar]
  81. Keipi, T.; Tolvanen, H.; Konttinen, J. Economic analysis of hydrogen production by methane thermal decomposition: Comparison to competing technologies. Energy Convers. Manag. 2018, 159, 264–273. [Google Scholar] [CrossRef]
  82. Iskov, H.; Kvist, T.; Bruun, J. Biogas, Biomethane and Electro-Methane Cost Comparison. Master’s Thesis, University of Gävle, Gävle, Sweden, 2019. [Google Scholar]
  83. Mogensen, M.; Chen, M.; Frandsen, H.; Graves, C.; Hansen, J.; Hansen, K.; Hauch, A.; Jacobsen, T.; Jensen, S.H.; Skafte, T.L.; et al. Reversible solid-oxide cells for clean and sustainable energy. Clean Energy 2019, 3, 175–201. [Google Scholar] [CrossRef]
  84. Eguchi, K.; Hatagishi, T.; Arai, H. Power generation and steam electrolysis characteristics of an electrochemical cell with a zirconia-or ceria-based electrolyte. Solid State Ion. 1996, 86, 1245–1249. [Google Scholar] [CrossRef]
  85. Momma, A.; Kaga, Y.; Takano, K.; Nozaki, K.; Negishi, A.; Kato, K.; Inagaki, T.; Yoshida, H.; Hoshino, K.; Akikusa, J.; et al. Experimental investigation of anodic gaseous concentration of a practical seal-less solid oxide fuel cell. J. Power Source 2005, 145, 169–177. [Google Scholar] [CrossRef]
  86. Schiller, G.; Ansar, A.; Lang, M.; Patz, O. High temperature water electrolysis using metal supported solid oxide electrolyser cells (SOEC). J. Appl. Electrochem. 2009, 39, 293–301. [Google Scholar] [CrossRef] [Green Version]
  87. Menzler, N.H.; Tietz, F.; Uhlenbruck, S.; Buchkremer, H.P.; Stöver, D. Materials and manufacturing technologies for solid oxide fuel cells. J. Mater. Sci. 2010, 45, 3109–3135. [Google Scholar] [CrossRef]
  88. Sohal, M.S.; O’Brien, J.E.; Stoots, C.M.; Sharma, V.I.; Yildiz, B.; Virkar, A. Degradation issues in solid oxide cells during high temperature electrolysis. J. Fuel Cell Sci. Technol. 2012, 9, 011017. [Google Scholar] [CrossRef]
  89. Green, R.D.; Liu, C.-C.; Adler, S.B. Carbon dioxide reduction on gadolinia-doped ceria cathodes. Solid State Ion. 2008, 179, 647–660. [Google Scholar] [CrossRef] [Green Version]
  90. Addo, P.K.; Molero-Sanchez, B.; Buyukaksoy, A.S.; Birss, V. Sulfur Tolerance of La0. 3M0. 7Fe0. 7Cr0. 3O3-δ (M = Sr, Ca) Solid Oxide Fuel Cell Anodes. ECS Trans. 2015, 66, 219–228. [Google Scholar] [CrossRef]
  91. Lee, S.; Kim, G.; Vohs, J.M.; Gorte, R.J. SOFC anodes based on infiltration of La0. 3Sr0. 7TiO3. J. Electrochem. Soc. 2008, 155, B1179–B1183. [Google Scholar] [CrossRef]
  92. Kim, G.; Corre, G.; Irvine, J.; Vohs, J.M.; Gorte, R.J. Engineering composite oxide SOFC anodes for efficient oxidation of methane. Electrochem. Solid State Lett. 2008, 11, B16–B19. [Google Scholar] [CrossRef] [Green Version]
  93. Molero-Sánchez, B.; Addo, P.; Buyukaksoy, A.; Paulson, S.; Birss, V. Electrochemistry of La0. 3Sr0. 7Fe0. 7Cr0. 3O3− δ as an oxygen and fuel electrode for RSOFCs. Faraday Discuss. 2015, 182, 159–175. [Google Scholar] [CrossRef]
  94. Chen, M.; Paulson, S.; Thangadurai, V.; Birss, V. Sr-rich chromium ferrites as symmetrical solid oxide fuel cell electrodes. J. Power Source 2013, 236, 68–79. [Google Scholar] [CrossRef]
  95. Haag, J.M.; Bierschenk, D.M.; Barnett, S.A.; Poeppelmeier, K.R. Structural, chemical, and electrochemical characteristics of LaSr2Fe2CrO9-δ-based solid oxide fuel cell anodes. Solid State Ion. 2012, 212, 1–5. [Google Scholar] [CrossRef]
  96. Myung, J.-H.; Ko, H.J.; Im, C.H.; Moon, J.; Hyun, S.-H. Development of solid oxide fuel cells (SOFCs) by tape-casting and single-step co-firing of monolithic laminates. Int. J. Hydrogen Energy. 2014, 39, 2313–2319. [Google Scholar] [CrossRef]
  97. Yoon, K.J.; Ye, G.; Gopalan, S.; Pal, U.B. Cost-effective single step cofiring process for manufacturing solid oxide fuel cells using HSC™ anode. J. Fuel Cell Sci. Technol. 2010, 7, 021010. [Google Scholar] [CrossRef]
  98. Liu, M.; Dong, D.; Zhao, F.; Gao, J.; Ding, D.; Liu, X.; Meng, G. High-performance cathode-supported SOFCs prepared by a single-step co-firing process. J. Power Source 2008, 182, 585–588. [Google Scholar] [CrossRef]
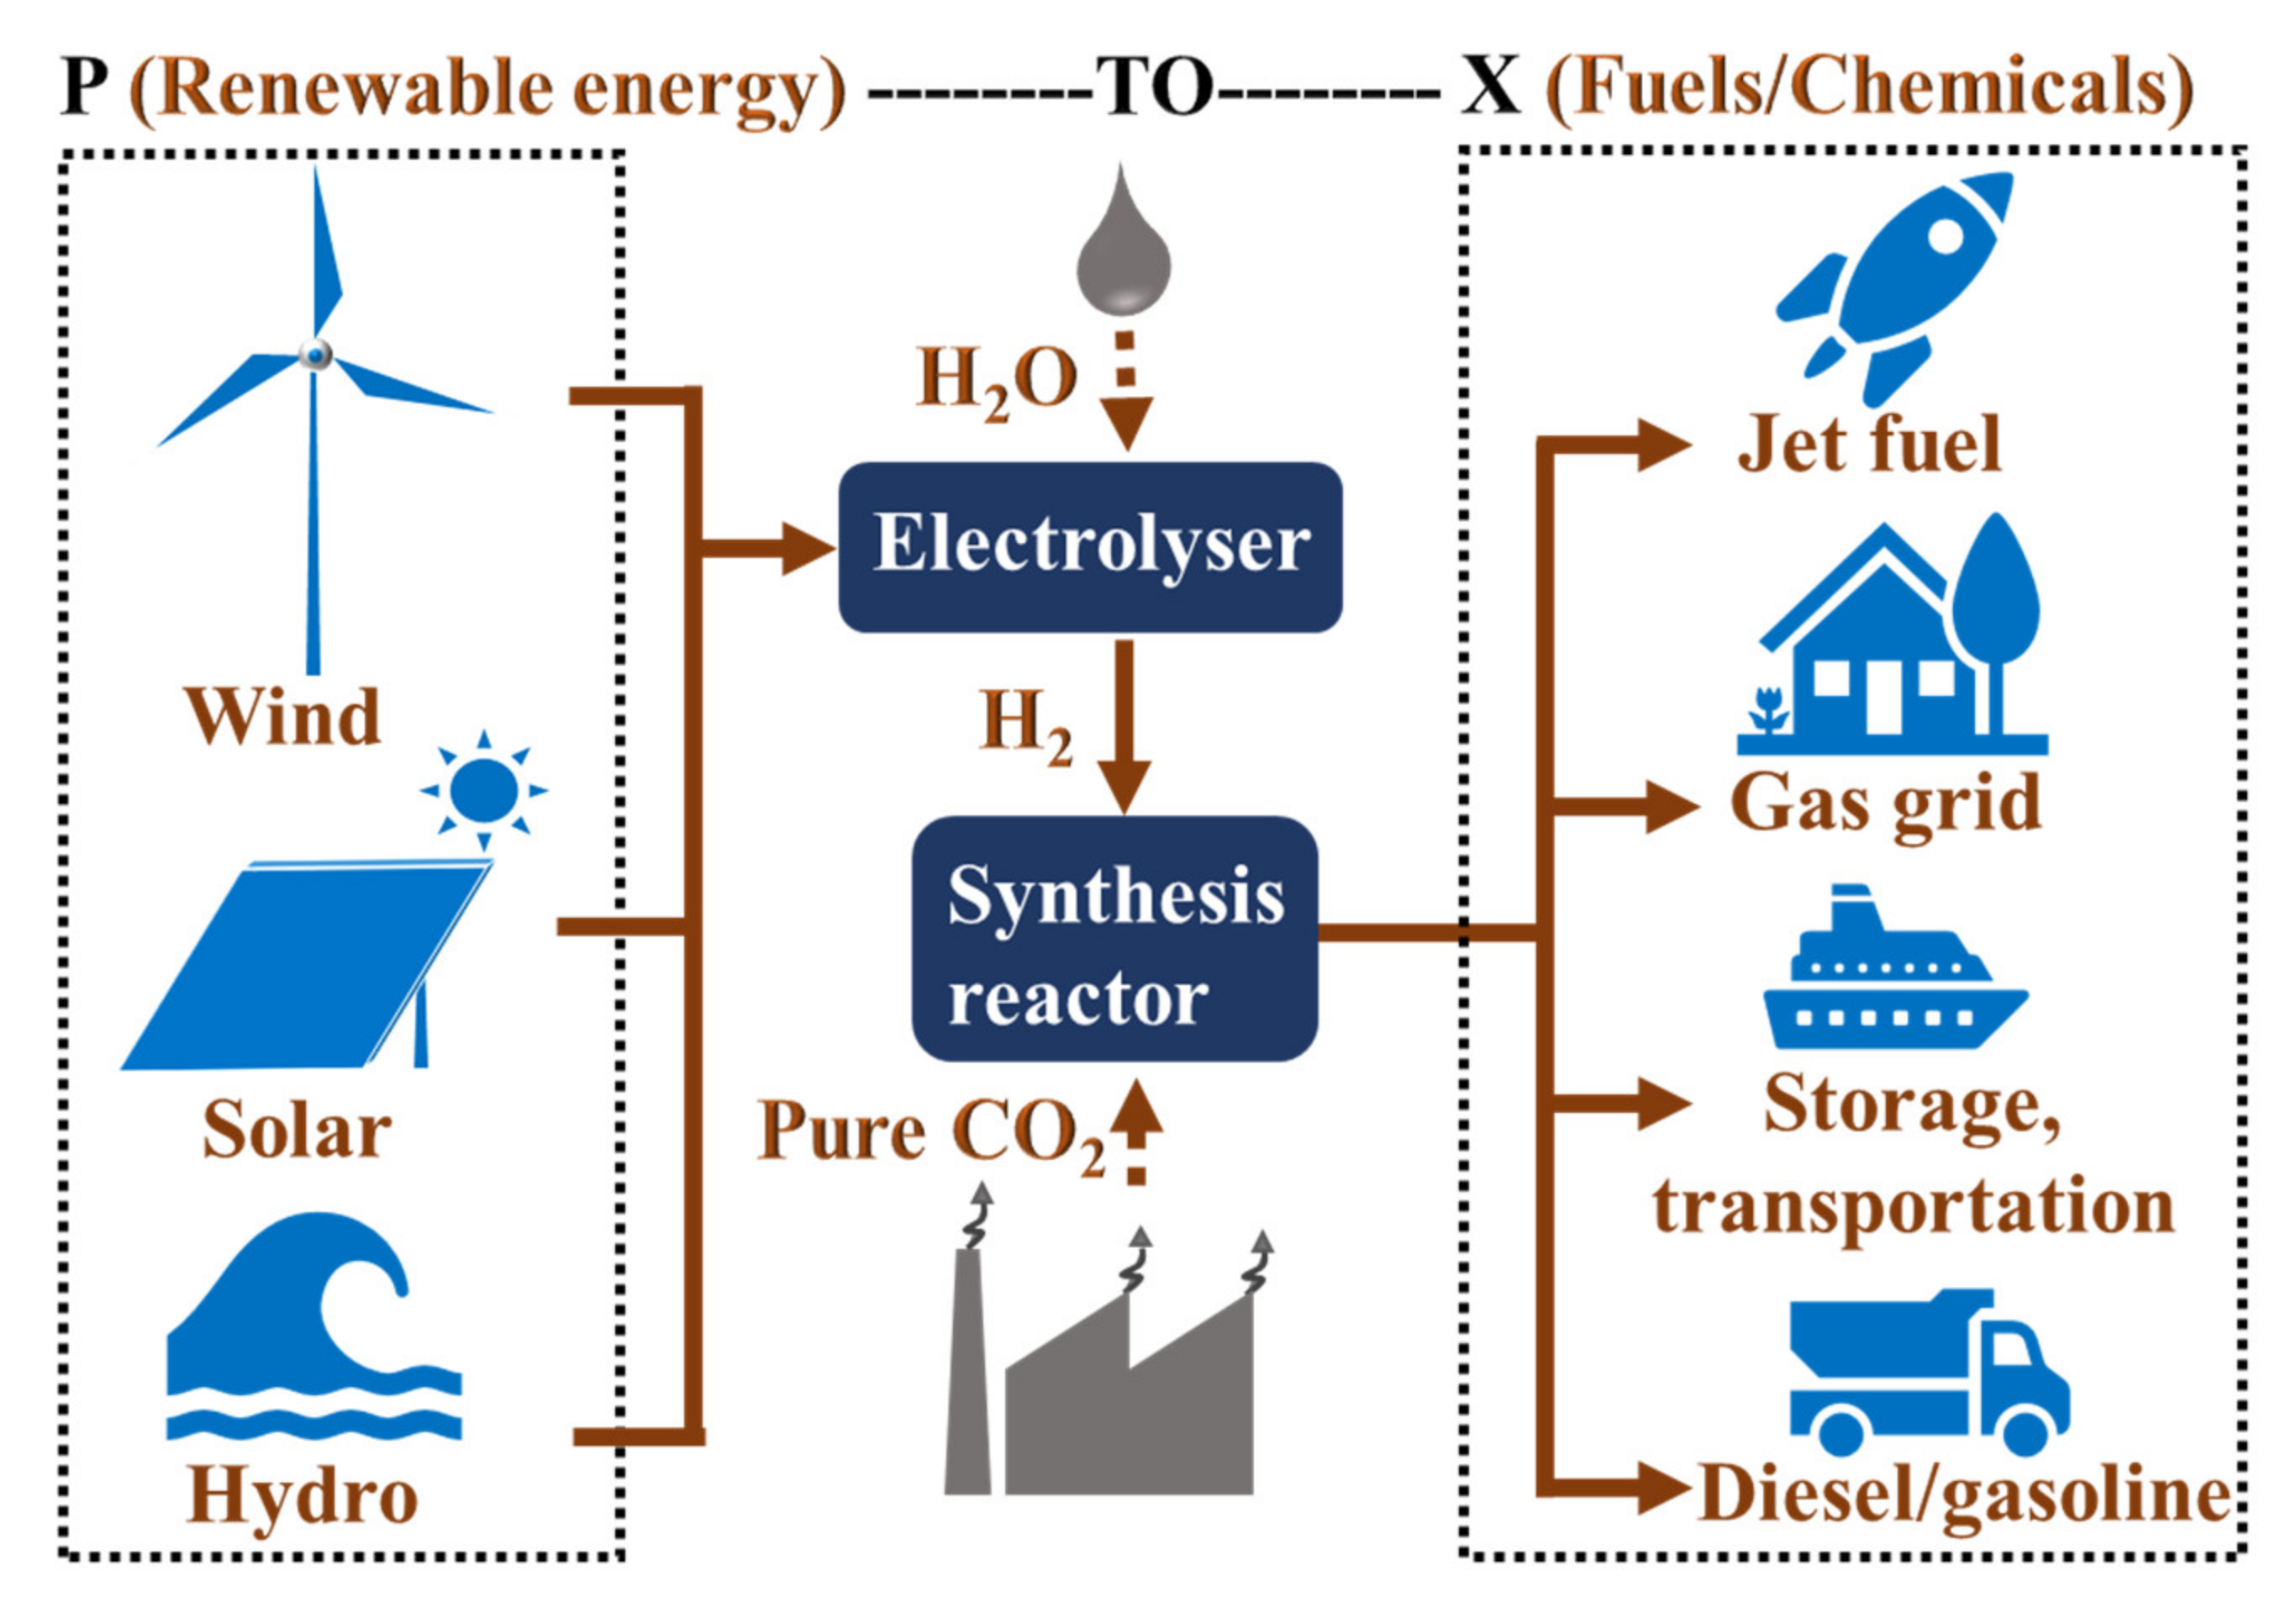
Figure 1. Schematic of power-to-X technology.
Energies 14 04517 g001
Figure 2. Different mediums for electrical energy storage (A) with corresponding round-trip energy efficiency (C) for each medium and the rated capacity as a function of discharge time (B).
Energies 14 04517 g002
Figure 3. Solid oxide cell (SOC) operation in fuel cell mode (A) and electrolysis mode (B).
Energies 14 04517 g003
Figure 4. Schematic of how reversible solid oxide cells can be operated for the synthesis and utilization of three different fuels (H2, CH4, and NH3) in the electrolysis mode and fuel cell mode respectively. Processes 1, 2, and 3 show H2, CH4, and NH3 based operations. Red dotted lines/arrows represent electrolysis mode and green solid lines/arrows represent fuel cell mode.
Energies 14 04517 g004
Figure 5. Block diagram showing the methodology of the energy calculation for each of the processes described here.
Energies 14 04517 g005
Figure 6. Energy efficiencies of electrolysis mode operation, ηX (A) and fuel cell mode operation, ηP (B) along with round-trip efficiency, ηRTE (C) of hydrogen, methane, and ammonia fueled reversible solid oxide cells.
Energies 14 04517 g006
Table 1. Operating conditions and other specifications of hydrogen, methane, and ammonia-fueled reversible solid oxide cell systems.
Variable or ParameterValue
SOC temperature, °C800
SOEC electrical efficiency, %90
SOFC electrical efficiency, %50
Ambient temperature, °C298
Oxygen storage temperature, °C298
Methanation reactor temperature, °C250 [49]
Methanation reactor pressure, bars25 [49]
Methanation process efficiency, %75 [53]
Methane reformer temperature, °C800 [54]
Methane reformer pressure, bars25 [54]
Methane reforming process efficiency, %78 [54]
Internal reforming conversion, %90 [55]
Haber Bosch reactor temperature, °C400 [50]
Haber Bosch reactor pressure, bars200 [50]
Haber Bosch process efficiency, %66 [50]
Ammonia cracker temperature, °C800 [55]
Ammonia cracker pressure, bar1 [56]
Ammonia cracking efficiency, %90 [57]
Ammonia internal cracking conversion, %85 [57]
Heat pump efficiency, %90 [58]
Table 2. Break up of cost estimation for hydrogen (SOEC mode) and electricity (SOFC mode) production via process 1. All prices are in USD.
Parameters for SOEC ModeValue
H2 production rate, tons per year4400.00
Electrolyser lifetime (projected), years3.42
H2 produced over lifetime, tons15,068.49
Energy content of H2, kWh/kg33.33
Energy content of H2 produced over lifetime, GWh502.23
SOEC conversion efficiency, %90.00
SOEC system efficiency (with heat integration), %90.00
Electrical input required for SOEC over lifetime, GWh620.04
Capacity factor, % [82]69.00
Hours of operation (Electrolyser ON), hours20,700
SOC size, MW43.41
SOC capex, $ per kW [83]450.00
Cost of SOC for target, M$19.53
Electricity cost, cents per kWh1.50
Total electricity cost, M$9.30
Total cost of H2, M$28.83
Cost of H2 produced, $ per kg1.91
Parameters for SOFC ModeValue
Electricity produced over life, GWh500.00
SOFC conversion efficiency, %90.00
SOFC system efficiency (with heat integration), %69.00
Hydrogen input energy required for SOFC over lifetime, GWh805.15
Capacity factor, % [82]69.00
Hours of operation (Electrolyser ON), hours20,700
SOC size, MW56.37
SOC capex, $ per kW [82]450.00
Cost of SOC for target, M$25.36
Total cost of electricity, M$26.17
Cost of electricity generated, $ per MWh52.34
Table 3. Break up of cost estimation for methane (SOEC mode) and electricity (SOFC mode) production via process 2. All prices are in USD.
Parameters for SOEC ModeValue
H2 production rate, tons per year4400.00
Syngas production rate, tons per year29,333.00
Methane produced from syngas at 85% conversion, tons per year9035.00
Electrolyser lifetime (projected), years3.42
syngas produced over lifetime, tons100,456.62
CO2 removed over lifetime, tons110,502.28
Methane produced over lifetime, tons30,940.64
Energy content of H2, kWh per kg33.33
Energy content of CO, kWh per kg2.80
Energy content of syngas, kWh per kg7.99
Energy content of syngas produced over lifetime, GWh802.66
SOEC system efficiency (with heat integration), %90.00
Electrical Input required for SOEC over lifetime, MWh891.84
Capacity factor, % [82]69.00
Hours of operation (Electrolyser ON), hours20,700.00
SOC size, MW62.44
SOC capex, $ per kW [82]450.00
Cost of SOC for target, M$28.10
Cost of methanation plant, per kW [82]1056.00
Cost of methanation, M$65.96
Electricity cost, cents per kWh1.50
Total electricity cost, M$13.37
CO2 cost at 43.09$ per ton, M$ [82]4.76
Total cost of methane produced, M$112.20
Cost of methane produced, $ per kg3.63
Parameters for SOFC ModeValue
Electrolyser lifetime (projected), hours30,000.00
Electrical energy produced over lifetime, GWh500.00
SOFC system efficiency (with heat integration and internal reforming), %70.20
Syngas energy Input required for SOFC over lifetime, GWh793.65
Capacity factor, % [82]69.00
Hours of operation (Electrolyser ON), hours20,700
SOC size, MW49.87
SOC capex, $ per kW [82]450.00
Cost of electrolyser for target, M$22.44
Total cost of electricity, M$23.15
Cost of electricity generated, $ per MWh46.30
Table 4. Break up of cost estimation for ammonia (SOEC mode) and electricity (SOFC mode) production via process 3. All prices are in USD.
Parameters for SOEC ModeValue
H2 production rate, tons per year4400.00
Ammonia produced from H2, tons per year24,185.00
Electrolyser lifetime (projected), years3.42
Ammonia produced over lifetime, tons80,341.69
Energy content of ammonia, kWh per kg5.21
Energy content of ammonia produced over life, GWh418.42
SOEC system efficiency (with heat integration), %90.00
Electrical input required for SOEC over lifetime, GWh464.91
Capacity factor, % [82]69.00
Hours of operation (Electrolyser ON), hours20,700.00
Electrolyser size, MW32.55
SOC capex, $ per kW [82]450.00
Cost of SOC for target, M$14.65
Cost of Haber Bosch unit, $ per kW [76]512
Cost of ammonia synthesis in Haber Bosch unit, $16.65
Electricity cost, cents per kWh1.50
Total electricity cost, M$6.97
Total cost of ammonia, M$38.27
Cost of ammonia, $ per kg0.48
Parameters for SOFC ModeValue
Electrolyser lifetime (projected), hours30,000
Electrical energy produced over lifetime, GWh500.00
SOFC system efficiency (with heat integration and internal cracking), %69.00
Ammonia energy Input required for SOFC over lifetime, GWh724.63
Capacity factor, % [82]69.00
Hours of operation (Electrolyser ON), hours20,700
SOC size, MW50.73
SOC capex, per kW [82]450.00
Cost of SOC for target, M$22.83
Total cost of electricity, M$23.55
Cost of electricity, $ per MWh47.11
Publisher’s Note: MDPI stays neutral with regard to jurisdictional claims in published maps and institutional affiliations.