Abstract
The internal fractures in coal and rock mass are important factors affecting the safety of underground engineering such as coalbed methane exploitation, so the comprehensive properties of materials used to seal the fractures are particularly critical. In this paper, firstly, the indexes of the main factors affecting the plugging material (viscosity, bleeding rate, setting time, and strength) were analyzed. Then, the sensitivity of the materials used to seal the fractures was studied and discussed using a principal component analysis and response surface analysis (RSM-PCA). The primary conclusions are as follows: (1) Bleed rate and setting time were the first principal components affecting the comprehensive properties of the plugging materials, and compressive strength was the second principal component. (2) The regression equation was established to characterize the comprehensive properties of the integrated plugging materials, and the optimal mix ratio was 34% of cement content, 11% of sand content, and 0.53 of the W/C. (3) The microscopic results showed that the silicate minerals in the consolidated body grow in a bridging manner and formed a mixed gel with cement hydration product to fill the pores and microcracks and improved the interface transition zone.
1. Introduction
Under the influence of coal mining activities, the structure of the coal strata is damaged, and the stress redistribution of the original rock leads to fracture propagation. The continuous expansion of the fracture causes an increase in the porosity and permeability of the coal–rock mass and promotes the outburst of coalbed methane. The gas existing in the coal and rock layers flows into the working face along the fracture, causing gas outburst accidents [1,2]. When coal mining activities are close to the aquifer, strong mining disturbances lead to the initiation, expansion, development, and penetration of fractures. A large amount of water pours into the coal mining face along the fissures and causes flooding accidents. [3,4]. The strong mining disturbance makes the coal and rock strata produce fracture. Under the action of in-situ stress, fractures continue to develop, which makes the fluid flow into the working face area through a fracture, and then causes major accidents such as coal, gas, and water disasters [5]. In recent years, China’s coal industry has entered a stage of in-depth resource development. Affected by the high ground stress in the deep, the threat of gas outbursts and mine water hazards is increasing [6,7]. The grouting and reinforcement of the rock mass is one of the important techniques for sealing fissures, and it plays a vital role in coal mine safety production. Xu and Zuo [8] analyzed the coagulation characteristics and plugging mechanism of the slurry, indicating that the three-state change of continuous evolution of the slurry is the key to the success of water plugging. Apparently, Song [9] obtained that the grouting mechanism was actually that water and grouting-coupled seepage was formed under the impact of grouting on the water seepage in the fractured rock mass by combining the theoretical analysis and experiments. The flow and penetration of grouts depend on grouting materials and the reasonable ratios of the karst fissures. The flow and penetration of the grout depend on the choice of grouting material and the reasonable ratio of karst fissures.
Domestic and foreign scholars have conducted abundant research on the proportion of grouting materials through experiments. By controlling the ratio of additives to water and adding different proportions of fly ash and slag to magnesium phosphate cement, Liu and Chen [10] invented a cement-based grouting material with excellent performance and no pollution to the environment. Based on the principle of using as much waste as possible, Zhu et al. [11] optimized the content of waste rubber particles, fly ash, and other materials through single-factor experiments and prepared a mine floor reinforcement material that provided a reference for the treatment of solid waste. Although a single-factor experiment can intuitively reflect the influence of the variables on the results, it assumes that there is no interaction between the variables and has great limitations. An efficient and fast method is an orthogonal experiment, which can reduce the experimental work. Duan et al. [12] optimized the cement slurry and chemical materials by an orthogonal experiment method to obtain a new type of composite grouting material that provided a reference for the development of grouting water plugging and drilling water seepage materials. Xu et al. [13] studied the improvement of the performance of ultrafine cement grout with different proportions of auxiliary materials through orthogonal experiments and provided theoretical guidance for the transformation of grouting materials. Zhang et al. [14] used orthogonal experiments to optimize the cement grouting materials with different additives and developed a new type of nanocomposite plasticity grouting material to provide a new guide for groundwater gushing disasters. The above research showed the optimal ratio of one or several properties of grouting materials. The physical properties of the slurry are related to multiple performance indicators to better indicate the performance of the slurry. We propose a new index that expresses the performance of the slurry, namely the comprehensive performance of the slurry. Through the analysis and processing of various index data, the equation that characterizes the comprehensive performance of the slurry is obtained, and the overall index of the slurry is quantified.
It is worth noting that the orthogonal experimental design method saves time and workload; a functional relationship cannot be found between different slurry components and measured indexes, so it is difficult to determine the optimal ratio to optimize the slurry performance in the whole region [15]. The response surface method (RSM) as a statistical experimental method for optimizing random processes is widely used in system dynamics and various biological process optimizations. It is an analysis tool to find the optimal response value by considering multiple influencing factors at the same time and could establish a functional relationship between the influencing factors and the response value [16]. Based on this advantage, this research attempted to developed plasticity grouting material formulations based on the response surface experimental method combined with a principal component analysis (PCA).
The plasticity of the slurry is mainly affected by the basic properties of the slurry (water separation rate, viscosity, setting time, and strength of the consolidated body). By changing the ratio of materials to optimize a certain property of the slurry, it will inevitably cause a change of the other properties, and then, the plasticity of the slurry will be affected. To obtain the optimal ratio of the slurry, the basic properties of a cement-based slurry, including the bleeding rate, viscosity, setting time, and strength, were tested through a Box-Behnken design scheme. Taking the cement, W/C, and sand content as the three influencing factors, the tested performance index was reduced by Statistical Product and Service Solutions (SPSS) software, and then, a PCA was carried out to obtain standardized comprehensive scores. A RSM was carried out with the standardized comprehensive scores as the response value, and a multiple linear regression model between the comprehensive performance index of the slurry and the influencing factors was established. The optimal ratio was obtained and tested through the model. Finally, the microstructure of the slurry was analyzed. The research in this paper provides a new idea for the optimization of plastic materials for sealing fractures in coal and rock layers.
2. Materials and Methods
Many experts have added additives such as a solid setting, accelerator, and water-reducing agent in the process of studying slurry, but little research has been done on slurry composed of a cement base. Only after mastering the essential law of slurry without any additives can appropriate reagents be added to meet the engineering needs [17]. Therefore, the plasticity grouting materials were analyzed without any additives in this experiment.
2.1. Materials
Clay was taken from the vicinity of a mining area in Shandong Province, and its color was reddish-brown. The physical parameters and chemical composition of the soil sample were shown in Table 1 and Table 2. The clay was dried after the impurities were removed, and the diameter of the clay particles used less than 2 mm was sealed with a moisture-proof bag.

Table 1.
Physical parameters of the soil samples.
Table 2.
Chemical composition of clay.
The cement used in this experiment was P.O 42.5 Ordinary Portland. Table 3 and Table 4 list the physical and chemical properties of the cement.
Table 3.
Fundamental properties of the cement used.
Table 4.
Chemical and mineral composition of the cement.
The sand is produced in the Yellow River. Adding a small amount of river sand can effectively improve the fluidity of the slurry and improve the mechanical properties after solidification. After passing the sand through a 200-mesh screen, it was dried and put into a moisture-proof bag for later use.
2.2. Experimental Design
The Box-Behnken design is a response surface design type, with a combination of processes located at the midpoint of the edge of the test space, as well as parallel tests set to reduce the experimental errors. In this experiment, a 3-factor Box-Behnken experimental design method was adopted. A total of 17 groups of experiments were designed, including 5 groups of parallel experiments. In order to reduce the error caused by the discreteness of the test pieces, making a total of 51 test pieces, three test pieces were made for each group of experiments. To obtain the optimal proportion of plasticity grouting materials, three independent variables were set up: the cement content, sand content, and W/C, and the corresponding coding values were X1, X2, and X3, and the corresponding levels were −1, 0, and 1. According to the research results of some scholars on the proportion of grouting materials [18,19,20], it was determined that the initial value of the cement content is 25–50% of all the slurry and the value of sand is 0–15%. According to the experience of crack closure [21], the W/C range is 0.4–0.6. Table 5 and Table 6 show the specific scheme design.
Table 5.
Experimental coding level.
Table 6.
Experimental scheme.
2.3. Experiment Procedures
The prepared material was made into clay–cement slurry according to different proportions in the Box-Behnken design, and the basic properties of the slurry were tested. The bleeding rate is an important standard to measure the stability of grouting. The prepared grouting was poured into a 100-mL measuring cylinder and allowed to stand for two hours before measuring its bleeding rate. The viscosity of the slurry was measured by a rotary viscometer, according to the “Determination of kinematic viscosity and calculation of dynamic viscosity” [22]. The initial setting time and final setting time of the slurry were tested by a Vicat apparatus. The specimen was made according to the “Code for acceptance of construction Quality of concrete Structure Engineering” [23]. After storing the specimen for 1 day, we left the mold and put it into a box for curing. The compressive strength of the specimen with a specified curing time was tested. The cured material was microscopically analyzed using a scanning electron microscope (SEM) and X ray diffraction (XRD). The specific experimental steps are shown in Figure 1.
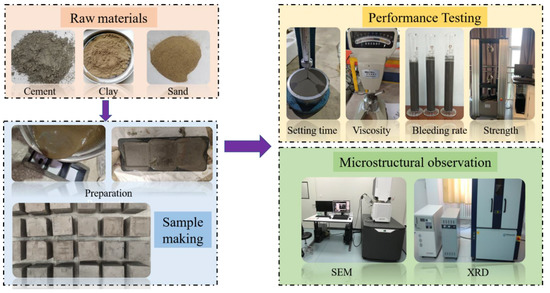
Figure 1.
Experimental process.
2.4. Numerical
2.4.1. PCA of Basic Performance Indexes
The PCA is a method that turns new variables into linear combinations of initial variables and selects variables that have great influence on the results to analyze the phenomena [24]. According to the principle of PCA [25], it can be concluded that various performance indexes of slurry are suitable for PCA. PCA was carried out on various indexes of slurry through SPSS data analysis software to obtain the eigenvalues of the initial data. Then, eigenvalues greater than one are then taken as criteria for principal component extraction. The index corresponding to each principal component was determined through the feature vector. According to Equation (1), comprehensive F scores with different proportions were obtained, and Z was obtained according to Equation (2) [26]:
where is a comprehensive score, is the score of the main component of the slurry index, is the characteristic value of the main component, is the cumulative characteristic value, is a standardized comprehensive score, is the maximum value in the comprehensive score, and is the minimum value in the comprehensive score.
The comprehensive properties of the slurry can be approximately characterized by Z. The higher the Z value, the better the comprehensive performance of the slurry. On the contrary, the lower the Z value, the worse the comprehensive performance of the slurry.
2.4.2. Analysis of RSM
Z obtained by the PCA was taken as the response value, and RSM was carried out. The experimental results were processed by the standard polynomial regression method and through Design-Expert software, the empirical models of the independent variables and response values were obtained, as well as the models tested. Then, the influence of a multifactor interaction on Z was analyzed, and the influence of different independent variables on Z was determined.
3. Results
The Box-Behnken design was carried out according to Table 1, with a total of 17 test points. The proportion of the total slurry of each component is shown in Figure 2, and the RSM analysis results are shown in Table 7.
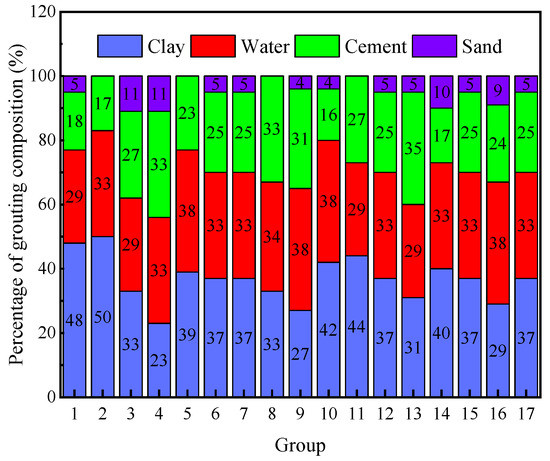
Figure 2.
Proportion of each component.
Table 7.
RSM experimental results.
3.1. Basic Performance of Grouting
3.1.1. Bleeding Rate and Setting Time
The bleeding rate is a measure of the stability of grouting. The slurry is considered a stable slurry when the bleeding rate is less than 5%. Bleeding rates of grouting with different components are shown in Figure 3. The formulas with the same W/C are grouped for convenient analysis. The groutings with W/C of 0.5 and 0.4 were relatively stable, which can be seen from Figure 3a,b. The cement rate decreased as the amount of cement increased. The bleeding rate of the slurries was within 5% in line with engineering application standards. Figure 3c shows that, when the W/C was 0.6, the slurry water separation rate was close to 10%. At this time, the nature of the slurry was unstable, and segregation was easy to occur. Figure 3d indicates that, in the five parallel experiments, the water separation rate of the slurry fluctuated slightly, which proved that the randomness of the experiment had a small effect on the overall result. After standing for a period of time, the pores were filled with the solid gel material produced by the hydration of cement, and the water that did not participate in the reaction was squeezed out, which caused the bleeding rate of the slurry to increase [27].
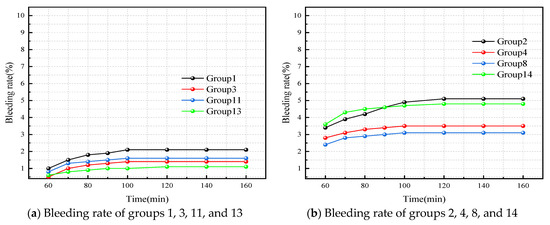
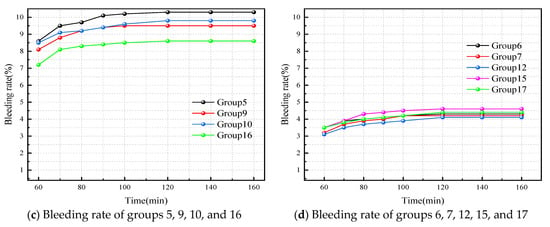
Figure 3.
Bleeding rate of slurry with different components. (a) Bleeding rate of groups 1, 3, 11, and 13; (b) Bleeding rate of groups 2, 4, 8, and 14; (c) Bleeding rate of groups 5, 9, 10, and 16; (d) Bleeding rate of groups 6, 7, 12, 15, and 17.
The first stage of the hydration reaction of cement attached to clay particles is the initial hydrolysis stage. After the cement is added to water, it reacts immediately and releases heat. C3S clinker particles release a large amount of Ca2+ and OH−, and the slurry is alkaline. The reaction formula is as follows [28]:
The fluidity is mainly affected by the amount of free water, which is related to the accumulation state of the particles and the roughness of the particles. The more cement is added, the more aggregates are generated by the early hydration reaction and the lower the water separation rate of the slurry.
The initial setting time and final setting time of different components were measured with the results shown in Figure 4. It manifested that the most important factor affecting the setting time was the W/C in the absence of any additives. As can be seen from Figure 4a, when the W/C is 0.4, the initial setting time is within 2.5 h and the final setting time not more than 5 h, which satisfies the requirements of the mortar setting time. The contact area between the C-S-H gel produced by cement hydration and clay particles was increased due to less free water, thus shortening the hardening time of the grouts [29]. When the W/C is 0.5, the setting time is further prolonged. With the change of the cement content, the setting time interval of different formulations is prolonged, which is revealed in Figure 4b. It is discovered from Figure 4c that when the water–cement ratio is 0.6, the coagulation time of the slurry is significantly longer, the initial setting time is more than 5 h, and the final setting time is more than 8 h. At this time, the slurry is not friendly to field applications. It can be seen from Figure 4d that, in the parallel test, the setting time of the formula changes within 1 h. The reason for this phenomenon may be that there is a time interval between the two sets of experiments when the test piece is made. Due to factors such as temperature and air humidity, subtle changes occur inside the slurry. The longer the setting time, the more seriously the grout will be eroded by groundwater after being injected into the formation, which cannot achieve the expected grouting effect. Therefore, to meet the needs of on-site plugging, the appropriate amount of accelerator should be added to shorten the setting time of the slurry in grouting engineering [30,31].
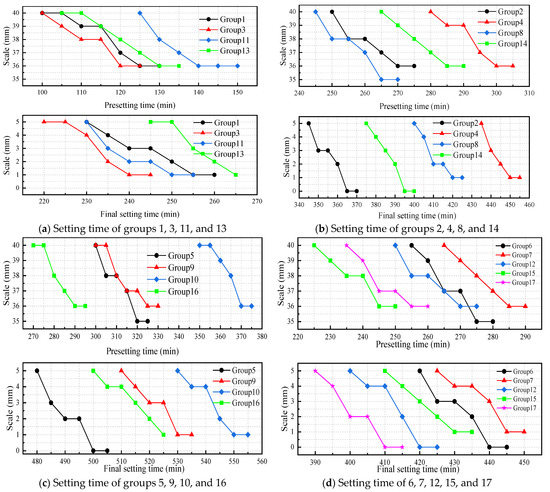
Figure 4.
Setting time of the slurry with different components. (a) Setting time of groups 1, 3, 11, and 13; (b) Setting time of groups 2, 4, 8, and 14; (c) Setting time of groups 5, 9, 10, and 16; (d) Setting time of 6, 7, 12, 15, and 17.
3.1.2. Viscosity
Viscosity is an important indicator during grout pumping; the viscosity of slurry with different components was measured as shown in Figure 5 according to the experimental plan in Table 7. It can be seen from Figure 5a that, when the W/C is 0.4, the slurry shows a higher viscosity. The higher the content of fine sand, the greater the viscosity of the slurry. When the fine sand content was 15%, group 3 reached a maximum viscosity of 440 mPa·s. Figure 5b revealed the viscosity of each group with a W/C of 0.5. The viscosity of the slurries with a 0% sand content and 15% sand content were 230 mPa·s and 330 mPa·s, respectively, with a difference of 100 mPa·s. It is proven that the sediment concentration has a great influence on the viscosity of the slurry. When the W/C is 0.6, the overall viscosity of the slurry is lower, which can be concluded from Figure 5c. Similarly, with the increase of the sediment concentration, the viscosity of the slurry increases. It can be seen from Figure 5d that, in the parallel test, the viscosity of group 12 reached 260 mPa·s, higher than that of the other four groups. The uneven distribution of sand in slurry leads to the occurrence of this phenomenon. When the W/C is the same, the more sand is added, the greater the viscosity of grouting. The high viscosity of the slurry was not suitable for the transportation of the grouting pumps and may even be blocked. This research result was consistent with that of Liu [32]. Meanwhile, the W/C has a great influence on the viscosity of the slurry. This is because a large amount of free water enters the slurry to reduce the contact points between clay particles and cement particles; thus, the viscosity of the slurry is reduced.
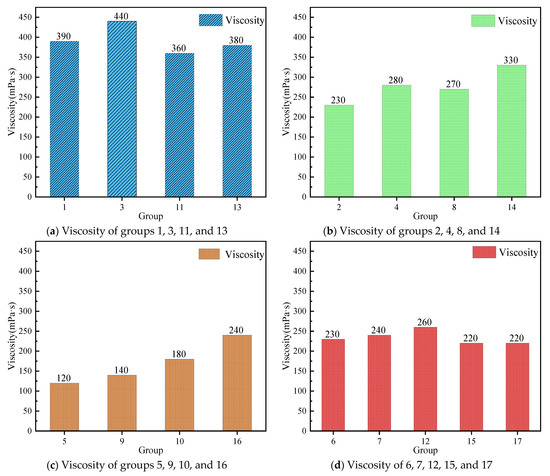
Figure 5.
Viscosity of the slurry with different components. (a) Viscosity of groups 1, 3, 11, and 13; (b) Viscosity of groups 2, 4, 8, and 14; (c) Viscosity of groups 5, 9, 10, and 16; (d) Viscosity of 6, 7, 12, 15, and 17.
With the continuous progress of a hydration reaction, the cations attracted by, electrostatically, the ions diffuse outward, and the ions generated by hydration reach a dynamic balance. According to the theory of diffusion electric double layer [33], the potential on the surface and distal end of the clay particles is relatively high, and the lowest value of potential appears at the junction of the two electron layers, which is caused by the apparent electric neutrality of the anion and cation combination. The precipitation reaction of calcium silicate hydrate (C-S-H) will occur in the cation diffusion layer, and the equation is as follows [28]:
The resulting C-S-H with low density adheres to the clay mineral. The more cement is added, the more aggregates generated by the early hydration reaction and the lower the water separation rate of the slurry.
3.1.3. Unconfined Compressive Strength
The slurry begins to condense and harden to form a stone body with a certain strength after being injected into the designated position. The key to the successful use of water plugging is the good stone body strength of the slurry. The strength of slurry stone bodies with different components after 3 days, 7 days, and 28 days of curing was measured as shown in Figure 6. As can be seen from Figure 6, the strength of the specimen increases rapidly after 3 to 7 days of curing with an average growth rate of 159%. This was due to the consolidation of clay and hydration of cement after the specimen was formed. Different kinds of C-S-H gels and ettringites produced by C3A and C4AF improved the early strength of the specimen [34]. When the specimens were cured for 7 to 28 days, the strength of the stone body increased relatively slowly, with an average growth rate of 30.5%. The main reason for the further increase of the strength of the stone body was that the C-S-H gel formed by the reaction of C3S and water filled the pore structure of the consolidated clay. As can be seen from Figure 6a, when the W/C is 0.4, the amount of cement has a greater influence on the compressive strength. This result is also revealed in Figure 6b,c. It is noted that, when the cement content is 50%, the fine sand content is 7% and the W/C is 0.4; the maximum 28 days of compressive strength of the specimen is 8.45 Mpa. In the parallel experiment, there was a small gap in the compressive strength of the specimen, which is displayed in Figure 6d. In short, the cement content and W/C have great influence on the strength.
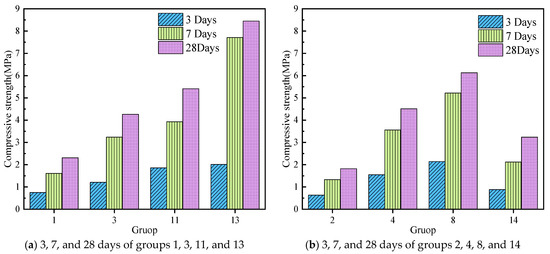
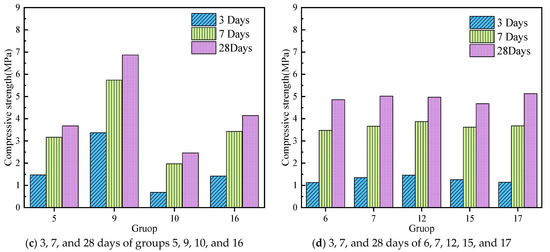
Figure 6.
The strength of grout stones in different curing periods. (a) 3, 7, and 28 days of groups 1, 3, 11, and 13; (b) 3, 7, and 28 days of groups 2, 4, 8, and 14; (c) 3, 7, and 28 days of groups 5, 9, 10, and 16; (d) 3, 7, and 28 days of 6, 7, 12, 15, and 17.
A series of physical and chemical reactions occurred during the condensation and solidification of the slurry. The increasing strength of the stone body with time is the most intuitive influence. Clay contains montmorillonite, kaolinite, and other minerals [35], which contain hydrophilic hydroxyl groups and oxygen-containing functional groups. Minerals will form a layer of free hydration film on the surface of clay particles through adsorption, which accelerates the hydration of clay and expands the clay particles. Therefore, the clay content is inversely proportional to the strength of the grouting materials [36].
After the free water is consumed by the cement hydration reaction, a part of the water exists in the clay particles in the form of bound water. The binding water fixes the clay minerals by using intermolecular force to form the skeleton structure of the stone body. On the other hand, the low-density C-S-H continues to react to generate high-density C-S-H. The continuous formation of high-density C-S-H increases the overall density of the stone body, and the internal micropores become lower. Finally, a network-like complex and porous heterogeneous grouting material interwoven with each other was formed [37].
3.2. PCA of Slurry Performance Index
SPSS statistical analysis software was used to carry out a PCA on the slurry performance indexes in Table 7. According to the results of the data analysis, the KMO value was 0.674 > 0.5 and the Barritley sphericity test value >0.0001, which was suitable for PCA [38].
The characteristic value, contribution rate, and cumulative contribution rate of the principal components are shown in Figure 7. According to the requirement that the cumulative contribution rate of the principal components is greater than 80% [21], the cumulative contribution rate of the two principal components is 91.7%, so it can be considered that the two principal components can more fully reflect the overall performance indicators of the slurry. Table 8 shows the eigenvalue vectors of each index. It can be obtained that the indexes that determine the first principal component are the bleeding rate, initial setting time, and final setting time. The index determining the second principal component is the compressive strength of the stone body at 3, 7, and 28 days.
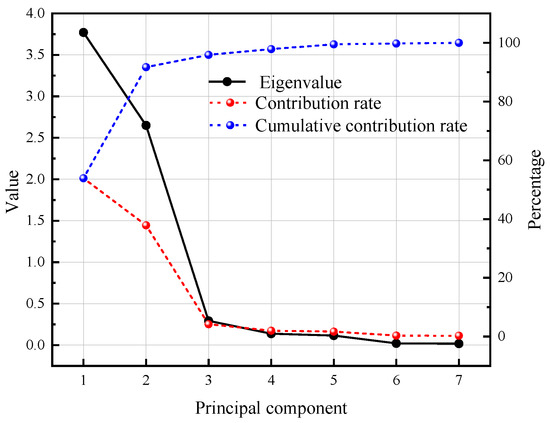
Figure 7.
Eigenvalues and corresponding contribution rate.
Table 8.
The eigenvector value of each index.
The comprehensive F score was normalized to obtain the Z according to Equations (1) and (2), due to the difference of magnitude and unit between each index. The normalization results are shown in Table 9. As can be seen from Table 9, the highest Z value of the ninth group was 0.560285, so the comprehensive performance of the slurry reached the best in the 17 groups when the cement content was 50%, sand content was zero, and W/C was 0.6. The Z value of the fourth group was −0.97489, so when the cement content was 50%, the sand content was 15%, and the W/C was 0.5; the comprehensive performance of the slurry was the worst in the 17 groups.
Table 9.
Principal component score and standardized comprehensive score.
3.3. RSM Analysis
According to reference [39], the empirical model of the relationship between the independent variables and response values is as follows:
where is the response prediction value, is the intercept, is a linear coefficient, is a square coefficient, is an interaction coefficient, and are the values of the influencing factors.
Z was subjected to an RSM analysis to obtain a variance analysis table, as shown in Table 10. The significance of the F equation was used in the regression model analysis [40]. The F value of the model obtained from Table 10 was 66.74, which showed that the model can respond to the optimal response result with comprehensive scores better. According to the results of the variance analysis, the significance level “a” was selected as 0.1. When the value of P was greater than or equal to “a”, the corresponding experimental result was considered insignificant; otherwise, the significance was considered [41]. The quadratic polynomial regression equation of the adjusted Z value for A, B, and C was obtained by eliminating the insignificant terms B and BC in the RSM analysis results. The quadratic polynomial regression equation of the adjusted Z-value for A, B, and C was as follows:
Table 10.
Analysis of the variance table.
After eliminating the insignificant terms, the correlation coefficient R2 of the regression equation about Z was 0.9884, which showed that the regression model was in good agreement with the actual situation and can be used to predict the value of Z. The variance analysis of regression items shows that the linear effect of W/C on Z was significant.
Since the interaction between A and B was obvious, C was fixed at a level, and the contour map and the three-dimensional response surface map of cement and sand content versus Z were obtained as shown in Figure 8 and Figure 9. The contour lines were dense and elliptical, which reflected the great influence of the interaction between the two factors. The contour lines were circular, which indicated that the interaction between the two factors was small [42]. As can be seen from Figure 8, the Z-value contour line in the lower left corner (low sand content and low cement content) was denser than the contour line in the lower right corner (low sand content and high cement content). Although the fluidity of the slurry was increased under the condition of a low cement content, the water evolution rate will increase and reduce the stability of the slurry as well as the gel time. Inevitably, the comprehensive properties of the slurry were reduced, and the Z value was reduced. The relationship between the Z values and the interactions between various factors were directly reflected by the response surface. The steepness of the response surface reflected the magnitude of the interaction between the two factors. When the sand content was 0% to 11%, the comprehensive score increases with the increase of the cement content and sand yield, as can be obtained from Figure 9. Sand as an aggregate can improve the strength of the slurry during cement hydration. However, an excessive amount of sand will lead to a higher viscosity of the slurry and lower overall performance of the slurry [41]. The slope increase of the response surface was obvious when the cement content was 25–34%, and the slope increase was slow when the cement content was 34–50%. This can prove that, when the cement content was 34%, the Z value was the highest, so the optimal cement content was 34%.
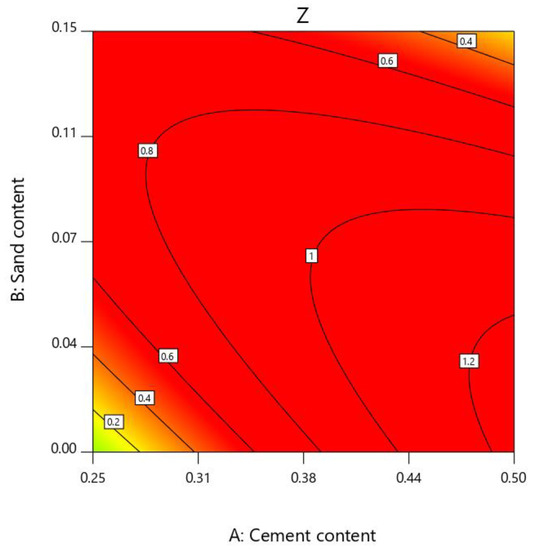
Figure 8.
Contour map.
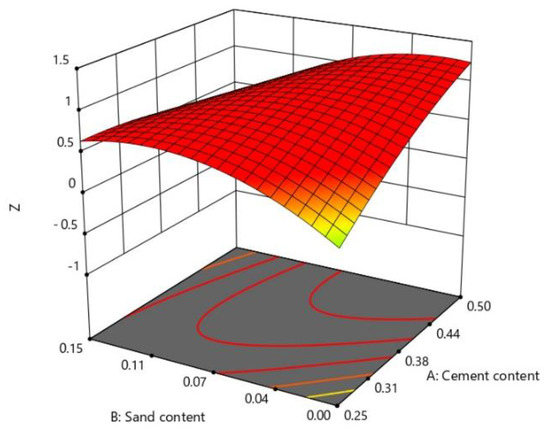
Figure 9.
Response surface diagram.
3.4. Mixing Optimization and Verification
The best ratio of each component was as follows: 34% cement content, 11% sand content, and 0.53 W/C. The predicted value of Z reached 0.7457 by analyzing Z. The optimal solution calculated by the design expert software was verified by experiments. The result manifested that the optimal ratio of the water separation rate was 3.8%; viscosity is 210 mPa·s; initial setting time is 3.4 h; final setting time is 6.4 h; and at 3, 7, and 28 days, the unconfined compressive strength was 1.62, 3.74, and 5.89 MPa. The Z value of 0.7267 was the same as the predicted value, so the model predicts the normalized comprehensive score more accurately.
In actual engineering, grout has an interesting impermeability performance that is often the key to the success of sealing fissures. In the treatment of coal and rock mass gas outburst and mine water damage, complex construction conditions put forward higher requirements for the impermeability index of grout. A concrete mortar tester was used to test the stone body according to the “Concrete Quality Control Standard” [43]. Firstly, the configured slurry was loaded into a test mold, and six test pieces were made according to the optimal ratio. Secondly, the surfaces of the specimens cured for 28 days were dried, sealed with sealant, and put into a mortar permeameter. Finally, the experiment was finished after pressurizing until the surfaces of the three specimens had water seepage. The consequence indicates that, when the water pressure was 0.8 MPa, three specimens appeared in the water seepage phenomenon, and the impermeability grade was P8, which indicated that the material has good impermeability.
3.5. Microanalysis
3.5.1. Microstructure of Solidified Slurry
In order to study the microstructure morphology and pore characteristics of the material, the Apreo S HiVac high-resolution SEM produced by Thermo Fisher Scientific was used to observe the solid samples after 28 days of optimal curing. The electrical conductivity was not possessed by the consolidated body, so the sample of the test piece was sprayed with metal before the test.
By adjusting the lens and magnification of the electron microscope, the existence of the microcracks, micropores, and interface transition zone in the sample is shown in Figure 10. Figure 10a–c is the microfracture morphology of the sample after magnification of 1000 times, 4000 times, and 15,000 times, respectively. It can be seen from Figure 10a that the surface of the sample is mostly kaolinite and montmorillonite, and no cement hydration products are found under the scale of 100 microns. When the area around the microcracks was enlarged to 4000 times, leaf-shaped chlorite and scale-shaped illite were found around the fracture, which can be seen from Figure 10b. Although chlorite and illite can play a filling role, they have poor cohesiveness and are prone to cracking under the action of external forces, resulting in a decrease in the mechanical properties of the material [44].
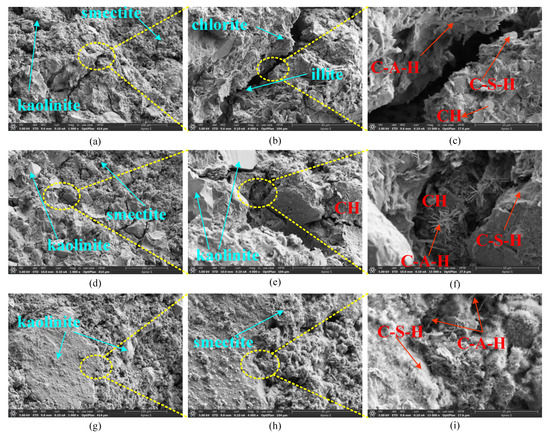
Figure 10.
SEM of the test specimen. (a) The crack is magnified 1000 times; (b) The crack is magnified 4000 times; (c) The crack is magnified 15,000 times; (d) The pore is magnified 1000 times; (e) The pore is magnified 4000 times; (f) The pore is magnified 15,000 times; (g) The transition zone of interface are magnified 1000 times; (h) The transition zone of interface are magnified 4000 times; (i) The transition zone of interface are magnified 15,000 times.
Figure 10d–f is the micropore morphology of the sample after different magnifications. From Figure 10d,e, it can be seen that massive and smooth kaolinite and honeycomb montmorillonite are distributed around the pores. The structure between kaolinite and montmorillonite crystals is relatively loose, and it is easy to be in the fluid. Move under scouring, which will form a larger pore structure [45]. After the micropores are enlarged by 15,000, the honeycomb-shaped illite is filled in the micropores, which can be seen from Figure 10f. Illite generally forms bridge-like growth or filamentous products in the pores and sticks to each other with rod-shaped hydrated calcium aluminate (C-A-H) and flocculent hydrated silicic acid gel in the pore structure and continues to harden.
Figure 10g–i is the morphologies of the transition area of the sample interface after different magnifications. From Figure 10g–i, it can be seen that the bonding around larger clay particles is denser, and there are more montmorillonite, chlorite, and illite in the transition zone of the interface, which is consistent with Wang’s findings [46]. The flocculent C-S-H and rod-shaped C-A-H closely connect the two phases at the interface [47].
From the above analysis, it can be concluded that the type of growth of the clay minerals in the microfracture pores and interfacial transition region after the slurry is solidified as a bridge growth. It is easy to combine with cement hydration products with a high-density multielement mixed system to fill the voids in the material, thereby improving the mechanical properties and impermeability of the material.
3.5.2. Phase Composition Analysis of Curing System
To study the optimal ratio of the slurry composition and contents of minerals consolidated in 28 days using the model produced by Rigaku Corporation Rigaku Utima IV XRD. The sample is analyzed for phase, the scanning angle is 5–71 degrees, and the scanning speed is 2 degrees per minute. In order to avoid the influence of unimportant minerals on the overall results, the scanning results are compared with the pdf card for the screening and analysis of the main minerals.
Figure 11 is a phase analysis diagram after processing. It can be seen from the figure that the silica diffraction peak is the highest. This is because the main component of river sand is silica. In addition, the silica contents in the cement clinker and clay minerals are 23.5% and 42.1%, respectively. Compared with the diffraction peaks of silica, the diffraction peaks of the clay minerals and cement hydration products have a lower intensity. The Ca(OH)2 diffraction peak was found in the phase analysis, and the Ca(OH)2 substance was also observed in the SEM diagram, which can indicate that the cement hydration reaction after curing 28 is not complete. Due to the lean cement, the gel material produced by the reaction is also less [46]. The diffraction peak of the hydration product is weak, which is also the main reason for the decrease in the strength of the consolidated body. The chemical reaction that occurs in the composite material is mainly a cement hydration reaction, and the new phases are mainly cement hydration reaction products, including C-S-H, C-A-H, ettringite, calcium hydroxide, etc. The consolidation of clay with water is a physical reaction, and the XRD spectrum shows that no new clay mineral phase is formed.
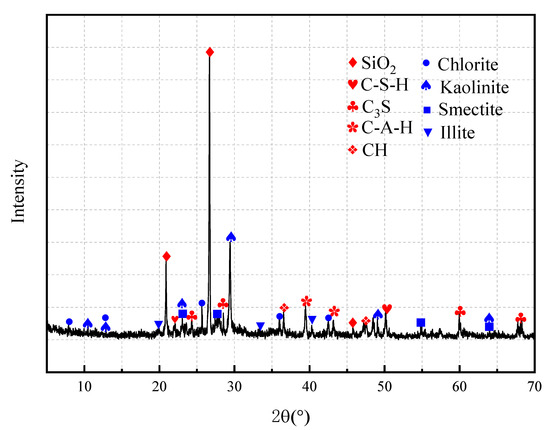
Figure 11.
XRD of the test specimen.
4. Conclusions
1. The main influencing factors of the single slurry index are the W/C and cement content. When the W/C is high, the slurry has a lower viscosity and higher setting time, so the consolidation effect of the slurry is bad. When the W/C is low, it is not conducive to slurry transportation. The strength of the slurry stone increases with the increase of the cement content.
2. There is an appropriate correlation between the slurry indexes. The cumulative contribution rate of the two principal components extracted by the PCA reached 91.7%, which can well-characterize the comprehensive performance of the slurry.
3. The prediction model of Z value passes through RSM-PCA, and R2 is 0.9884, which is consistent with the actual situation. The linear effect of W/C on the Z value is significant.
4. The optimum ratio of Z value is 34% cement, 11% sand, and 0.53 W/C. The ratio of the slurry has a reasonable comprehensive performance, and the impermeability grade reaches P8. In the later period, appropriate additives should be added on the basis of this ratio to meet the actual engineering needs.
5. The pores and fractures of the mixed consolidation body are filled, and the interface transition zone is bonded and grown by low-density clay minerals. Low-density minerals are combined with high-density C-S-H, C-A-H gel, and other hydration products to improve the microstructure of the consolidated body.
Basic experimental research on the plastic grout for the sealing fracture is in this research. In the future, it is necessary to apply the ratio on site to better guide the actual project.
Author Contributions
Conceptualization, Y.Q.; and X.M.; methodology, Y.Q.; software, Z.S.; validation, Y.Q. and M.H.; formal analysis, Y.Q.; investigation, L.P.; resources, Y.Q.; data curation, Y.Q.; writing—original draft preparation, Y.Q.; writing—review and editing, X.M.; visualization, W.L.; supervision, W.L.; project administration, W.L.; and funding acquisition, W.L. All authors have read and agreed to the published version of the manuscript.
Funding
This research was supported by the SDUST Research Fund (grant 2018TDJH102) and the Natural Science Foundation of Shandong Province (grant ZR2019MEE084).
Institutional Review Board Statement
Not applicable.
Informed Consent Statement
Not applicable.
Data Availability Statement
Not applicable.
Acknowledgments
Thanks to the State Key Laboratory of Shandong University of Science and Technology for providing experimental instruments and materials.
Conflicts of Interest
The authors declare no conflict of interest.
Abbreviations
| PCA | Principal Component Analysis |
| RSM | Response Surface Method |
| RSM-PCA | Combining of response surface method and principal component analysis |
| SEM | Scanning Electron Microscope |
| W/C | Water-Cement ratio |
| XRD | X-Ray Diffraction |
| C3A | Tricalcium Aluminate |
| C3S | Tricalcium Silicate |
| C4AF | Tetracalcium Aluminoferrite |
| C-S-H | Calcium Silicate Hydrate |
| KMO | Kaiser Meyer Olkin |
| C | The cumulative characteristic value |
| F | The comprehensive score |
| Fmax | The maximum value in the comprehensive score |
| Fmin | The minimum value in the comprehensive score. |
| Fi | The score of the main component |
| i | Index |
| Xi | The value of the influencing factors |
| Xj | The value of the influencing factors |
| Y | The response prediction value |
| Yi | The characteristic value of the main component |
| Z | A standardized comprehensive score |
| α0 | Constant |
| αi | A linear coefficient |
| αii | A square coefficient |
| αij | An interaction coefficient |
References
- Li, Y.; Zhao, Y.; Jiang, Y.; Zhang, B.; Song, H.; Liu, B. Characteristics of Pore and Fracture of Coal with Bursting Proneness Based on DIC and Fractal Theory. Energies 2020, 13, 5404. [Google Scholar] [CrossRef]
- Hu, X.; Xie, J.; Cai, W.C.; Wang, R.; Davarpanah, A. Thermodynamic effects of cycling carbon dioxide injectivity in shale reservoirs. J. Pet. Sci. Eng. 2020, 195, 107717. [Google Scholar] [CrossRef]
- Davarpanah, A.; Mirshekari, B. Experimental Investigation and Mathematical Modeling of Gas Diffusivity by Carbon Dioxide and Methane Kinetic Adsorption. Ind. Eng. Chem. Res. 2019, 58, 12392–12400. [Google Scholar] [CrossRef]
- Ma, D.; Li, Q.; Hall, M.; Wu, Y.S. Experimental Investigation of Stress Rate and Grain Size on Gas Seepage Characteristics of Granular Coal. Energies 2017, 10, 527. [Google Scholar] [CrossRef] [Green Version]
- Shimada, H.; Hamanaka, A.; Sasaoka, T.; Matsui, K. Behavior of grouting material used for floor reinforcement in underground mines. Int. J. Min. Reclam. Environ. 2013, 28, 133–148. [Google Scholar] [CrossRef]
- Sun, Y.T.; Li, G.C.; Basarir, H.; Karrech, A.; Reza Azadi, M. Laboratory evaluation of shear strength properties for cement-based grouted coal mass. Arab. J. Geosci. 2019, 12, 690. [Google Scholar] [CrossRef]
- Ma, S.H.; Ruben, S.; Li, X.R.; Shen, X.D.; Karen, L. Scrivener, Alite-ye’elimite clinker: Hydration kinetics, products and microstructure. Constr. Build. Mater. 2021, 266 Pt B, 121062. [Google Scholar] [CrossRef]
- Xu, R.; Zuo, Y.J. Properties of clay cement grout and mechanism of water control. J. China Coal Soc. 1996, 21, 613–617. [Google Scholar] [CrossRef]
- Song, Y.B.; Gao, Q.C. Mechanism of grouting for waterproof using organic material with high water content. J. Min. Saf. Eng. 2006, 23, 320–322. [Google Scholar]
- Liu, Y.; Chen, B. Research on the preparation and properties of a novel grouting material based on magnesium phosphate cement. Constr. Build. Mater. 2019, 214, 516–526. [Google Scholar] [CrossRef]
- Zhu, X.X.; Zhang, Q.; Zhang, W.Q.; Shao, J.L.; Wang, Z.Y.; Wu, X.T. Experimental Study on the Basic Properties of a Green New Coal Mine Grouting Reinforcement Material. ACS Omega 2020, 5, 16722–16732. [Google Scholar] [CrossRef]
- Duan, H.F.; Jiang, Z.Q.; Zhu, S.Y.; Pu, Y.; Sun, Q. New composite grouting materials: Modified urea–formaldehyde resin with cement. Int. J. Min. Sci. Technol. 2012, 22, 195–200. [Google Scholar] [CrossRef]
- Xu, G.Q.; Yan, J.P.; Xia, X.L. Optimization experiment on mixing ratio of new grouting material to prevent mine floor water inrush. Coal Sci. Technol. 2010, 38, 22–24. [Google Scholar]
- Zhang, J.; Li, S.C.; Li, Z.F.; Zhang, Q.S.; Yang, L.; Du, J.Q.; Li, H.T.; Qi, Y.H.; Lin, R.F. Grouting Effect on Reinforcement of Weathered Granite. Geotech. Geol. Eng. 2020, 38, 2873–2886. [Google Scholar] [CrossRef]
- Zhang, Z.Z.; Han, C.L.; Li, C.W. Application of response surface method in experimental design and optimization. J. Henan Inst. Educ. (Nat. Sci. Ed.) 2011, 20, 34–37. [Google Scholar] [CrossRef]
- Amiandamhen, S.; Meincken, M.; Tyhoda, L. Magnesium based phosphate cement binder for composite panels: A response surface methodology for optimisation of processing variables in boards produced from agricultural and wood processing industrial residues. Ind. Crops Prod. 2016, 94, 746–754. [Google Scholar] [CrossRef]
- Zhu, M.; Yu, L.; Zhang, X.; Davarpanah, A. Application of Implicit Pressure-Explicit Saturation Method to Predict Filtrated Mud Saturation Impact on the Hydrocarbon Reservoirs Formation Damage. Mathematics 2020, 8, 1057. [Google Scholar] [CrossRef]
- Li, T.; Yao, B.H.; Liu, Y.; Wang, D.K. Grouting Fractured Coal Permeability Evolution Based on Industrial CT Scanning. Geofluids 2021, 2021, 5564786. [Google Scholar] [CrossRef]
- Wang, X.H. Study of rheological properties of clay-cement pastes and the effect factors. Chin. J. Geotech. Eng. 1997, 19, 45–50. [Google Scholar]
- Dejaeghere, I.; Sonebi, M.D.; Schutter, G. Influence of nano-clay on rheology, fresh properties, heat of hydration and strength of cement-based mortars. Constr. Build. Mater. 2019, 222, 73–85. [Google Scholar] [CrossRef]
- Rahmani, E.; Sharbatdar, M.K.; Beygi, H.A. A comprehensive investigation into the effect of water to cement ratios and cement contents on the physical and mechanical properties of Roller Compacted Concrete Pavement (RCCP). Constr. Build. Mater. 2020, 253, 119177. [Google Scholar] [CrossRef]
- GB/T256-88. Determination of Kinematic Viscosity and Calculation of Dynamic Viscosity; Standardization Administration of the People’s Republic of China: Beijing, China, 2002. [Google Scholar]
- GB50204. Code for Acceptance of Construction Quality of Concrete Structure Engineering; Standardization Administration of the People’s Republic of China: Beijing, China, 2015. [Google Scholar]
- Lin, H.M.; Du, Z.F. Some problems in comprehensive evaluation in the principal component analysis. Stat. Res. 2013, 30, 25–31. [Google Scholar]
- Fan, X.L.; Feng, H.H.; Yuan, M. PCA based on mutual information for feature selection. Control Decis. 2013, 28, 915–919. [Google Scholar]
- Xiao, S.D.; Wang, J.; Xue, Y.X.; Zhang, H.L. Optimization of cactus fermented wine process by response surface-principal component analysis. Sci. Technol. Food Ind. 2019, 40, 113–119, 128. [Google Scholar]
- Zhang, C.; Yang, J.S.; Ou, X.F.; Fu, J.Y.; Xie, Y.P.; Liang, X. Clay dosage and water/cement ratio of clay-cement grout for optimal engineering performance. Appl. Clay Sci. 2018, 163, 312–318. [Google Scholar] [CrossRef]
- Nicoleau, L.; Nonat, A. A new view on the kinetics of tricalcium silicate hydration. Cem. Concr. Res. 2016, 86, 1–11. [Google Scholar] [CrossRef]
- Georgios, C.; Franz-Josef, U. The nanogranular nature of C-S-H. J. Mech. Phys. Solids 2007, 55, 64–90. [Google Scholar] [CrossRef]
- Pu, S.Y.; Zhu, Z.D.; Song, W.L.; Wan, Y.; Wang, H.R.; Song, S.G.; Zhang, J. Mechanical and Microscopic Properties of Cement Stabilized Silt. KSCE J. Civ. Eng. 2020, 24, 2333–2344. [Google Scholar] [CrossRef]
- Liu, F.; Zheng, M.; Ye, Y. Formulation and properties of a newly developed powder geopolymer grouting material. Constr. Build. Mater. 2020, 258, 120304. [Google Scholar] [CrossRef]
- Liu, J.; Zhang, G.J.; Yang, D.S.; Zhong, P. Rheological properties of clay-cement grouting material and influence on grouting. Bull. Chin. Ceram. Soc. 2016, 35, 2581–2589. [Google Scholar]
- Xie, K.H.; Xia, C.Q.; An, R.; Hu, A.F.; Zhang, W.P. A study on the one-dimensional consolidation of double-layered structured soils. Comput. Geotech. 2016, 73, 189–198. [Google Scholar] [CrossRef]
- Li, B. Investigation of the Mesco-Mechanical Properties of Calcium-Silicate-Hydrate. Ph.D. Thesis, Harbin Engineering University, Harbin, China, 2018. [Google Scholar]
- Habert, G.; Choupay, N.; Escadeillas, G.; Guillaume, D.; Montel, J.M. Clay content of argillites: Influence on cement based mortars. Appl. Clay Sci. 2008, 43, 322–330. [Google Scholar] [CrossRef]
- Horpibulsuk, S.K.; Rachan, R.L.; Chinkulkijniwat, A.; Raksachon, Y. Analysis of strength development in cement-stabilized silty clay from microstructural considerations. Constr. Build. Mater. 2010, 24, 2011–2021. [Google Scholar] [CrossRef]
- Sekkal, W.; Zaoui, A.; Benzerzour, M.; Abriak, N. Role of porosity on the stiffness and stability of (001) surface of the nanogranular C–S–H gel. Cem. Concr. Res. 2016, 114, 229–233. [Google Scholar] [CrossRef]
- Li, J.H.; Guo, Y.H. Principal component evaluation—A multivariate evaluate method expanded from principal component analysis. J. Ind. Eng. Manag. 2002, 16, 39–43. [Google Scholar]
- Durante, M.; Ferramosca, A.; Treppiccione, L.; Giacomo, M.; Zara, V.; Montefusco, A.; Piro, G.; Mita, G.; Bergamo, P.; Lenucci, M.S. Application of response surface methodology (RSM) for the optimization of supercritical CO2 extraction of oil from patè olive cake: Yield, content of bioactive molecules and biological effects in vivo. Food Chem. 2020, 332, 127405. [Google Scholar] [CrossRef] [PubMed]
- Yang, Y.S.; Shen, H.J.; Qiu, J. Bio-inspired self-bonding nanofibrillated cellulose composite: A response surface methodology for optimization of processing variables in binderless biomass materials produced from wheat-straw-lignocelluloses. Ind. Crop. Prod. 2020, 149, 112335. [Google Scholar] [CrossRef]
- Hamza, G. On the viscous behavior of cement mixtures with clay, sand, lime and bottom ash for jet grouting. Constr. Build. Mater. 2015, 93, 891–910. [Google Scholar] [CrossRef]
- Chang, S.; Xu, R.Q.; Li, X.G.; Wang, X.C. Optimization of formula for stabilizing muddy soil using response surface methodology. Rock Soil Mech. 2014, 35, 105–110. [Google Scholar]
- GB50164. Standard for Test Method of Performance on Building Morta; Standardization Administration of the People’s Republic of China: Beijing, China, 2011. [Google Scholar]
- Rodrigo, F.; Fernando, M.; Karen, L.S. The origin of the pozzolanic activity of calcined clay minerals: A comparison between kaolinite, illite and montmorillonite. Cem. Concr. Res. 2011, 41, 113–122. [Google Scholar] [CrossRef]
- Chen, S.; Xie, J.; Yang, Z. Effect of reactive montmorillonite with amino on the properties of polyimide/montmorillonite nanocomposite. Polym. Bull. 2020, 77, 687–699. [Google Scholar] [CrossRef]
- Wang, D.H.; Shi, C.J.; Farzadnia, N.; Shi, Z.G.; Jia, H.F.; Ou, Z.H. A review on use of limestone powder in cement-based materials: Mechanism, hydration and microstructures. Constr. Build. Mater. 2018, 181, 659–672. [Google Scholar] [CrossRef]
- Mori, K.; Fukunaga, T.; Sugiyama, M.; Iwase, K.; Oishi, K.; Osamu, Y. Hydration properties and compressive strength development of Low Heat Cement. J. Phys. Chem. Solids 2012, 73, 1274–1277. [Google Scholar] [CrossRef]
Publisher’s Note: MDPI stays neutral with regard to jurisdictional claims in published maps and institutional affiliations. |
© 2021 by the authors. Licensee MDPI, Basel, Switzerland. This article is an open access article distributed under the terms and conditions of the Creative Commons Attribution (CC BY) license (https://creativecommons.org/licenses/by/4.0/).