Article

Why Should We Test the Wideband Transformation Accuracy of Medium Voltage Inductive Voltage Transformers?

Institute of Mechatronics and Information Systems, Lodz University of Technology, 90-924 Lodz, Poland
*
Author to whom correspondence should be addressed.
Energies 2021, 14(15), 4432; https://doi.org/10.3390/en14154432
Submission received: 21 June 2021 / Revised: 16 July 2021 / Accepted: 20 July 2021 / Published: 22 July 2021

Abstract

:
In this paper the results of the tests of the wideband transformation accuracy of medium voltage (MV) inductive voltage transformers (VTs) in the frequencies range from 50 Hz up to 5 kHz are presented. The values of voltage error and phase displacement for transformation of the harmonics of distorted primary voltages are determined. In the case of a typical 50 Hz-type inductive VT with a rated primary voltage equal to (15/√3) kV and (20/√3) kV manufactured by an international company the limiting values of the accuracy classes extension for quality metering required by the standard IEC 61869-6 for the Low Power Instrument Transformers (LPIT) were not exceeded. While, in the same test other MV inductive VTs show poor accuracy and even resonance at multiple frequencies. Unfortunately, this problem also arises from nonlinearity of the magnetization characteristic of their magnetic core. Therefore, for transformation of the sinusoidal voltage in the secondary voltage significant but not easily detectable values of the low order higher harmonics are present. Moreover, for transformation of harmonics of distorted primary voltage the influence of connected capacitance on the obtained values of voltage error and phase displacement was tested.

Graphical Abstract

1. Introduction

Inductive instrument transformers are subject to nonlinear effects causing problems in the accurate measurement of PQ issues and non-sinusoidal electrical energy [1,2,3,4,5,6]. The problem with their wideband transformation accuracy is caused by the nonlinearity of the magnetic core. In inductive current transformers this results in significant additional distortion of the secondary current with the low order higher harmonics, even when a sinusoidal current is transformed [7]. In the inductive voltage transformers (VTs) main reason of the highly nonlinear transformation is resonance for higher harmonic of transformed distorted primary voltage [8,9]. The additional distortion of the secondary voltage with the low order higher harmonics is much less significant. The main problem with highly nonlinear transformation with frequency of the applied voltage results from the internal resonance caused by the simultaneous presence of inductances and capacitances in the primary winding of the inductive VT [9,10]. Moreover, new requirements may arise for partial discharge (PD) tests under non-sinusoidal conditions. The studies presented in [11] show the application of FFT analysis in PD detection. However, there are still no tests established for distorted voltages. There are many methods and measuring systems that enable evaluation of the values of ratio error and phase displacement for transformation of harmonics of distorted voltages by the inductive VT [6,8,12,13,14]. Therefore, the methods and requirements are ready for standardization. The accuracy requirements for low-power voltage transformers at harmonics are defined in the IEC 61869-6 standard [15]. Since, still there are no requirements for the accuracy of transformation of higher harmonics by inductive VTs. In this paper the limits defined for the LPIT are applied also to inductive VTs. Due to the distortion of voltage and current in the power networks accurate transformation of harmonics also by inductive instrument transformers is needed. This problem is widely discussed in the literature [1,2,3,4,5,6,7,8,9,10,12,13,14,15,16,17,18,19,20,21], however, the presented results show only poor transformation accuracy of mass-produced inductive VTs.
The paper presents the application of a measuring system developed for testing the transformation accuracy of harmonics of distorted voltage by MV inductive VTs [8]. The results show that the unit designed for the rated primary voltage equal to (15/√3) kV is able to ensure the values of voltage error and phase displacement that do not exceed ±5%/° in the frequencies range up to 5 kHz. The inductive VT designed for the rated primary voltage equal to (20/√3) kV is able to ensure only ±10%/° in the limited frequencies range up to 2.5 kHz. This limitation is caused by the resonance behavior of inductive VT caused by the simultaneous presence of the capacitance and the inductance in the primary winding [9,10]. In the case of both VTs additional problem with wideband transformation accuracy is caused by the nonlinearity of the magnetization characteristic of their magnetic core [7]. However, the values of the 3rd, 5th and 7th harmonics are not easily detectable, therefore, the developed method that enables calculation of the values of the low order higher harmonics generated in the secondary voltage due to the nonlinearity of the magnetization characteristics of their magnetic core must be used. Moreover, the significant influence on the values of voltage error and phase displacement of transformation of harmonics may have the value of the capacitance connected to the secondary winding. In the tested case the changes were easily detectable if it exceeded 1 nF.
In the paper the limits defined for LPIT in the group of the standards IEC 61869 for transformation accuracy of higher harmonics are presented. In the next section the object of the research and its equivalent circuit are discussed. In Section 4 and Section 5 the measurement system, test conditions and the results of the measurements for transformation of harmonics of the distorted primary voltage by the tested inductive VTs are presented and analyzed. The last section of the paper present the conclusions.

2. Defined Accuracy Requirements for Transformation of Higher Harmonics in the Group of the Standards IEC 61869

The accuracy requirements for low-power voltage transformers at harmonics are defined in the standard IEC 61869-6 [15]. In Table 1 the limiting values of the ratio error and phase displacement for the measuring accuracy classes of the low power instrument transformers (LPITs) are presented.
The requirements presented in Table 1 are defined to ensure proper accuracy of transformation for electric energy metering systems in power networks.
In Table 2 the limiting values of the ratio error and phase displacement for the power quality accuracy classes of the LPIT are presented.
The requirements presented in Table 2 are defined to ensure proper accuracy of measurement of the power quality by the systems in power networks.
In Table 3 the limiting values of the ratio error and phase displacement for the accuracy classes extension for high bandwidth DC applications of the LPIT are presented.
The most restrictive requirements are defined in Table 3. They are defined to ensure proper accuracy of the LPIT in high bandwidth DC applications.

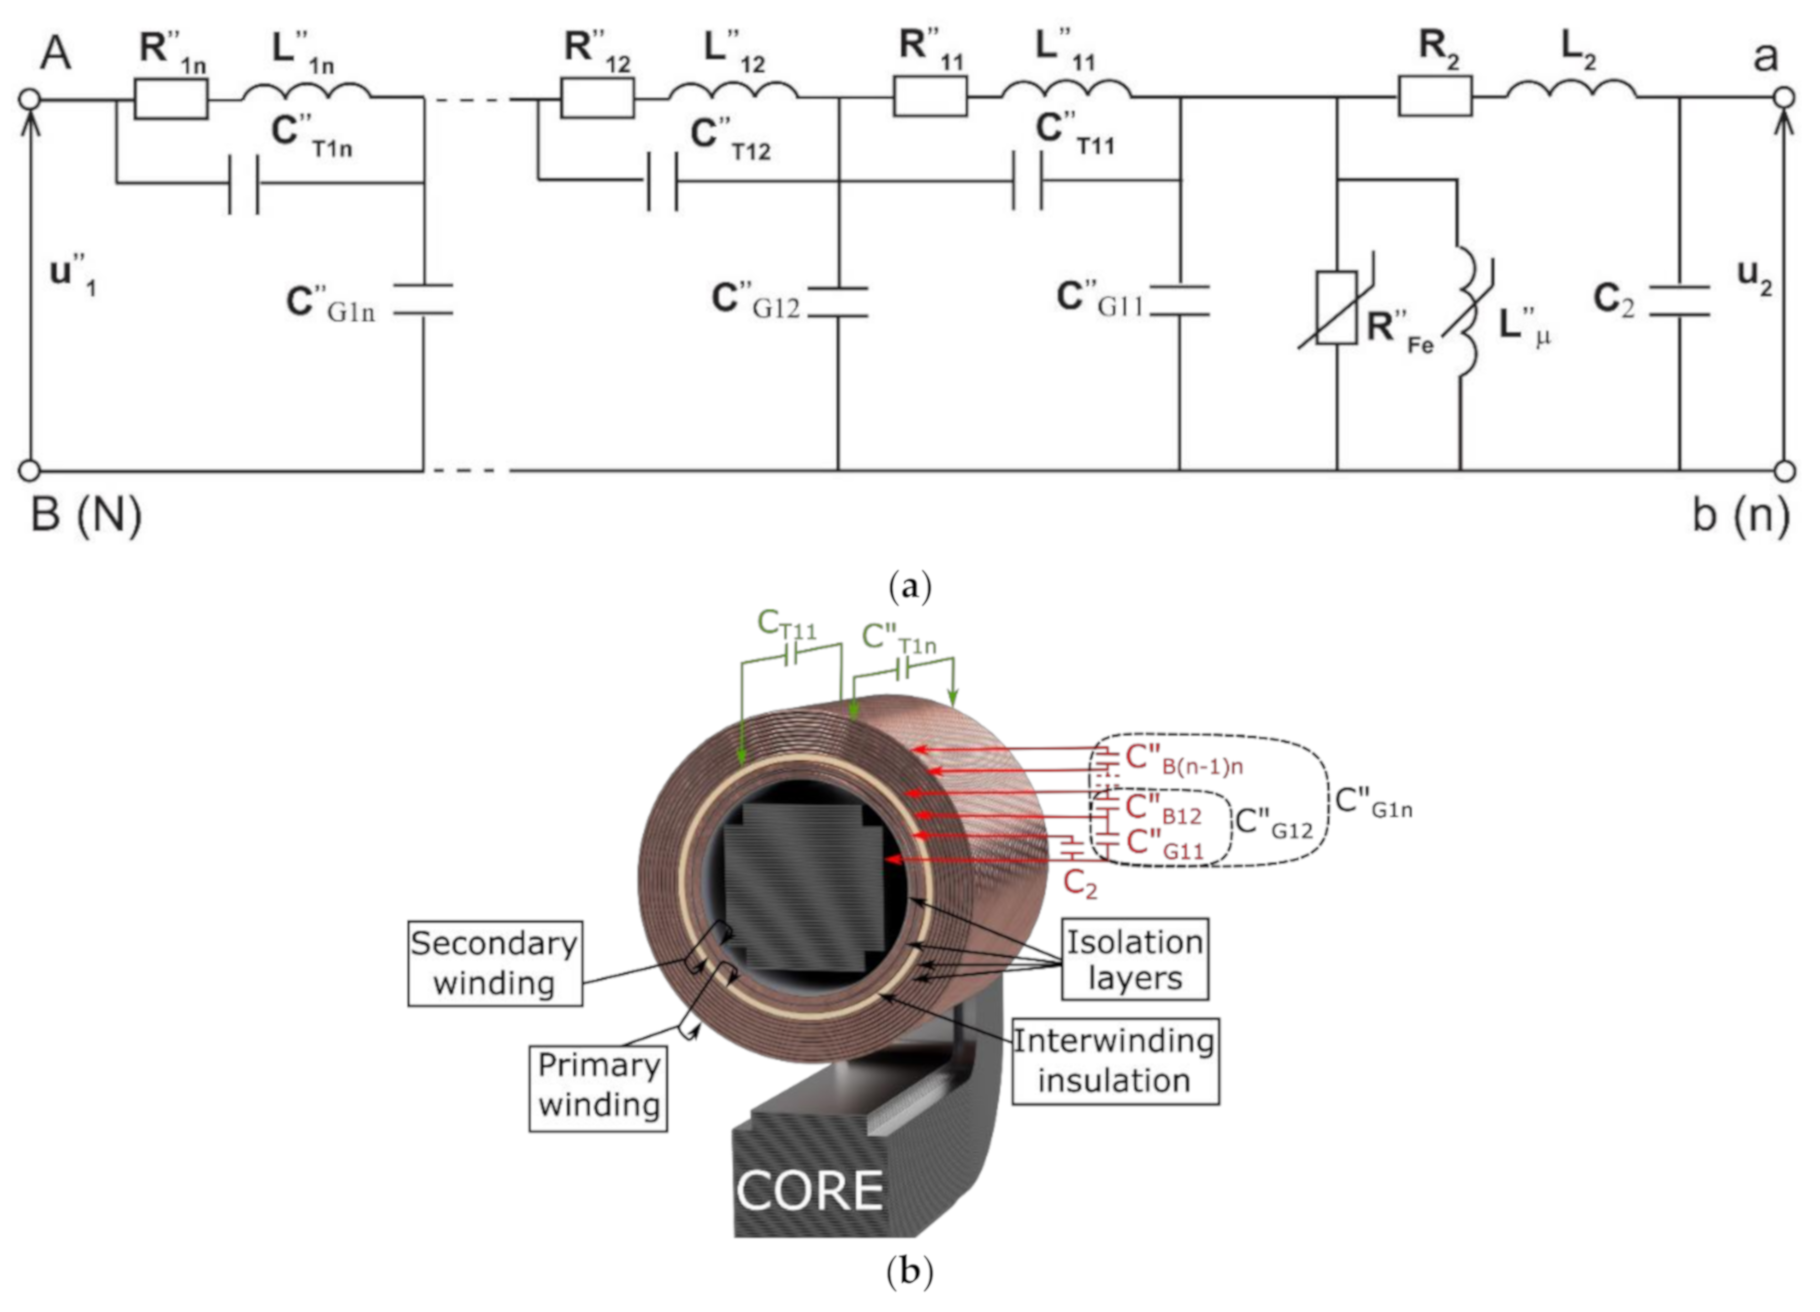
3. The Object of the Research and the Equivalent Circuit of Inductive VT for WIDEBAND Operation up to 20 kHz

The objects of the research are a group of single pole VTs: two with a rated primary voltage equal to (20/√3) kV, two with rated primary voltage equal to (15/√3) kV. Their rated secondary voltage is equal to (100/√3) V. Additionally, one tested inductive VT is designed as reference for evaluation of the accuracy of inductive VTs for transformation of a 50 Hz sinusoidal voltage. It has three rated voltage ratios: 200, 100 and 50. Its primary voltage may be equal to 20 kV, 10 kV, 5 kV or (20/√3) kV, (10/√3) kV, (5/√3) kV. The results of transformation accuracy tests of the sinusoidal primary voltage of frequency 50 Hz in accordance with the standard IEC 61869-3 by the tested VTs are presented in Table 4 [22].
VTs 1 to 4 are 0.5 accuracy class as results from requirement defined in the standard IEC 61869-3: the values shall not exceed ±0.5% for the voltage error and ±0.33° for the phase displacement [22]. VT5 is the inductive VT designed as reference for evaluation of transformation accuracy of inductive VTs for 50 Hz sinusoidal voltage of accuracy class 0.05. In this case the values shall not exceed ±0.05% for the voltage error and ±0.03° for the phase displacement
To analyze the transformation accuracy of the higher harmonics of the distorted primary voltage by the inductive VTs an extended equivalent circuit is used (Figure 1).
In Figure 1 the following notations are used: symbols with two dashes (‘’) indicate parameters converted to a secondary circuit:
C”T11/C”T12/C”T1n–partial equivalent capacitance between the primary and secondary windings,
C”G11/C”G12/C”G1n–partial equivalent capacitance of the primary winding to ground,
C”B12/C”B(n-1)n–parasitic capacitance between neighbor layers of the primary winding,
R”11/R”12/R”1n–partial resistance of the primary winding,
L”11/L”12/L”1n–partial leakage inductance of the primary winding,
C2–equivalent capacitance of the secondary winding,
R2–resistance of the secondary winding,
L2–leakage inductance of the secondary winding,
R”Fe–equivalent resistance of the iron losses in the magnetic core,
L”μ–mutual inductance between primary and secondary windings,
u”1–instantaneous value of the primary voltage,
u2–instantaneous value of the secondary voltage.
In the equivalent circuit of the inductive VT the parasitic capacitance of the primary winding and its leakage inductance are divided into several parts, as presented in [9]. This is required to correctly reproduce the multi-resonance circuit of the tested inductive VT. The partial equivalent capacitance of the primary winding to ground forms the conductive path to ground of each layer of the primary winding. This is caused by the parasitic capacitance between each layer of the winding (grey area in the primary winding in Figure 1b). The equivalent capacitance between the primary and secondary windings is caused by the parasitic capacitances between turns of the windings connected in series. Moreover, it depends from the thickness of the insulation layers between the windings (yellow area in Figure 1b).

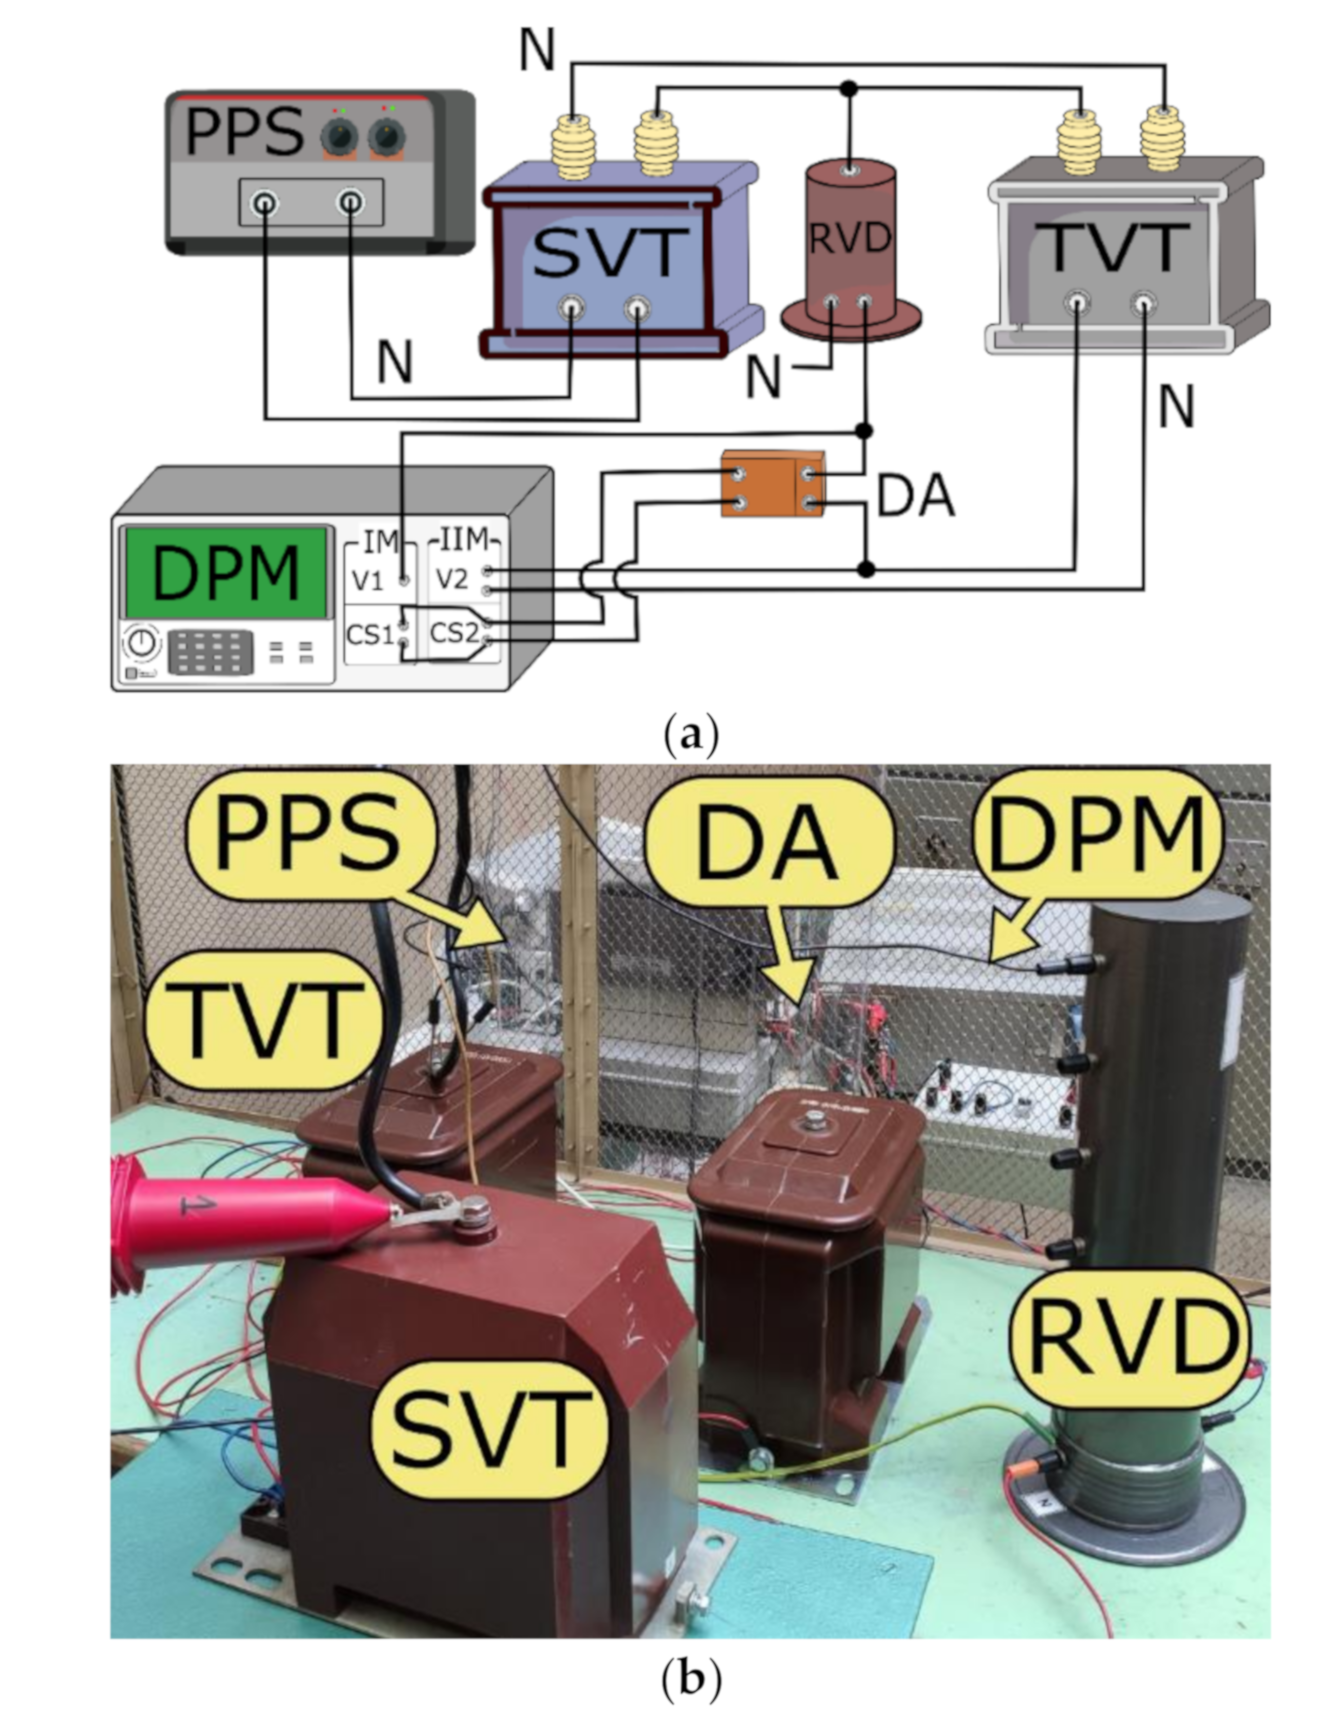
4. Measuring System and Tests Conditions

The values of voltage error and phase displacement of transformation of distorted primary voltage’s harmonics by tested VTs (TVT) are determined in the measuring system presented in Figure 2. It consists of the following devices: digital power meter (DPM), reference wideband voltage divider (RVD), differential amplifier (DA) used to convert the differential voltage to the single-ended voltage and the supplying inductive VT used to step-up a distorted voltage (SVT).
The accuracy of RVD is tested as required by the standard IEC 61869–11 [23,24,25]. Its frequency response is tested for sinusoidal input voltage with RMS value equal to 150 V for 15 kV voltage input and 200 V for 20 kV input. The used reference voltage divider (RVD) has four ranges of the maximum RMS value of the primary input voltage: 20 kV or (20/√3) kV, 15 kV or (15/√3) kV, 10 kV or (10/√3) kV, and 5 kV or (5/√3) kV. Its rated value of the output voltage is 100 V or (100/√3) V, respectively. The measuring system presented in Figure 2 is used to differentially compare the reference voltage from the RVD with the secondary voltage of the tested inductive VT [8]. The application of the DA ensures a high input impedance of the DPM voltage input required not to overload the RVD input [26]. The voltages from DA and RVD are measured simultaneously. Differential voltage is measured only if the maximum RMS value of the input voltage does not exceed 10 V. Then, the transformation accuracy of tested VTs is obtained from comparison of their secondary voltage with the output voltage of RVD. To supply the measuring system programmable power supply system (PPS) is used. It is composed of the audio power amplifier with rated output active power 4 kW and the arbitrary waveform generator [27]. This enables the possibility to generate the distorted supply voltage for SVT. During the tests a voltage with the main harmonic (50 Hz) and a single higher harmonic up to the 100th order is used. Its RMS value is equal to 10% of the RMS value of the main harmonic. The value of phase of higher harmonic in relation to the main harmonic is typically equal to 0. However, for low order higher harmonics 3rd, 5th and 7th the phase is changed in 10° steps during the test.
In developed differential method the value of the secondary voltage of tested transformer is calculated from the following Equation [8]:
  U C V T h k = U R V D h k 2 + U D A h k 2 2   U R V D h k   U D A h k cos 180 ° φ R V D D A h k
where UCVThk–calculated RMS value of a hk harmonic on the secondary winding of TVT, URVDhk–the RMS values of a hk harmonic in the output voltage of the RVD, UDAhk–the RMS values of a hk higher harmonic in the output voltage of the DA, and ϕRVDDAhk–the phase angle of a hk harmonic in the output voltage of the DA in relation to the hk harmonic in the reference voltage from the RVD.
The value of the voltage ratio error of transformation of a hk harmonic by tested VTs is calculated from the following Equation [8]:
U T V T h k = U C T V T h k U R V D h k U R V D h k · 100 %
U(C)TVThk–the RMS values of a hk harmonic in the output voltage of the TVT determined from Equation (1) (UCVThk) if differential method is used or measured by DPM on the secondary winding of TVT (UTVThk).
The value of the composite error of transformation of a hk harmonic is calculated from Equation [8]:
ε T V T h k = U D A h k U R V D h k · 100 %
The value of the phase displacement of transformation of a hk harmonic is given by Equation [8]:
φ U T V T h k = ψ U T V T h k ψ U R V D h k
where ψUTVThk–the phase angle of a hk harmonic on the secondary winding of TVT in relation to the main harmonic of the output voltage of RVD and ψURVDhk–the phase angle of a hk harmonic of the output voltage of RVD in relation to its main harmonic.
If differential method is used the value of the phase displacement of a hk harmonic caused by TVT may be determined from the following Equation [8]:
φ U T V T h k = arcsin ε T V T h k 2 U T V T h k 2 100 %

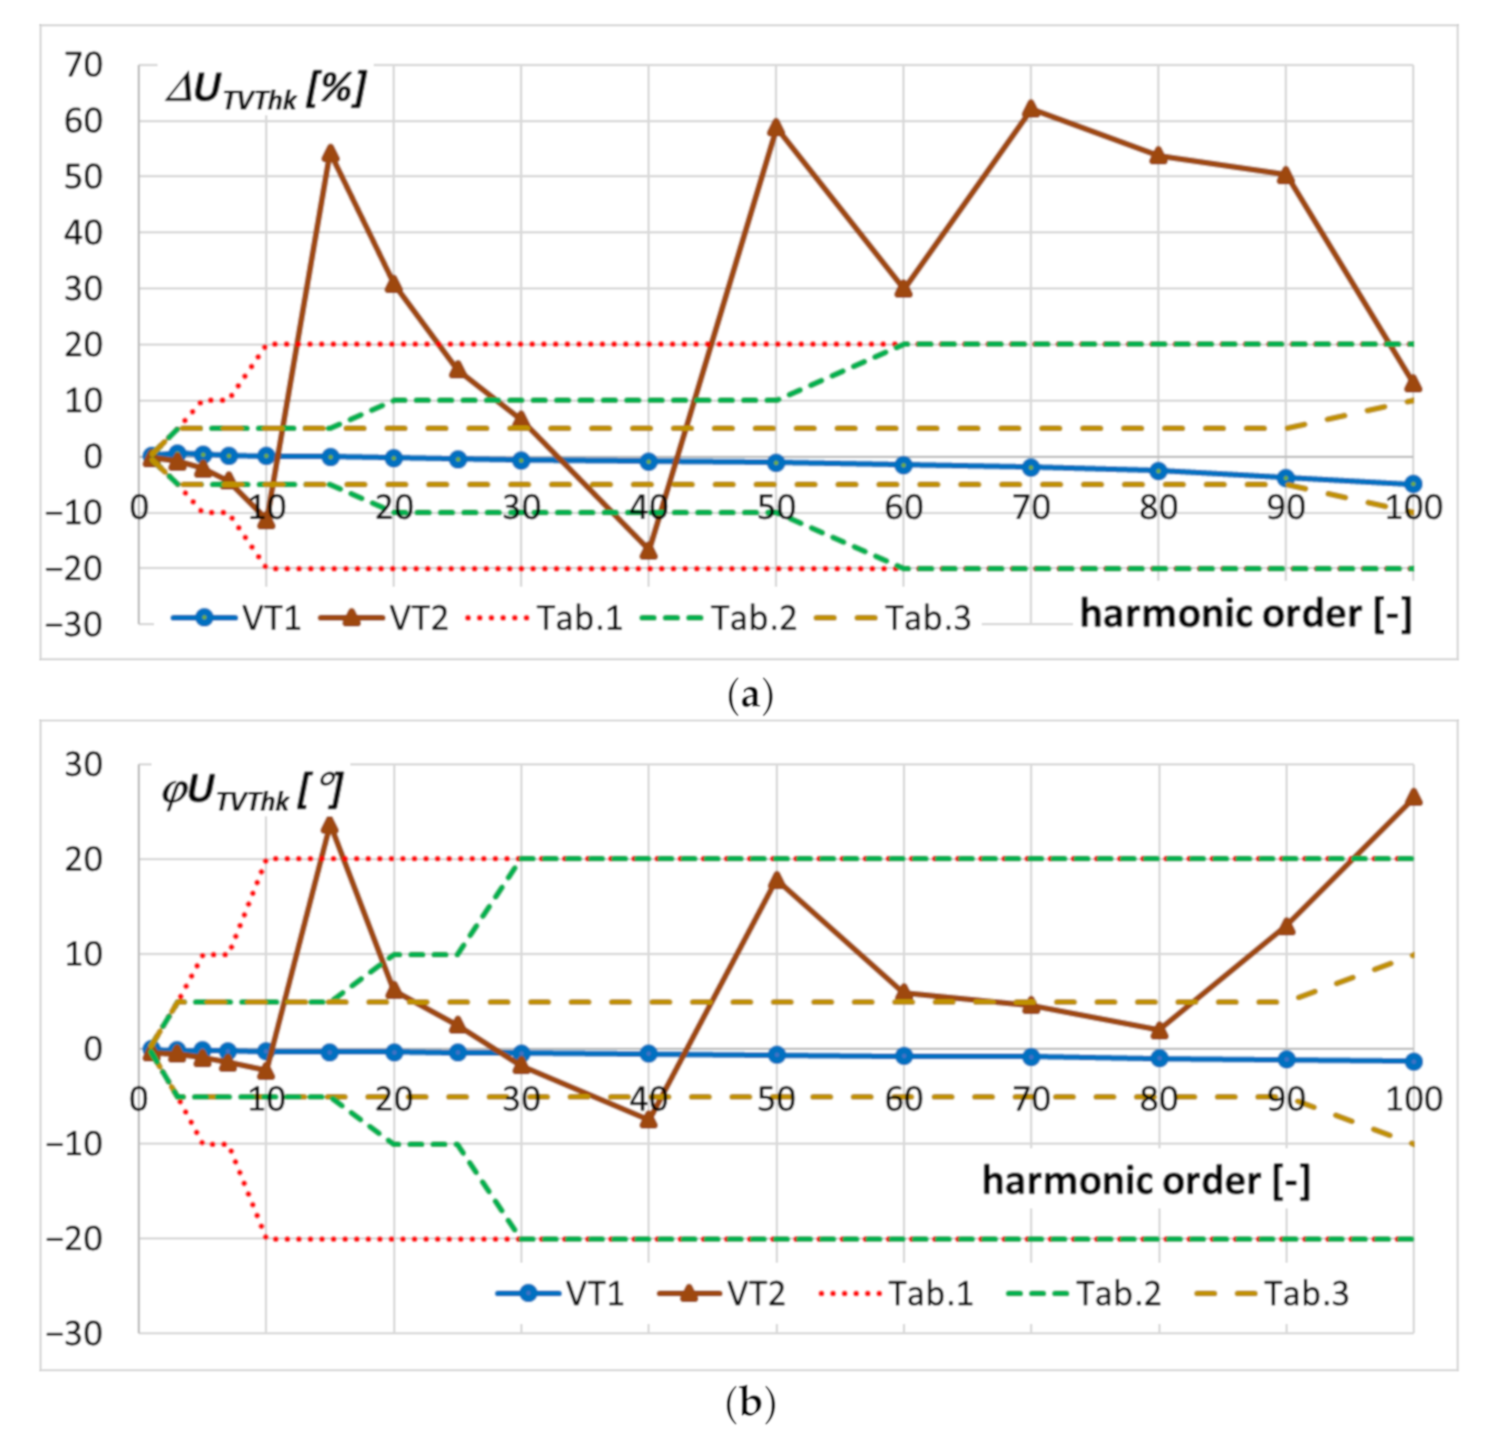
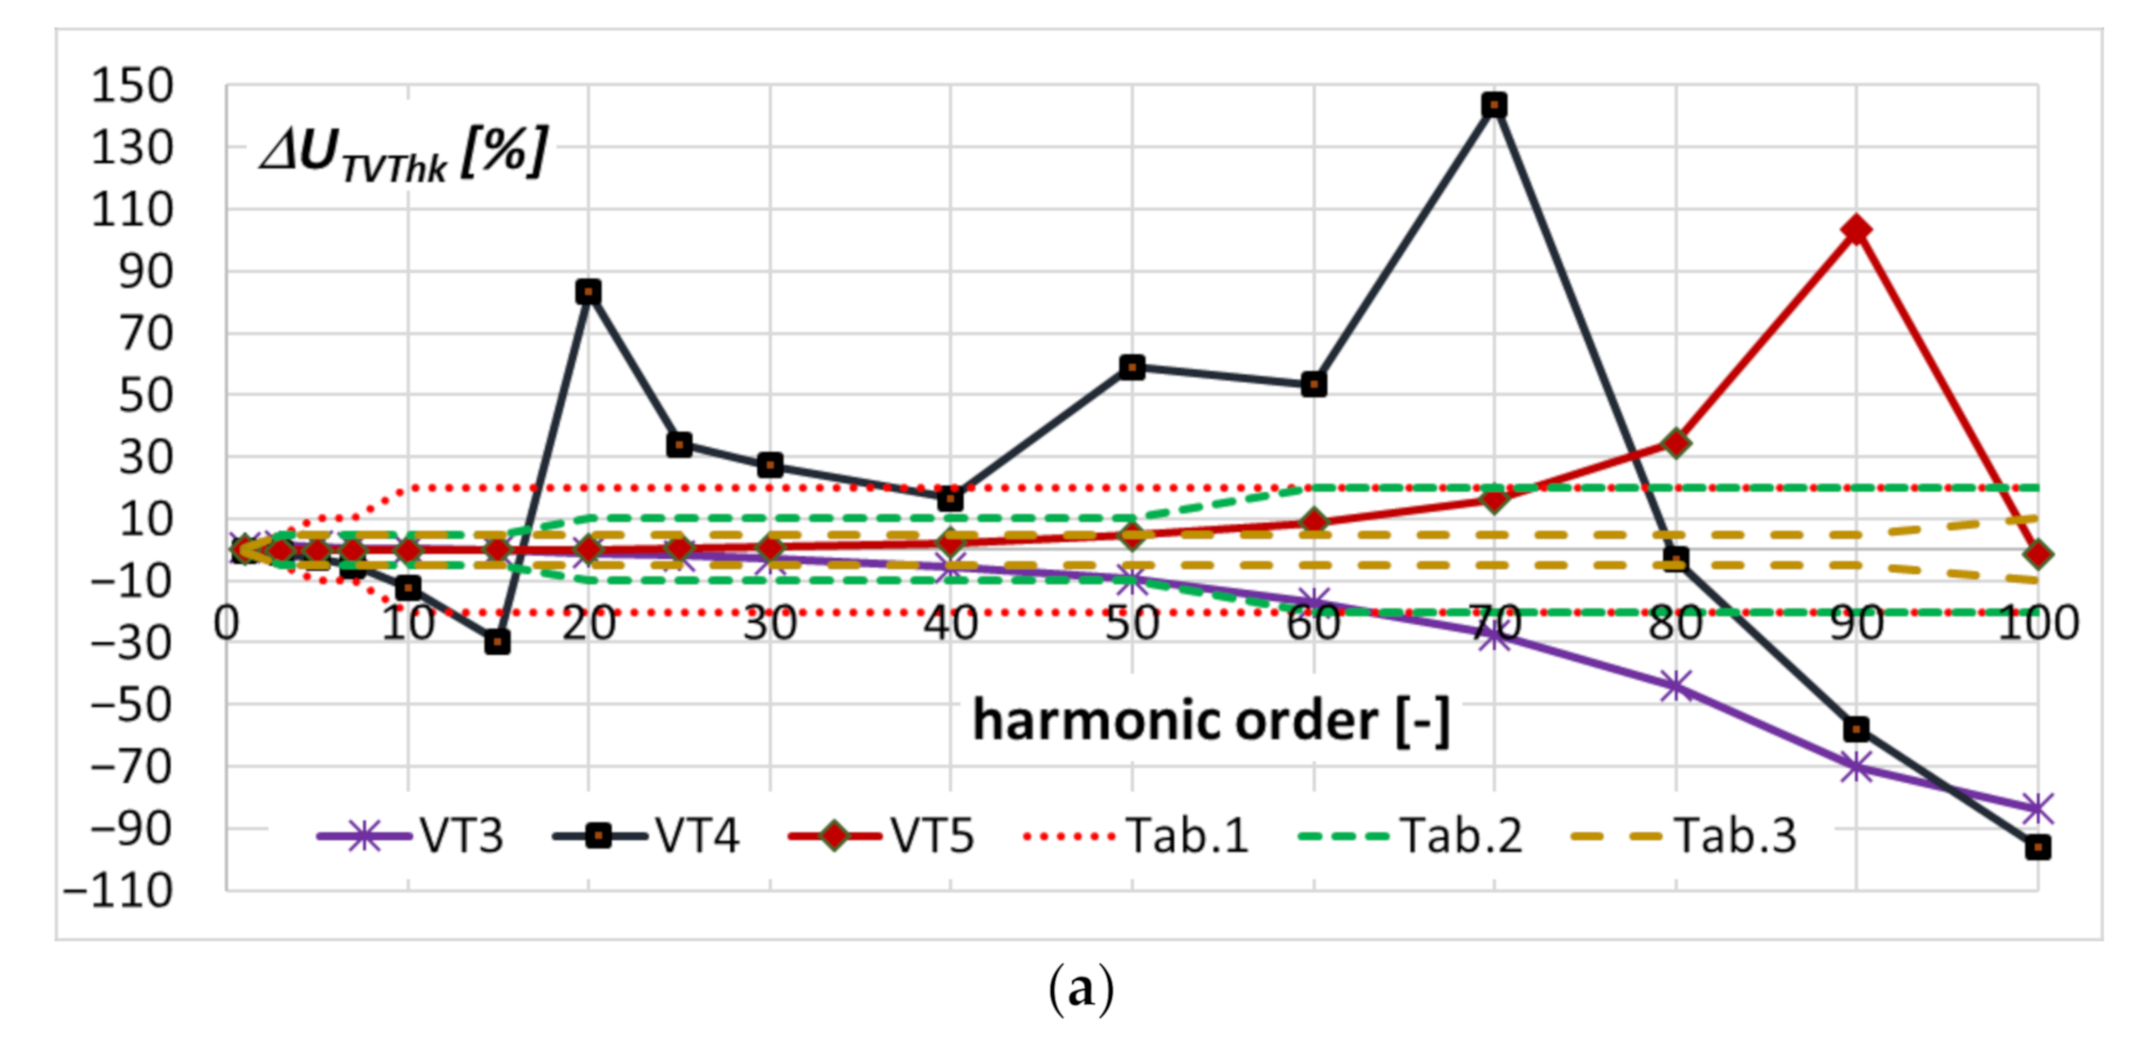
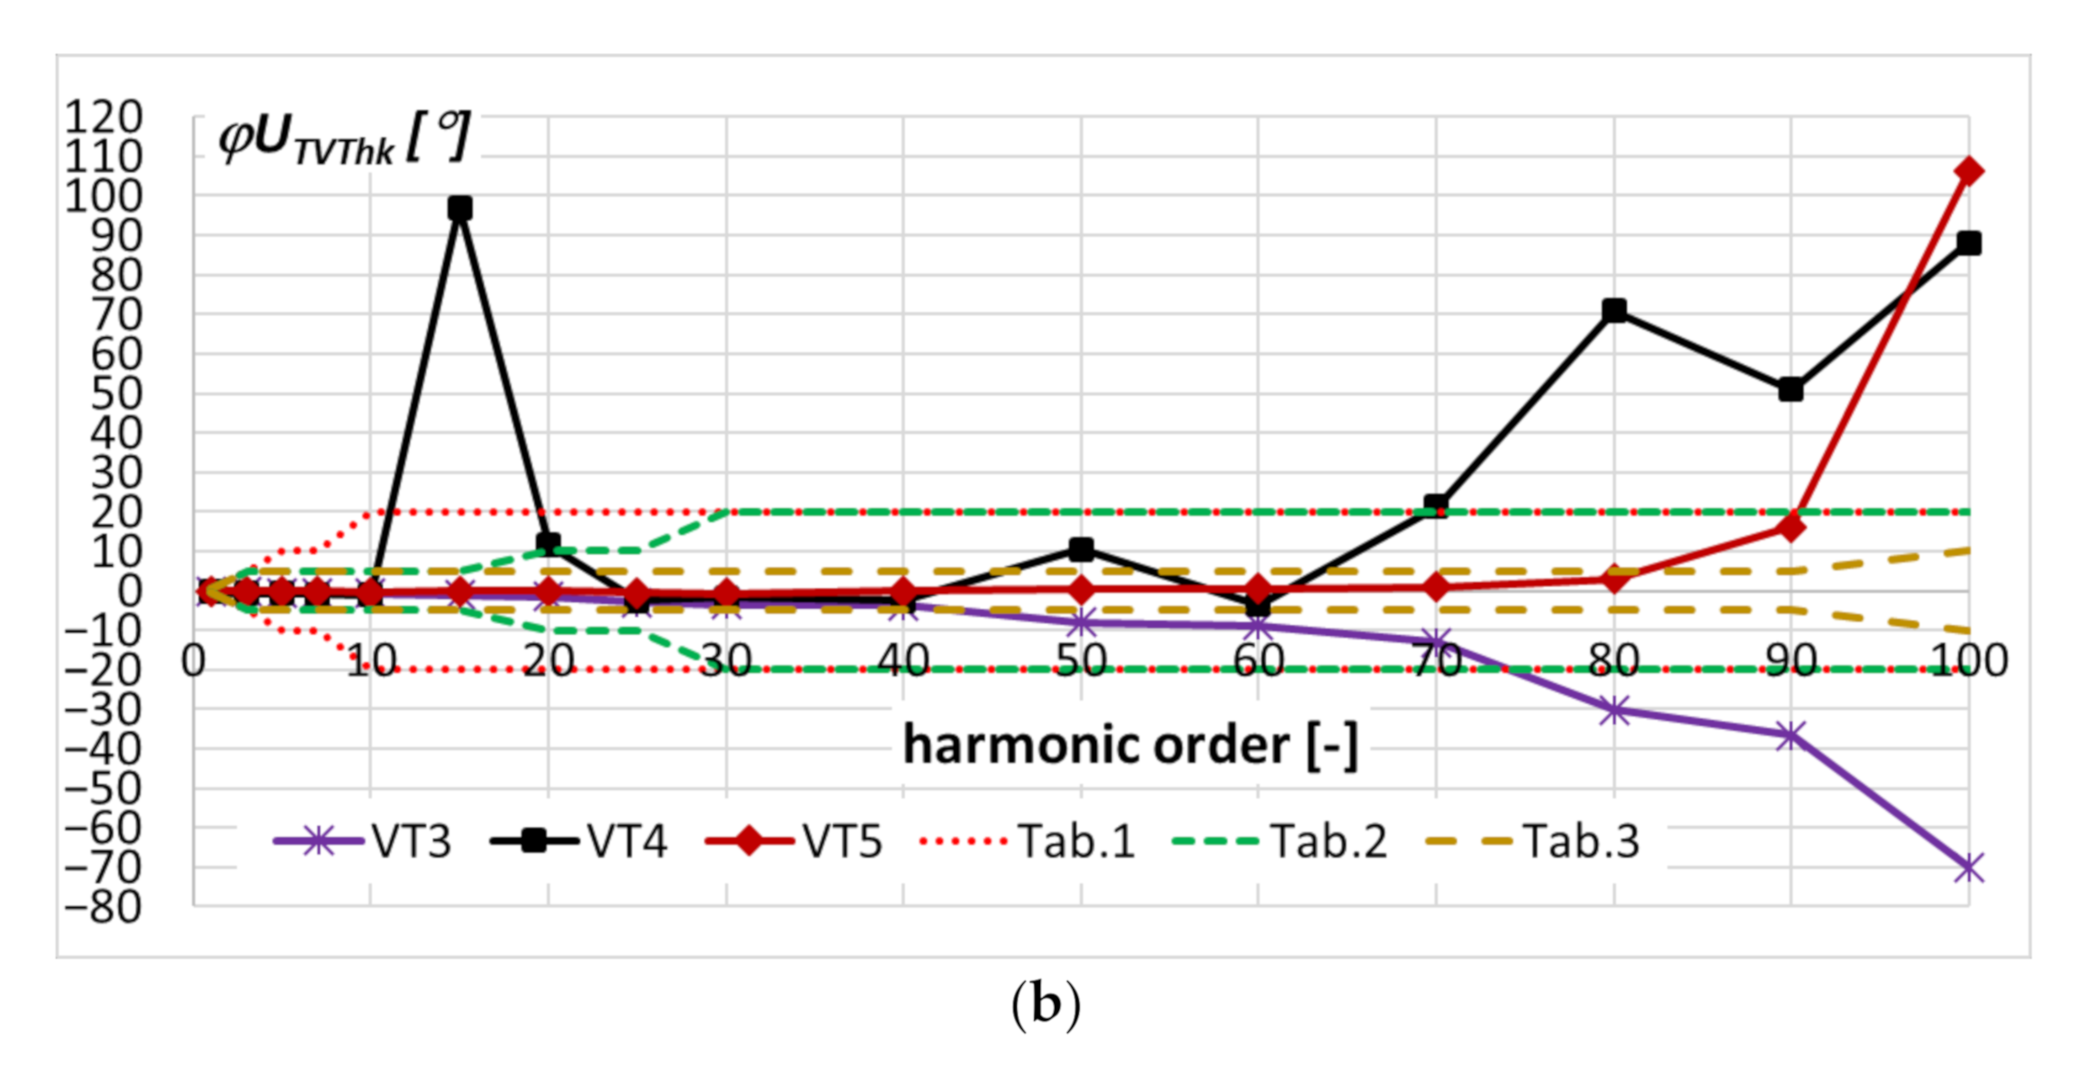
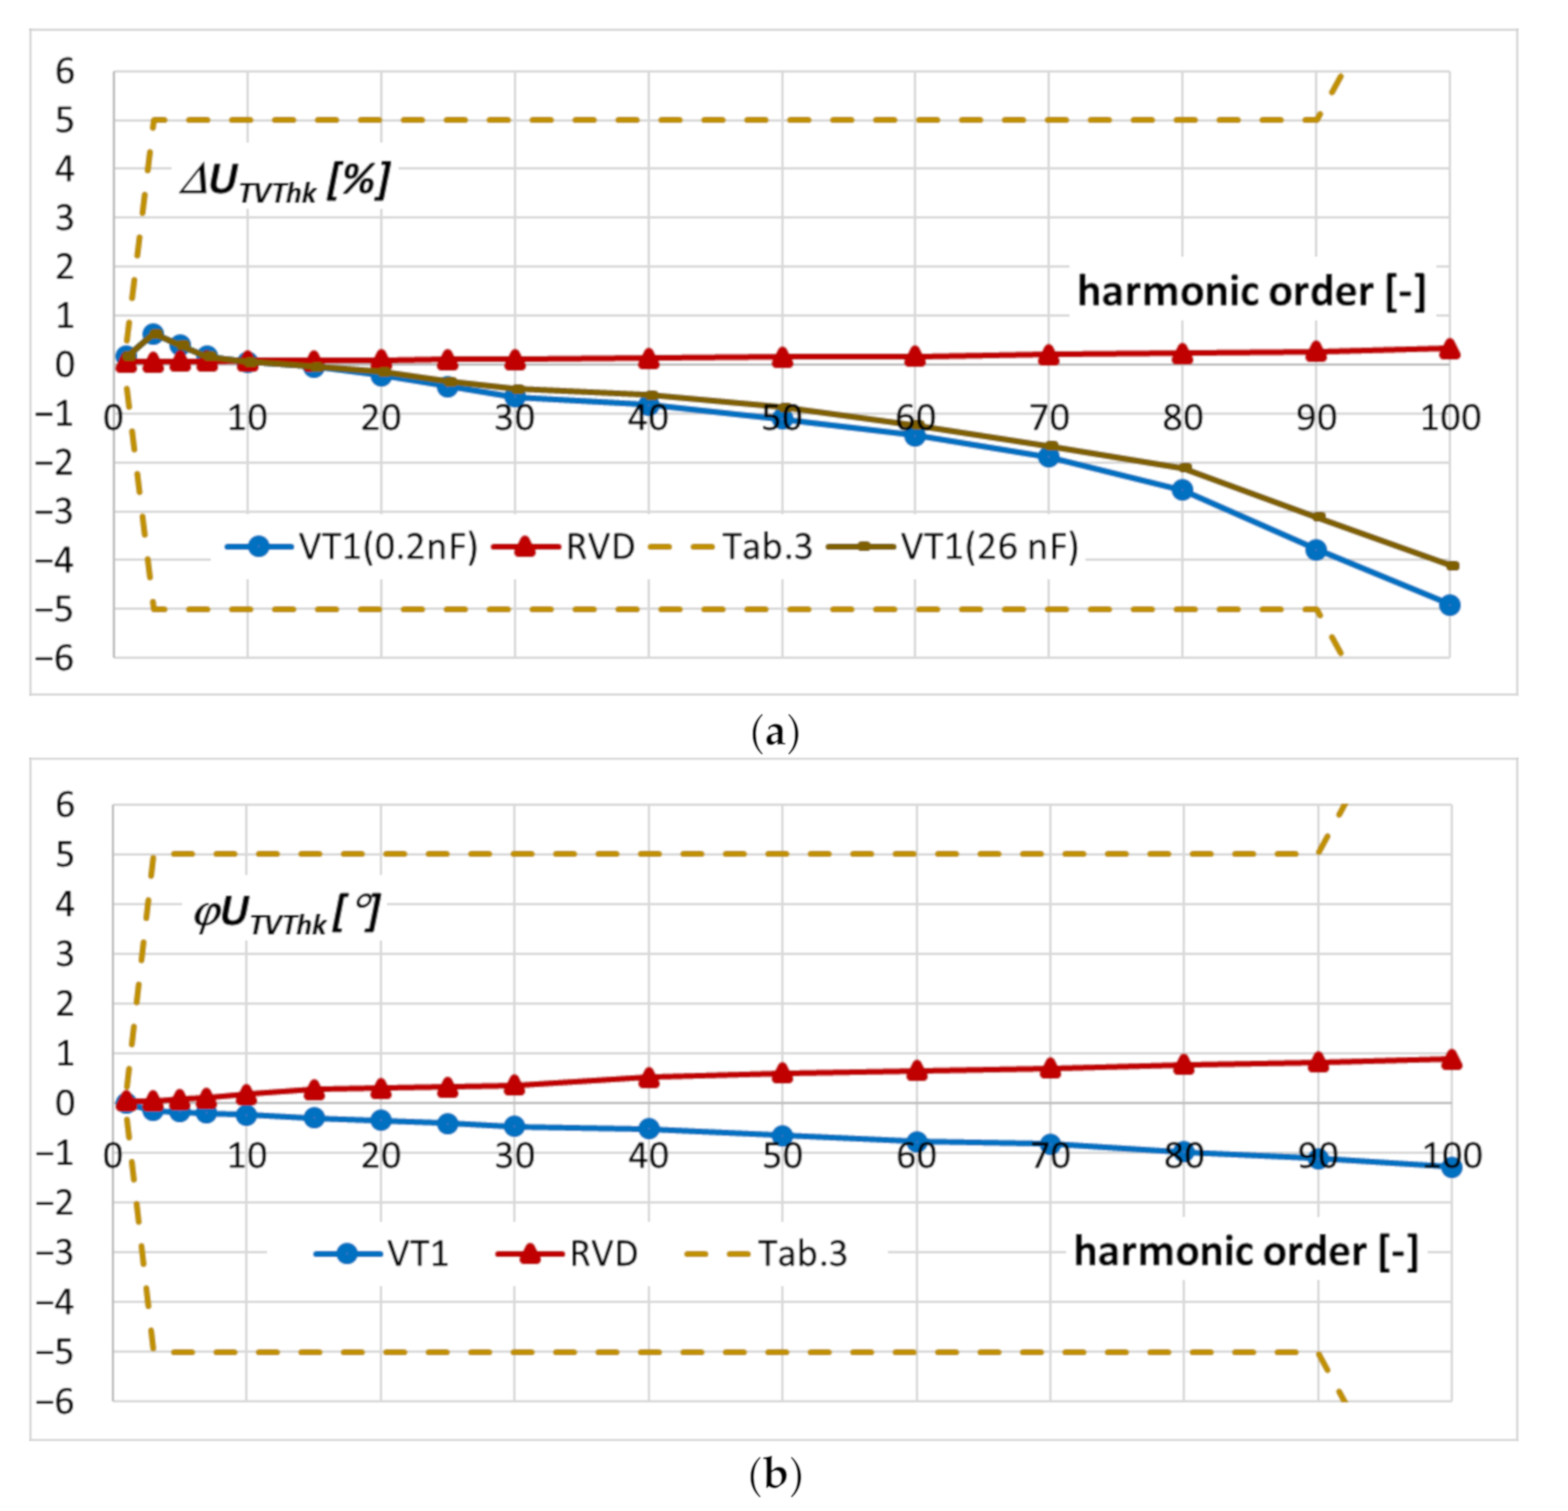
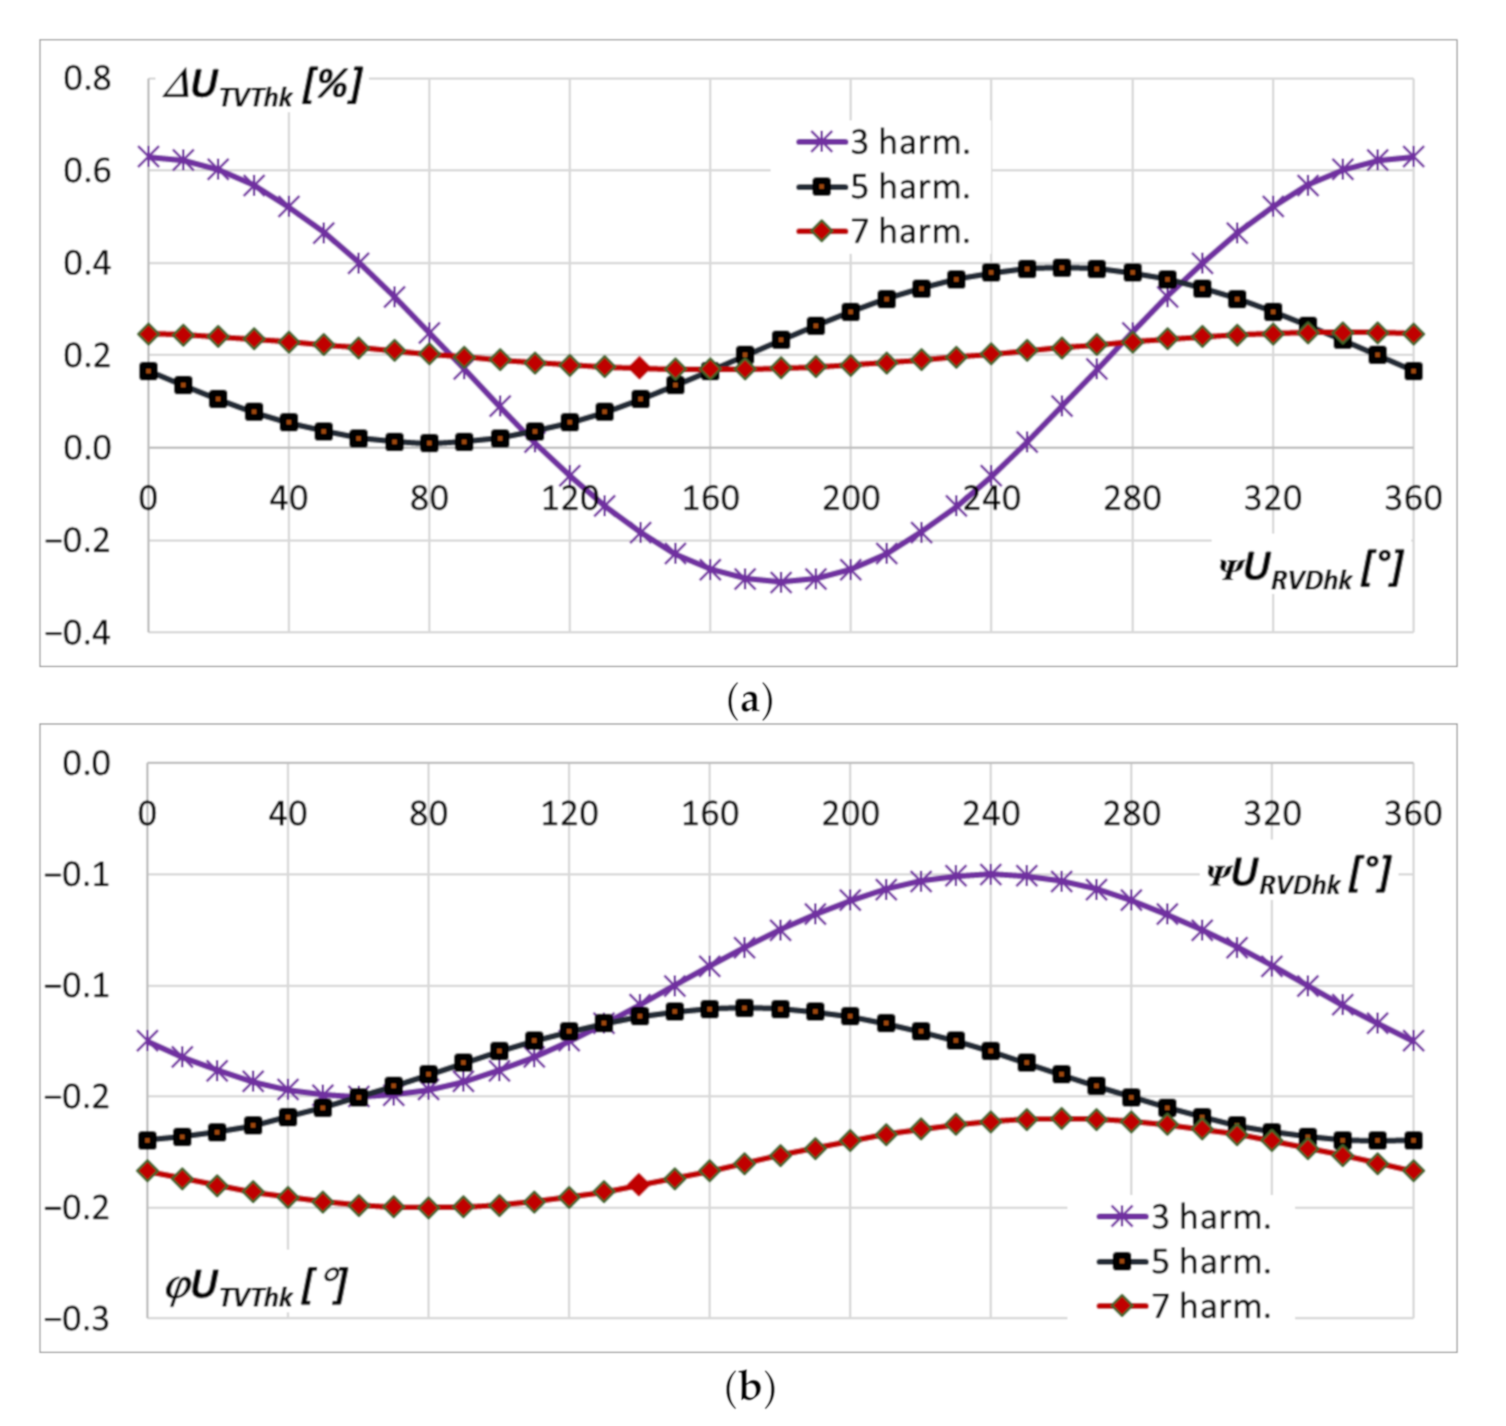
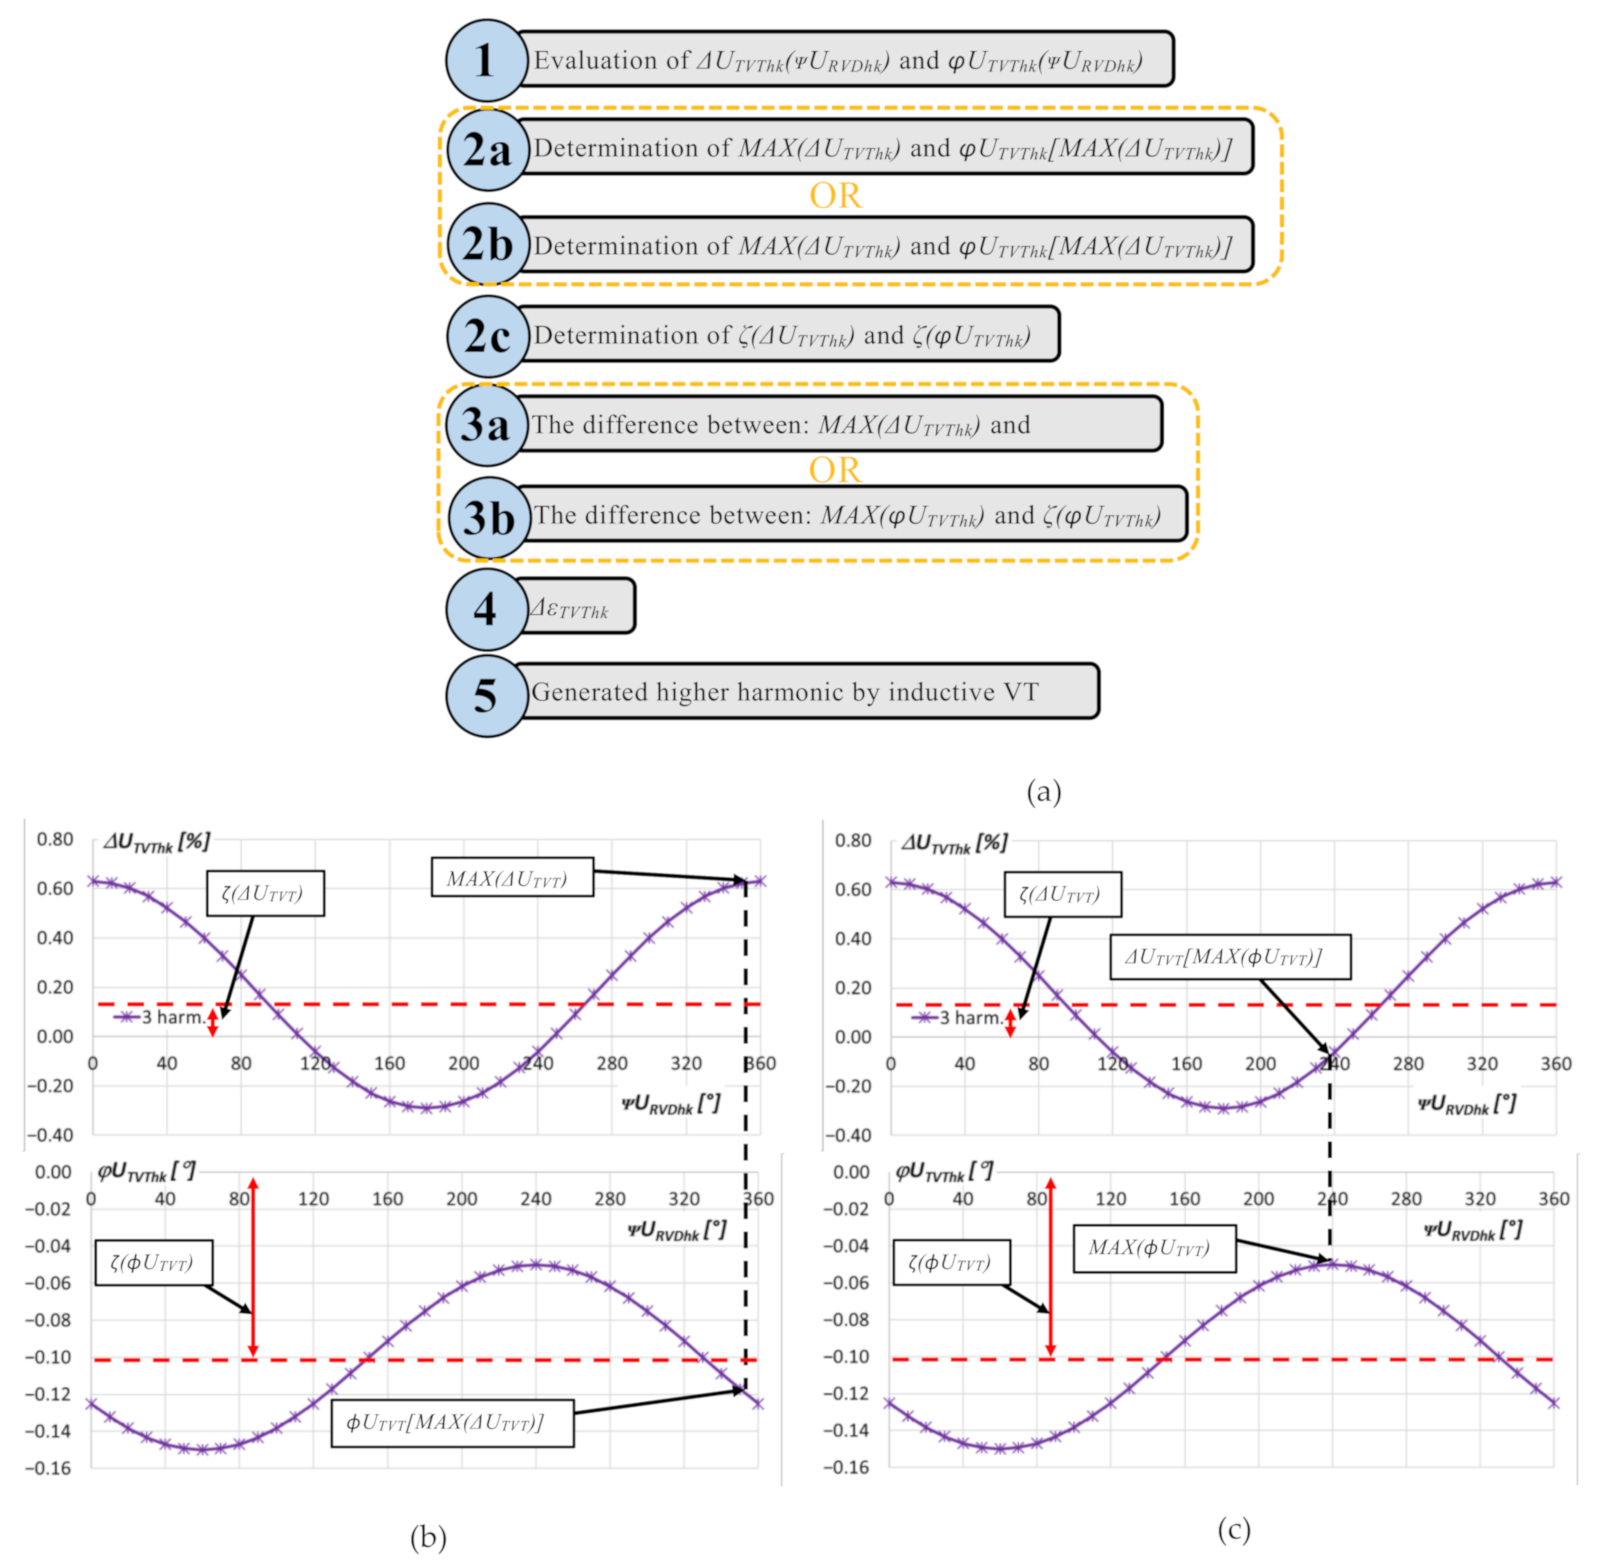
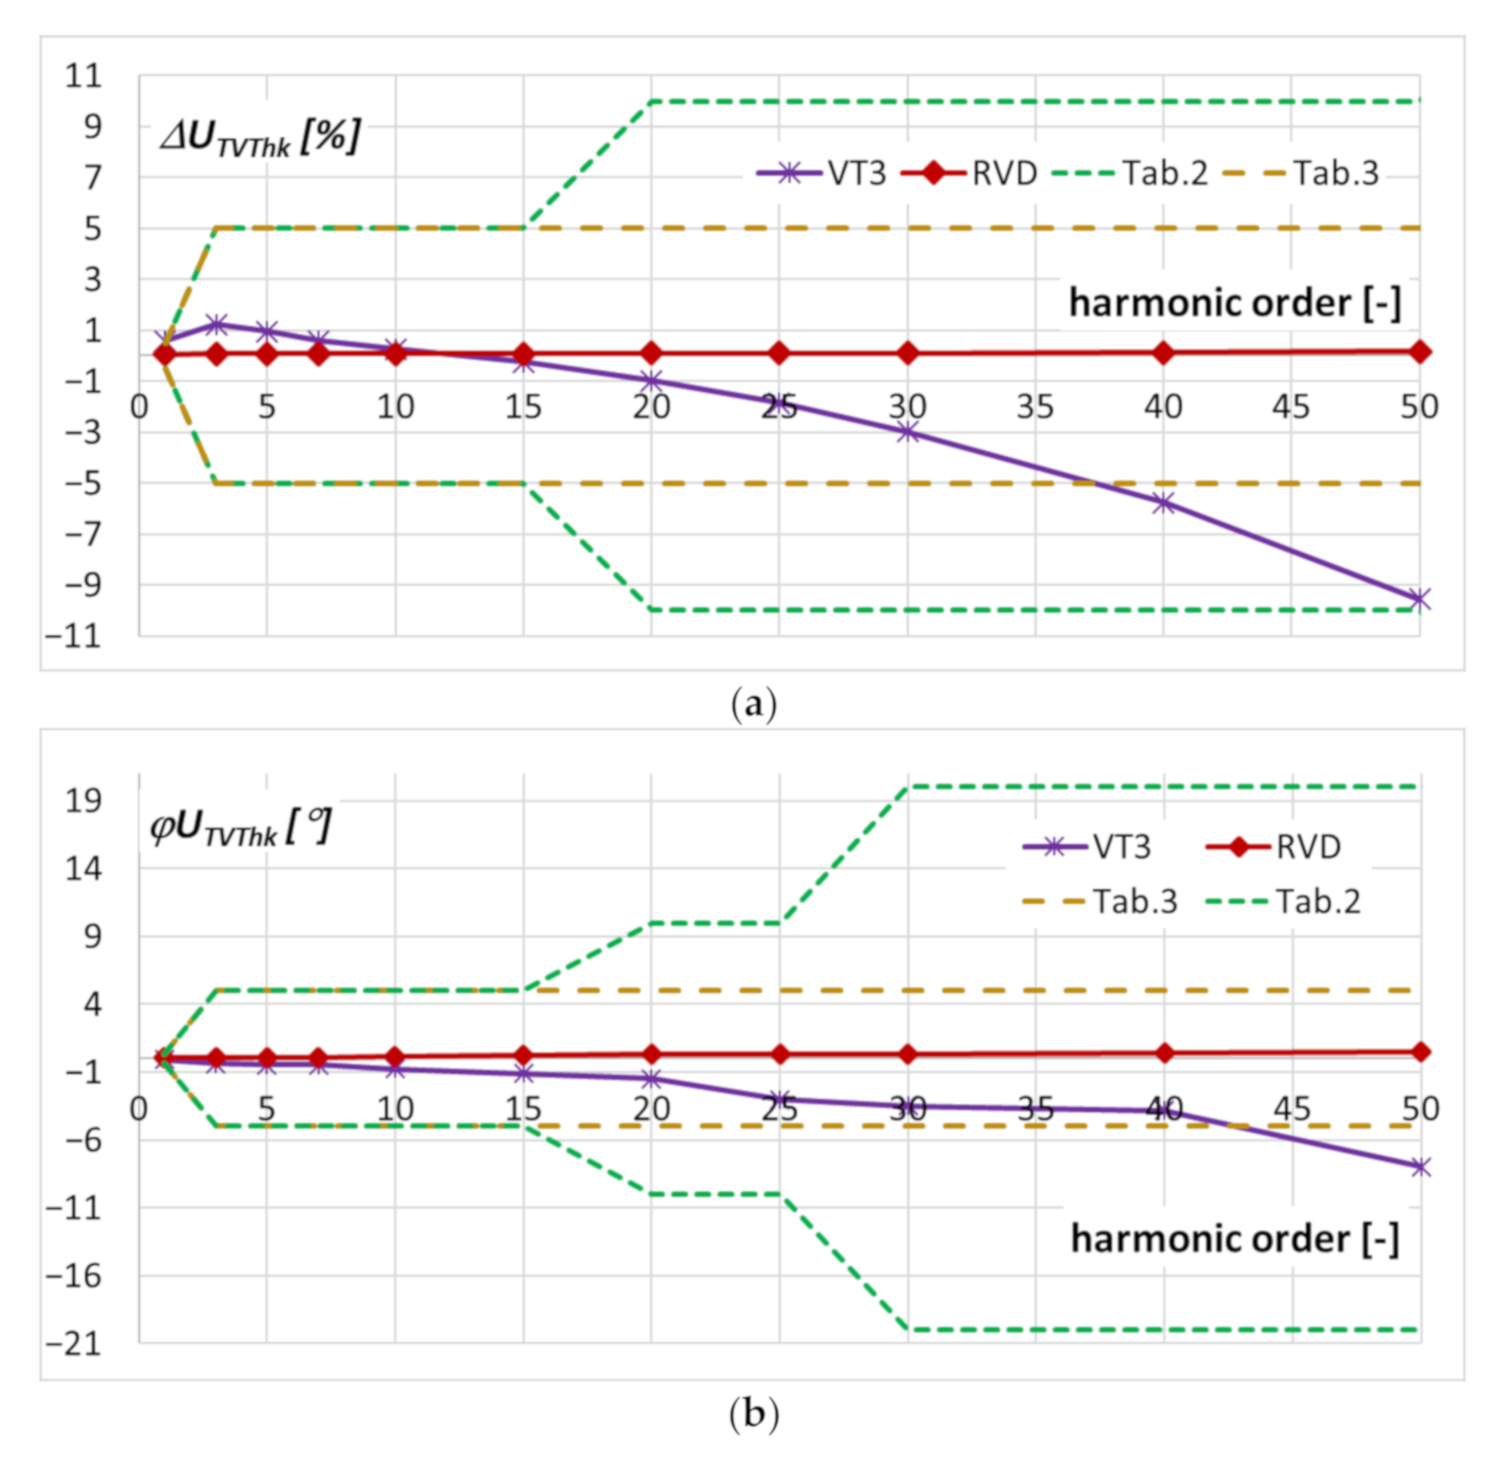
5. The Results of the Measurements for Transformation of Harmonics of the Distorted Primary Voltage

In the first part of the studies the values of voltage error and phase displacement of transformation of harmonics of the distorted primary voltage by two inductive VTs with rated primary voltage (15/√3) kV were determined (Figure 3).
The inductive VT labelled VT2 shows multi-resonance behaviour, while VT1 in the tested range up to the frequency 5 kHz is compliant with the requirements defined in the standard IEC 61869-6 for the LPIT and presented in Table 1, Table 2 and Table 3.
In Figure 4 the obtained values of voltage error and phase displacement of transformation of harmonics of the distorted primary voltage by for three inductive VTs with rated primary voltage (20/√3) kV are presented.
The inductive VTs labelled VT4 shows multi-resonance behaviour, while VT5 is near resonance frequency at 5 kHz. The VT3 in the tested range up to the frequency 5 kHz shows the highest wideband transformation accuracy that will be further analysed.
In Figure 5 the values of voltage error and phase displacement at harmonics of inductive VT with rated primary voltage (15/√3) kV and of the wideband reference voltage divider at voltage ratio 150 and same input voltage are compared. For comparison the most accurate inductive VT up to frequency of higher harmonic equal to 5 kHz is chosen from Figure 3.
The values of voltage error (Figure 5a) did not exceed −5%, while the values of phase displacement (Figure 5b) did not exceed −2°. Moreover, for transformation of harmonics of distorted primary voltage the influence of connected capacitance on the obtained values of voltage error and phase displacement was tested. A typical value of the input capacitance of the voltage measuring channel of the used DPM is 0.2 nF. If the value of the parallel capacitance is increase to 1 nF only a slight increase of the voltage error is detected, while the increase of this capacitance to 26 nF results in significant change of the values of voltage error determined for the tested VT1. However, there was no detected change of the value of the phase displacement.
To determine the maximum values of the voltage error and phase displacement for transformation of the 3rd, 5th and 7th by tested VTs their phase in relation to the main harmonic of the primary voltage is changed in 10° steps during the test. In Figure 6 the change of the values of voltage error (a) and phase displacement (b) with the change of the value of phase angle of transformed higher harmonics in relation to the main harmonic of distorted primary voltage are presented.
The maximum values of the voltage error and phase displacement of transformation of the low order higher harmonics 3rd, 5th and 7th are obtained at different phase angles in relation to the main harmonic of the distorted primary voltage. These values are changing sinusoidally with this phase angle. Its influence decreases with increase of the frequency of higher harmonic. Therefore, when the RMS value of higher harmonic is set to 10% of the primary component it is significant only up to its 7th order.
To calculate the values of the low order higher harmonics self-generated in the secondary voltage by an inductive VT there are two methods. In the first approach the procedure starts with determination of the maximum value of voltage error. In the second approach the calculations may start with determination of the maximum value of phase displacement. The flow chart of the developed method is presented in Figure 7.
In the first step of the developed procedure to calculate the low order higher harmonics generated in the secondary voltage of the inductive VT the values of voltage error ΔUTVThk and phase displacement ϕUTVThk for the low order higher harmonics are determined. The value of phase angle of each higher harmonic in relation to the main harmonic is changed by 10° during the test (Figure 7a: p. 1). In the second step the maximum value of voltage error MAX(ΔUTVThk) and corresponding value of phase displacement ϕUTVT[MAX(ΔUTVThk)] from Figure 7b are chosen (Figure 7a: p. 2a). Alternatively, the maximum value of phase displacement MAX(ϕUTVThk) and corresponding value of voltage error ΔUTVT[MAX(ϕUTVThk)] from Figure 7c are chosen (Figure 7a: p. 2b). In the same step the average values ζ(ΔUTVThk) of voltage error (Figure 7b) or ζ(ϕUTVThk) phase displacement (Figure 7c) are calculated (Figure 7a point 2c). In the third step the value of the difference between the maximum value MAX(ΔUTVThk) and the average value ζ(ΔUTVThk) of voltage error (Figure 7a: p. 3a) or the value of the difference between the maximum value MAX(ϕUTVThk) and the average value ζ(ϕUTVThk) of phase displacement is calculated (Figure 7a: p. 3b). In the next step (Figure 7a: p. 4) the value of the composite error is calculated from Equation (6) for the maximum value of voltage error or from Equation (7) for the maximum value of phase displacement:
ε T V T h k = M A X U T V T h k ζ U T V T h k 2 + sin φ U T V T M A X U T V T h k ζ φ U T V T h k 2 · 100 %
ε T V T h k = U T V T M A X φ U T V T h k ζ U T V T h k 2 + sin M A X φ U T V T h k ζ φ U T V T h k 2 · 100 %
Then finally the percentage values of the self-generated higher harmonics to the secondary voltage Ughk% are determined from Equation (8):
U g h k % = ε T V T h k · U R V D h k U T V T h 1
UTVTh1–the RMS value of the main harmonic of the secondary voltage of TVT.
In Figure 8 the percentage values of the self-generated higher harmonics to the secondary voltage by inductive VTs (15/√3) kV (a) and (20/√3) kV (b) determined for transformation of the sinusoidal voltage of rated value are presented.
The values of the self-generated higher harmonics to the secondary voltage are calculated as a percentage of the RMS value of the main harmonic of the secondary voltage. The inductive VT3 (20/√3) kV is characterized by higher self-distortion of the secondary voltage than VT1 (15/√3) kV. The most important observation is that the values of self-generated higher harmonics are very small and the power analyzer is unable to detect them in the secondary voltage of inductive VT. The values presented in Figure 8 are determined from the developed procedure and although they are rather small they have a significant influence on the wideband transformation accuracy of both inductive VTs.
In Figure 9 the determined values of voltage error and phase displacement at harmonics of inductive VT with rated primary voltage (20/√3) kV and of the wideband reference voltage divider at voltage ratio 200 are compared. In this case the most accurate inductive VT up to frequency of higher harmonic equal to 2.5 kHz is chosen from Figure 4.
In the case presented in Figure 9 the analysed frequencies range is limited to 2.5 kHz. The inductive VT with the rated primary voltage equal to (20/√3) kV is able to ensure the accuracy classes extension for quality metering required by the standard IEC 61869-6 for the LPIT.

6. Conclusions

The MV inductive voltage transformer may ensure transformation of harmonics of distorted primary voltage with values of voltage error and phase displacement as required by the standard IEC 61869-6 for the LPIT. The influence of the secondary winding on the resonance behavior of the MV inductive voltage transformer is negligible. Different harmonics transformation accuracies of the tested MV inductive instrument transformers show that the proposed tests are required prior to their application in the power network where their wideband properties may be required. Moreover, the problem with the wideband transformation accuracy of the inductive VTs is also connected with the nonlinearity of the magnetization characteristic of their magnetic core. Therefore, for transformation of the sinusoidal voltage in their secondary voltage the significant values of the 3rd, 5th and 7th harmonic are present. This also causes a need for the phase angle of the transformed higher harmonic to be considered when assessing the transformation accuracy of inductive VTs. However, the values of the low order higher harmonics are not easily detectable. Therefore, the developed method that enables calculation of the values of the low order higher harmonics generated in the secondary voltage due to the nonlinearity of the magnetization characteristic of their magnetic core must be used.

Author Contributions

Conceptualization, M.K. and E.S.; methodology, M.K. and E.S.; validation, M.K. and E.S.; formal analysis, M.K. and E.S.; investigation, M.K. and E.S.; resources, M.K. and E.S.; data curation, M.K. and E.S.; writing—original draft preparation, M.K.; writing—review and editing, M.K. and E.S.; visualization, E.S.; supervision, M.K. All authors have read and agreed to the published version of the manuscript.

Funding

This research received no external funding.

Institutional Review Board Statement

Not applicable.

Informed Consent Statement

Not applicable.

Data Availability Statement

Not applicable.

Conflicts of Interest

The authors declare no conflict of interest.

List of Symbols and Acronyms

Symbols with two dashes (‘’) indicate parameters converted to a secondary circuit.
C”B12/C”B(n-1)nparasitic capacitance between neighbor layers of the primary winding,
C”G11/C”G12/C”G1npartial equivalent capacitance of the primary winding to ground,
C”T11/C”T12/C”T1npartial equivalent capacitance between the primary and secondary windings,
C2equivalent capacitance of the secondary winding,
DA high impedance wideband amplifier (1:1) to convert the differential voltage to single ended voltage,
DPM digital power meter,
hkorder of higher harmonic e.g., h1 is first harmonic, h3 is third harmonic.
L’’μ mutual inductance between primary and secondary windings,
L”11/L”12/L”1npartial leakage inductance of the primary winding,
L2leakage inductance of the secondary winding,
MAX(ϕUTVThk)the maximum value of phase displacement,
MAX(ΔUTVThk)the maximum value of voltage error,
PPS programmable power supply system,
R”11/R”12/R”1npartial resistance of the primary winding,
R”Fe equivalent resistance of the iron losses in the magnetic core,
R2 resistance of the secondary winding,
RVD reference wideband voltage divider,
SVT supplying inductive VT used to step-up distorted voltage,
TVT tested inductive voltage transformer,
U(C)TVThkthe RMS values of a hk harmonic in the output voltage of the TVT; (UCVThk) if differential method is used or measured by DPM on the secondary winding of TVT (UTVThk),
u”1 instantaneous value of the primary voltage,
u2 instantaneous value of the secondary voltage,
UCVThkcalculated RMS value of a hk harmonic on the secondary winding of TVT,
UDAhkthe RMS values of a hk higher harmonic in the output voltage of the DA,
Ughk% the the percentage values of the self-generated higher harmonics into the secondary voltage
URVDhkthe RMS values of a hk harmonic in the output voltage of the RVD,
ΔUTVT[MAX(ϕUTVThk)]the value of voltage error determined for the MAX(ϕUTVThk),
ΔεTVThkthe value of the composite error of transformation of a hk harmonic of the distorted voltage by TVT,
ζ(ϕUTVThk)the average value of the change of the phase displacement with phase angle of transformed higher harmonic in relation to the main higher harmonic of distorted voltage,
ζ(ΔUTVThk)the average value of the change of the voltage error with phase angle of transformed higher harmonic in relation to the main higher harmonic of distorted voltage,
φUTVThkthe phase displacement of transformation of a hk harmonic of the distorted voltage by TVT,
ϕRVDDAhkthe phase shift of a hk harmonic in the output voltage of the DA in relation to the hk harmonic in the reference voltage from the RVD,
ϕUTVT[MAX(ΔUTVThk)]the value of phase displacement determined for the MAX(ΔUTVThk).

References

  1. IEC. IEC 61869-103 Instrument Transformers—The Use of Instrument Transformers for Power Quality Measurement; IEC: Geneva, Switzerland, 2012. [Google Scholar]
  2. Vieira, D.; Shayani, R.A.; De Oliveira, M.A.G. Reactive Power Billing under Nonsinusoidal Conditions for Low-Voltage Systems. IEEE Trans. Instrum. Meas. 2017, 66, 2004–2011. [Google Scholar] [CrossRef]
  3. Kaczmarek, M. Measurement error of non-sinusoidal electrical power and energy caused by instrument transformers. IET Gener. Transm. Distrib. 2016, 10, 3492–3498. [Google Scholar] [CrossRef]
  4. Faifer, M.; Laurano, C.; Ottoboni, R.; Toscani, S.; Zanoni, M. Harmonic Distortion Compensation in Voltage Transformers for Improved Power Quality Measurements. IEEE Trans. Instrum. Meas. 2019, 68, 3823–3830. [Google Scholar] [CrossRef]
  5. Kaczmarek, M. Inductive current transformer accuracy of transformation for the PQ measurements. Electr. Power Syst. Res. 2017, 150, 169–176. [Google Scholar] [CrossRef]
  6. Filipović-Grčić, D.; Filipović-Grčić, B.; Krajtner, D. Frequency response and harmonic distortion testing of inductive voltage transformer used for power quality measurements. Procedia Eng. 2017, 202, 159–167. [Google Scholar] [CrossRef]
  7. Kaczmarek, M.; Stano, E. Nonlinearity of Magnetic Core in Evaluation of Current and Phase Errors of Transformation of Higher Harmonics of Distorted Current by Inductive Current Transformers. IEEE Access 2020, 8, 118885–118898. [Google Scholar] [CrossRef]
  8. Kaczmarek, M.; Stano, E. Measuring system for testing the transformation accuracy of harmonics of distorted voltage by medium voltage instrument transformers. Measurement 2021, 181, 109628. [Google Scholar] [CrossRef]
  9. Kaczmarek, M.; Brodecki, D. Transformation of Transient Overvoltages by Inductive Voltage Transformers. Sensors 2021, 21, 4167. [Google Scholar] [CrossRef]
  10. Popov, M. General approach for accurate resonance analysis in transformer windings. Electr. Power Syst. Res. 2018, 161, 45–51. [Google Scholar] [CrossRef]
  11. Aydogan, A.; Atalar, F.; Yilmaz, A.E.; Rozga, P. Using the method of harmonic distortion analysis in partial discharge assessment in mineral oil in a non-uniform electric field. Energies 2020, 13, 4830. [Google Scholar] [CrossRef]
  12. Mingotti, A.; Bartolomei, L.; Peretto, L.; Tinarelli, R. On the long-period accuracy behavior of inductive and low-power instrument transformers. Sensors 2020, 20, 5810. [Google Scholar] [CrossRef] [PubMed]
  13. Crotti, G.; D’Avanzo, G.; Giordano, D.; Letizia, P.S.; Luiso, M. Extended SINDICOMP: Characterizing MV Voltage Transformers with Sine Waves. Energies 2021, 14, 1715. [Google Scholar] [CrossRef]
  14. Faifer, M.; Laurano, C.; Ottoboni, R.; Toscani, S.; Zanoni, M.; Crotti, G.; Giordano, D.; Barbieri, L.; Gondola, M.; Mazza, P. Overcoming Frequency Response Measurements of Voltage Transformers: An Approach Based on Quasi-Sinusoidal Volterra Models. IEEE Trans. Instrum. Meas. 2019, 68, 2800–2807. [Google Scholar] [CrossRef]
  15. IEC. IEC 61869-6 Instrument Transformers—Additional General Requirements for Low-Power Instrument Transformers; IEC: Geneva, Switzerland, 2016. [Google Scholar]
  16. Stano, E.; Kaczmarek, M. Wideband self-calibration method of inductive cts and verification of determined values of current and phase errors at harmonics for transformation of distorted current. Sensors 2020, 20, 2167. [Google Scholar] [CrossRef] [PubMed] [Green Version]
  17. Ballal, M.S.; Wath, M.G.; Suryawanshi, H.M. A novel approach for the error correction of ct in the presence of harmonic distortion. IEEE Trans. Instrum. Meas. 2019, 68, 4015–4027. [Google Scholar] [CrossRef]
  18. Cristaldi, L.; Faifer, M.; Laurano, C.; Ottoboni, R.; Toscani, S.; Zanoni, M. A Low-Cost Generator for Testing and Calibrating Current Transformers. IEEE Trans. Instrum. Meas. 2019, 68, 2792–2799. [Google Scholar] [CrossRef]
  19. Kaczmarek, M.; Stano, E. Proposal for extension of routine tests of the inductive current transformers to evaluation of transformation accuracy of higher harmonics. Int. J. Electr. Power Energy Syst. 2019, 113, 842–849. [Google Scholar] [CrossRef]
  20. Klatt, M.; Meyer, J.; Elst, M.; Schegner, P. Frequency responses of MV voltage transformers in the range of 50 Hz to 10 kHz. In Proceedings of the ICHQP 2010—14th International Conference on Harmonics and Quality of Power, Bergamo, Italy, 26–29 September 2010; pp. 1–6. [Google Scholar]
  21. Lesniewska, E.; Kaczmarek, M.; Stano, E. 3D Electromagnetic Field Analysis Applied to Evaluate the Accuracy of a Voltage Transformer under Distorted Voltage. Energies 2021, 14, 136. [Google Scholar] [CrossRef]
  22. IEC. IEC 61869-3 Instrument Transformers—Additional Requirements for Inductive Voltage Transformers; IEC: Geneva, Switzerland, 2011. [Google Scholar]
  23. IEC. IEC 61869-11 Instrument Transformers—Additional Requirements for Low Power Passive Voltage Transformers; IEC: Geneva, Switzerland, 2017. [Google Scholar]
  24. Kaczmarek, M. The effect of distorted input voltage harmonics rms values on the frequency characteristics of ratio error and phase displacement of a wideband voltage divider. Electr. Power Syst. Res. 2019, 167, 1–8. [Google Scholar] [CrossRef]
  25. Kaczmarek, M.; Szatilo, T. Reference voltage divider designed to operate with oscilloscope to enable determination of ratio error and phase displacement frequency characteristics of MV voltage transformers. Meas. J. Int. Meas. Confed. 2015, 68, 22–31. [Google Scholar] [CrossRef]
  26. Kaczmarek, M. Development and application of the differential voltage to single-ended voltage converter to determine the composite error of voltage transformers and dividers for transformation of sinusoidal and distorted voltages. Meas. J. Int. Meas. Confed. 2017, 101, 53–61. [Google Scholar] [CrossRef]
  27. Kaczmarek, M.; Kaczmarek, P. Comparison of the wideband power sources used to supply step-up current transformers for generation of distorted currents. Energies 2020, 13, 1849. [Google Scholar] [CrossRef]
Figure 1. The model of inductive VT: (a) extended equivalent circuit in the frequency range up to 20 kHz, (b) rendering of an inductive VT.
Energies 14 04432 g001
Figure 2. The measuring system: (a) schematic diagram, (b) photo of the laboratory setup.
Energies 14 04432 g002
Figure 3. The results for the inductive VTs with rated primary voltage (15/√3) kV: (a) voltage error, (b) phase displacement of transformation of harmonics of the distorted primary voltage.
Energies 14 04432 g003
Figure 4. The results for the inductive VTs with rated primary voltage (20/√3) kV: (a) voltage error, (b) phase displacement of transformation of harmonics of the distorted primary voltage.
Energies 14 04432 g004aEnergies 14 04432 g004b
Figure 5. The results for the inductive VT (15/√3) kV and the wideband reference voltage divider: (a) voltage error, (b) phase displacement at harmonics.
Energies 14 04432 g005
Figure 6. The changes of the values of voltage error (a) and phase displacement (b) with the phase angle of transformed higher harmonics.
Energies 14 04432 g006
Figure 7. The method to calculate the values of the low order higher harmonics self-generated to the secondary voltage of the inductive VT: (a) flow chart, (b) the approach with the maximum value of voltage error (c) the approach with the maximum value of phase displacement.
Energies 14 04432 g007
Figure 8. The percentage values of the self-generated higher harmonics (a) (15/√3) kV and (b) (20/√3) kV.
Energies 14 04432 g008
Figure 9. The results for the inductive VT (20/√3) kV and the wideband reference voltage divider: (a) voltage error, (b) phase displacement at harmonics.
Energies 14 04432 g009
Table 1. Measuring accuracy classes [15].
Accuracy ClassRatio Error at Low Frequency [%]Ratio Error (±) at Harmonics [%]Phase Displacement (±) at Low Frequency [°]Phase Displacement (±) at Harmonics [°]
0 Hz1 Hz2nd to 4th5th and 6th7th to 9th10th to 13thAbove 13th1 Hz2nd to 4th5th and 6th7th to 9th10th to 13th
0.1+1
−100
+1
−30
1248+8
−100
451248
0.2 0.2S+2
−100
+2
−30
24816+16
−100
4524816
0.5 0.5S+5
−100
+5
−30
5102020+20
−100
455102020
1+10
−100
+10
−30
10202020+20
−100
4510202020
Table 2. Accuracy classes extension for quality metering and low bandwidth DC applications [15].
Accuracy ClassRatio Error (±) at Frequencies Shown Below [%]Phase Displacement (±) at Frequencies Shown Below [°]
(0.1 ≤ f ˂ 1) kHz(1 ≤ f ˂ 1.5) kHz(1.5 ≤ f ˂ 3) kHz(0.1 ≤ f ˂ 1) kHz(1 ≤ f ˂ 1.5) kHz(1.5 ≤ f ˂ 3) kHz
0.1125125
0.2 0.2S245245
0.5 0.5S5101051020
1102020102020
Table 3. Accuracy classes extension for high bandwidth DC applications [15].
Accuracy ClassRatio Error (±) at Frequencies Shown Below [%]Phase Displacement (±) at Frequencies Shown Below [°]
(0.1 ≤ f ˂ 5) kHz(5 ≤ f ˂ 10) kHz(10 ≤ f ˂ 20) kHz(0.1 ≤ f ˂ 5) kHz(5 ≤ f ˂ 10) kHz(10 ≤ f ˂ 20) kHz
0.1125125
0.2 0.2S245245
0.5 0.5S5101051020
1102020102020
Table 4. Transformation accuracy of the sinusoidal primary voltage of frequency 50 Hz.
TVTRated Primary Voltage [kV]Ratio Error at Rated Frequency 50 Hz [%]Phase Displacement at Rated Frequency 50 Hz [°]
VT115/√3+0.17+0.03
VT2−0.21−0.39
RVD+0.04+0.03
VT320/√3−0.11−0.34
VT4−0.31−0.36
VT5−0.03+0.03
RVD+0.04+0.04
Publisher’s Note: MDPI stays neutral with regard to jurisdictional claims in published maps and institutional affiliations.

