Article

Numerical Simulation on Cooling Effect of Working Face under Radiation Cooling Mode in Deep Well

1
Energy School, Xi’an University of Science and Technology, Xi’an 710054, China
2
Key Laboratory of Western Mines and Hazards Prevention, Ministry of Education of China, Xi’an 710054, China
3
School of Architecture and Civil Engineering, Xi’an University of Science and Technology, Xi’an 710054, China
*
Author to whom correspondence should be addressed.
Energies 2021, 14(15), 4428; https://doi.org/10.3390/en14154428
Submission received: 10 June 2021 / Revised: 12 July 2021 / Accepted: 19 July 2021 / Published: 22 July 2021

Abstract

:
Deep mining results in an increasingly serious hazard. Based on the principle of heat transfer and radiant cooling, a three-dimensional heat transfer model of the working face was established. The influence of the inlet airflow parameter, the surrounding wall temperature and other parameters on the temperature distribution of airflow along the working face were analyzed under the radiation cooling mode. The results show that the increment of airflow temperature in several sections along the working face decreases by 0.67 °C, 0.48 °C, 0.40 °C, 0.36 °C, 0.33 °C, 0.29 °C respectively. The farther away from the airflow inlet, the more obvious the cooling effect was. The airflow temperature of the working face is positively correlated with the airflow inlet temperature and the surrounding wall temperature, and is negatively correlated with the airflow velocity. The research provides a good solution for the working face cooling of deep mines, and also provides a theoretical reference for the research on the radiation cooling technology of the working face.

1. Introduction

With the rapid development of the national economy and the increasing demand for mineral resources, deep mining has become an inevitable development trend in the mining industry, and the heat damage caused by geothermal energy is becoming increasingly serious. Working in a high temperature environment not only reduces labor productivity and threatens the physical and mental health of workers, but also easily causes accidents [1,2,3]. Therefore, it is an urgent problem to alleviate the heat damage of mines in the deep mining of mineral resources.
The heat sources related to airflow temperature in the mine working face mainly include the heat releases of surrounding rock, coal falling, oxidation and other local heat sources [4,5,6,7]. When the heat damage is not serious, ventilation is the simplest and most effective cooling measure of the cooling methods and choosing appropriate ventilation parameters can not only effectively reduce the airflow temperature of the working face, but also reduce the operating cost of the cooling system [8]. Yue et al. [9] put forward the pre-cooling airflow cooling technology, which continuously mixes cold airflow with ventilated airflow; Zhang et al. [10] studied the suitable air volume and the influencing factors of ventilation cooling in the horizontal roadway. Lv [11] determined the optimal combination of air quantity and the cooling load in the working face. Feng et al. [12] adopted a full air-cooling system to decrease the airflow temperature of the working face. Zhang et al. [13] studied the pre-cooling or pre-heating of the airflow by entering the shallow roadway in mine. Zhu et al. [14] adopted the seasonal temperature difference of the underground surrounding rock to decrease the airflow temperature. Zhang et al. [15] deduced the change trend of airflow temperature in the mine and gave a formula for predicting the airflow temperature of the working face. All the above research shows that the ventilation can effectively alleviate the heat damage in the mine; however, ventilation gradually loses its cooling effect with the increase of mining depth, and the mechanical refrigeration is adopted for airflow cooling at this time. After comparing the existing cooling methods, Chen [16] proposed treatment measures and methods for non-artificial cooling airflow supplemented by mechanical refrigeration. Chen et al. [17] used a split-type steam compression refrigerator to effectively reduce the temperature of the working face, and Liu et al. [18] adopted air coolers to staged cooling airflow of the working face in the coal mine. An air cooler is one of the most commonly used cooling terminal equipment in mines. An air cooler cools the passing airflow. The cooled air is mixed with the warm air that does not pass through the air cooler in the roadway, and the air temperature entering the working face of the coal mine can reach the required working temperature.
In recent years, radiation cooling has been used more and more extensively as a low-energy consumption cooling method, and the use of the combined operation of ventilation and radiation cooling as a piece of terminal equipment has become a hot research topic. Yuan et al. [19] studied the mixed use of ceiling radiation systems and natural ventilation, and the operation characteristics and limit area of the system. Krajčík et al. [20], Cheng et al. [21], Li et al. [22] and Yang et al. [23] combined displacement ventilation with floor radiation cooling or ceiling radiation cooling, and studied the influences of air supply parameters, water supply parameters and the installation locations of radiation cooling surfaces on the indoor thermal environment; the results showed that the mixed system could effectively improve the indoor thermal comfort, and the thermal comfort and ventilation effect are better in the region closer to the heat source. Liu et al. [24] studied the system performance of the combined operation of ductless displacement ventilation and floor radiation cooling, and the results showed that the system can effectively improve indoor air quality and has a good thermal comfort.
Based on the backfill mining method [25,26], this research uses a combination of radiation cooling and ventilation to reduce the airflow temperature of the working face. The cold water pipe used for radiation cooling is arranged in the backfill layer. During coal mining, cold water is used to cool the airflow in the working face while recovering the airflow heat energy. After the mining is completed, the pipe is used to realize geothermal mining by flowing heat-carrying fluid. Based on the heat transfer theory, the three-dimensional heat transfer model of the working face was established by using the Fluent simulation software. Taking the airflow in the working face as the research object, in the cooling and non-cooling modes, the distribution and variation law of the airflow temperature were analyzed under the influence of the air supply temperature, air supply velocity and the surrounding rock temperature and so on. The study is not only of great significance to alleviate the heat damage in deep mines and improve the design of ventilation systems, but can also realize the geothermal exploitation and improve the utilization rate of mineral resources and geothermal resources.

2. Model Establishment

Figure 1 shows the cooling and ventilation model of the coal face when a cold water pipe is arranged in the backfill layer of the goaf. With the continuous advancement of the coal face, the goaf is filled with slurry, and the pipe is placed in the goaf in advance and is embedded in the backfill layer after the slurry is solidified. During coal mining, the airflow temperature of the working face keeps rising due to the heat dissipation of the surrounding rock, coal wall, goaf, etc., and is combined with the influence of other heat sources. When the airflow temperature rises to exceed the limit stipulated in the Coal Mine Safety Regulations [27], it will seriously threaten the physical and mental health of miners and the safety of mining. As shown in the figure, when the cold water is introduced into the pipe in the backfill layer, the side of the backfill body closer to the working face will form a cold wall. Through the principle of radiation cooling, the heat transfer among airflow and cold wall, coal wall, surrounding rock, etc. is conducted, and the heat from airflow and other heat sources is absorbed by the cold wall. The heat absorption of airflow is reduced and the temperature rise of the airflow is decreased by the radiation cooling of the cold wall. The pipe is placed deep in the stratum and the geothermal energy exploitation can be realized by the flowing heat-carrying fluid in the pipe after the mining process is finished.

2.1. Basic Assumptions

The heat transfer among the airflow and cold wall, coal wall, surrounding rock, etc., is a complicated three-dimensional unsteady heat transfer process. For convenience of calculation, the following basic assumptions are made:
(I)
The temperature of other adjacent surfaces except the cold wall adjacent to the airflow is the original ground temperature at the mining depth;
(II)
The original ground temperature at the mining depth remains unchanged and heat is released uniformly along the working face;
(III)
The cold wall temperature remains unchanged and the cold is released uniformly along the working face;
(IV)
After the goaf is backfilled, the heat brought by air leakage to the working face is not considered, and the internal heat source of the working face is also not considered;
(V)
The moisture exchange among the airflow and cold wall, coal wall, surrounding rock, etc., is ignored.

2.2. Mathematical Model

(1) Governing equation
According to the basic assumptions, the mass conservation equation, momentum conservation equation and the energy conservation equation of the numerical model are established.
Mass conservation equation:
ρ t + d i v ( ρ u ) = 0
where ρ is airflow density, kg/m3;   t is time, s;   u is the velocity vector.
Momentum conservation equation:
ρ u t + d i v ( p u u ) = p x + τ x x x + τ y x y + τ z x z + F x
ρ v t + d i v ( p v v ) = p y + τ x y x + τ y y y + τ z y z + F y
ρ w t + d i v ( p w w ) = p z + τ x z x + τ y z y + τ z z z + F z
where p is the pressure, N;   τ x x ,   τ x y ,   τ x z   are the viscous stress components;   F x ,   F y ,   F z are the volumetric forces on the elements. Assuming the volumetric force is only gravity and that the Z axis is vertical, then F x = 0 , F z = 0 , F y = ρ g , N.
Energy conservation equation:
t ( ρ E ) + x i [ u i ( ρ E + ρ ) ] = x i [ k e f f T x i j h j J j + u j ( τ i j ) e f f ] + S h
where E is the total energy of the fluid, J; k e f f is the effective heat transfer parameter; J j is the diffusion flow rate of component j, kg/(m 2·s);   S h is the heat source term.
(2) Boundary conditions
The wall surface of the working face heats or cools the airflow through the combined effect of convection and radiation heat transfer. When cooling measures are not taken, there is no temperature difference between the walls, so the radiation model is only opened during cooling.
T W = c o n s t
Heat   wall : T W ( x , y , z , τ ) = T h e a t
Cool   wall : T W ( x , y , z , τ ) = T c o o l
where TW is the average wall temperature of the working face, K;   T h e a t is the average temperature of the heating surface, K;   T c o o l is the average temperature of the cooling surface, K.
λ T y = q r + q c
q r = σ F r ( T h e a t 4 T c o o l 4 )
q c = h c | T w T f |
where   q r is the radiative heat transfer between walls, W/m2; q c is the convective heat transfer between air flow and wall surface, W/m2   σ is the Stephan Boltzmann constant, σ = 5.67 × 10⁻⁸ W/(m2·K4);   F r is the comprehensive factor of wall radiation heat transfer; T f is average airflow temperature, K;   h c is heat transfer coefficient between the wall surface and airflow, W/(m2·K).
However, for the convective heat transfer process, it is difficult and complex to determine the convective heat transfer coefficient between the surrounding wall and the airflow due to the influence of various factors. The convective heat transfer can be calculated by the following formula [28].
q c = 2.42 | T w T f | 1.18 D e 0.08
D e = 4 × A L
where D e is equivalent diameter of surrounding wall, m;   A is area m2;   L is the perimeter, m.

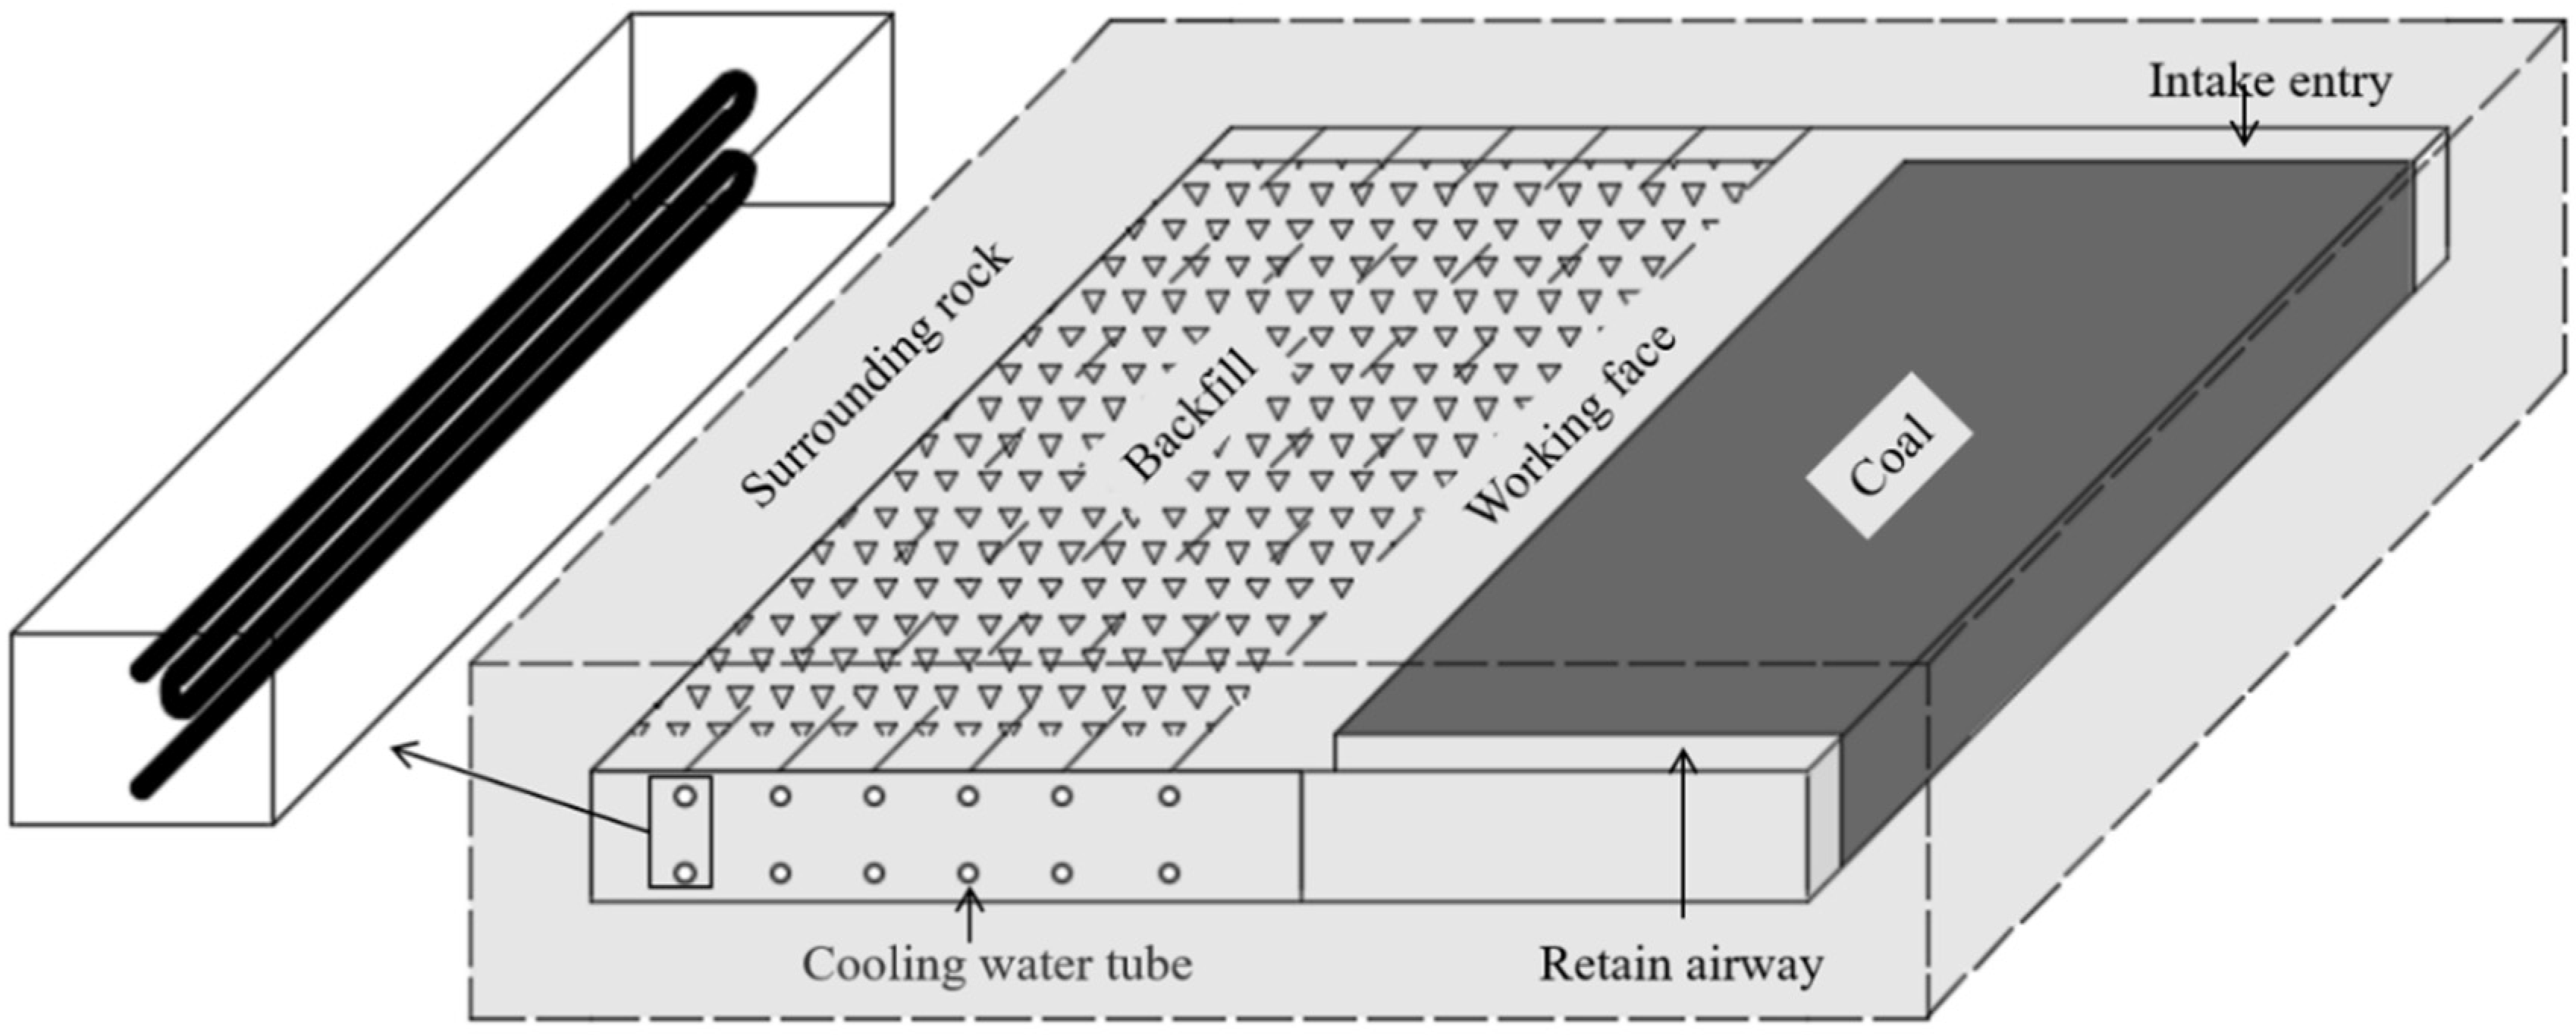
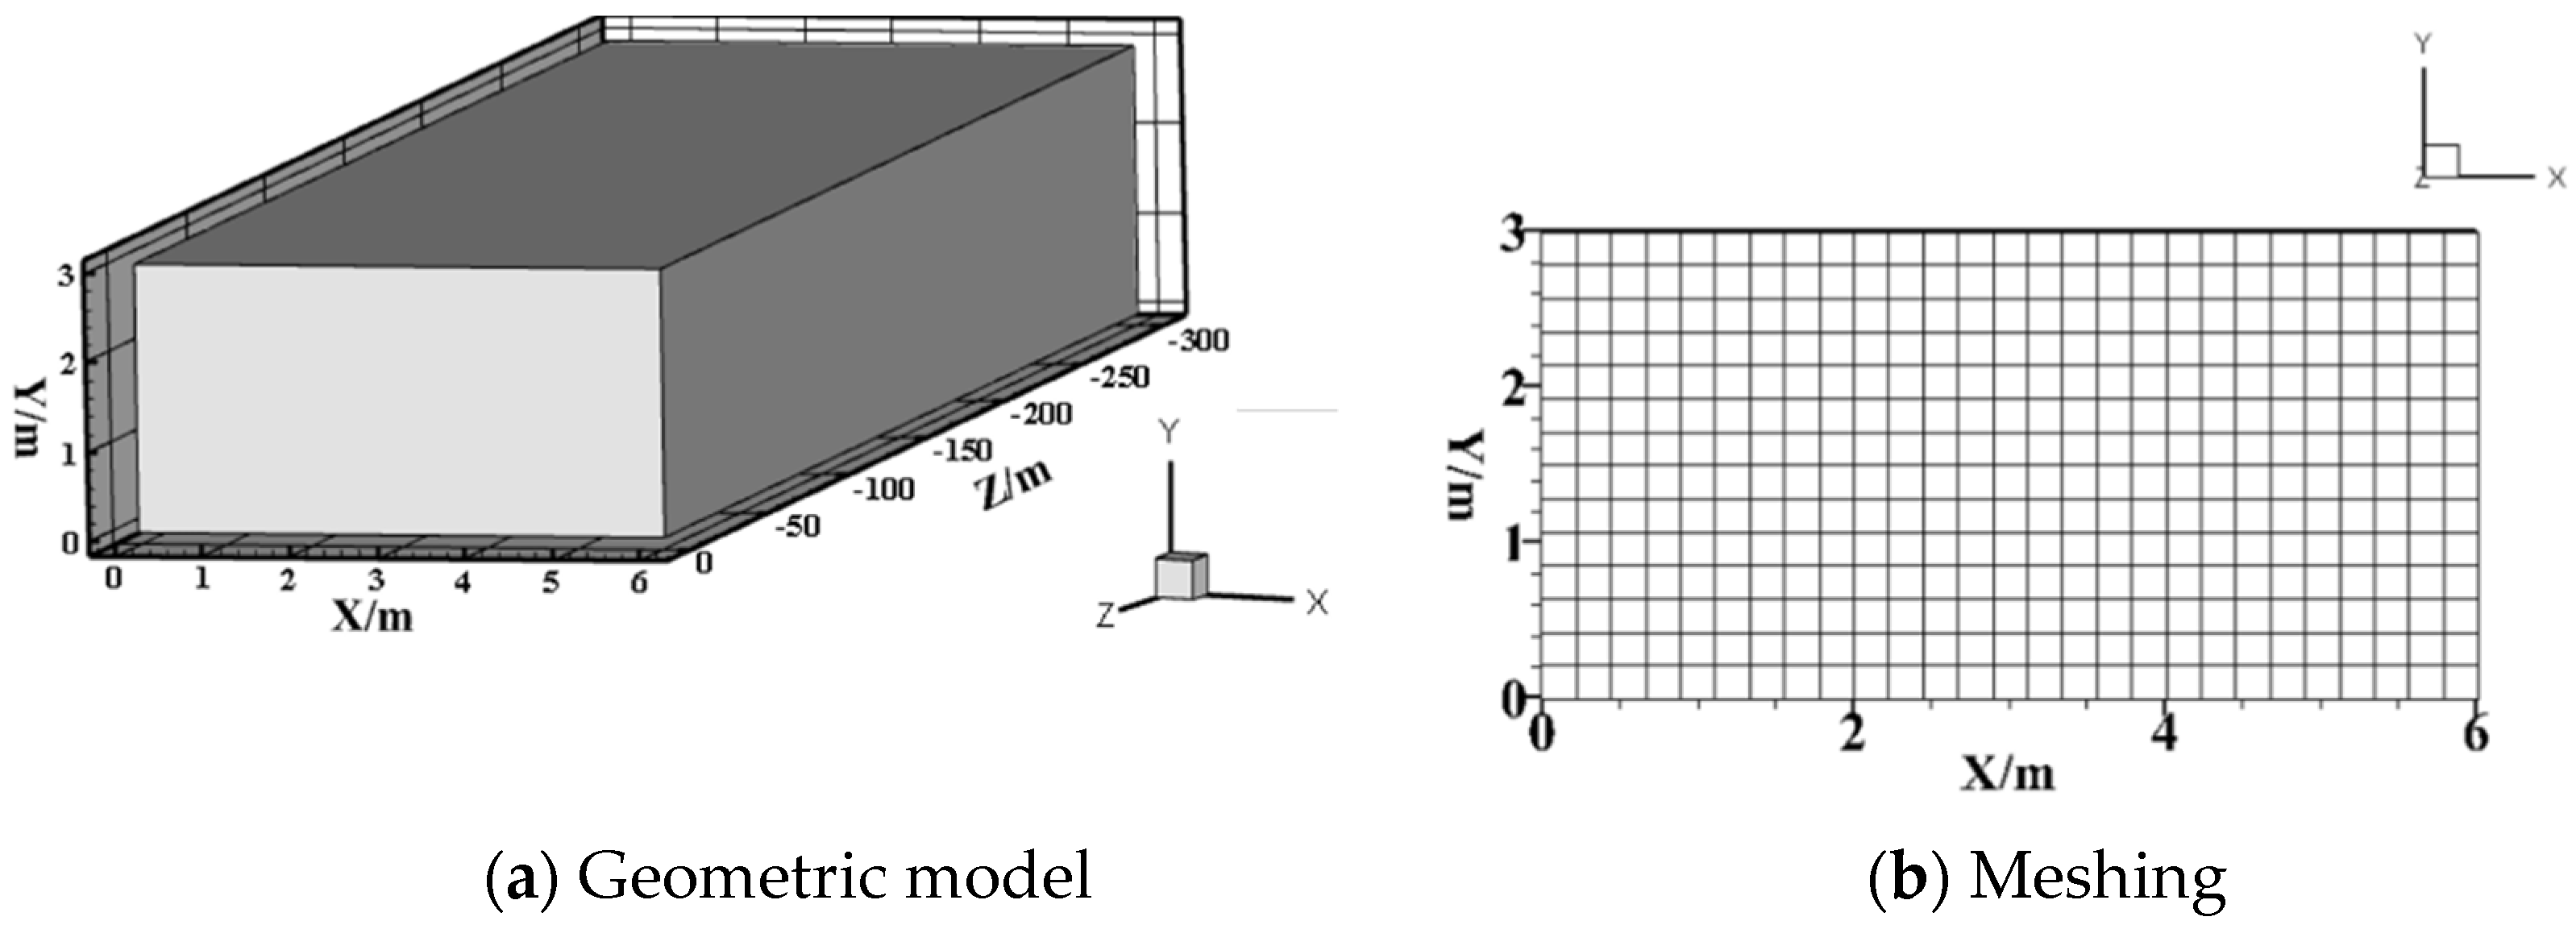
2.3. Geometric Model and Meshing

The actual model is simplified based on assumptions, the geometric model of the airflow in working face is established by using the ICEM and it is divided into a structural grid, as shown in Figure 2. In order to study the temperature change of the airflow in the working face, six measuring points are arranged in the length direction. The measuring points in the height and width directions are arranged on the exit of the working face, five measuring points are arranged in the height direction and eight measuring points are arranged in the width direction. The width of 2 m is set aside on working face for shearer operation when the measurement points are arranged. The arrangement of the measuring points is shown in Figure 3.

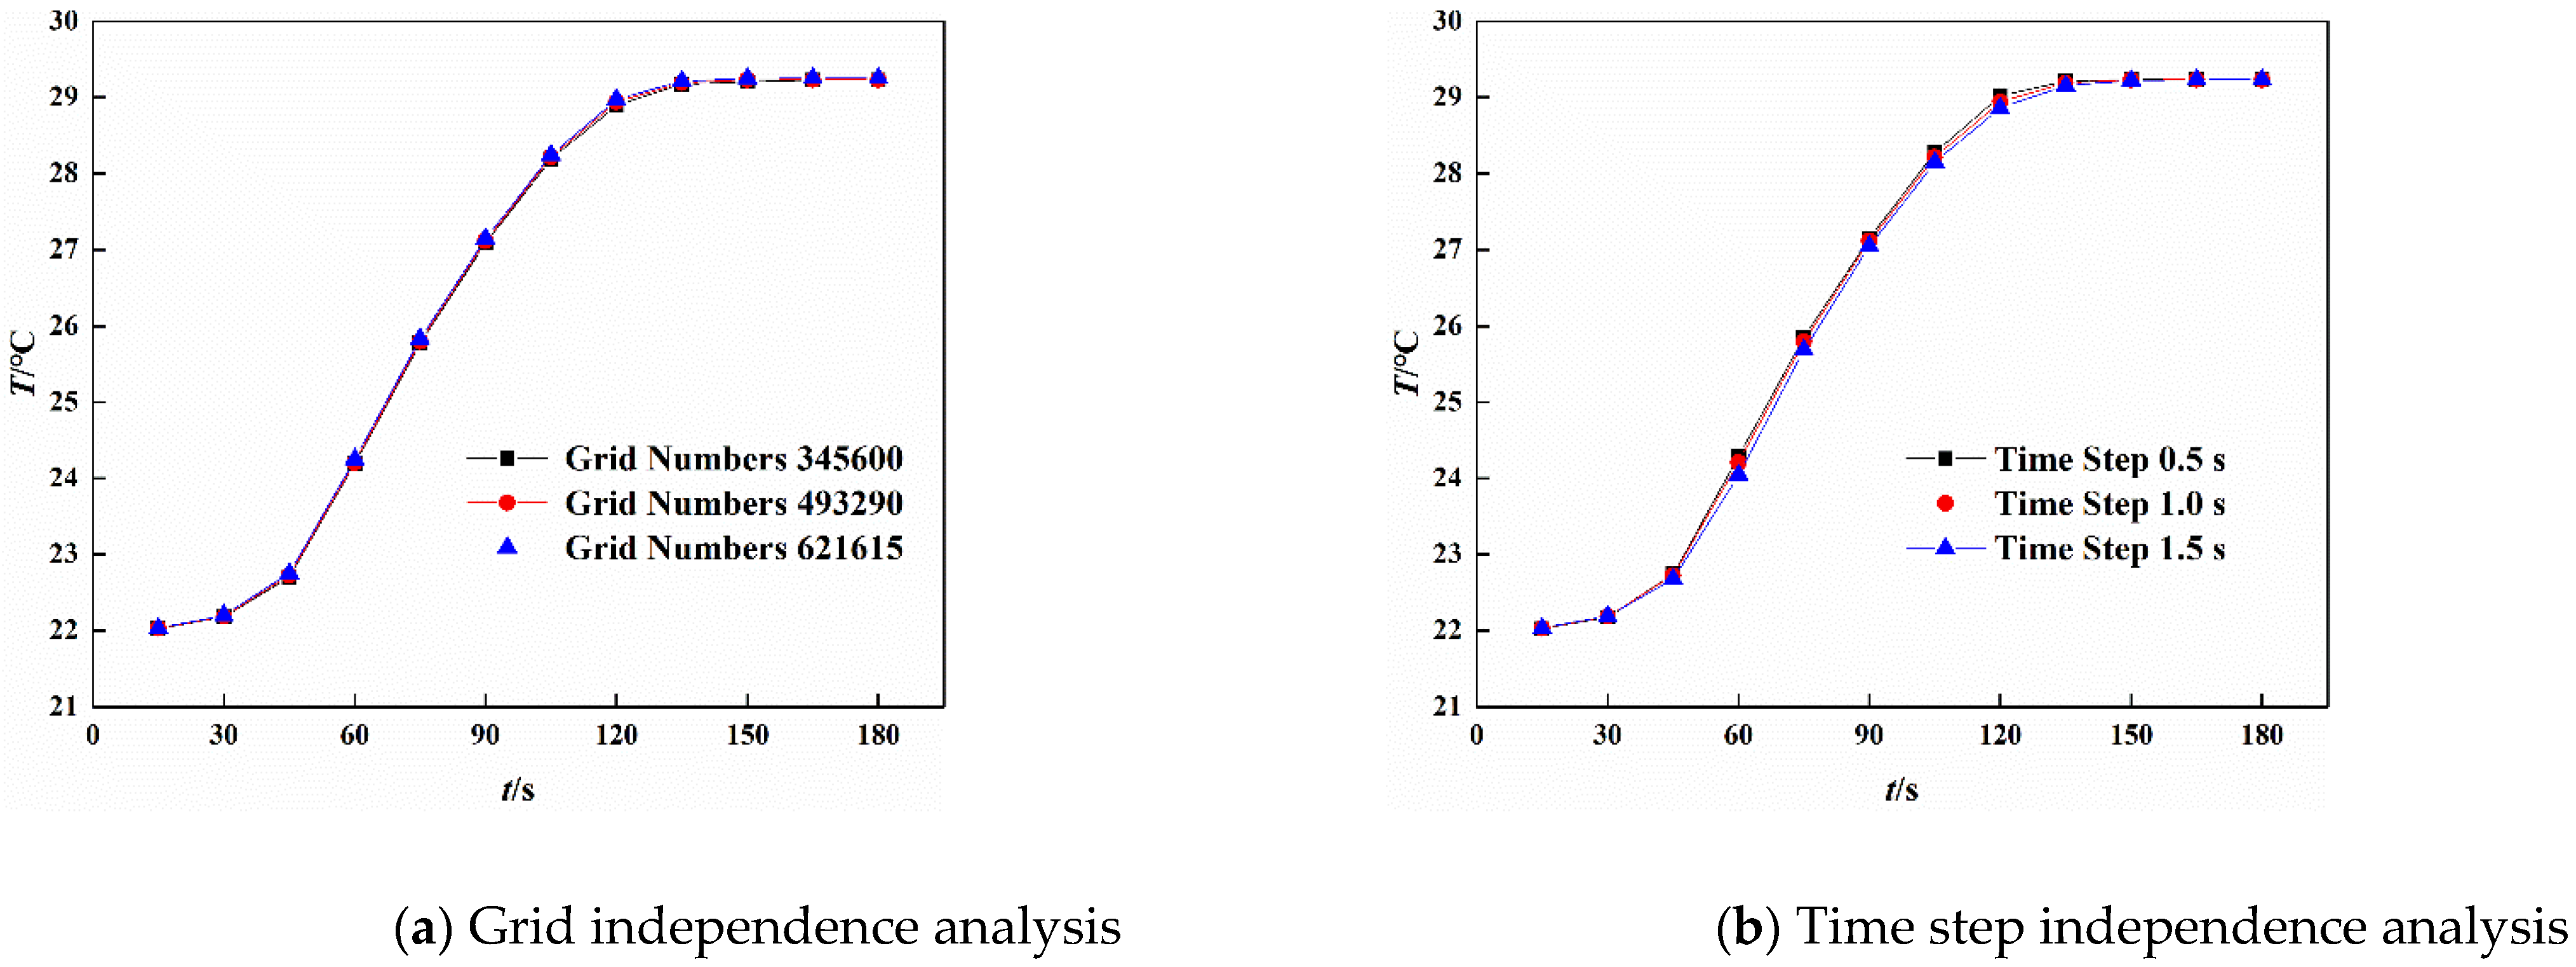
2.4. Independence Analysis

In the numerical calculation, grid number and time step have a great influence on the accuracy of calculation results. Therefore, the independence analysis shown in Figure 4 is carried out to make subsequent calculation results more accurate. Figure 4a shows the calculation results for the grids number of 345,600, 493,290 and 621,615, respectively. It can be seen that the difference between the results is very small, indicating that the influence of the grid number on the calculation results can be ignored, so the grid number of 493,290 is adopted for calculation. Figure 4b shows the calculation results when the time step is 0.5 s, 1.0 s and 1.5 s, respectively. It can be seen that the results are not obvious, and considering the calculation period, the time step is selected as 1.0 s.

2.5. Fluent Parameters and Solution Settings

This paper mainly studies the change rule of airflow temperature in the working face under different working conditions and parameters and solutions are set according to the actual situations of airflow temperature.
A three-dimensional unsteady pressure solver activating the energy equation, the standard k-ε turbulence model, and the DO radiation model are used. Setting boundary conditions, including that airflow inlet boundary is Velocity-Inlet, airflow velocity is 1.5 m/s, 2.0 m/s, 2.5 m/s, 3.0 m/s and 3.5 m/s respectively, the airflow inlet temperature of the working face is 18 °C, 20 °C, 22 °C, 24 °C and 26 °C, respectively, the exit boundary type is outflow, the temperature of surrounding wall is 35 °C, 40 °C, 45 °C, 50 °C and 55 °C respectively, and they are all diffuse surfaces. The governing equation is solved by the simple algorithm with the second-order upwind discrete scheme, and the relaxation factor remains the default.

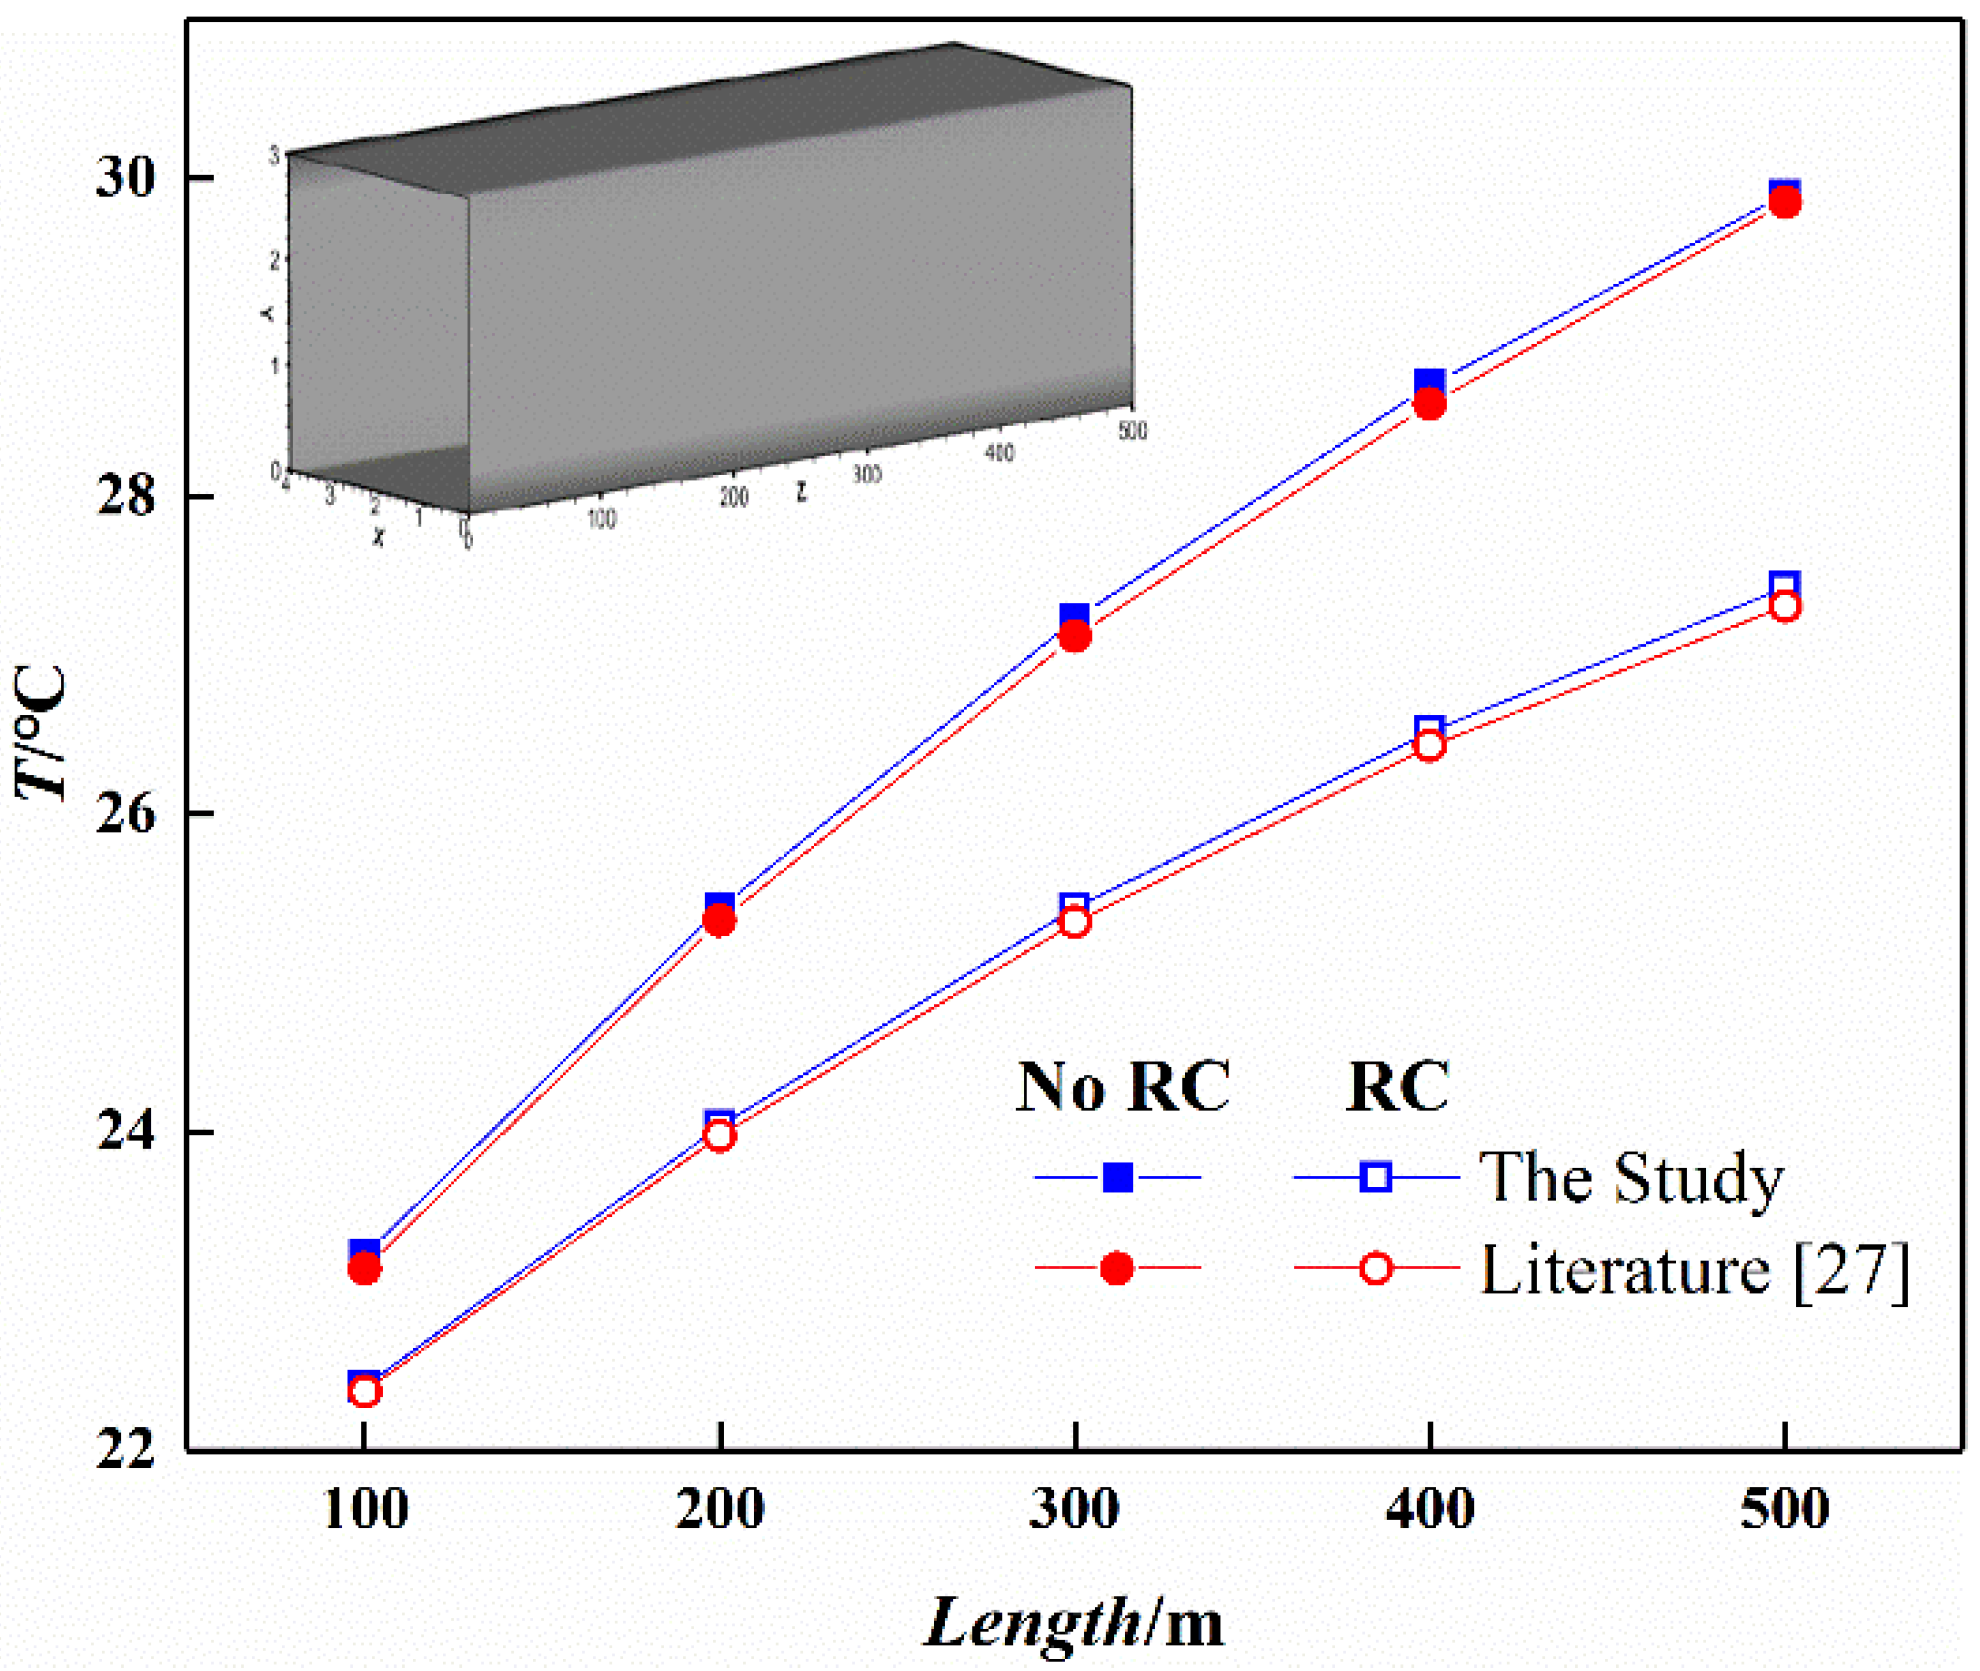
2.6. Model Validation

In order to verify the accuracy of this simulation calculation, the results of the literature [29] are used to verify the results in this paper. The verified model length is 500 m, width is 4 m and height is 3 m, the number of grids is 750,000, the time step is 1 s. When no cooling measures are taken, the air supply velocity is 2.08 m/s, the air supply temperature is 20 °C, and the surrounding wall temperatures are 35 °C. When cooling measures are taken, the two sides of the airflow are the cold wall with a temperature of 26 °C, and the temperatures of the top and bottom wall remains unchanged. After the airflow temperature becomes stable, the average temperature of the airflow on 100 m, 200 m, 300 m, 400 m and 500 m sections along the passage is monitored. Figure 5 shows the comparison of numerical simulation results in the literature. It can be seen that the simulation results of the average air temperature are close to the literature, and the error is within 0.5%, which effectively verifies the accuracy and reliability of the simulation method.

3. Result and Analysis

In order to ensure the health and production efficiency of underground workers, the code for the design of prevention and elimination of thermal disasters in coal mines [30] states that the inlet airflow temperature of the working face should not be lower than 18 °C, and the outlet airflow temperature of the working face should not exceed 28 °C. For the over-temperature area, cooling must be carried out to meet the requirements of workers’ health and safe production. In this paper, the airflow temperature variation of the working face before and after cooling by numerical simulation under different working conditions are examined.

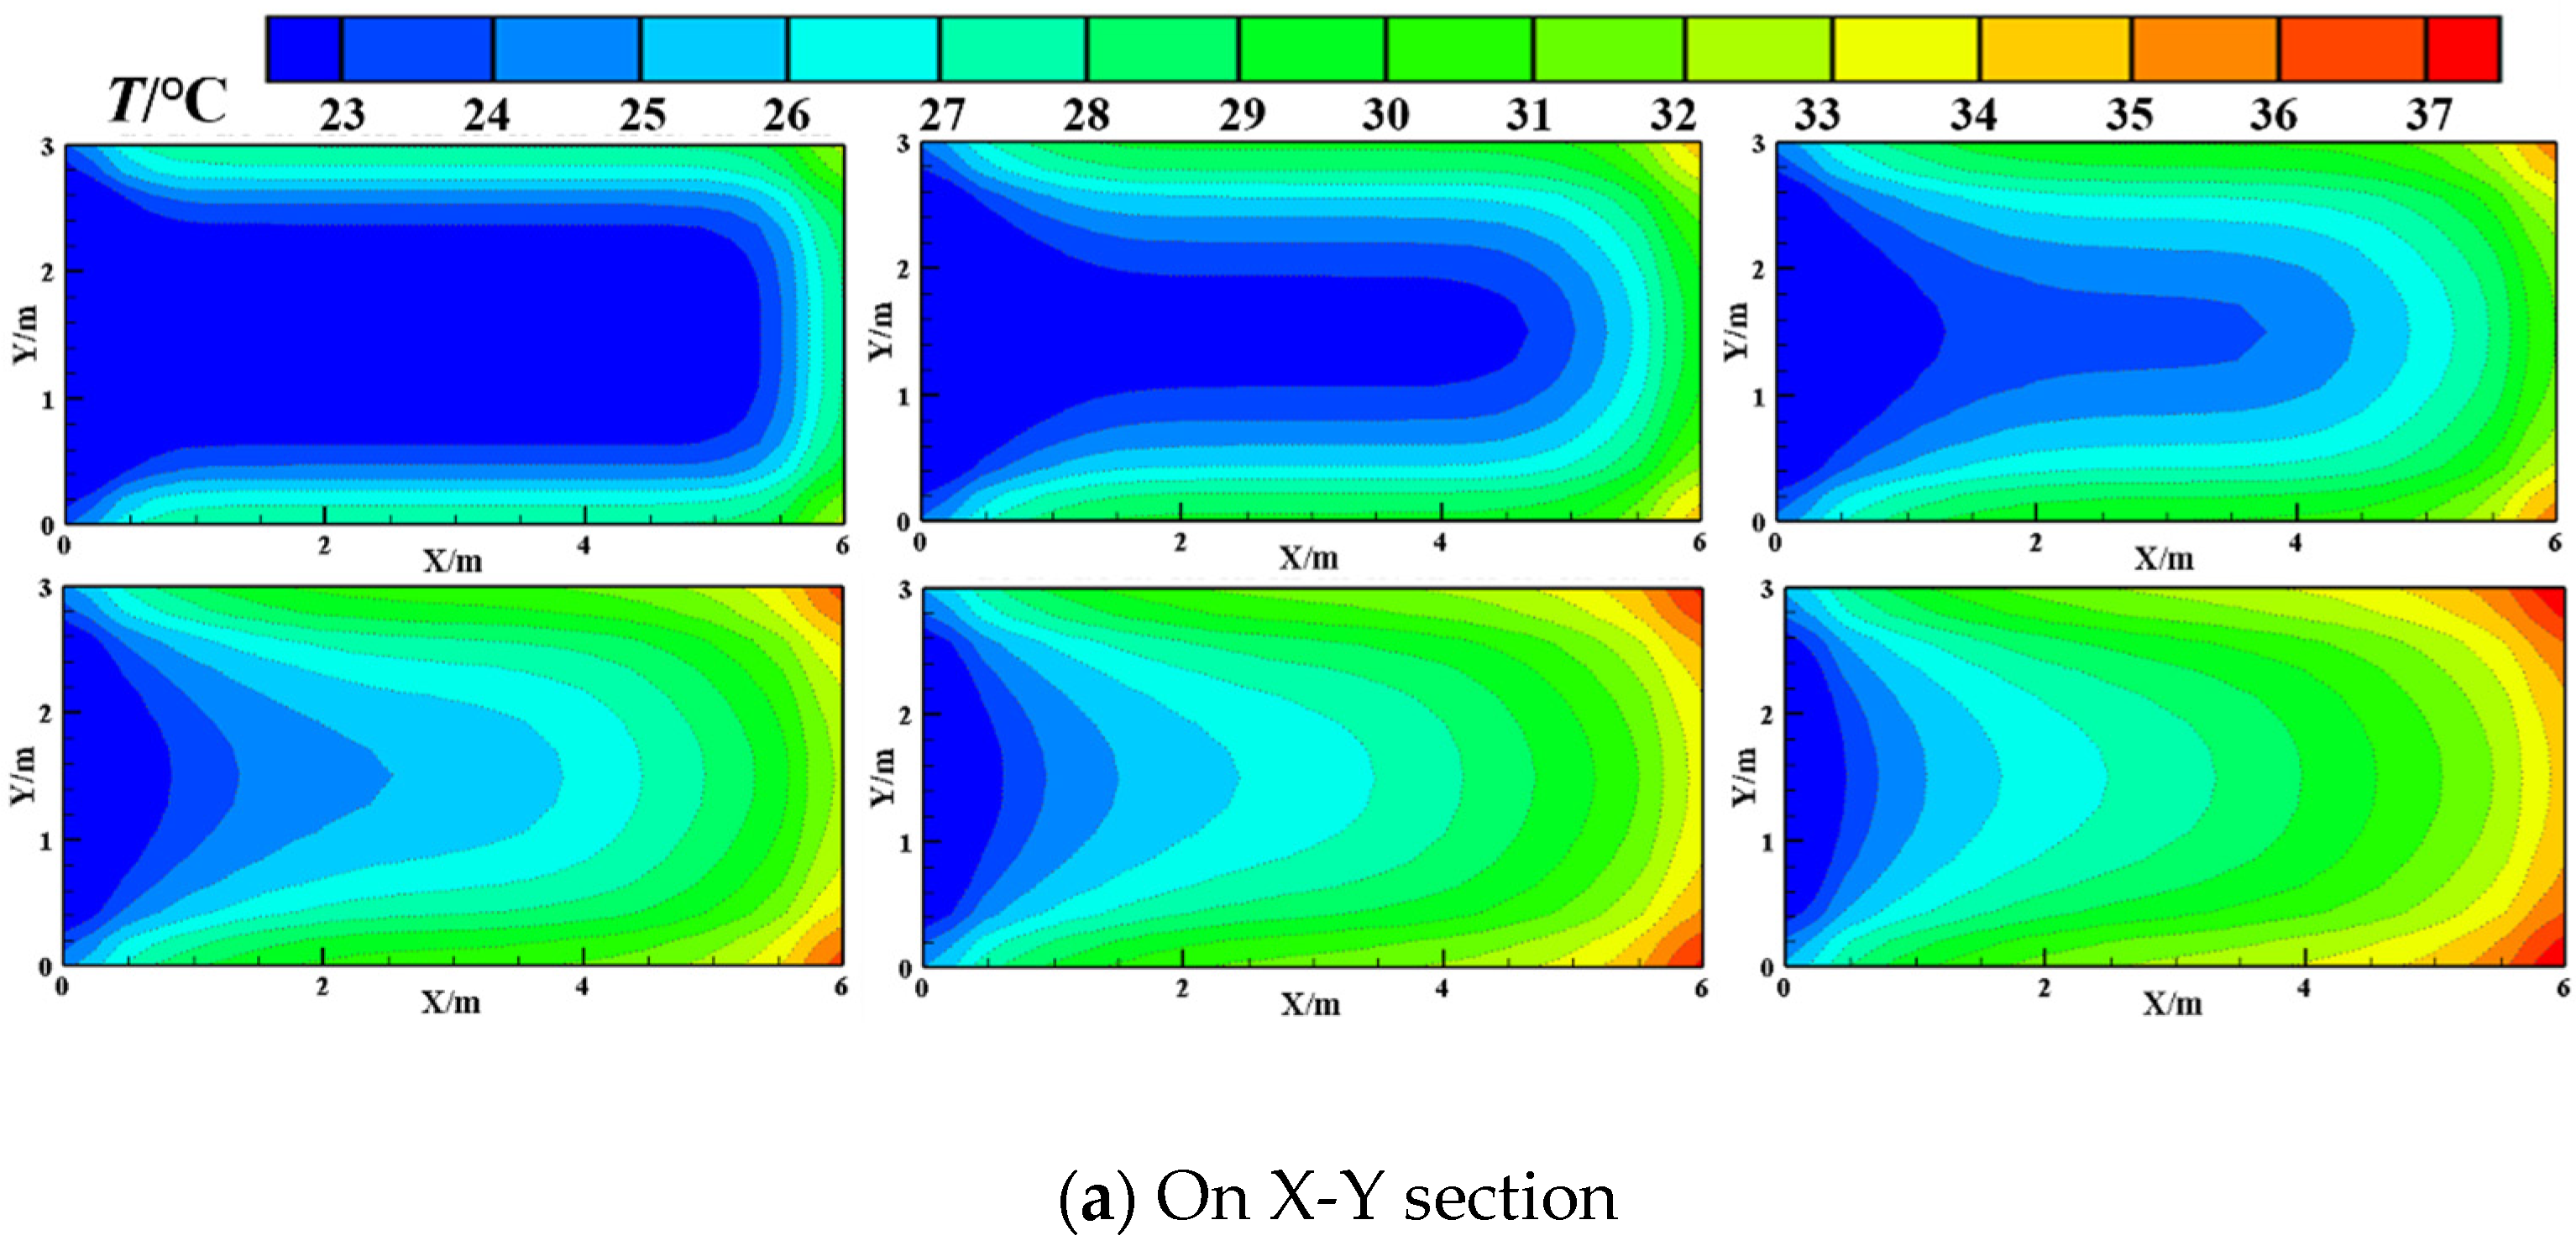
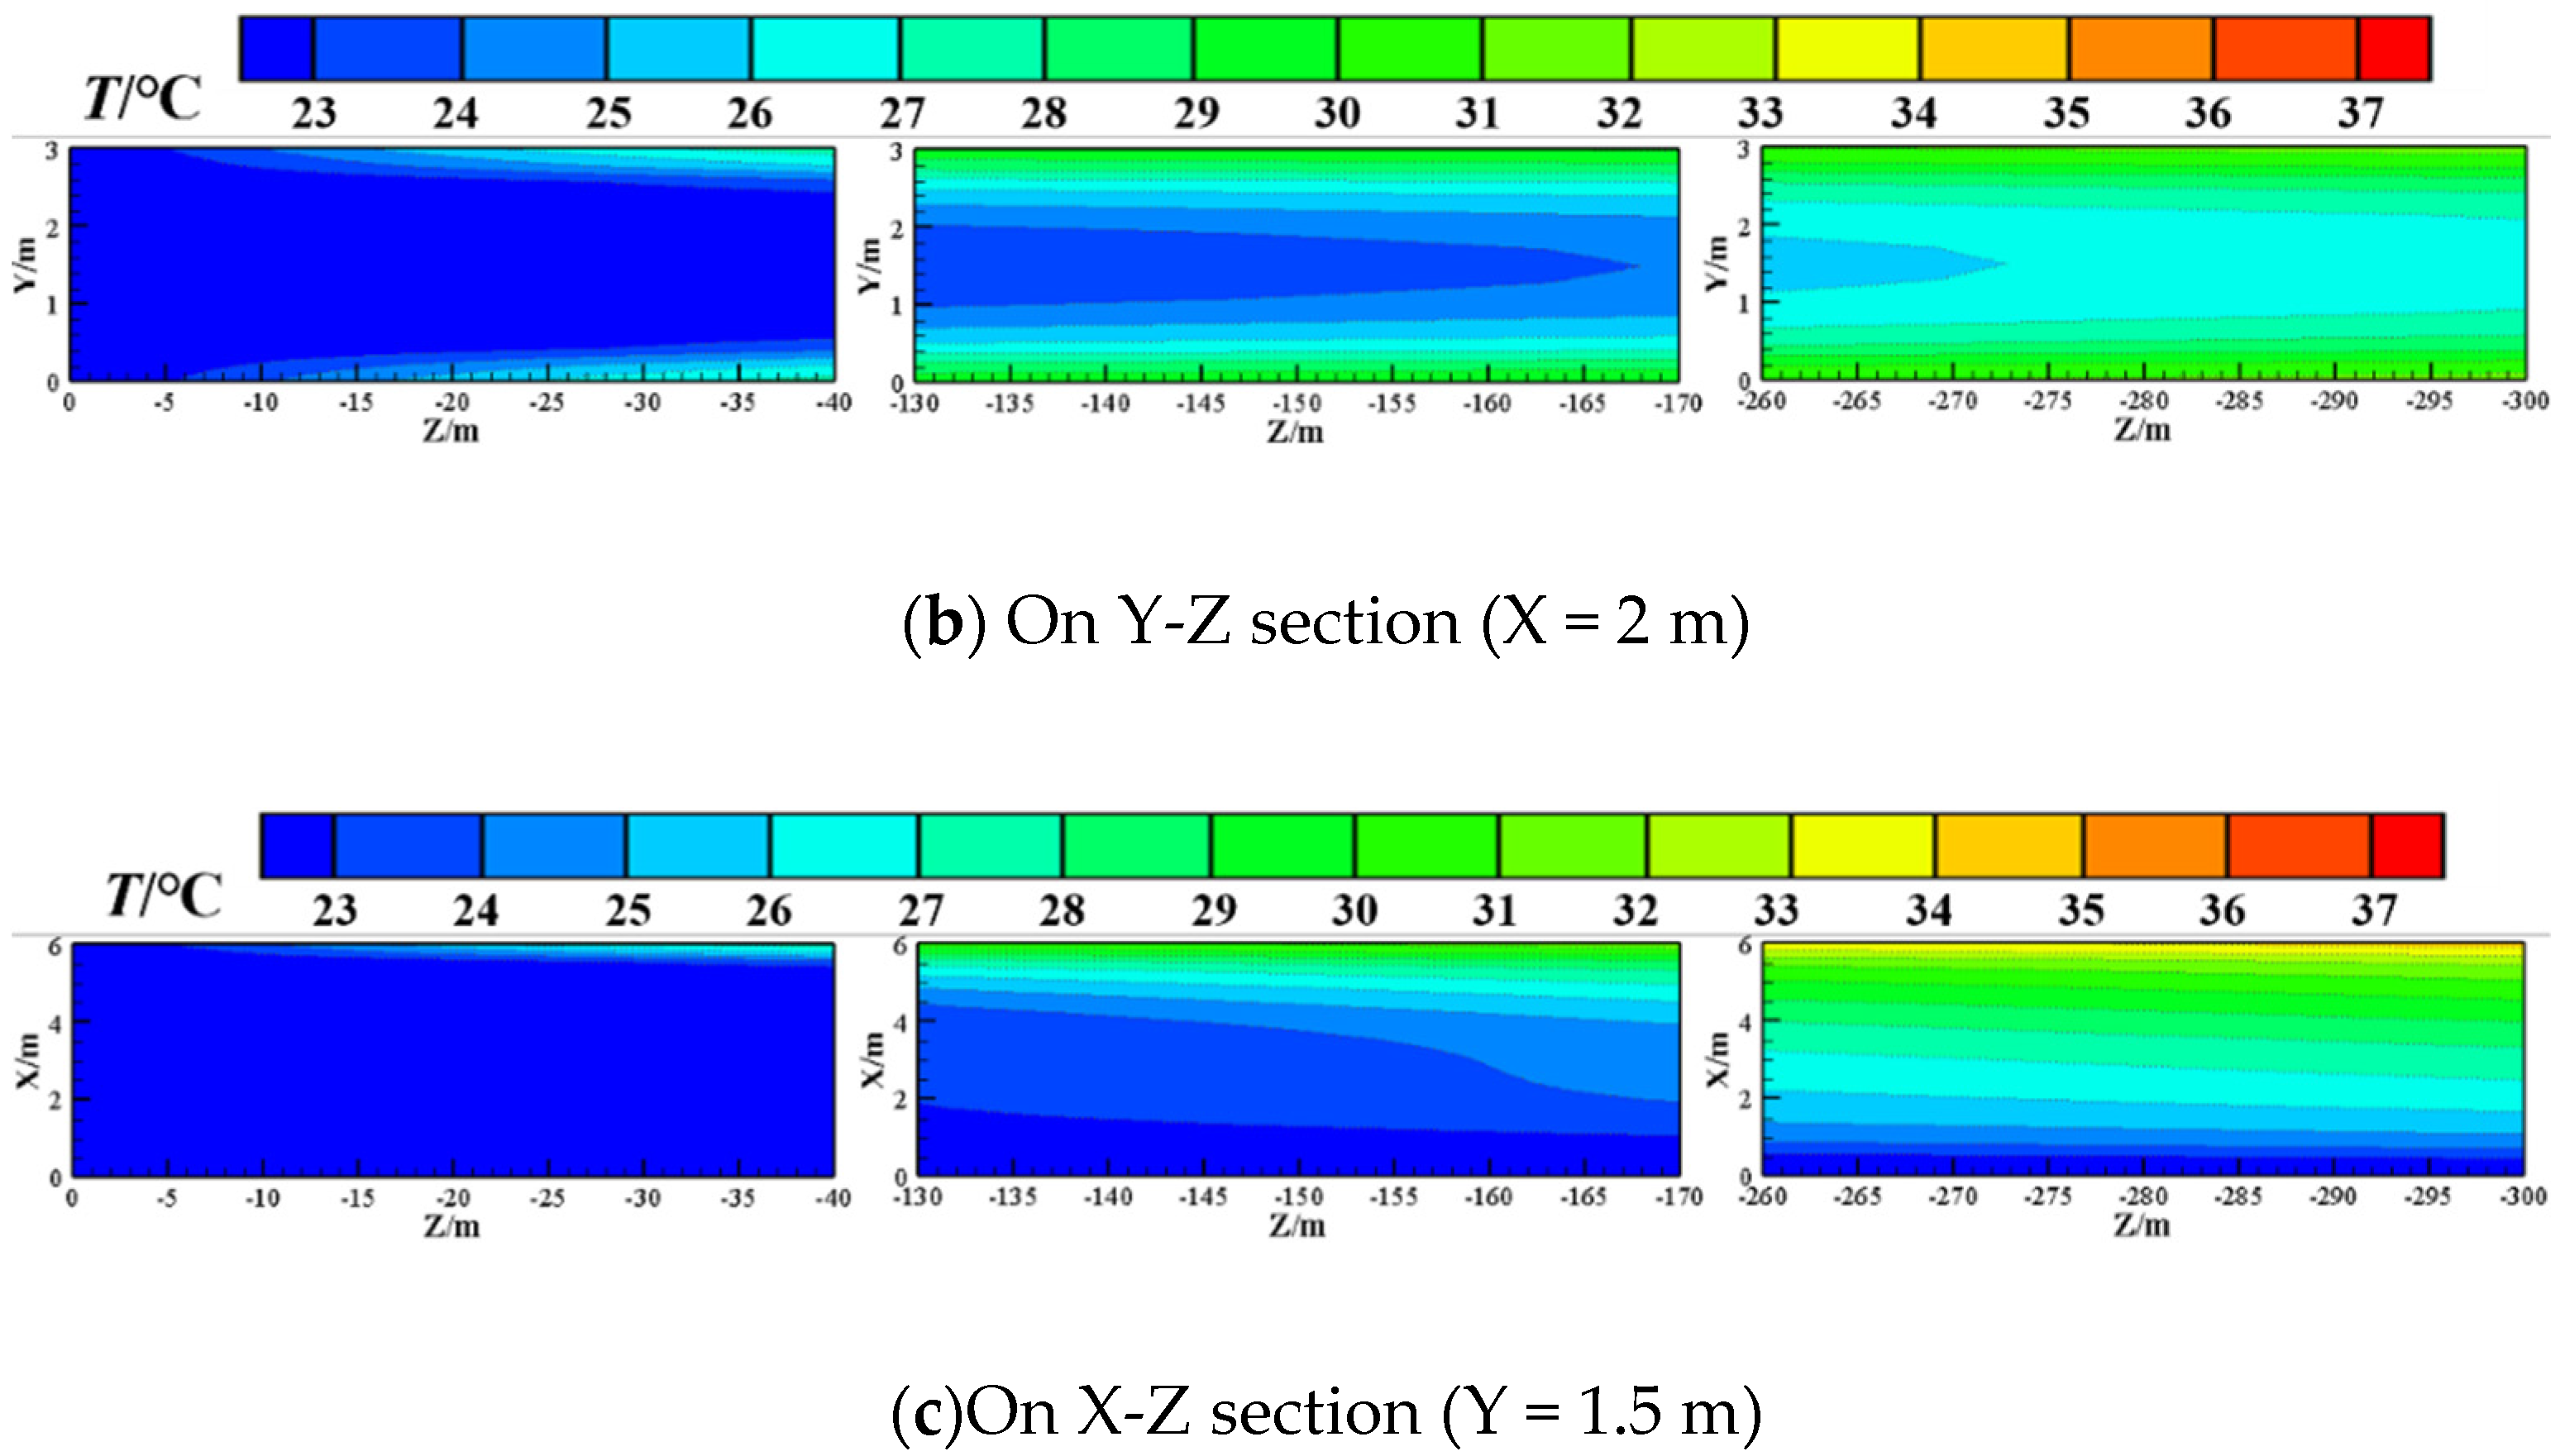
3.1. Analysis of Airflow Temperature Variation along the Working Face before and after Cooling

The inlet airflow temperature of the working face is 22 ℃, the airflow velocity is 2.5 m/s and the surrounding wall temperature is 45 ℃. When the ventilation is 180 s, the airflow temperature distribution of the working face in different directions are shown in Figure 6 and Figure 7. Figure 6 shows that the airflow continuously absorbs heat from the surrounding wall along the working face and its temperature gradually rises when no cooling measures are taken. From Figure 6, it can be clearly seen that the surrounding wall of the working face simultaneously transfers heat to the airflow, the airflow temperature decreases successively from the wall to the center, and the airflow temperature is the lowest at the center. From the inlet to the outlet of the airflow, the high temperature region constantly extends from the wall to the center along the airflow passage. It can be seen from Table 1 that the airflow temperature increment decreases gradually along the working face before cooling; they are 2.41 °C, 1.78 °C, 1.52 °C, 1.40 °C, 1.31 °C and 1.20 °C successively. This is mainly due to the low airflow temperature of the working face at the entrance, the temperature difference is large between airflow and the surrounding environment, so the heat from the surrounding wall is constantly absorbed by airflow along the way. Then the airflow temperature gradually increases, which decreases the temperature difference with the surrounding environment and the heat transfer is gradually weakened. In the absence of cooling measures, the length of the working face should not be too long to avoid excessive air temperatures on the exit, which will affect the physical and mental health of workers and the safety of production.
When cooling measures are taken, the cold wall temperature is 7 °C in the backfill layer. By comparing Figure 6 and Figure 7, it can be seen that the trend of temperature rise of airflow obviously slows down from entering the working face after cooling. From Table 1, the airflow temperature increment is 1.74 °C, 1.30 °C, 1.12 °C, 1.04 °C, 0.98 °C and 0.91 °C, successively. Compared with before cooling, the temperature increment decreases by 0.67 °C, 0.48 °C, 0.40 °C, 0.36 °C, 0.33 °C and 0.29 °C, successively. Figure 7 shows that the closer it is to the cold wall, the lower the airflow temperature and the better the cooling effect. This is mainly because the effect of the surrounding wall on the heating airflow is reduced after introducing the chilled water by radiant cooling, so the speed of the temperature rise of the airflow is slowed, and the temperature of the working region drops to less than 28 ℃ when reaching the exit. The temperature in the very small region is slightly higher; this is not the main working region of the workers, so it can be ignored.

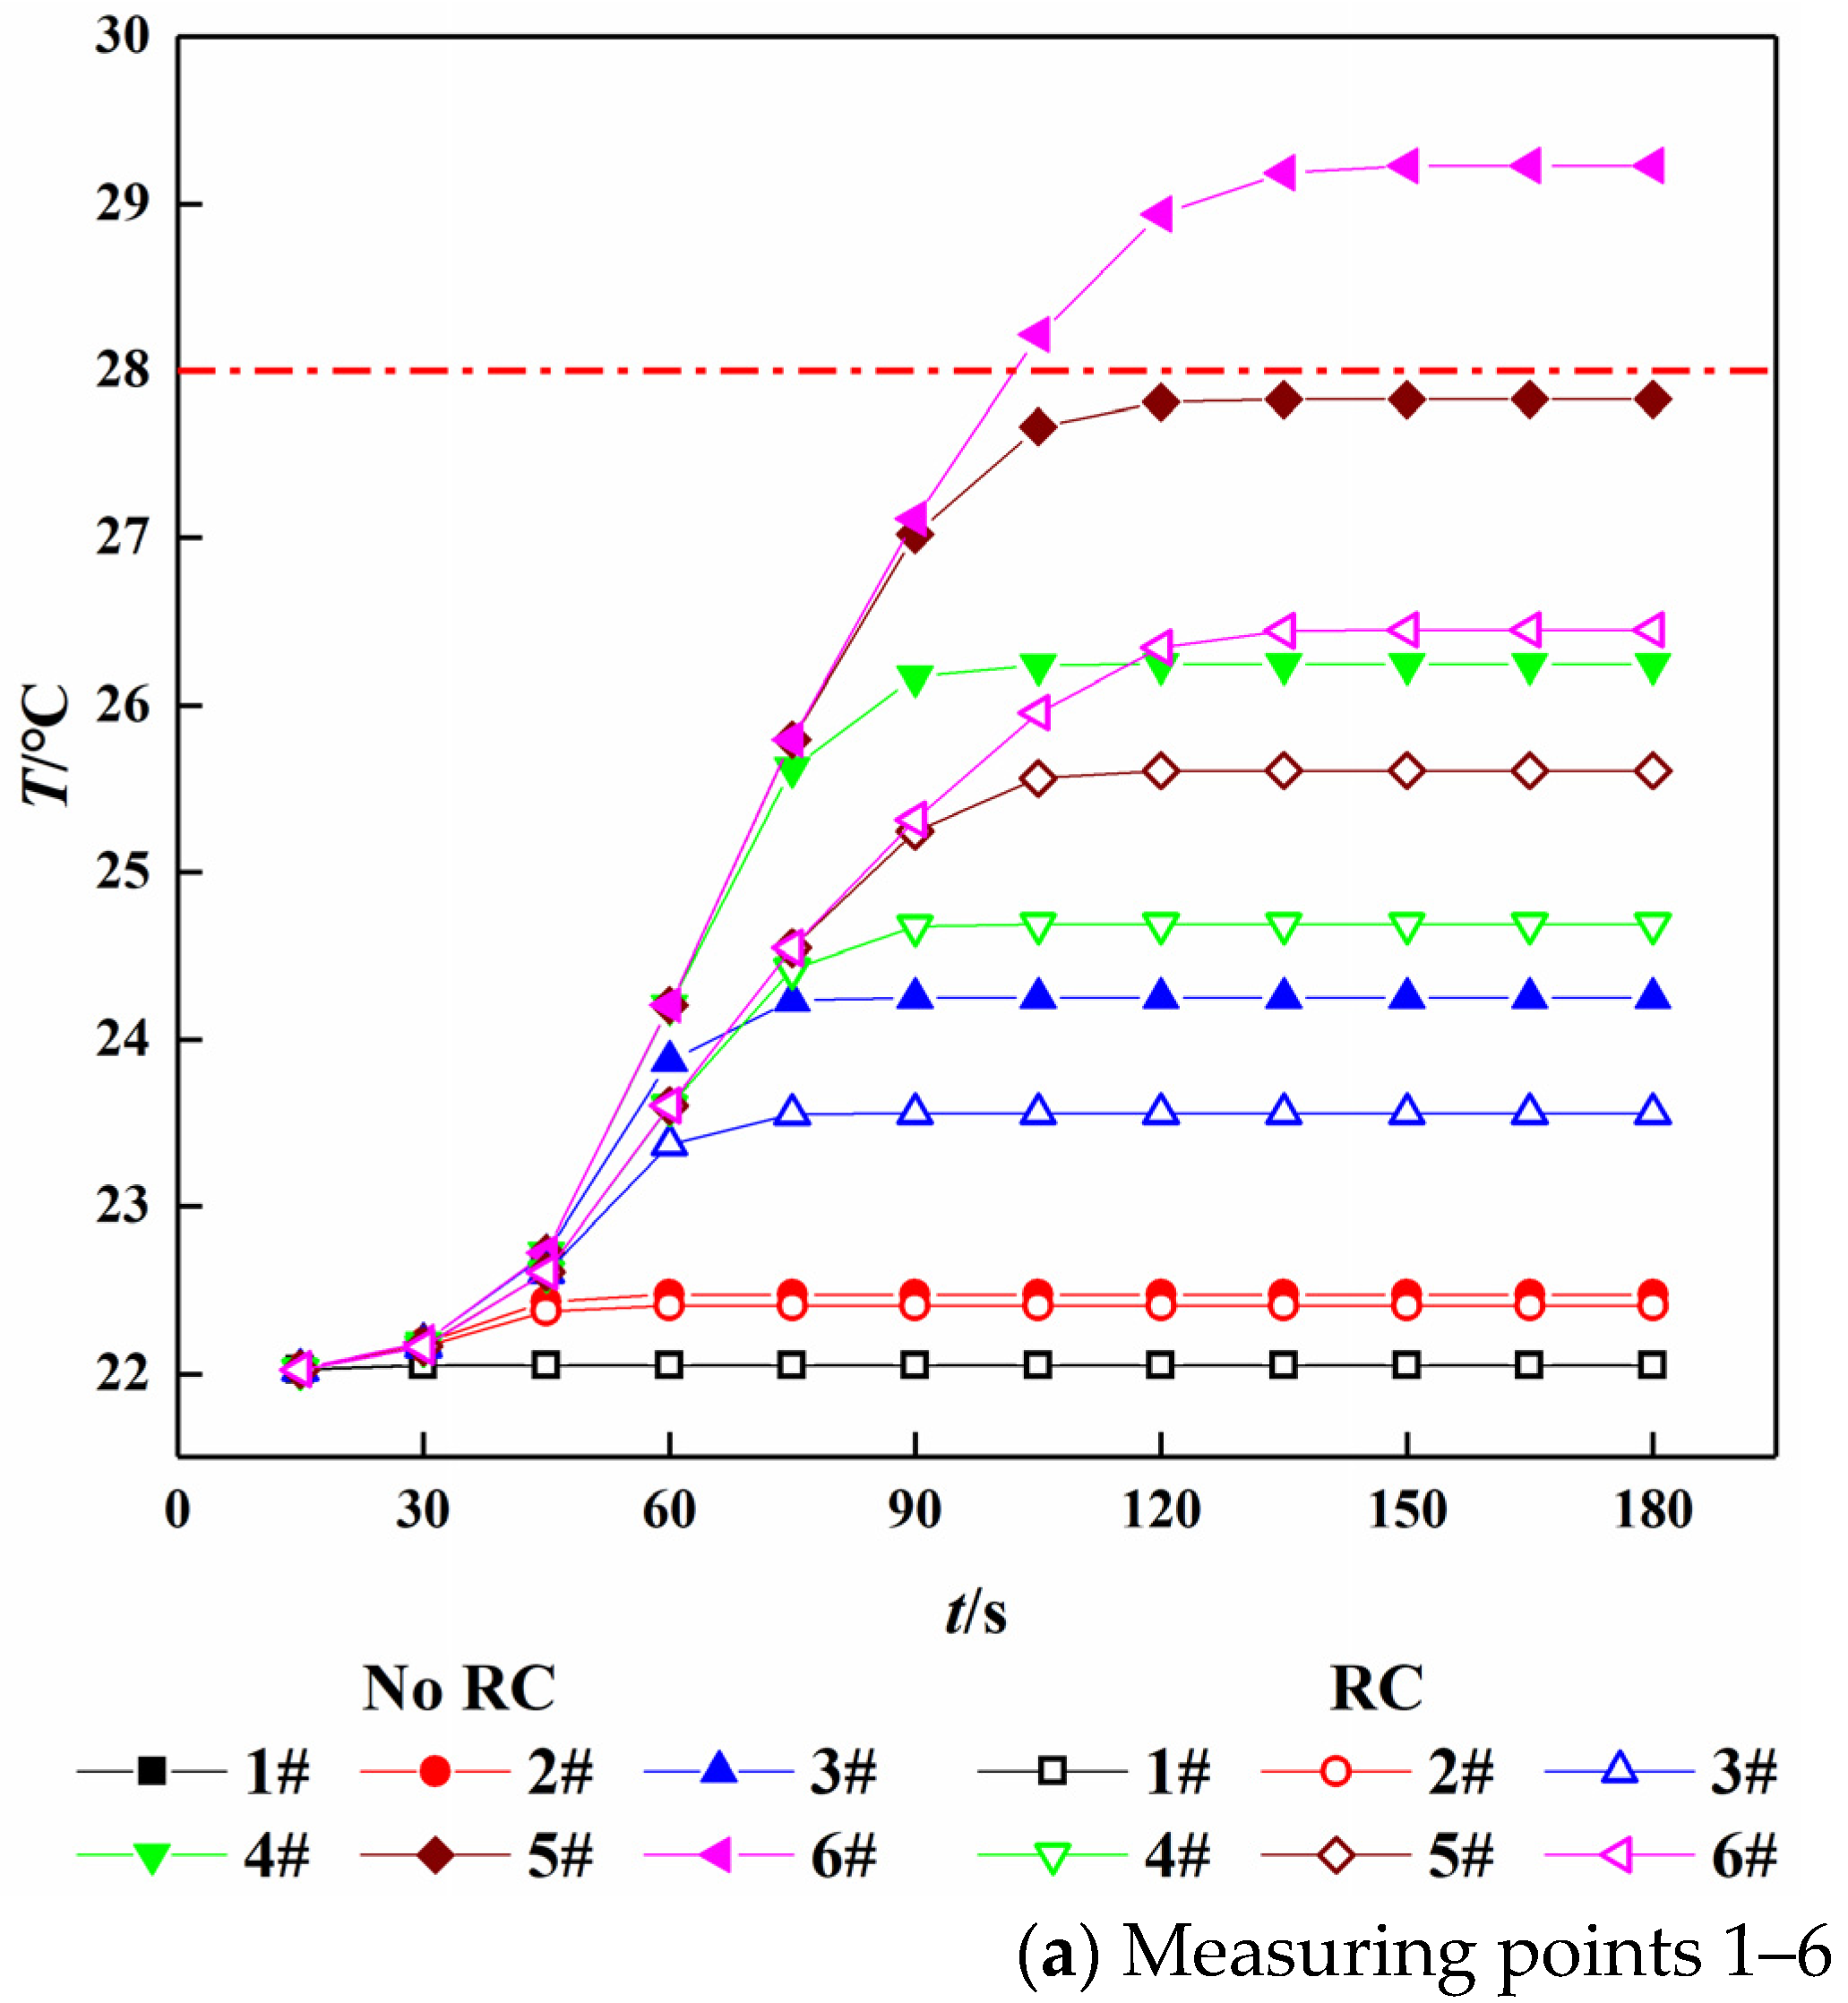
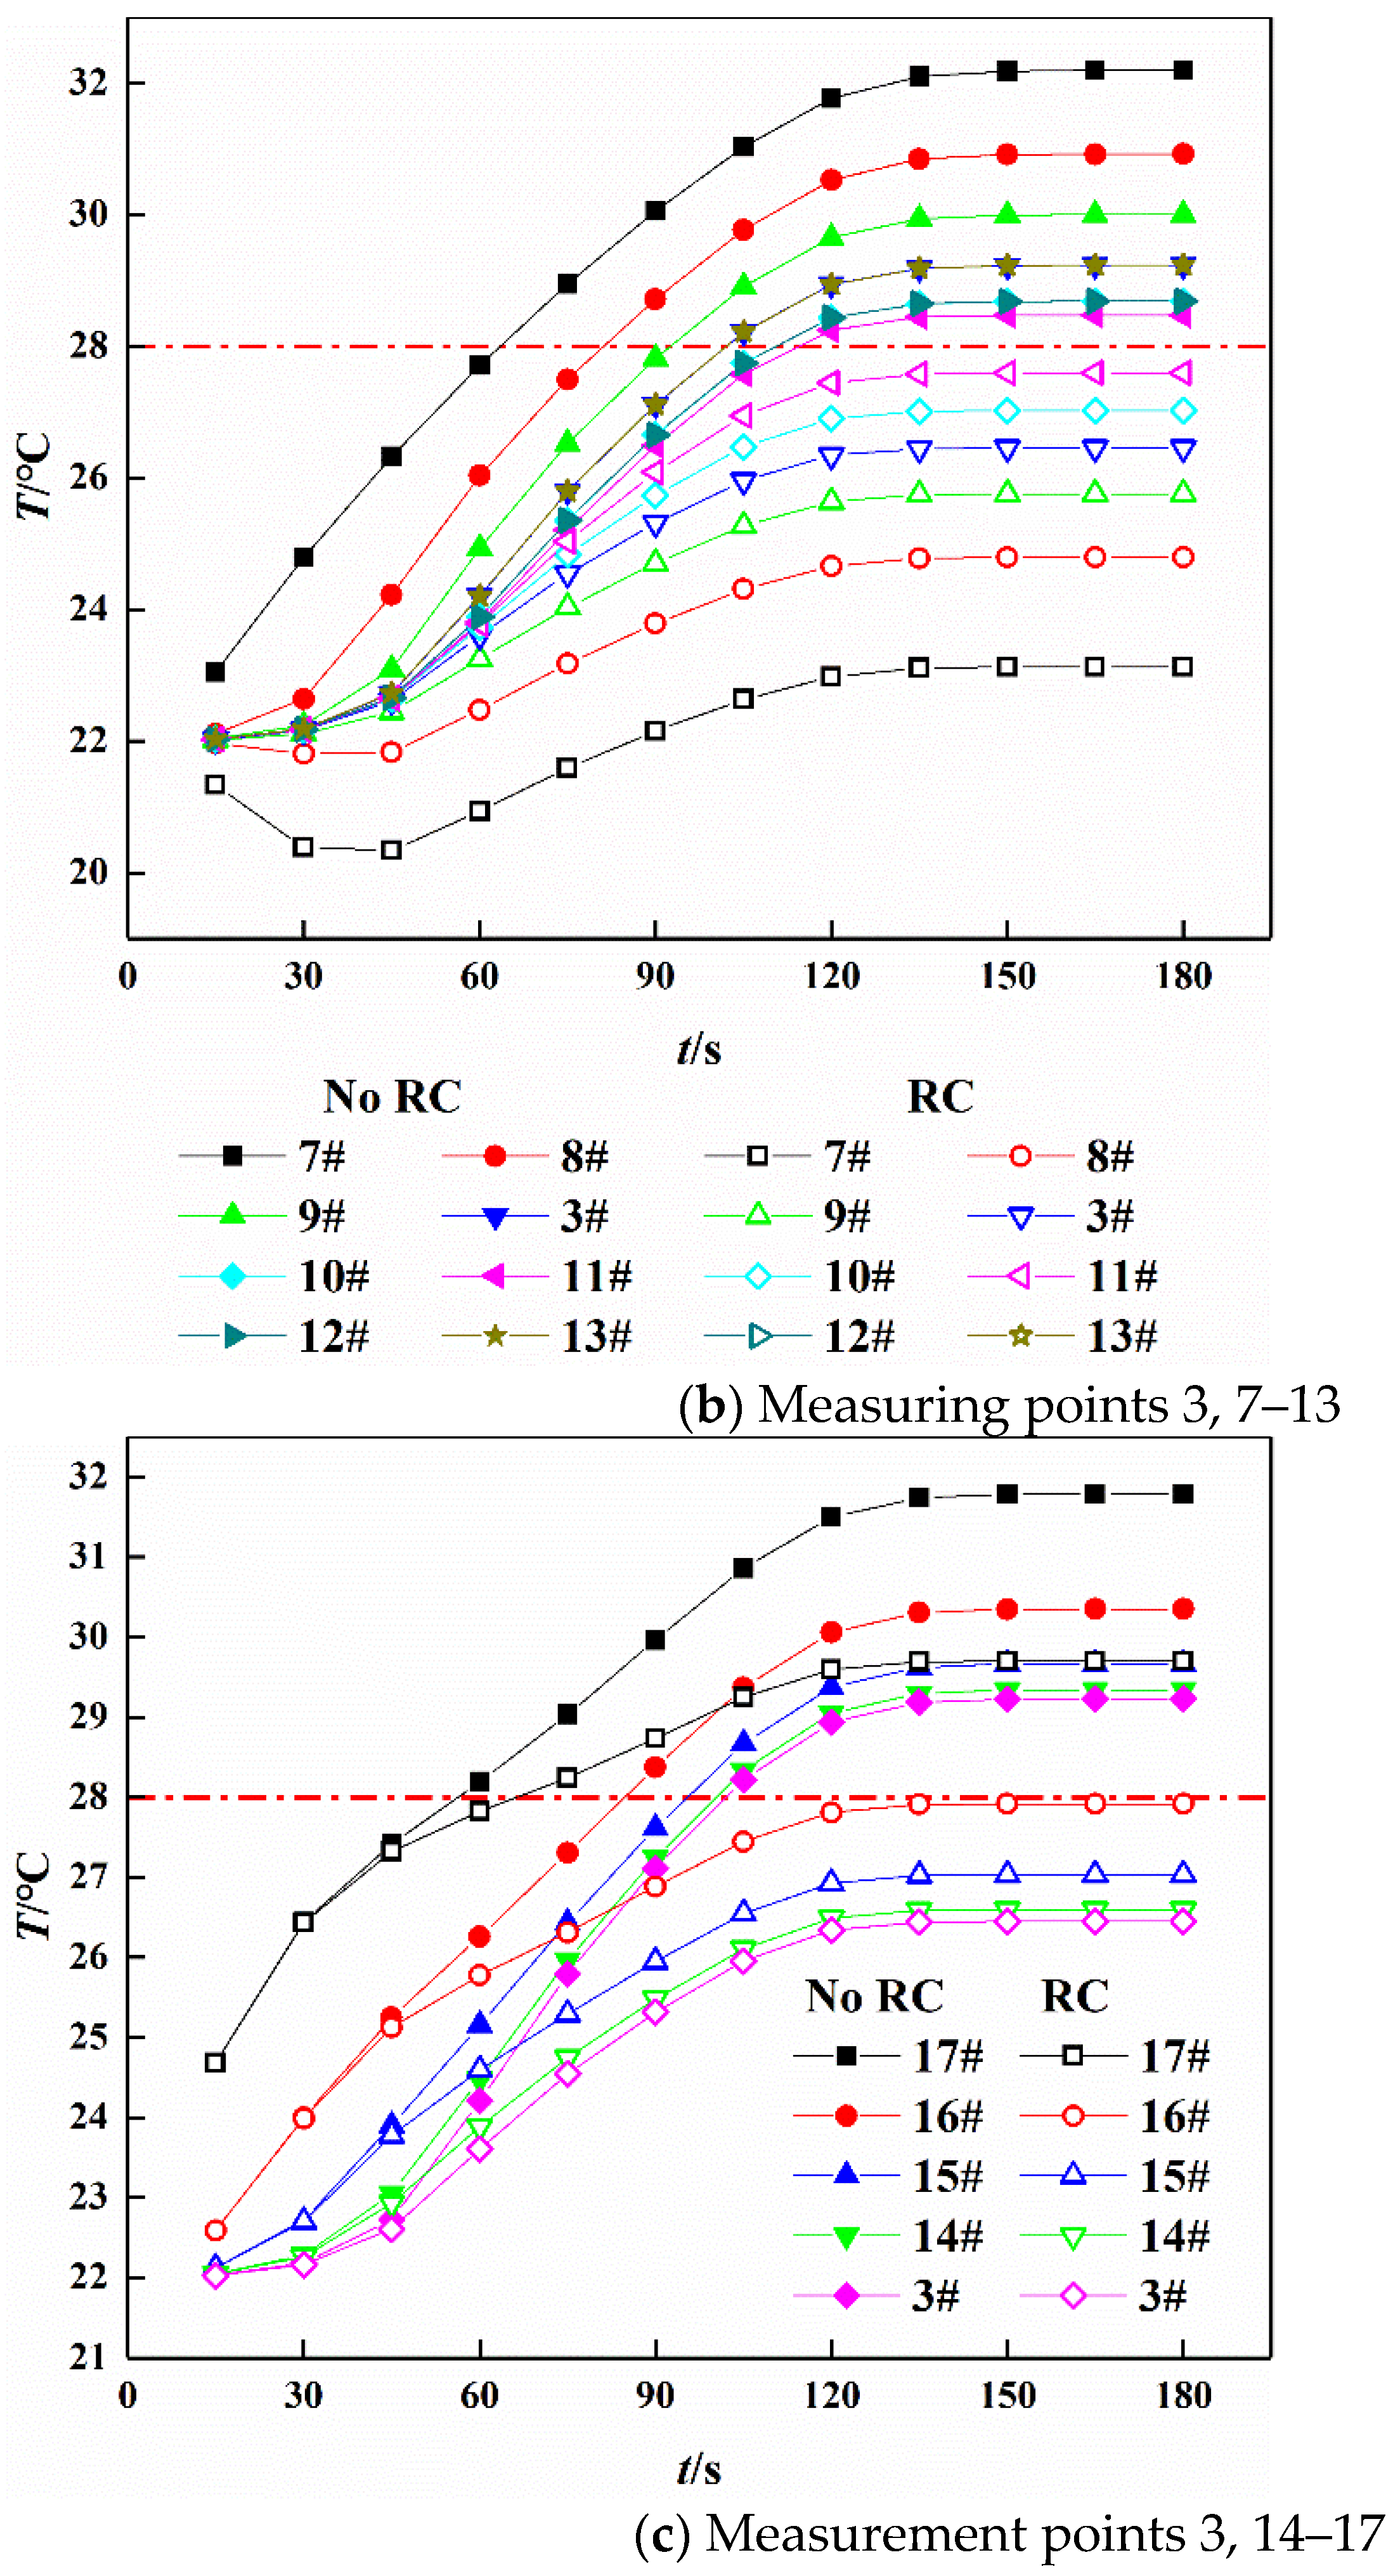
3.2. Analysis of Airflow Temperature Variation at Measuring Points of Working Face before and after Cooling

Figure 8 shows the temperature variation of the measuring points in working face with time before and after cooling. Figure 8a shows that the temperature of other measuring points all increase with the extension of ventilation time except for the measuring point 1, and the increase is obvious in the early stage and tends to be stable in the later stage. There is obviously a difference in the time of airflow temperature reaching the stable at each measuring point. The closer to the exit of the working face, the longer the time it takes to reach the stable temperature. The adoption of cooling measures makes the temperature of measuring points significantly reduced, and the farther away from the inlet, the more obvious the cooling effect. Table 2 shows the temperature of measuring points from 1 to 6. No taking cooling measures, at 90 s ventilation time, the temperature increment of measuring points 1 and 2 is within 0.5 °C and the increment of other measuring points is between 2–5 °C. This is mainly because the longer the working face, the longer the heat transfer time is between the airflow and the surrounding wall. Therefore, the temperature increment increases. After adopting cooling measures, at 90 s ventilation time, the temperature increment of measuring points 1 and 2 is within 0.4 °C and the increment of the other measuring points is between 1.5 °C and 3.5 °C. Compared to conditions with no cooling measures, the temperature increment decreases by 0.01 °C, 0.07 °C, 0.69 °C, 1.55 °C, 2.22 °C and 2.78 °C successively. It can be seen that the radiation cooling measures can effectively slow down the heating effect of the surrounding wall on the airflow, and therefore, the closer the measuring point is to the exit, the more obvious is the cooling effect.
Figure 8b,c show that the airflow temperature at each measuring point increases continuously from the beginning of ventilation, and reaches the maximum at 135 s of ventilation. When no cooling measures are taken, the closer to the goaf along the width direction, the higher the airflow temperature at the measuring point, and the closer to the bottom of the roadway along the height direction, the higher the airflow temperature at the measuring point. The airflow temperature at each measuring point is obviously lowered by adopting cooling measures. The closer to the backfill body along the width direction and the closer to the center of the roadway along the height direction, the more obvious the cooling effect. Table 2 shows the temperature of measuring points from 7 to 13. Compared with before cooling, the temperature increment decreases by 9.07 °C, 6.13 °C, 4.25 °C, 2.78 °C, 1.66 °C, 0.88 °C, 0.42 °C and 0.19 °C, successively. The temperature of measuring points 7 and 8 decreases at beginning and then increases. This is because they are close to the cold wall, and the cooling effect of the cold wall at the beginning of ventilation is higher than the thermal influence of the thermal environment, so the airflow temperature decreases. With the extension of ventilation time, the airflow temperature gradually rises due to the enhancing influence of the thermal environment. Table 2 shows the temperature of the measuring points from 14 to 17. Compared with how it was before cooling, the temperature increment decreases by 2.78 °C, 2.74 °C, 2.64 °C, 2.43 °C and 2.09 °C successively. This is mainly because the surrounding wall heats the airflow, while the cold wall of backfill body absorbs heat from the airflow. The closer it is to the cold wall, the more heat is absorbed and the slower the airflow temperature rises.
After taking cooling measures, the temperature of other measuring points, except 12, 13 and 17, are all below 28 °C. Because measuring points 12 and 13 are close to the shearer, there is generally not a working region of workers near the shearer. Measuring point 17 is the position of the foot and a slightly higher temperature does not affect the thermal comfort of the workers and so the airflow temperature in the main working region of workers is below 28 °C, which meets the requirements of safe production.

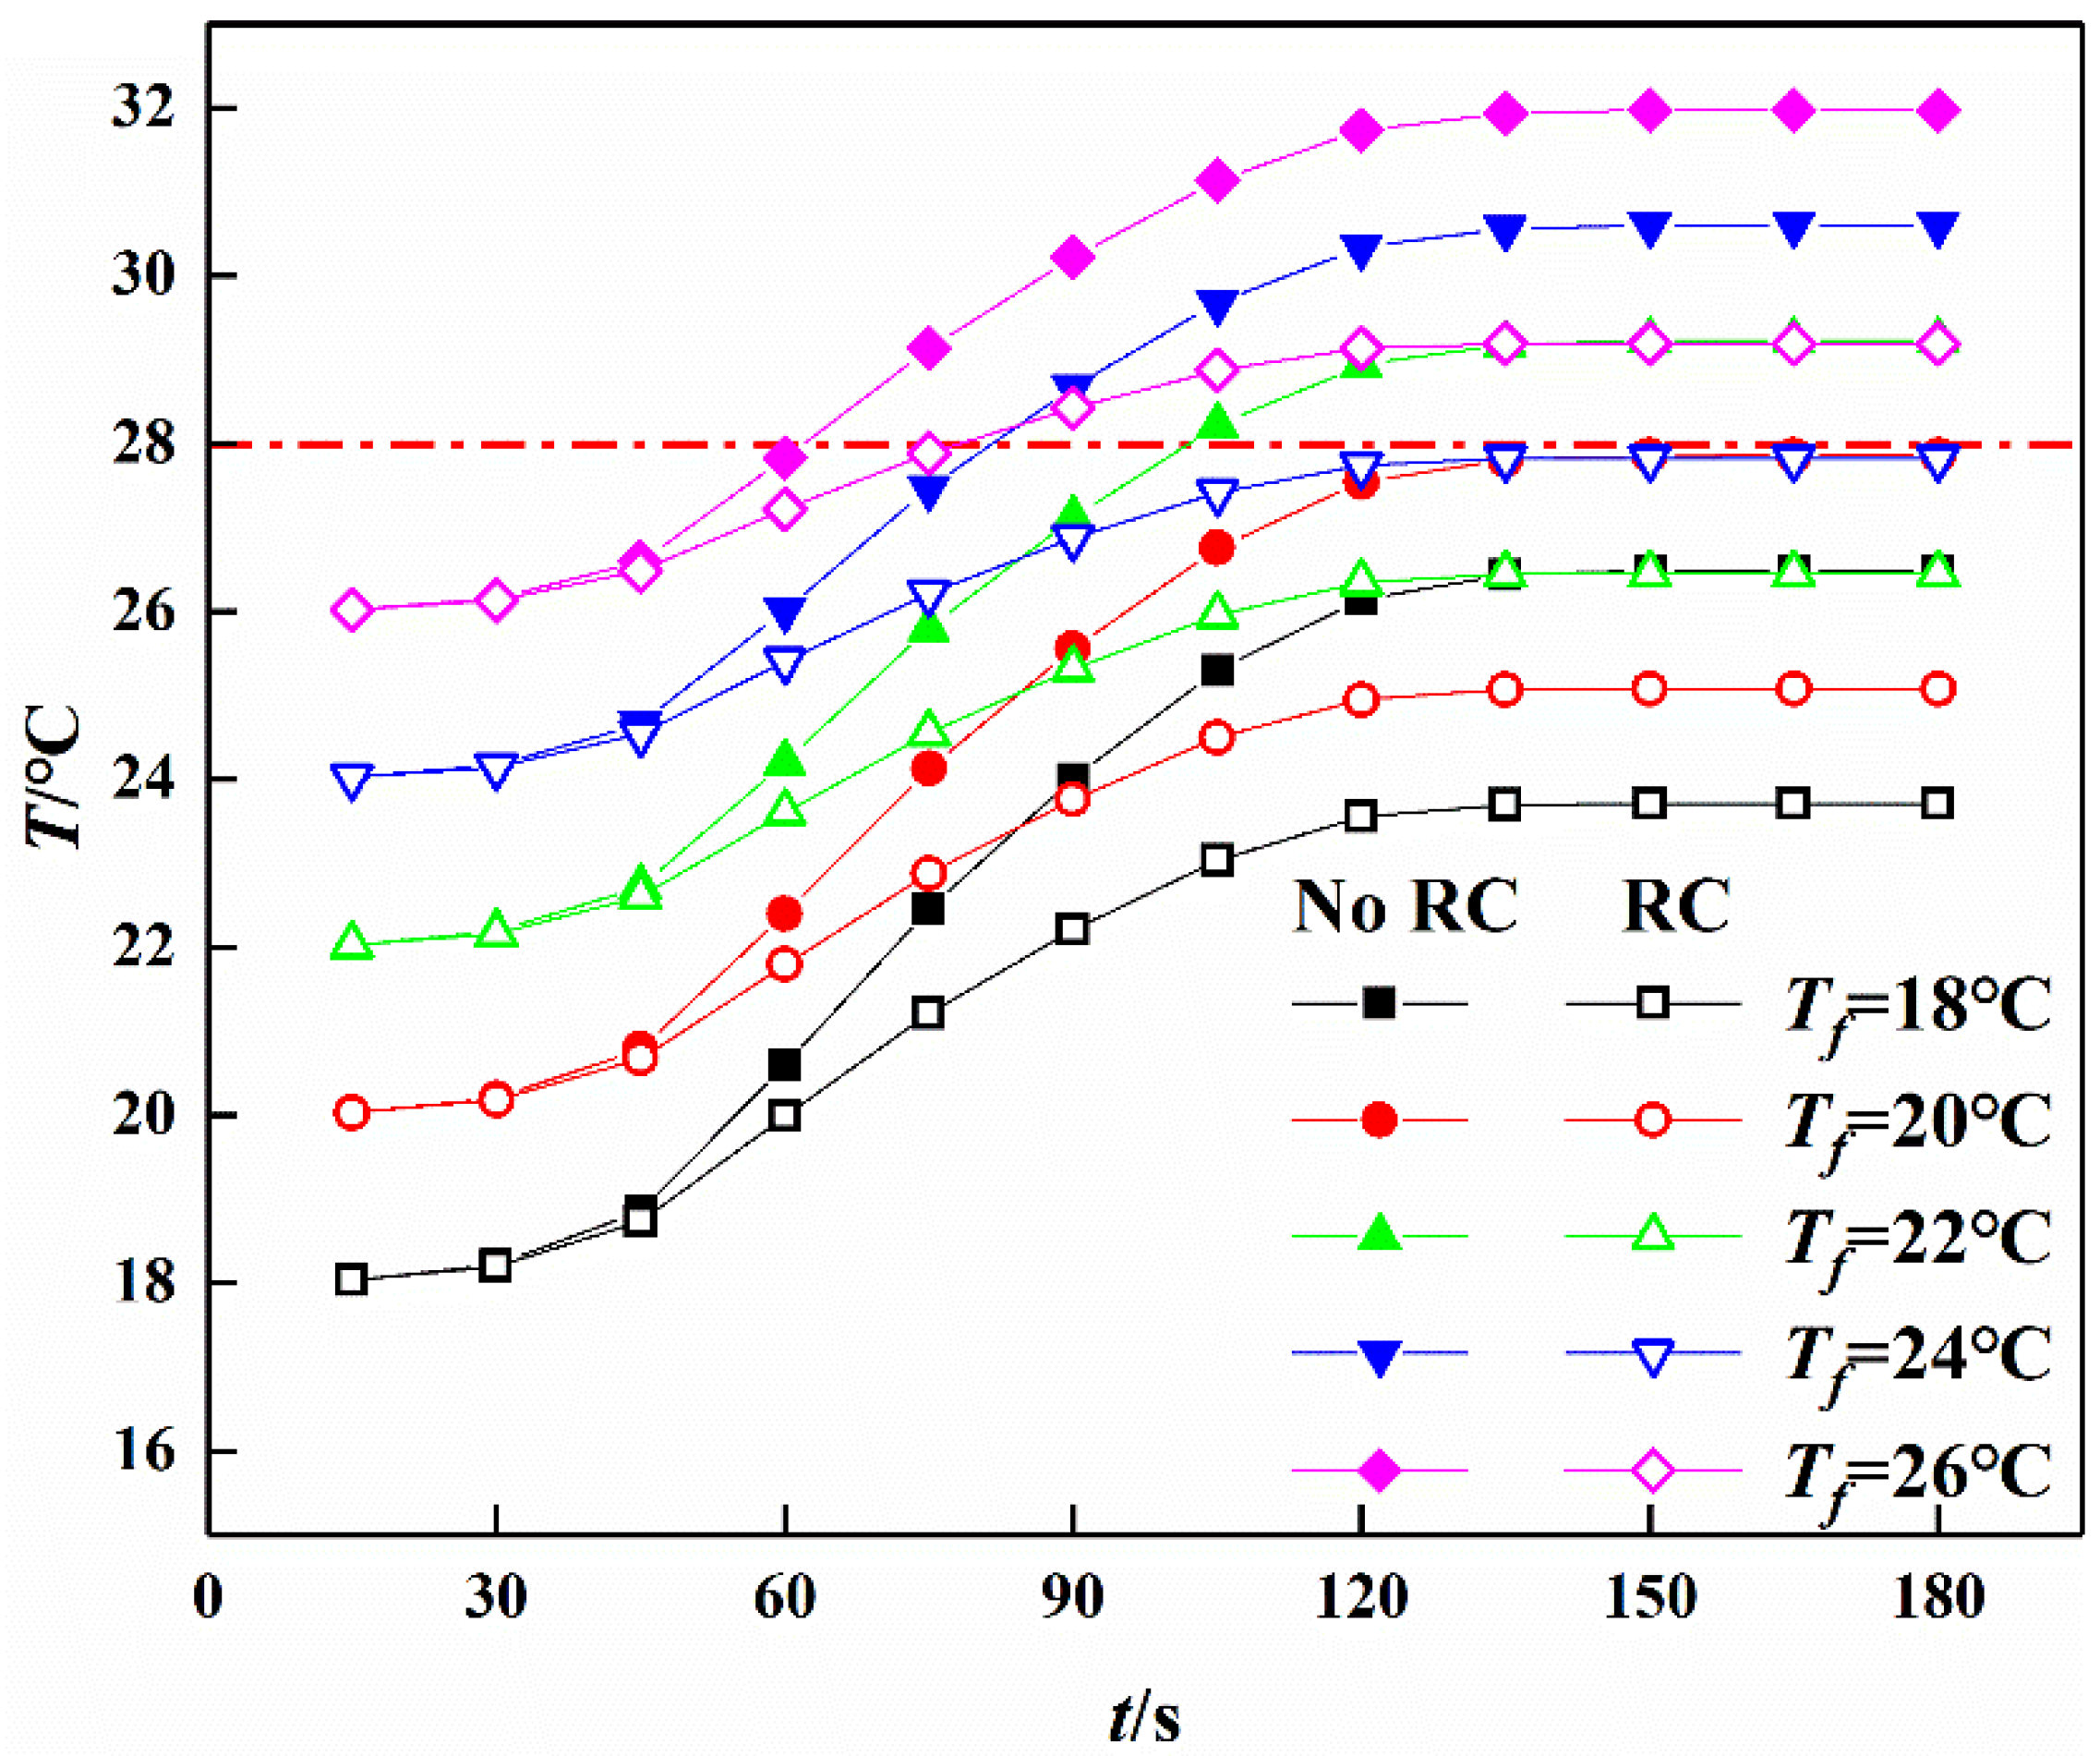
3.3. Effect of Air Supply Temperature on Airflow Temperature

Under the condition of air supply velocity of 2.5 m/s, the surrounding wall temperature is 45 ℃, the air supply temperatures are 18 °C, 20 °C, 22 °C, 24 °C, 26 °C respectively, and the cold wall temperature is 7 °C; the influence of air supply temperature on the temperature distribution of the working face is studied before and after cooling.
Figure 9 shows the variation of airflow temperature at measuring point 3 with ventilation time under different air supply temperatures. It shows that the airflow temperature continues to rise with the extension of ventilation time, the temperature rises slowly in the first 45 s and rises significantly from 45–120 s, then tends to be flat after 120 s. Table 3 shows the temperature of measuring point 3 under different air supply temperatures. Cooling measurements are not taken and the temperature of the measuring point increases by 1.37 °C for every 2 °C increase in the air supply temperature. It is thus clear that the higher the air supply temperature, the higher the airflow temperature of the working face as a whole. After cooling measures are taken, the temperature of the measuring point also increases by 1.37 °C for every 2 °C increase of the air supply temperature. Compared with before cooling, the temperature increment decreases about 2.78 °C. At this time, the airflow exchanges heat not only with the rock wall or the coal wall, but also with the cold wall of the backfill body. Therefore, although the airflow temperature increases with the extension of ventilation time, the increment decreases obviously due to the influence of the cold wall. In addition, Figure 9 also shows that the airflow temperature at measuring point 3 exceeds 28 °C when the air supply temperature is 26 °C, even if the cold wall temperature is 7 °C; therefore, the air supply temperature is generally maintained between 18–24 °C to ensure the airflow temperature at measuring point 3 within a prescribed scope, or the cold wall temperature of the backfill body needs to be further reduced to ensure the airflow temperature at measuring point 3 does not exceed the limit.

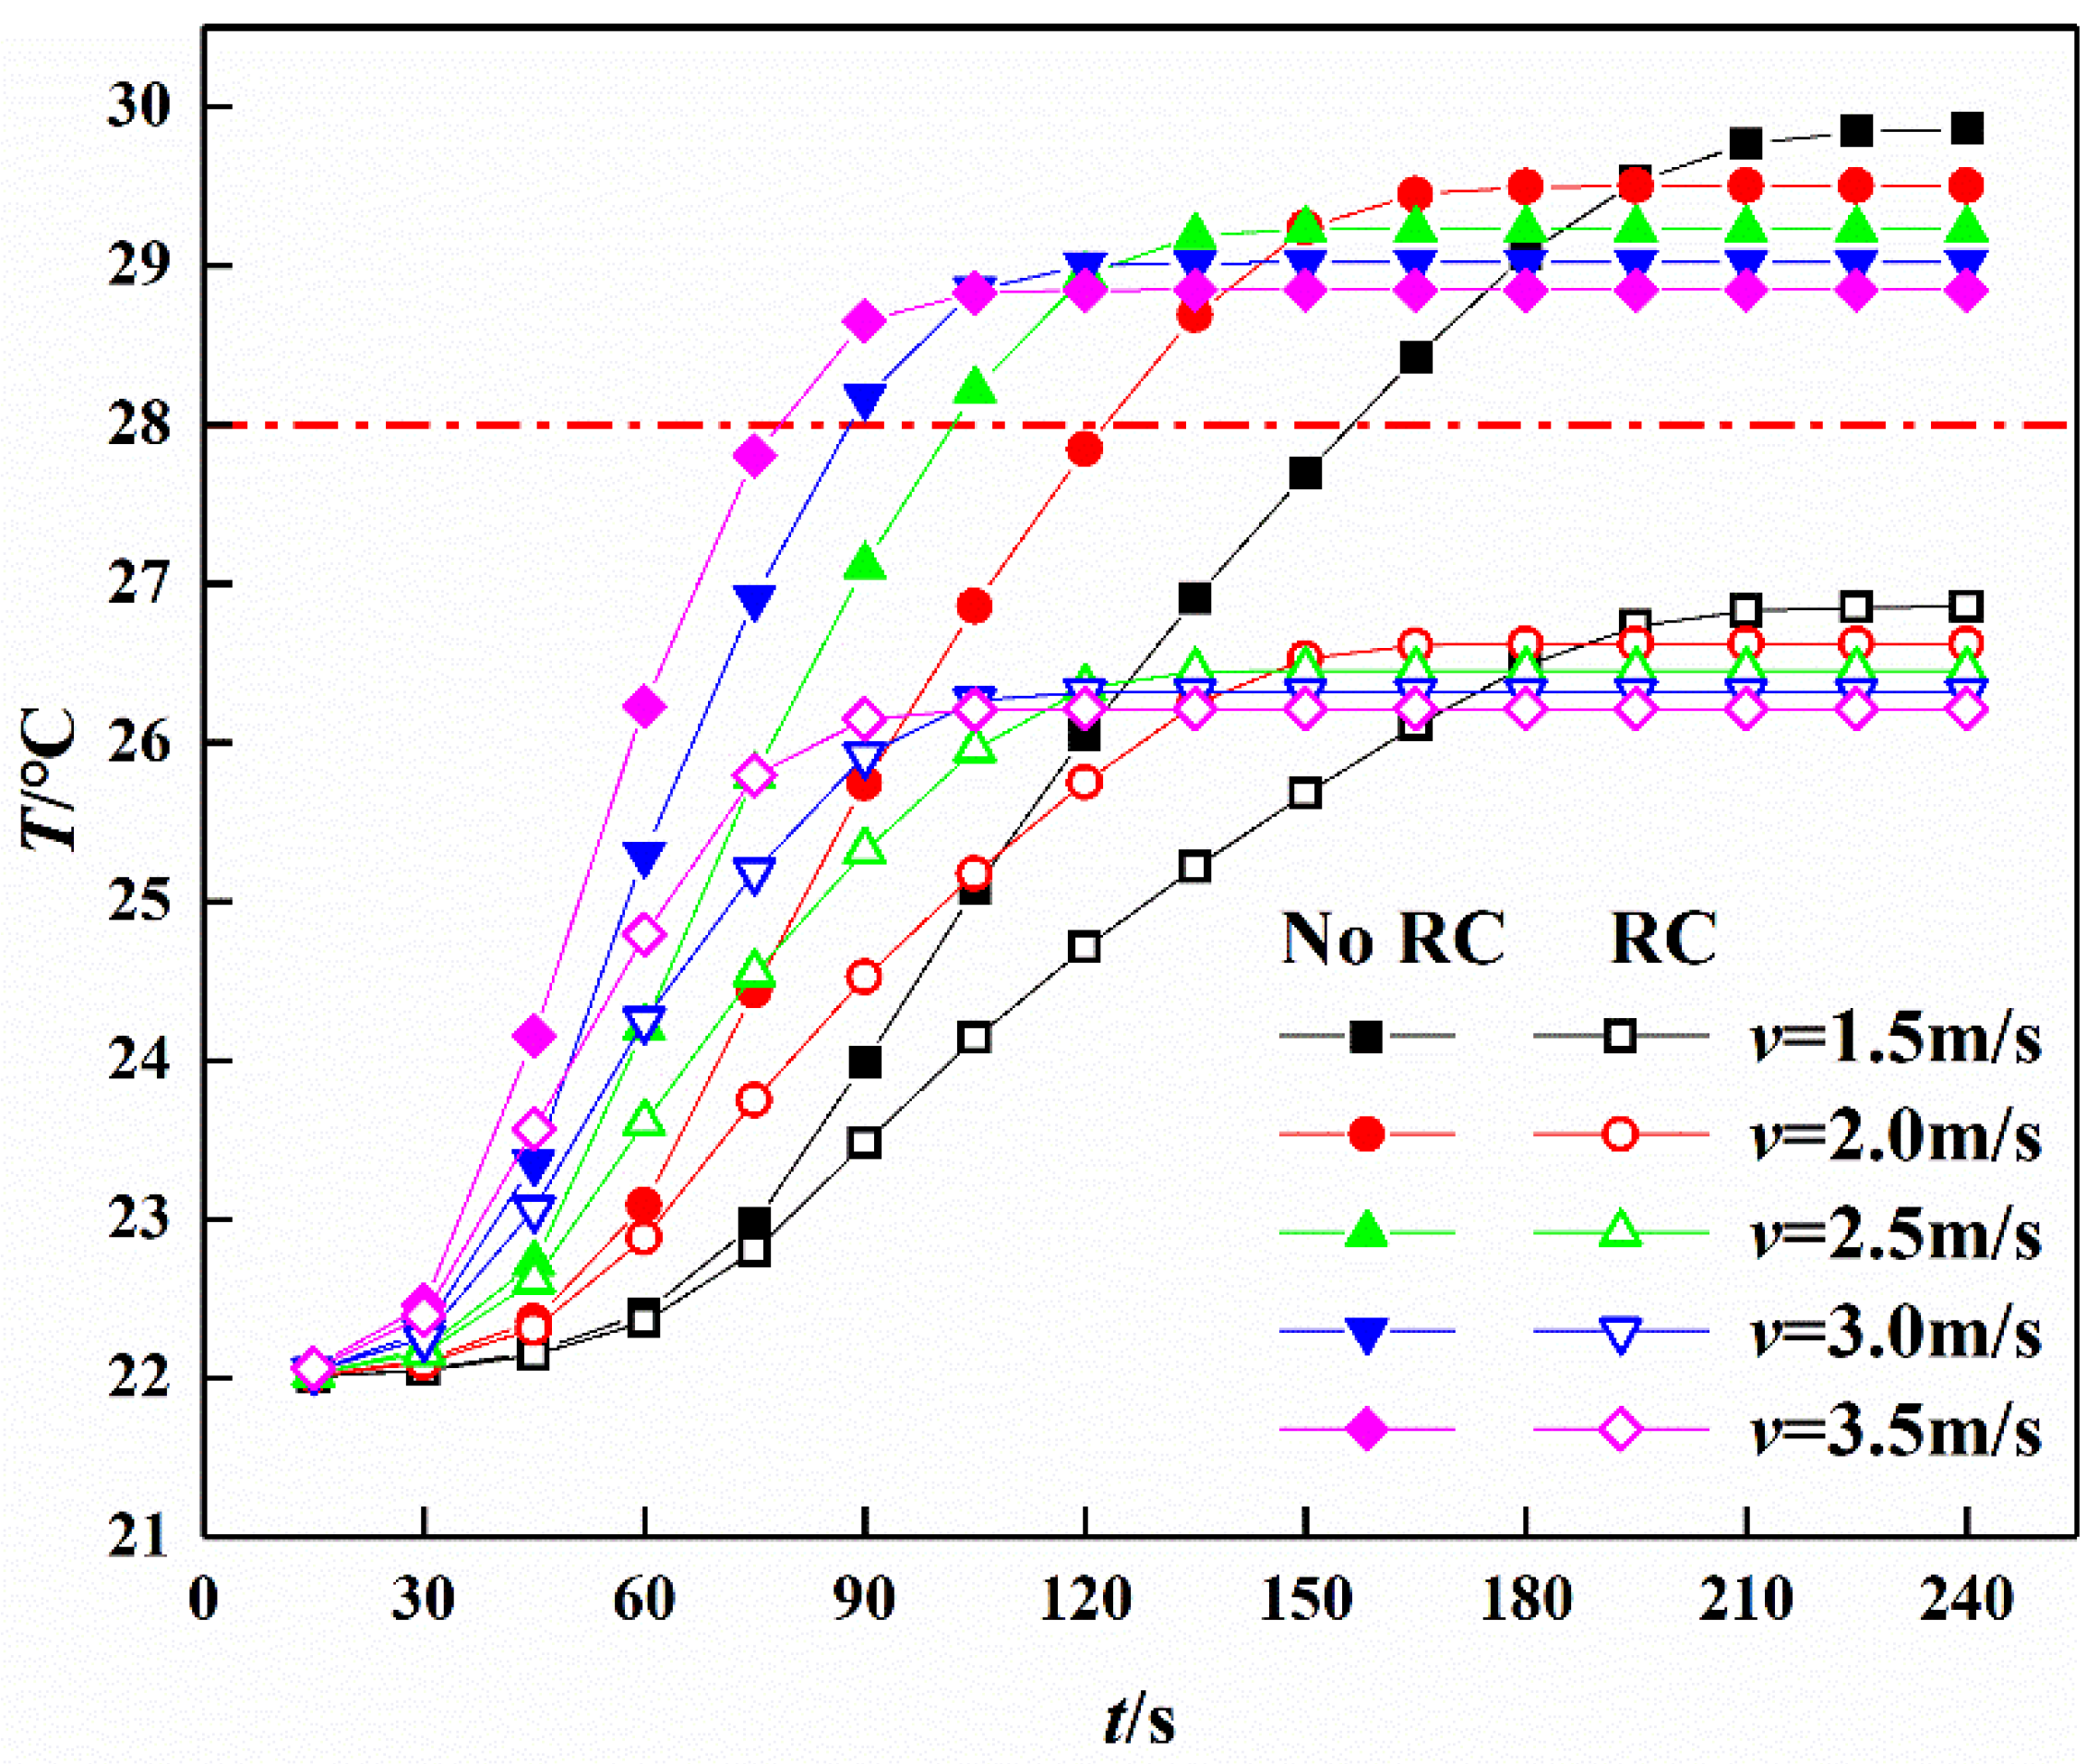
3.4. Effect of Air Supply Velocity on Airflow Temperature

Under the conditions of air supply temperature of 22 °C, surrounding wall temperature of 45 °C, air supply velocity of 1.5 m/s, 2. 0 m/s, 2.5 m/s, 3.0 m/s, 3.5 m/s respectively, and a cold wall temperature of 7 °C, the influence of air supply velocity on the temperature distribution of the working face is was before and after cooling.
Figure 10 shows the variation of the airflow temperature at measuring point 3 with ventilation time under different air supply velocities. It also shows that the airflow temperature keeps rising with the extension of the ventilation time. The higher the air supply velocity, the faster the temperature rising rate was at the measuring point, and the sooner measuring point 3 reached the maximum temperature and tended to be stable. However, the higher the air supply velocity, the lower the maximum temperature of airflow. Table 4 shows the temperature of measuring point 3 under different air supply velocities. Cooling measures are not taken, and when the air supply velocity increases from 1.5 m/s to 3.5 m/s at an interval of 0.5 m/s, the temperature of the measuring point tends to be stable at 210 s, 165 s, 135 s, 120 s and 90 s, and the temperature increment is 7.76 °C, 7.45 °C, 7.19 °C, 7.00 °C and 6.65 °C successively. After cooling measures are taken, when the air supply velocity increases from 1.5 m/s to 3.5 m/s at an interval of 0.5 m/s, the temperature of the measuring point increases also tend to be stable at 210 s, 165 s, 135 s, 120 s and 90 s. The temperature increment is 4.83 °C, 4.61 °C, 4.44 °C, 4.32 °C,4.15 °C and it decreases 2.93 °C, 2.84 °C, 2.75 °C, 2.68 °C, 2.50 °C successively compared with before cooling. It can be seen that the time required for the temperature of the measuring point reaching a stable value is the same as before cooling, and the airflow temperature of measuring point 3 is below 28 °C, which meets the requirements for safety production after cooling. The analysis shows that the higher the air supply velocity, the stronger the heat transfer, but the shorter the time of heat transfer between the airflow and the wall, the greater the airflow volume through the working face in the same time, the latter is more dominant than the heat transfer enhancement caused by the increase of airflow velocity. Therefore, the smaller the temperature rise caused by the airflow absorbing heat, the earlier the stable temperature is reached, and the lower the stable temperature is. It can be seen that increasing air supply velocity can alleviate the heat hazard of the working face to some extent, but the alleviation degree is limited. By radiant cooling of backfill body, the airflow temperature of the working face can be effectively reduced to ensure that the airflow temperature is within the prescribed range at the exit of the working face.

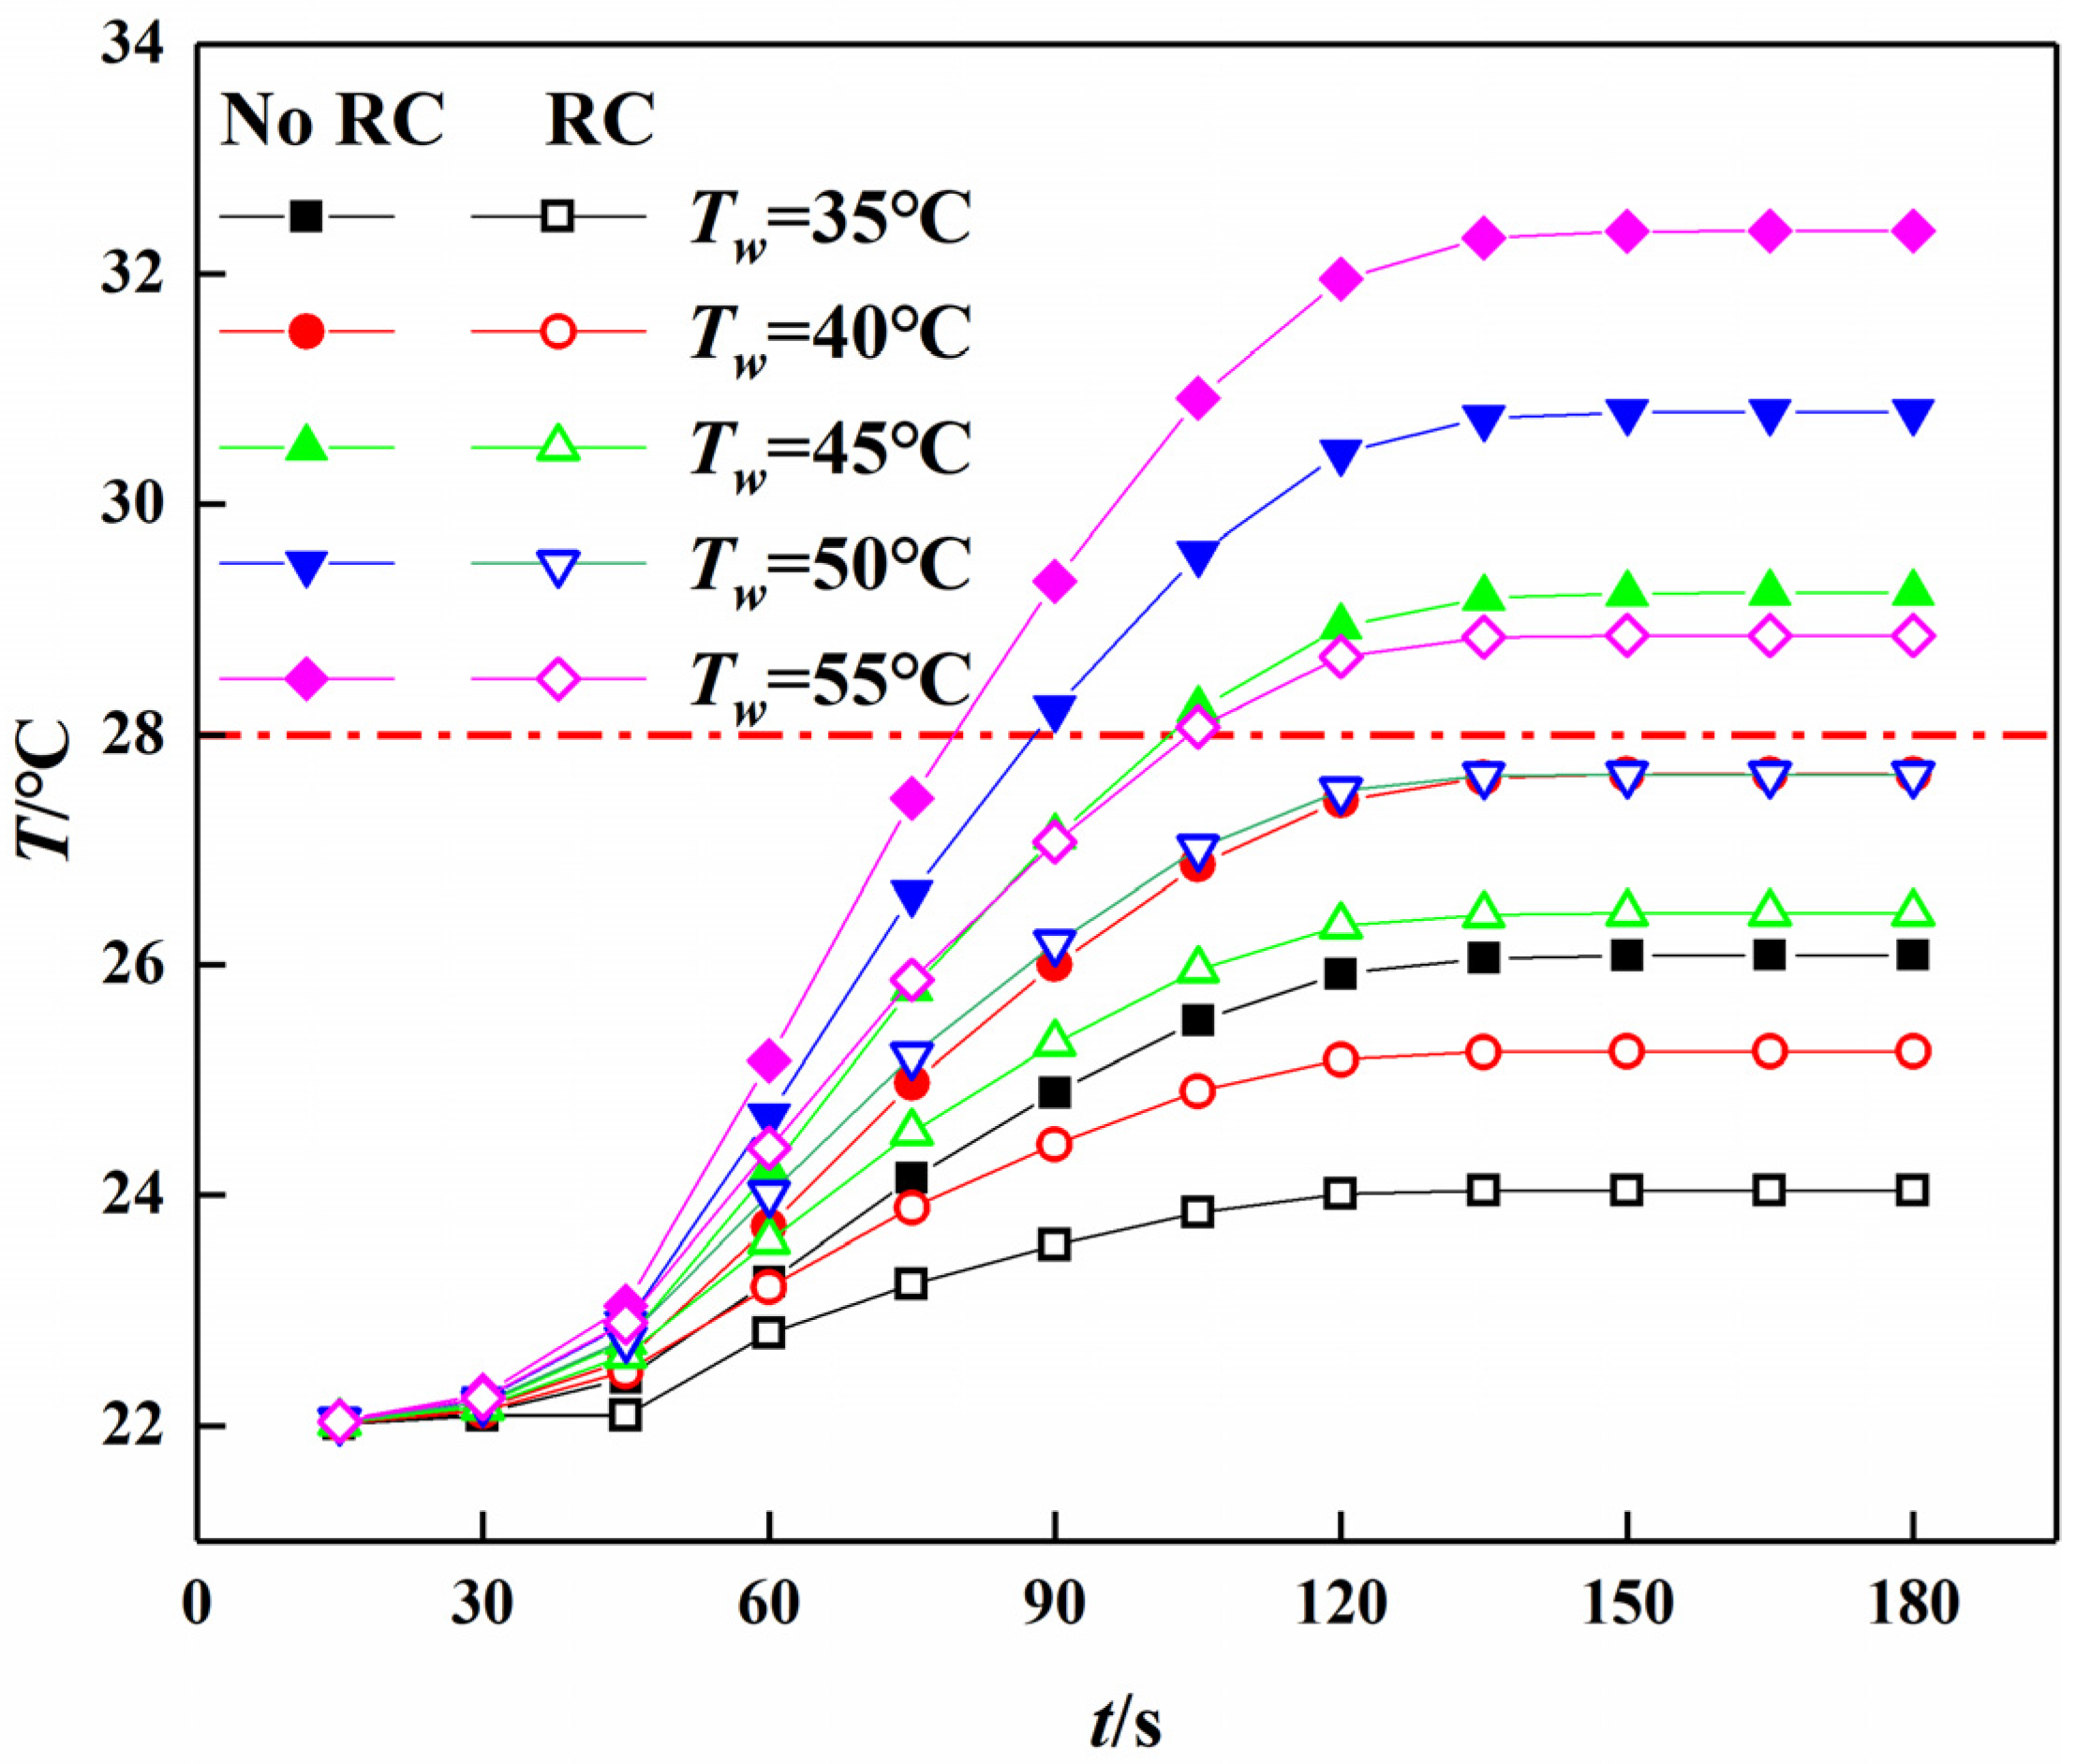
3.5. Effect of Surrounding Wall Temperature on Airflow Temperature

Under the conditions of air supply temperature of 22 ℃, air supply velocity of 2.5 m/s, surrounding wall temperature of 35 °C, 40 °C, 45 °C, 50 °C, 55 °C respectively, and a cold wall temperature at 7 °C, the influence of the surrounding wall temperature on the temperature distribution of the working face was studied before and after cooling.
Figure 11 shows the variation of airflow temperature at measuring point 3 with ventilation time under different surrounding wall temperatures. The figure clearly shows that the airflow temperature rises continuously with the extension of ventilation time, and the temperature rises faster in the early stage and tends to be flat in the later stage. The higher the surrounding wall temperature, the faster the airflow temperature rises, and the higher the airflow temperature and its stable temperature. Table 5 shows the temperature of measuring point 3 under different surrounding wall temperatures. Cooling measures are not taken; when the surrounding wall temperature increases from 35 °C to 55 °C at an interval of 5 °C, the airflow temperature of measuring points increases in increments of 2.89 °C, 4.00 °C, 5.11 °C, 6.25 °C and 7.34 °C successively at 90 s. The temperature basically reaches a stable value at 135 s and the temperature increments are 1.20 °C, 1.66 °C, 2.12 °C, 2.55 °C, 3.03 °C, respectively. When the surrounding wall temperature increases by 5 °C, the airflow temperature of the measuring points increase by 1.57 °C. This is because the higher the surrounding wall temperature, the greater the heat transfer temperature difference between the airflow and surrounding wall is, and the greater the heat transfer capacity, so the airflow temperature is higher. When the surrounding wall temperature is 35–40 °C, the ventilation condition can ensure that the airflow temperature does not exceed the limit at the exit of working face, and cooling measures are not needed. However, cooling measures are needed for the decreasing airflow temperature when the surrounding wall temperature exceeds 45 °C. The airflow temperature rise range is obviously reduced when the cold wall of the backfill body is used to cool the airflow of the working face. When the surrounding wall temperature rises from 35 °C to 55 °C at an interval of 5 °C, the airflow temperature of the measuring point rises at increments of 1.56 °C, 2.44 °C, 3.32 °C, 4.19 °C and 5.07 °C successively at 90 s; the increment is 0.48 °C, 0.80 °C, 1.13 °C, 1.47 °C, 1.79 °C successively at 135 s. It can be seen that the temperature rise range of the airflow at the exit can be effectively reduced by using the cold wall of the backfill body. The surrounding wall temperature is 35–50 °C, the airflow temperature of measuring point 3 is lower than 28 °C without exceeding the limit. When the surrounding wall temperature is above 50 °C, it was necessary to further reduce the temperature of the cold wall or take other cooling measures.

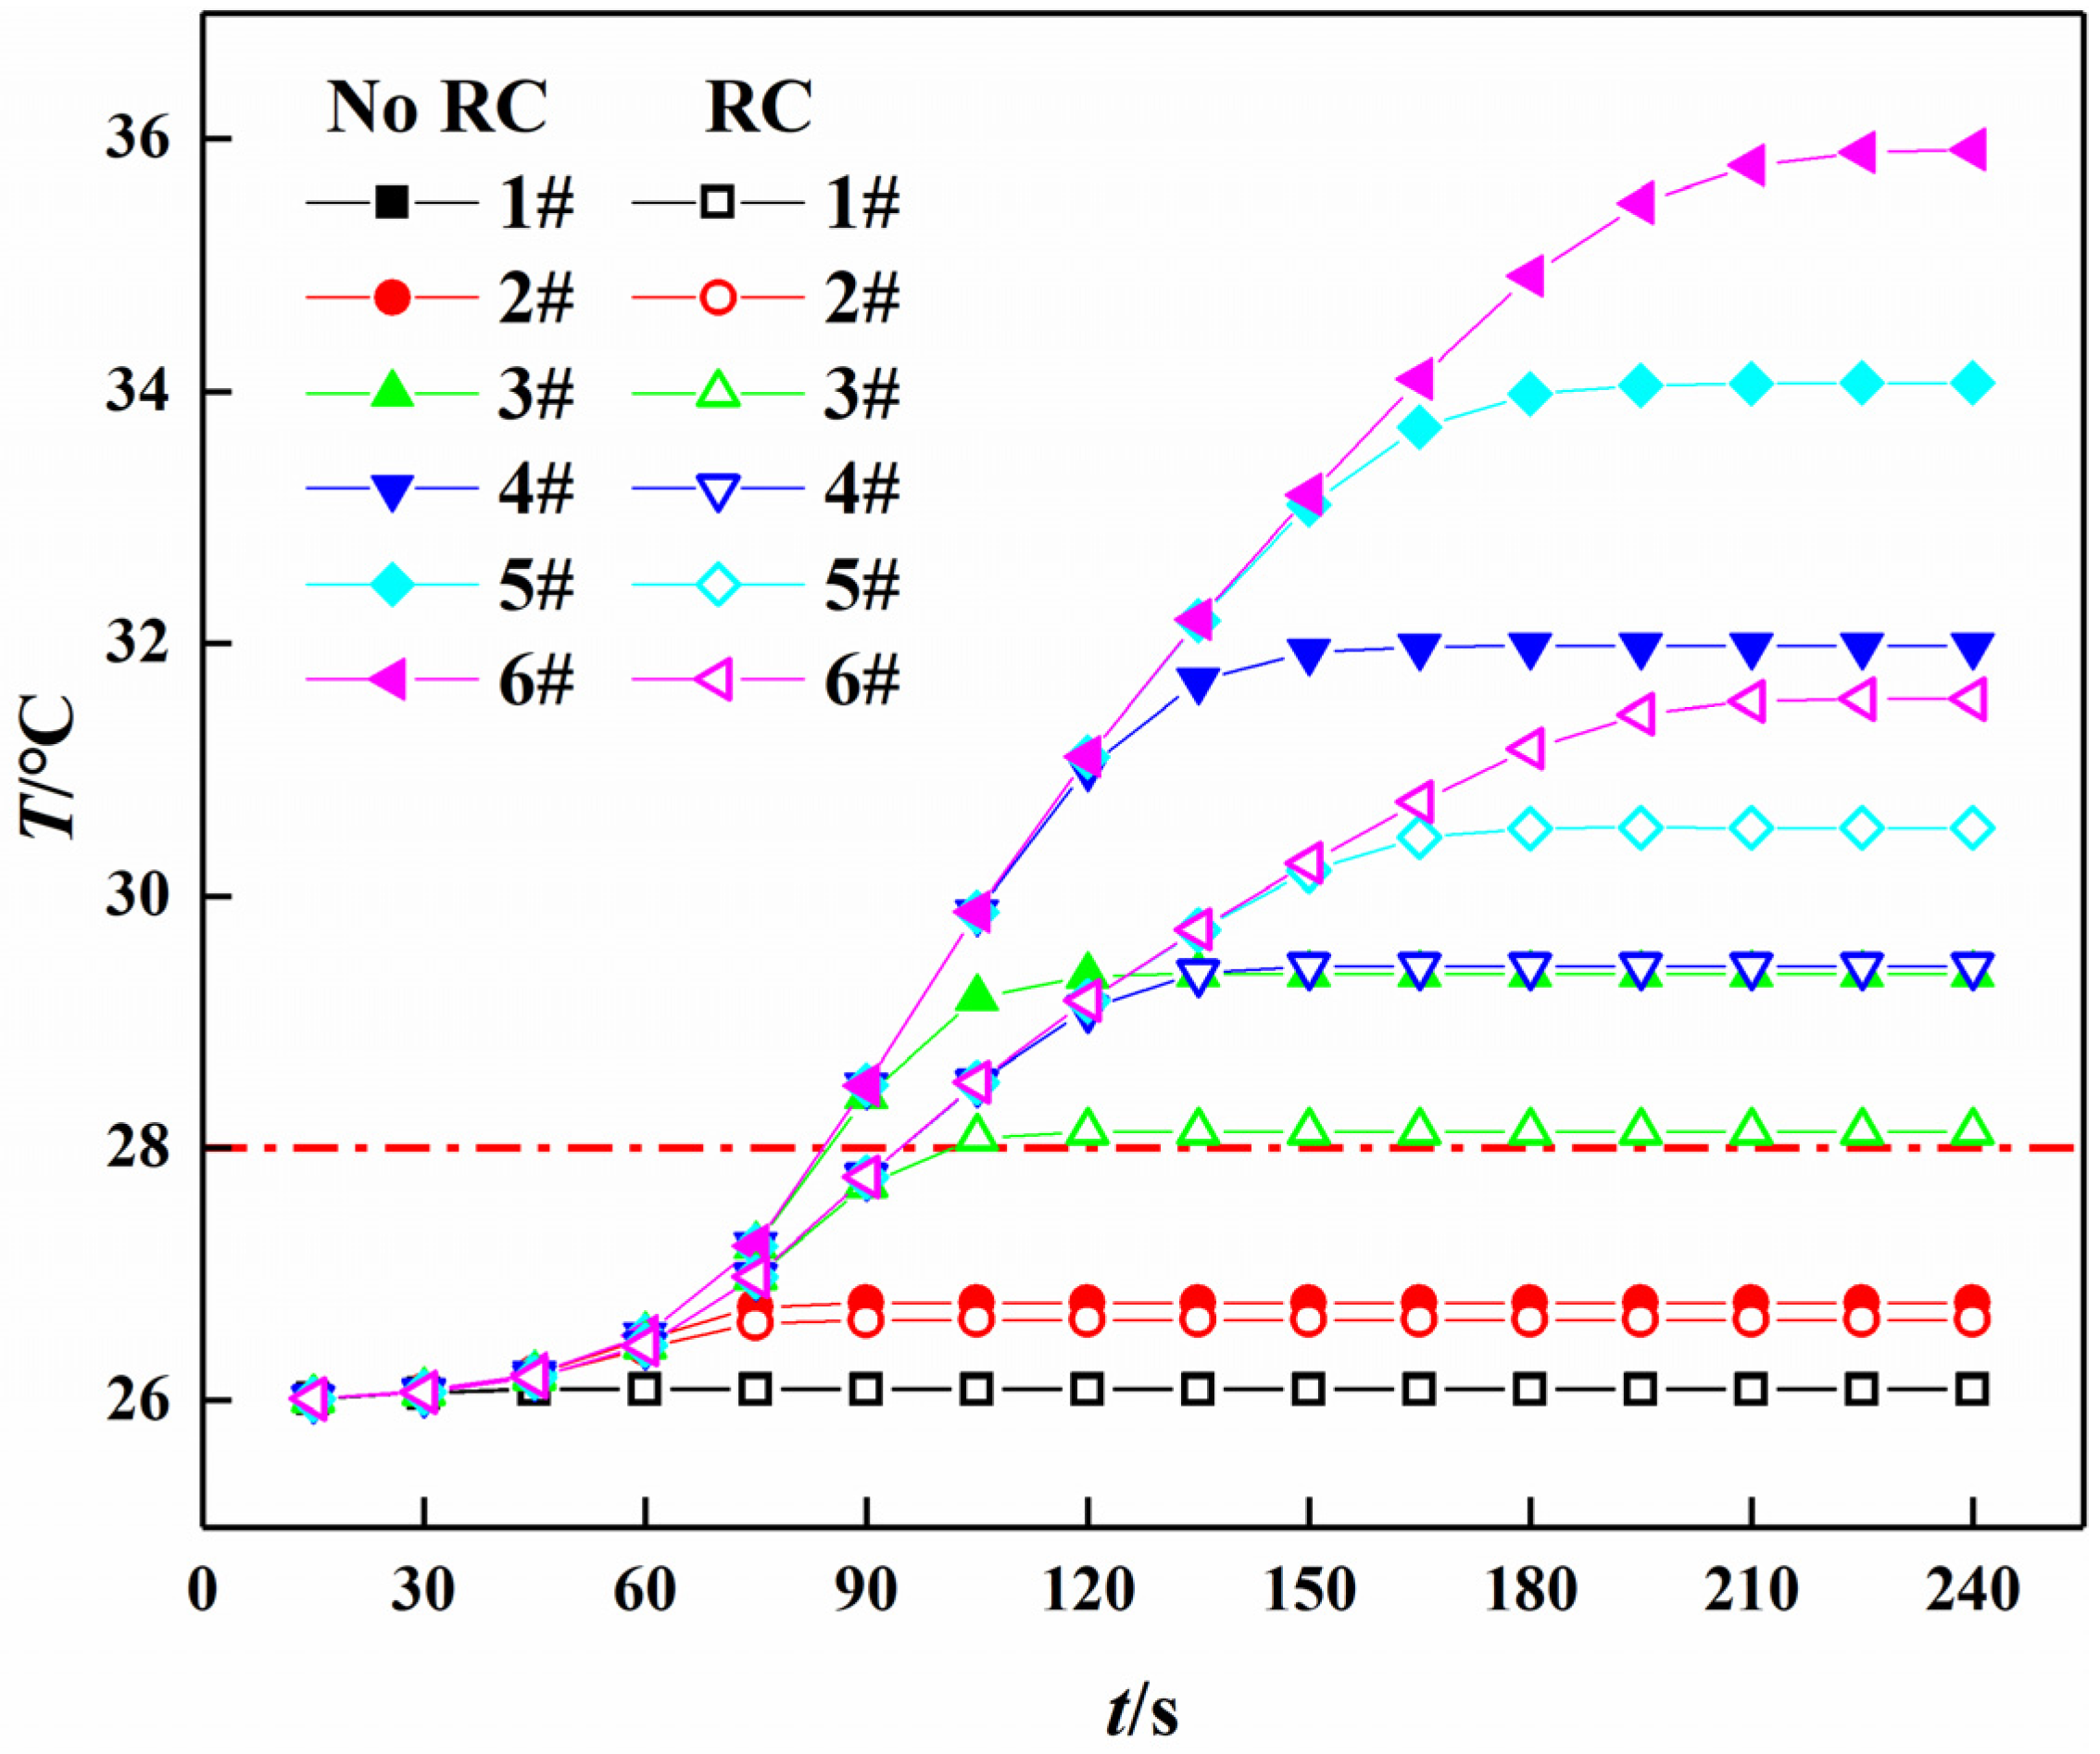
3.6. Airflow Temperature Distribution in Working Face under the Most Unfavorable Condition

Under the conditions of air supply temperature of 26 °C, air supply velocity of 1.5 m/s, surrounding wall temperature of 55 °C and the cold wall temperature at 0 °C, the variation of airflow temperature was studied under the most unfavorable conditions.
Figure 12 shows the variation of the airflow temperature at measuring points 1–6 with ventilation time. The figure clearly shows that when cooling measures are not taken, the temperature of other measuring points is quickly beyond the limit, except near the airflow inlets at point 1 and 2; the temperature of measuring points 3–6 exceed the limit at about 90 s. Table 6 shows the temperature of measuring points 1–6 under the most unfavorable conditions. At temperature measuring points 1–6, the increments are 0.09 °C, 0.77 °C, 3.38 °C, 5.98 °C, 6.98 °C and 8.06 °C successively at 240 s. After cooling measures are taken, the temperature of measuring points 1–6 at increments decrease by 0.01 °C, 0.13 °C, 1.25 °C, 2.54 °C, 2.44 °C and 2.51 °C successively. The closer to the exit, the more obvious the decrease of temperature increment. It can be seen that when the length of the working face is less than 150 m, the airflow temperature can be maintained below 28 °C in the most unfavorable situations discussed in this part. When the length of the working face exceeds 150 m, the cooling measures cannot decrease the airflow temperature of the entire working face to below 28 °C. At this time, it needs to be combined with other cooling measures to cool the airflow; for example, the method of arranging an air cooler in sections along the working face can be used to decrease the airflow temperature.

4. Conclusions

Based on the backfill mining method, cold water pipes are arranged inside the backfill body to decrease the airflow temperature of the working face through the combined operation of water wall radiation refrigeration and ventilation. A three-dimensional heat transfer model of the working face is established. The airflow temperature distribution of the working face is simulated under different working conditions, and the main conclusions are drawn as follows:
(I)
When cooling measures are not taken, the airflow continuously absorbs heat from the surrounding wall along the working face, and the temperature gradually rises. After cooling by cold wall, the trend of the airflow temperature rising along the working face is slowed down. Compared with before cooling, the temperature increment of Z = 50 m, 100 m, 150 m, 200 m, 250 m and 300 m sections decreases by 0.67 °C, 0.48 °C, 0.40 °C, 0.36 °C, 0.33 °C and 0.29 °C, respectively.
(II)
The airflow temperature at measuring points increase with the ventilation time, and the time to reach the stable value is obviously different. The closer to the exit of the working face, the longer the time it takes to reach the stable temperature and the more obvious the cooling effect is. When the air supply temperature is 26 °C, the temperature of the measuring point can reach 31.97 °C without cooling measures, and the temperature of the measuring point is 29.19 °C after adopting cooling measures. Compared with before cooling, the temperature increment is reduced by 2.78 °C.
(III)
The higher the air supply velocity, the faster measuring point 3 reaches the maximum temperature, the lower the maximum temperature of the airflow. When the air supply velocity increases from 1.5 m/s to 3.5 m/s, the temperature of measuring point 3 increases to the maximum at 210 s, 165 s, 135 s, 120 s, 90 s respectively. After using cooling measures, the temperature increment decreases to 2.93 °C, 2.84 °C, 2.75 °C, 2.68 °C and 2.50 °C successively.
(IV)
When cooling measures are not taken, the airflow temperature of the measuring points increase by 1.57 °C for every 5 °C increase in the surrounding wall temperature after reaching stability. After cooling measures are taken, the surrounding wall temperature is between 35–50 °C, the airflow temperature of measuring point 3 is lower than 28 °C.
(V)
When cooling measures are not taken, airflow temperatures of measuring points exceed the limit rapidly, except for the measuring points near the airflow inlet. After cooling measures are taken, the temperature increment of measuring points 1–6 decreases by 0.01 °C, 0.13 °C, 1.25 °C, 2.54 °C, 2.44 °C, 2.51 °C respectively at 240 s.
(VI)
In this study, the radiation refrigeration and ventilation combined with operation cooling method not only reduces the temperature of the working face but it also provides a suitable working environment for the staff, realizes the integration of mine cooling and thermal energy utilization, as well as provides a utilization for geothermal resources.

Author Contributions

Resources, Writing—Review & Editing, Supervision, Data Curation, X.Z.; Validation, Methodology, Investigation, Formal analysis, B.B.; Conceptualization, Writing Original Draft, L.L.; Validation, Formal analysis, T.C.; Review & Editing, Y.K. and Q.D. All authors have read and agreed to the published version of the manuscript.

Funding

This research was supported by the National Natural Science Foundation of China (Nos. 51974225, 51874229, 51674188, 51904224, 51904225), Shaanxi Innovative Talents Cultivate Program-New-star Plan of Science and Technology (No. 2018KJXX-083), Natural Science Basic Research Plan of Shaanxi Province of China (Nos. 2018JM5161, 2018JQ5183, 2019JM-074), Scientific Research Program funded by the Shaanxi Provincial Education Department (Nos. 19JK0543), Outstanding Youth Science Fund of Xi’an University of Science and Technology (No. 2018YQ2-01).

Conflicts of Interest

There are no conflicts of interest for this work.

Nomenclature

ρ airflow density (kg/m3) T h e a t average temperature of the heating surface (K)
t time (s) T c o o l average temperature of the cooling surface (K)
    u velocity vector   q r radiative heat transfer between walls (W·m−2)
p pressure (N) q c convective heat transfer between air flow and wall surface (W·m−2)
τ viscous stress components σ Stephan Boltzmann constant (W·m−2·K−4)
F volumetric forces on elements (N)     F r comprehensive factor of wall radiation heat transfer
E total energy of the fluid (J) T f average airflow temperature (K)
k e f f effective heat transfer parameter     h c heat transfer coefficient between wall surface and airflow (W·m−2·K−1)
J j diffusion flow rate of component j (kg·m −2·s−1) D e equivalent diameter of surrounding wall (m)
    S h heat source term A area (m2)
average wall temperature of the working face (K) L perimeter (m)

References

  1. You, B.; Wu, C.; Li, J.; Liao, H. Physiological responses of people in working faces of deep underground mines. Int. J. Min. Sci. Technol. 2014, 24, 683–688. [Google Scholar] [CrossRef]
  2. Ranjith, P.G.; Zhao, J.; Ju, M.; De Silva, R.V.S.; Rathnaweera, T.D.; Bandara, A.K.M.S. Opportunities and challenges in deep mining: A brief review. Engineering 2017, 3, 546–551. [Google Scholar] [CrossRef]
  3. Habibi, A.; Kramer, R.B.; Gillies, A.D.S. Investigating the effects of heat changes in an underground mine. Appl. Therm. Eng. 2015, 90, 1164–1171. [Google Scholar] [CrossRef]
  4. Wei, H.; Fengtian, Y. The Study of Heat Dissipation Distribution on the Working Face of High-Temperature Mines. In Proceedings of the 2011 International Conference on Electric Technology and Civil Engineering (ICETCE), Lushan, China, 22–24 April 2011; pp. 7039–7043. Available online: http://ieeexplore.ieee.org/document/5774341/ (accessed on 3 March 2021).
  5. Wei, W.; Deyuan, Y. Analysis on thermal environment and selection od airflow cooling methods in coal mining face. Coal Sci. Technol. 2011, 39, 42–45. [Google Scholar] [CrossRef]
  6. Yafei, W. Discussion on design temperature of temperature drop in working face of high temperature mine. Coal Eng. 2009, 22–24. [Google Scholar]
  7. Yang, B.; Jinzhang, J. Heat transfer between surrounding rock and airflow through dry roadway in mine based on FLUENT. J. Liaoning Tech. Univ. (Nat. Sci.) 2015, 34, 1–4. [Google Scholar]
  8. Zhang, Y.; Guo, D.M.; Han, Q.Y. Research of the best combination of cooling parameters in high temperature work deep stope. Adv. Mater. Res. 2011, 255–260, 3832–3838. [Google Scholar] [CrossRef]
  9. Gaowei, Y.; Kailei, Y.; Minmin, L.; Dong, H.M. Air flow cooling with precooling air in deep mining roadway. Coal Technol. 2017, 36, 171–173. [Google Scholar]
  10. Zhang, R.; Wei, D.; Du, C.; Xu, H.; Chang, B.; Zhang, H. Study on the appropriate air volume for ventilation and cooling in horizontal roadway. MINING R.D. 2020, 40, 96–99. [Google Scholar]
  11. Weijun, L. Rational allocation of ventilation system and machine cooling. Mech. Manag. Dev. 2015, 30, 21–23. [Google Scholar] [CrossRef]
  12. Feng, X.-P.; Jia, Z.; Liang, H.; Wang, B.; Jiang, X.; Cao, H.; Sun, X. A full air cooling and heating system based on mine water source. Appl. Therm. Eng. 2018, 145, 610–617. [Google Scholar] [CrossRef]
  13. Zhang, Y.; Huang, P. Influence of mine shallow roadway on airflow temperature. Arab. J. Geosci. 2020, 13, 12. [Google Scholar] [CrossRef]
  14. Zhu, S.; Cheng, J.; Song, W.; Borowski, M.; Zhang, Y.; Yu, B.; Wang, Y.; Qi, C.; Tukkaraja, P.; Hua, G.; et al. Using seasonal temperature difference in underground surrounding rocks to cooling ventilation airflow: A conceptual model and simulation study. Energy Sci. Eng. 2020, 8, 3457–3475. [Google Scholar] [CrossRef] [Green Version]
  15. Ruichong, Z.; Chengyu, X.; Keping, Z. Study on applicable conditions of high temperature deep well ventilation cooling technology. Gold Sci. Technol. 2019, 27, 888–895. [Google Scholar]
  16. Miwu, C. Treatment Technology for Heat Damage in Deep Mine. Saf. Coal Mines 2017, 48, 131–134. [Google Scholar]
  17. Chen, W.; Liang, S.; Liu, J. Proposed split-type vapor compression refrigerator for heat hazard control in deep mines. Appl. Therm. Eng. 2016, 105, 425–435. [Google Scholar] [CrossRef]
  18. Jing, L.; Shanshan, Z. Determination of a Certain Coal Mining Working Face Wind Cooling Way. Zhongzhou Coal 2016, 30, 32–59. [Google Scholar]
  19. Yuan, Y.; Zhou, X.; Zhang, X. Numerical and experimental study on the characteristics of radiant ceiling systems. Build. Res. Inf. 2019, 47, 912–927. [Google Scholar] [CrossRef]
  20. Krajčík, M.; Tomasi, R.; Simone, A.; Olesen, B.W. Thermal comfort and ventilation effectiveness in an office room with radiant floor cooling and displacement ventilation. Sci. Technol. Built Environ. 2016, 22, 317–327. [Google Scholar] [CrossRef] [Green Version]
  21. Cheng, S.; Chen, Z. Study on indoor comfort of floor radiant cooling and displacement ventilation system in large space. IOP Conf. Ser. Earth Environ. Sci. 2019, 238, 012078. [Google Scholar] [CrossRef] [Green Version]
  22. Li, N.; Chen, Q. Study on dynamic thermal performance and optimization of hybrid systems with capillary mat cooling and displacement ventilation. Int. J. Refrig. 2020, 110, 196–207. [Google Scholar] [CrossRef]
  23. Yang, Y.; Wang, Y.; Yuan, X.; Zhu, Y.; Zhang, D. Simulation study on the thermal environment in an office with radiant cooling and displacement ventilation system. Procedia Eng. 2017, 205, 3146–3153. [Google Scholar] [CrossRef]
  24. Liu, J.; Dalgo, D.A.; Zhu, S.; Li, H.; Zhang, L.; Srebric, J. Performance analysis of a ductless personalized ventilation combined with radiant floor cooling system and displacement ventilation. Build. Simul. 2019, 12, 905–919. [Google Scholar] [CrossRef]
  25. Jiangong, L.; Xinwang, L.; Tuan, H. Application status and prospect of backfill mining in Chinese coal mines. J. China Soc. 2020, 45, 141–150. [Google Scholar]
  26. Peng, H. Present situation and development direction of coal mine filling mining technology in China. Inn. Mong. Coal Econ. 2019, 177, 73–76. [Google Scholar]
  27. State Administration of Work Safety. Coal Mine Safety Rules; China Coal Industry Press: Beijing, China, 2011.
  28. Zhang, R.-Y. Study of Radiant Floor Cooling and Heating System with Double Layer Phase Change Energy Storage and The thermal Performance. Master’s Thesis, Southeast University, Nanjing, China, 2015. [Google Scholar]
  29. Lu, N. Study on Thermodynamic Parameters and Cooling Effect of Cold Wall Cooling System. Master’s Thesis, China University of Mining and Technology, Xuzhou, China, 2019. [Google Scholar]
  30. Domestic—National Standard—State Administration for Market Regulation CN-GB. Code for Design of Prevention and Elimination of Thermal Disaster in Coal Mines. 2017. Available online: https://xueshu.baidu.com/usercenter/paper/show?paperid=1g6e0p30c0400j60qx7x08g0cj274539&site=xueshu_se (accessed on 3 March 2021).
Figure 1. Schematic diagram of radiation cooling in the coal mining face.
Energies 14 04428 g001
Figure 2. Geometric model of the working face.
Energies 14 04428 g002
Figure 3. Distribution of measuring points.
Energies 14 04428 g003
Figure 4. Independent analysis.
Energies 14 04428 g004
Figure 5. Comparison of simulation and literature results.
Energies 14 04428 g005
Figure 6. Airflow temperature distribution in different sections of the working face before cooling.
Energies 14 04428 g006
Figure 7. Airflow temperature distribution in different sections of the working face after cooling.
Energies 14 04428 g007aEnergies 14 04428 g007b
Figure 8. Temperature variation of measuring points before and after cooling.
Energies 14 04428 g008aEnergies 14 04428 g008b
Figure 9. Variation of airflow temperature at measuring point 3 under different air supply temperatures.
Energies 14 04428 g009
Figure 10. Variation of airflow temperature at measuring point 3 under different air supply velocities.
Energies 14 04428 g010
Figure 11. Variation of the airflow temperature at measurement point 3 under different surrounding wall temperatures.
Energies 14 04428 g011
Figure 12. Temperature changes of each measuring point along the working face before and after cooling under the most unfavorable conditions.
Energies 14 04428 g012
Table 1. Airflow temperature along the working face.
Z/m50100150200250300
Airflow Temperature/°Cbefore cooling24.4126.1927.7129.1130.4231.62
after cooling23.7425.0426.6127.2028.1829.09
Table 2. Temperature of measuring points.
Measuring PointTemperature/°C
Before CoolingAfter Cooling
90 s180 s90 s180 s
122.0622.0622.0522.05
222.4722.4722.4122.40
324.25524.2523.5623.56
426.1726.2424.6724.69
527.0227.8325.2525.60
627.1129.2325.3226.45
7 32.20 23.13
8 30.92 24.79
9 30.00 25.75
10 28.68 27.02
11 28.48 27.60
12 28.68 28.26
13 29.23 29.04
14 29.34 26.60
15 29.67 27.03
16 30.35 27.92
17 31.79 29.70
Table 3. Temperature of measuring point 3 under different air supply temperatures.
Air Supply Temperatures/°C1820222426
Airflow Temperature/°CBefore cooling26.4927.8629.2330.6031.97
After cooling23.7025.0726.4427.8129.18
Table 4. Temperature of measuring point 3 under different air supply velocities.
Air supply Velocities/(m/s)1.52.02.53.03.5
Airflow Temperature/°CBefore cooling29.7629.4529.1929.0028.65
After cooling26.8326.6126.4426.3226.15
Table 5. Temperature of measuring point 3 under different surrounding wall temperatures.
Surrounding Wall Temperatures/°C3540455055
Airflow Temperature/°CBefore cooling90 s24.8926.0027.1128.2529.34
135 s26.0927.6629.2330.8032.37
After cooling90 s23.5624.4425.3226.1927.07
135 s24.0425.2426.4527.6628.86
Table 6. Temperature of measuring point 1-6 under most unfavorable conditions.
Measuring Point123456
Airflow Temperature/°CBefore cooling26.0926.7729.3831.9832.9834.06
After cooling26.0826.6428.1329.4430.5431.55
Publisher’s Note: MDPI stays neutral with regard to jurisdictional claims in published maps and institutional affiliations.

