
The Influence of Front Wing Pressure Distribution on Wheel Wake Aerodynamics of a F1 Car


Abstract
:1. Introduction
2. Methodology
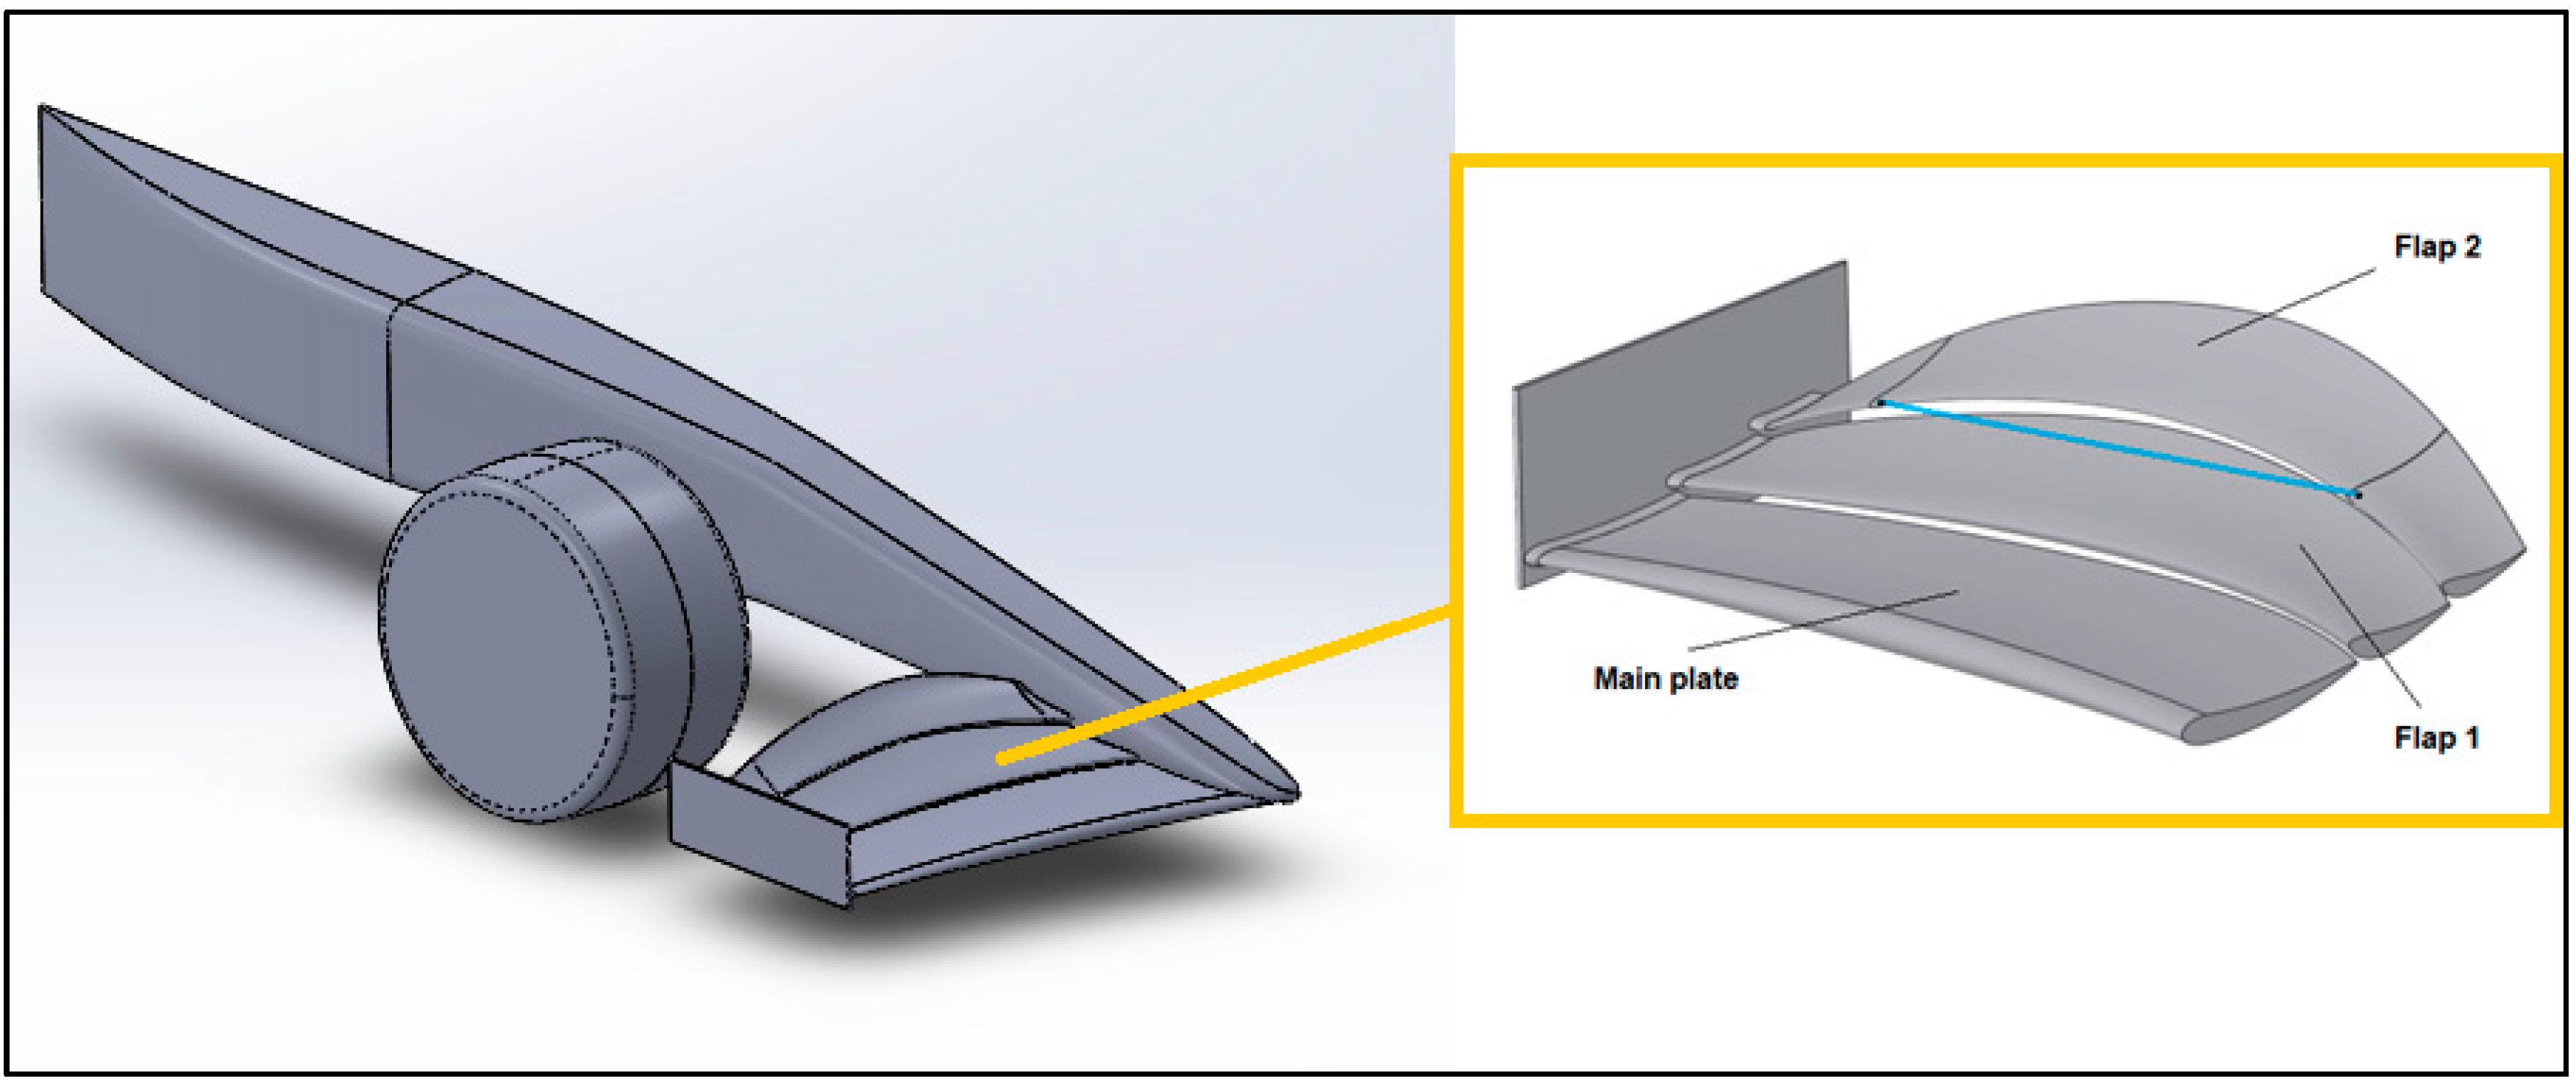
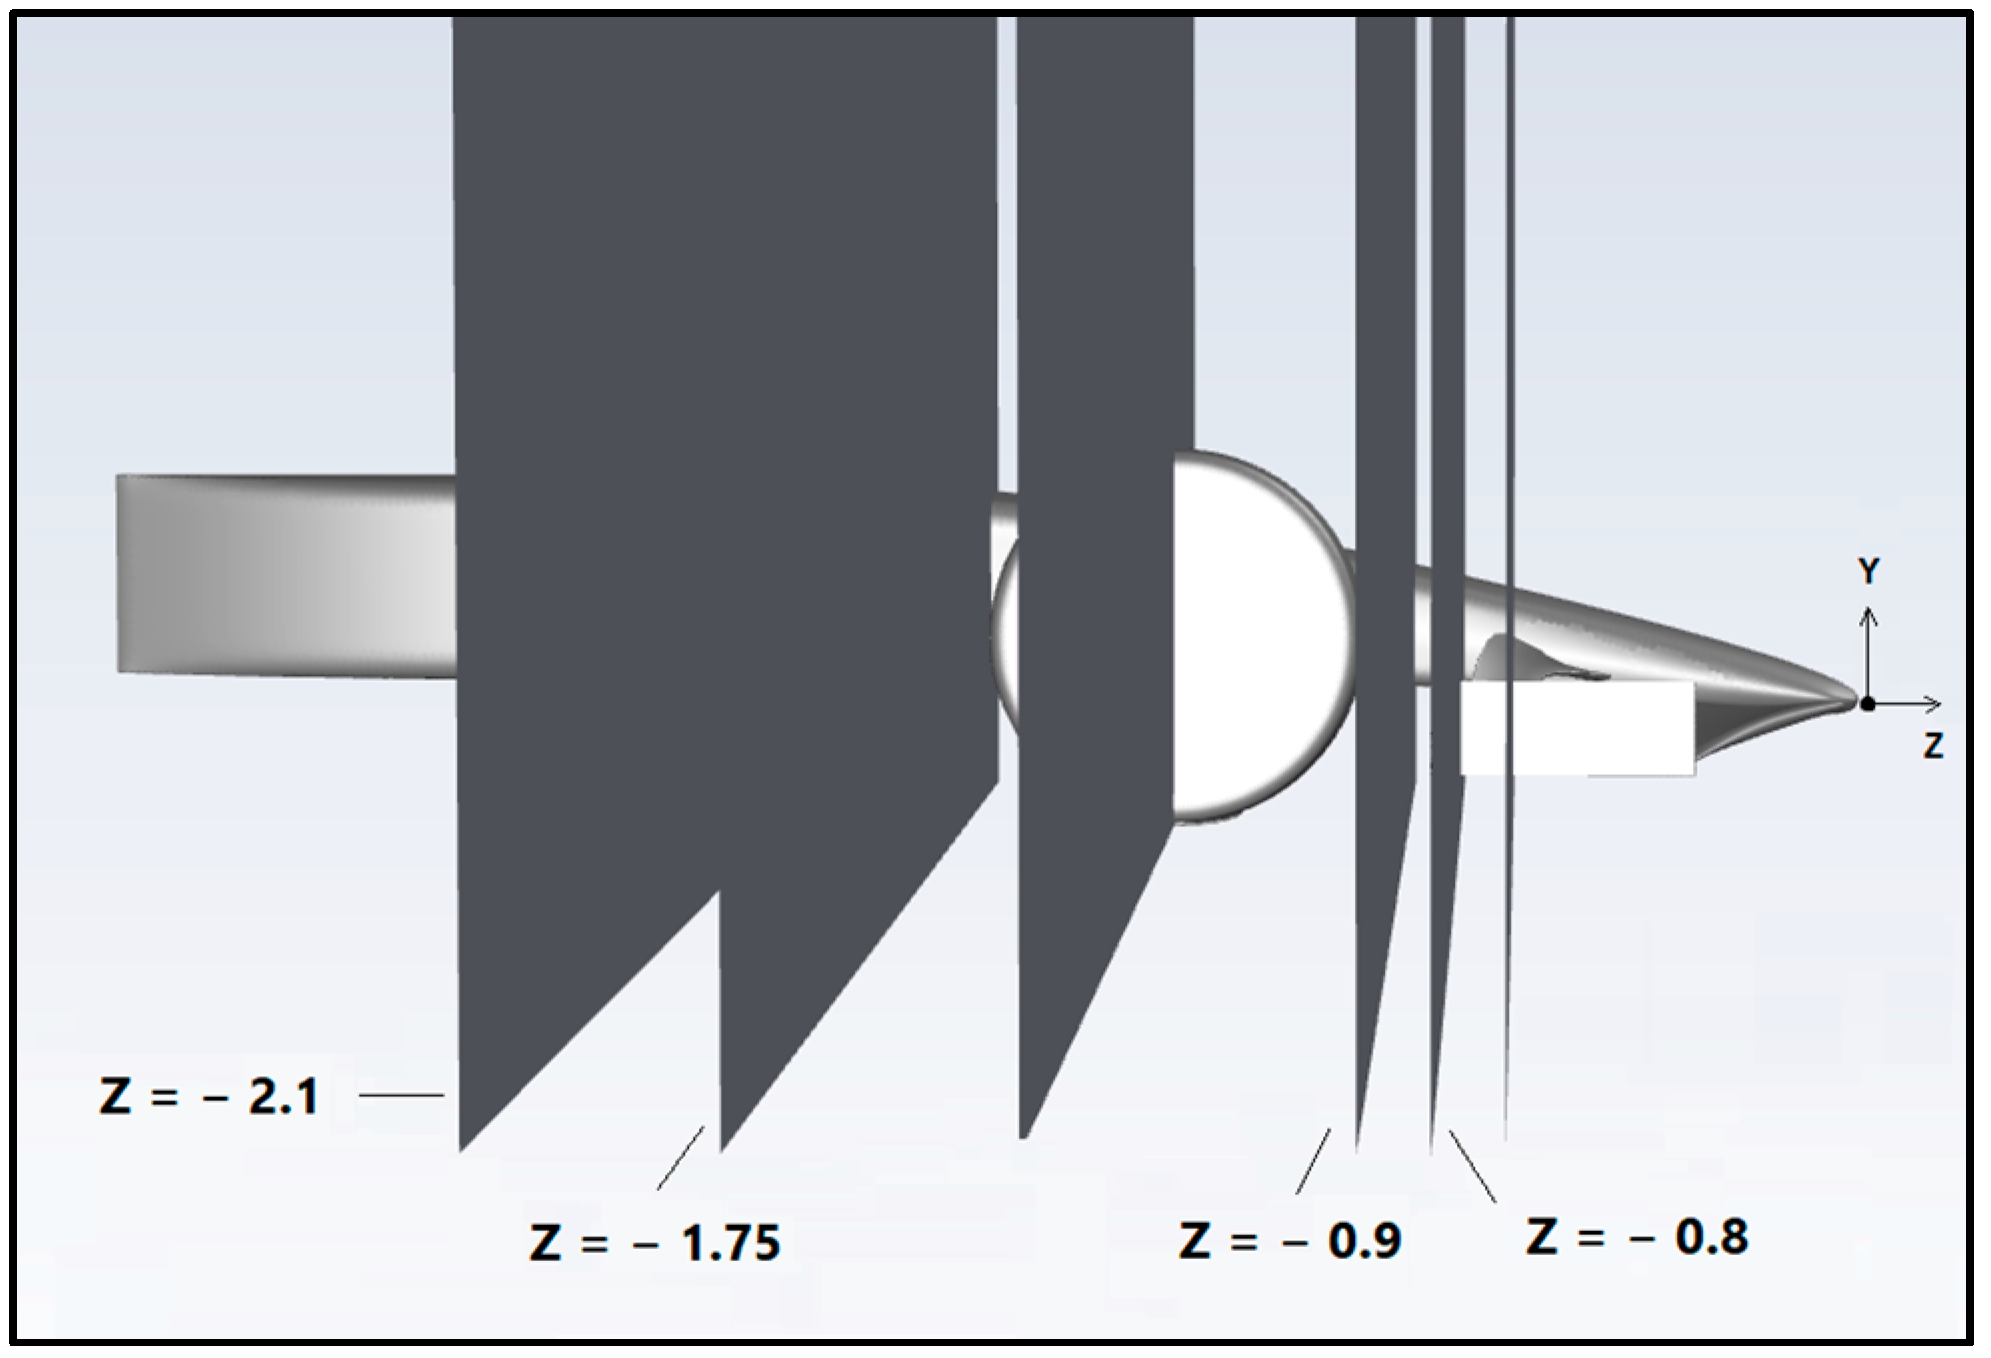
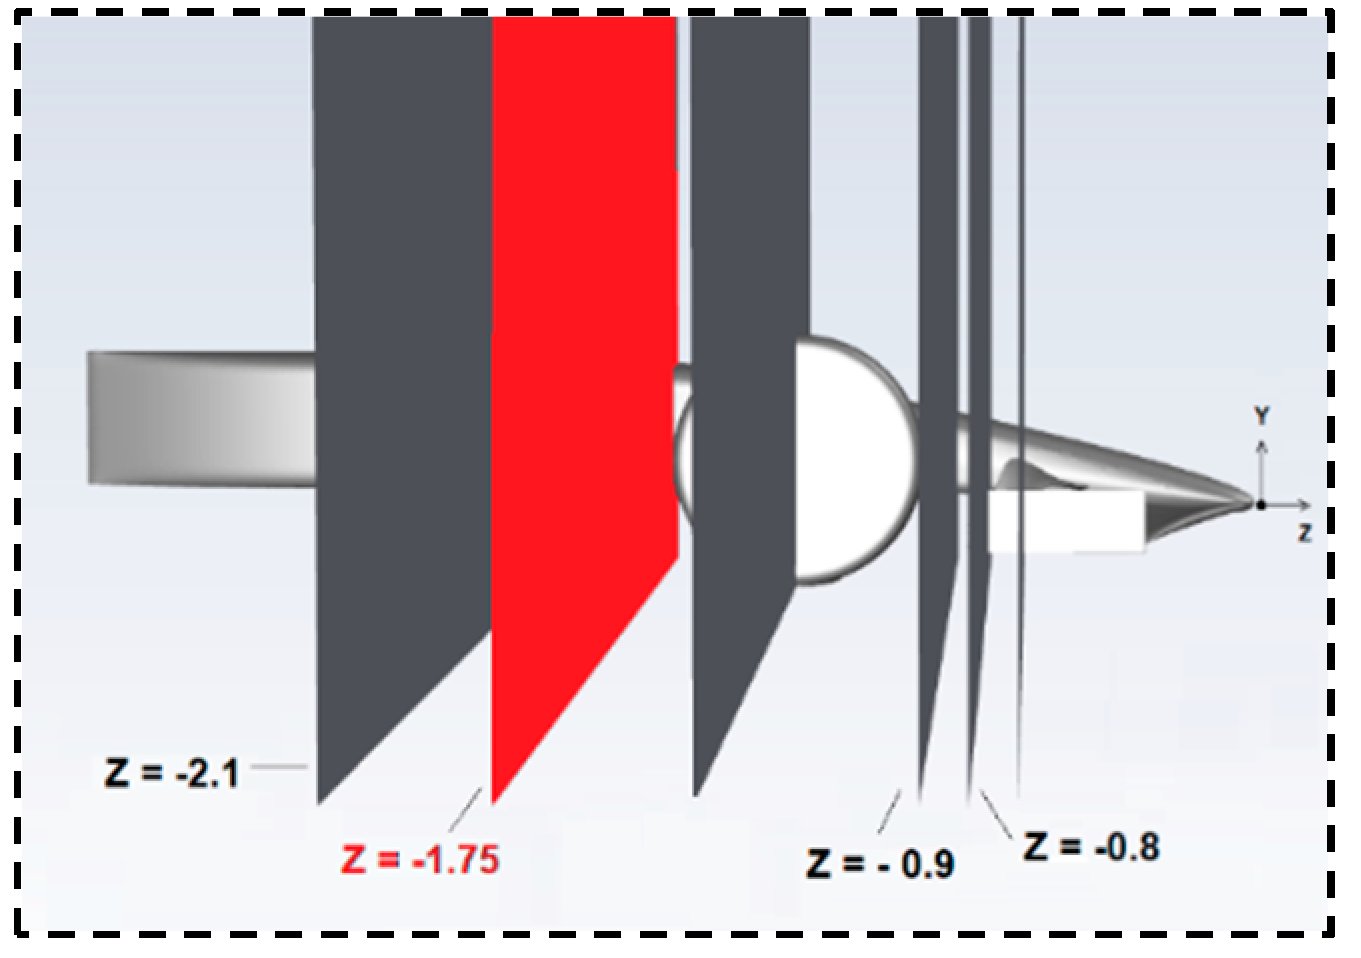
2.1. Geometry
2.2. Governing Equations
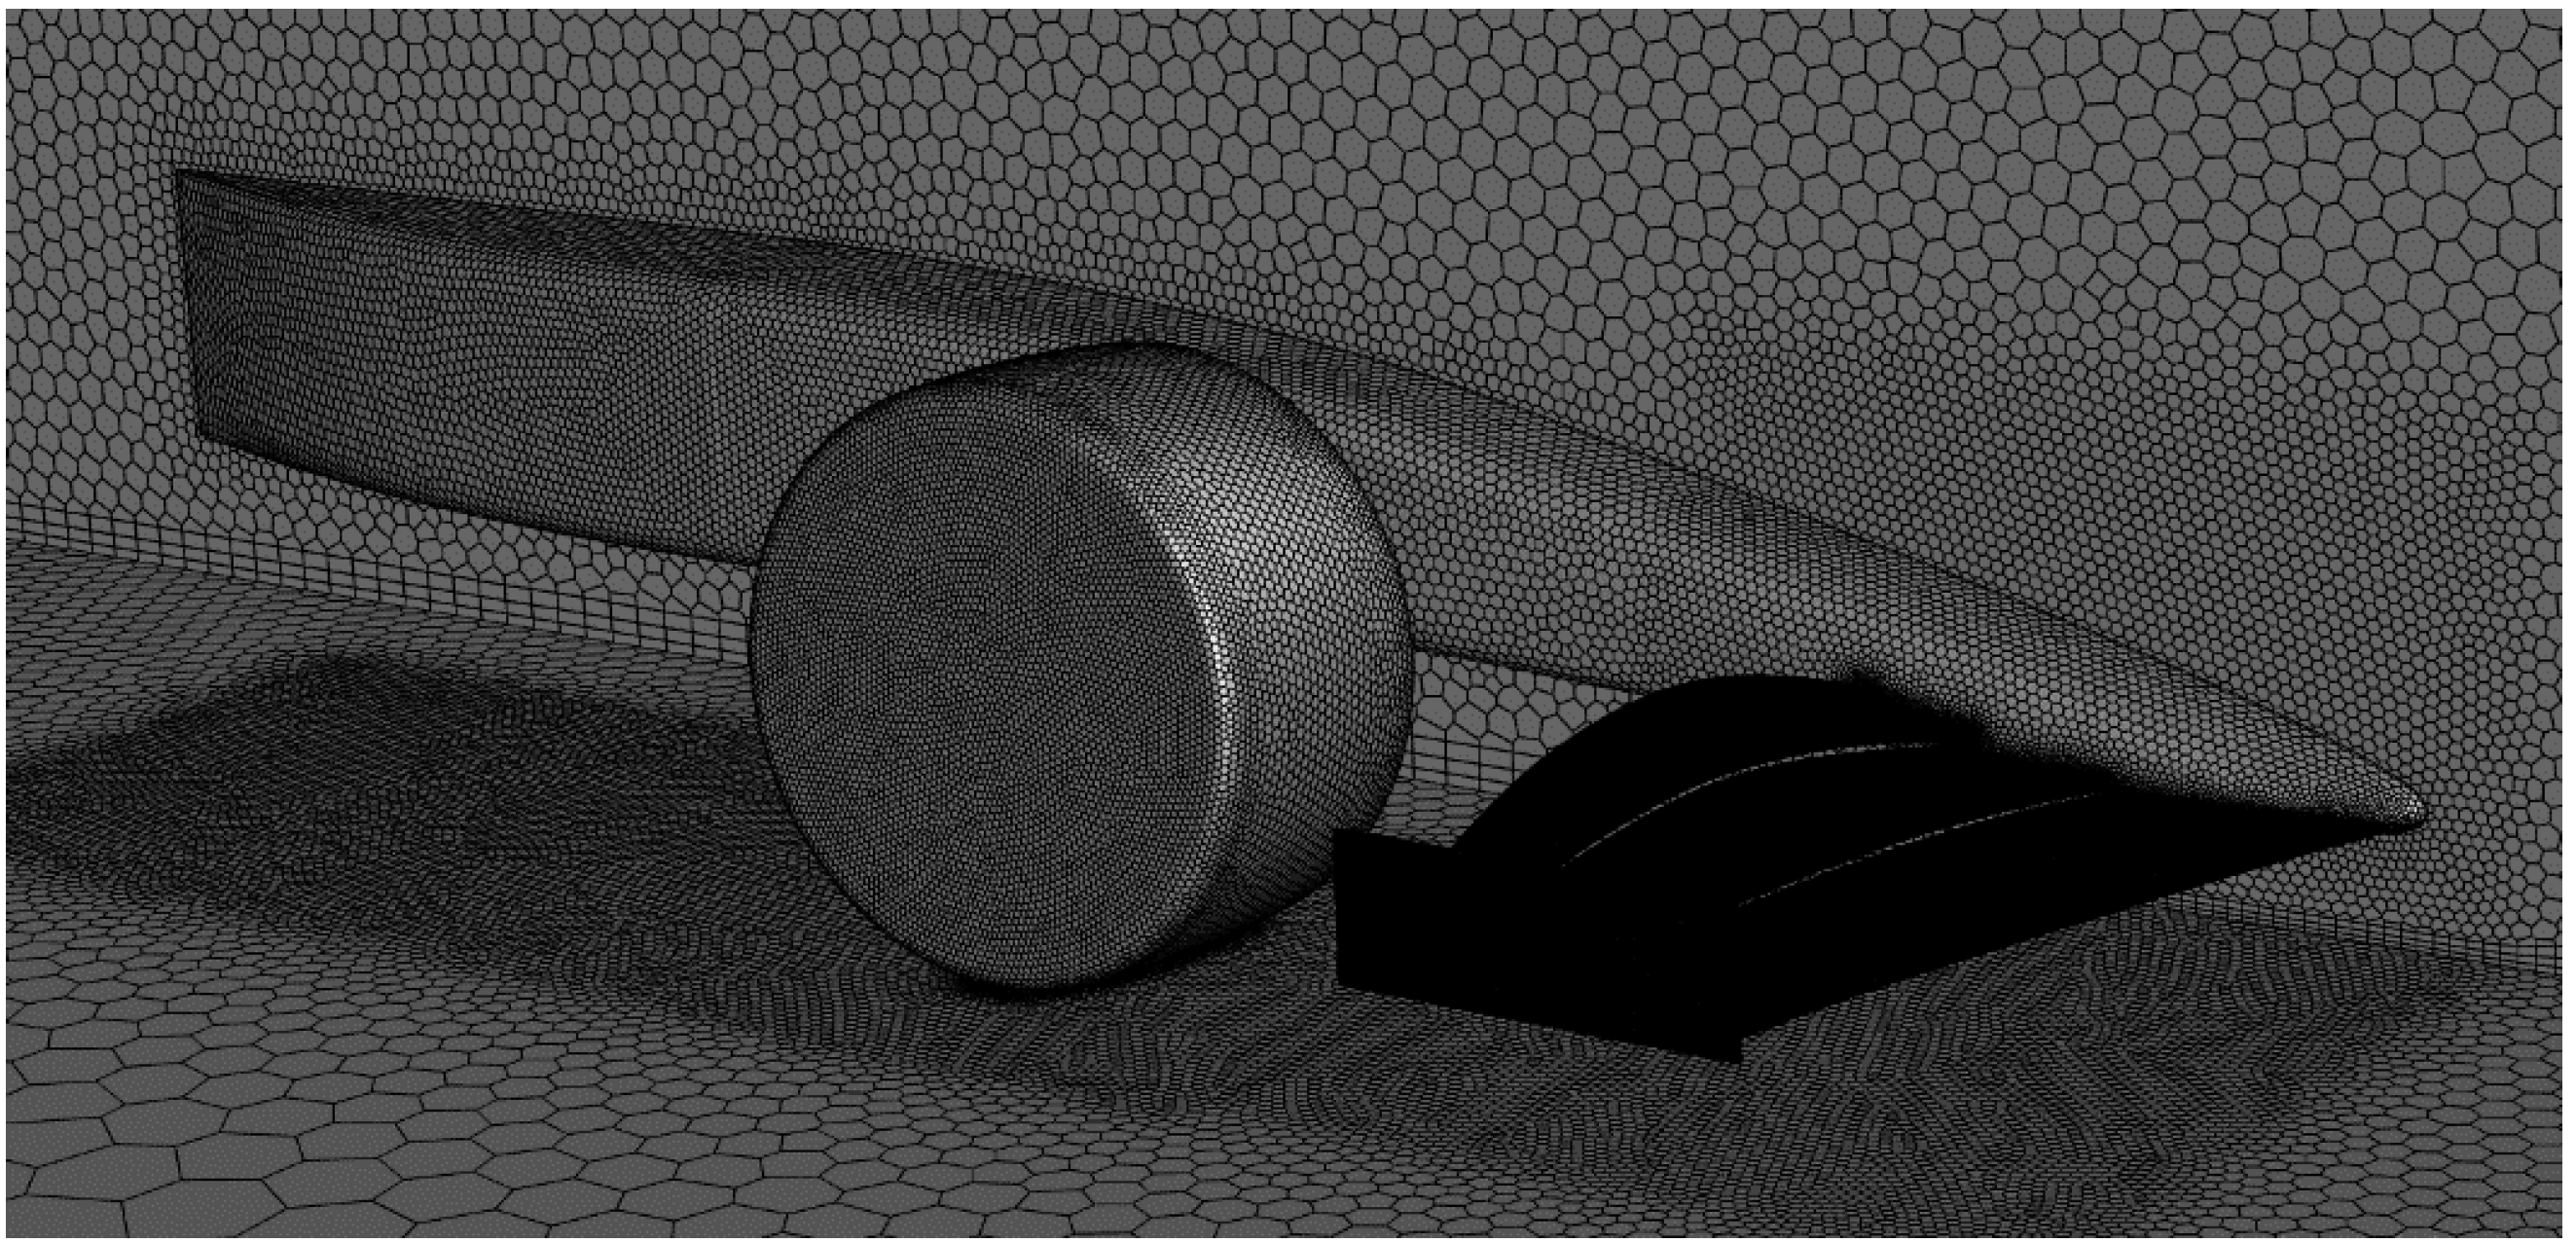
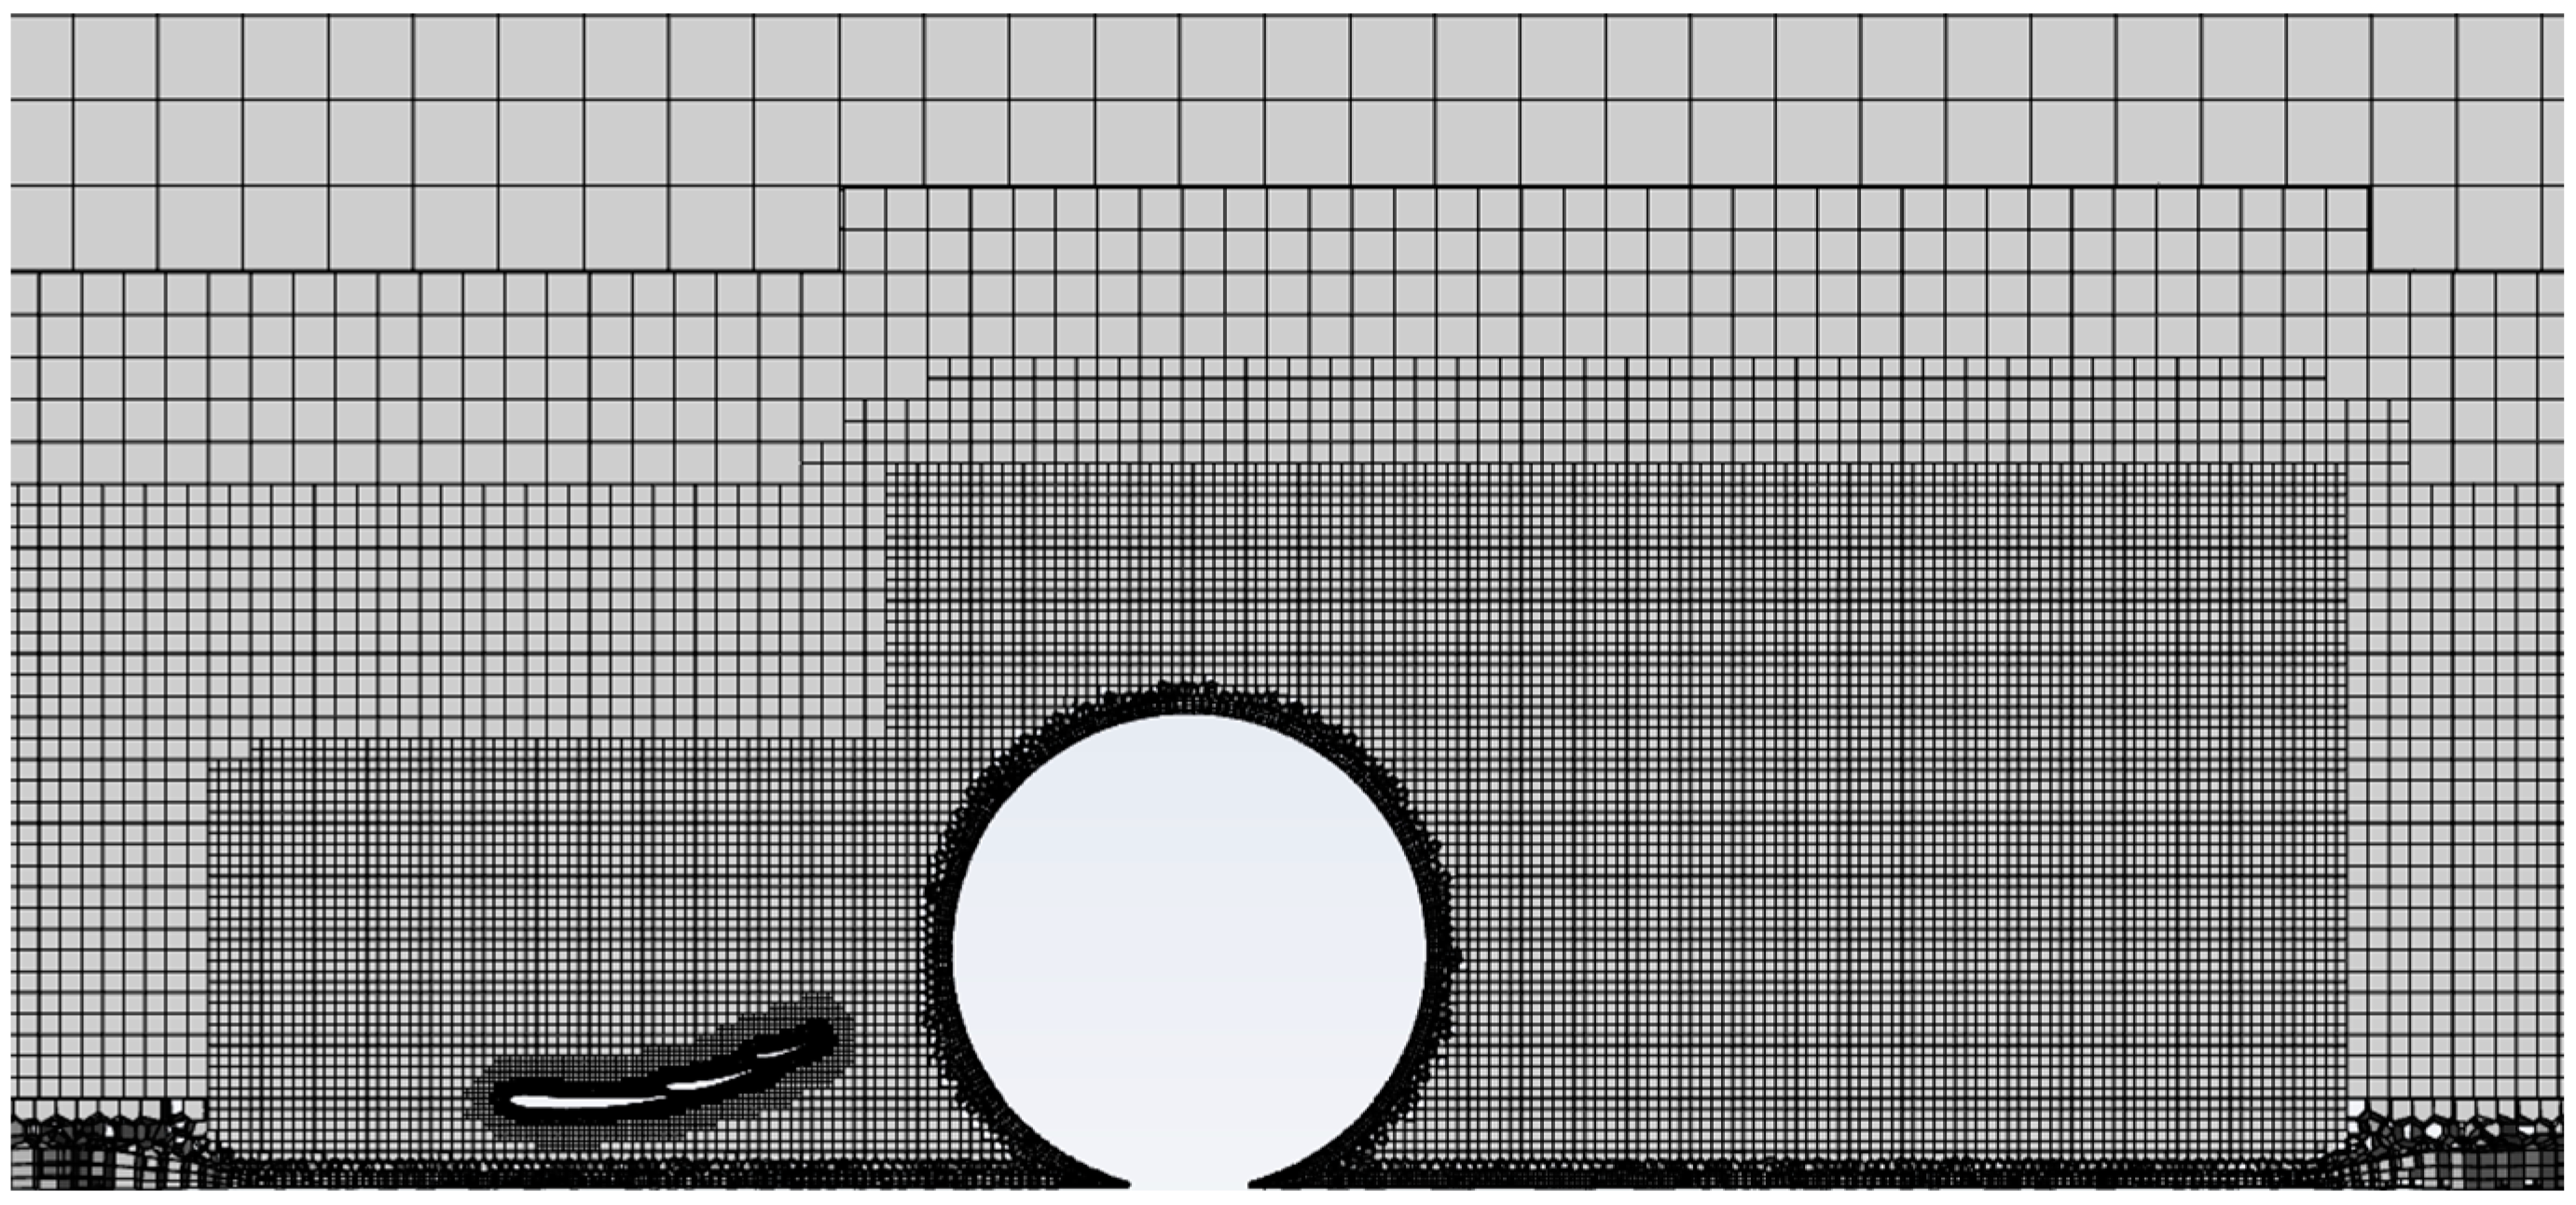
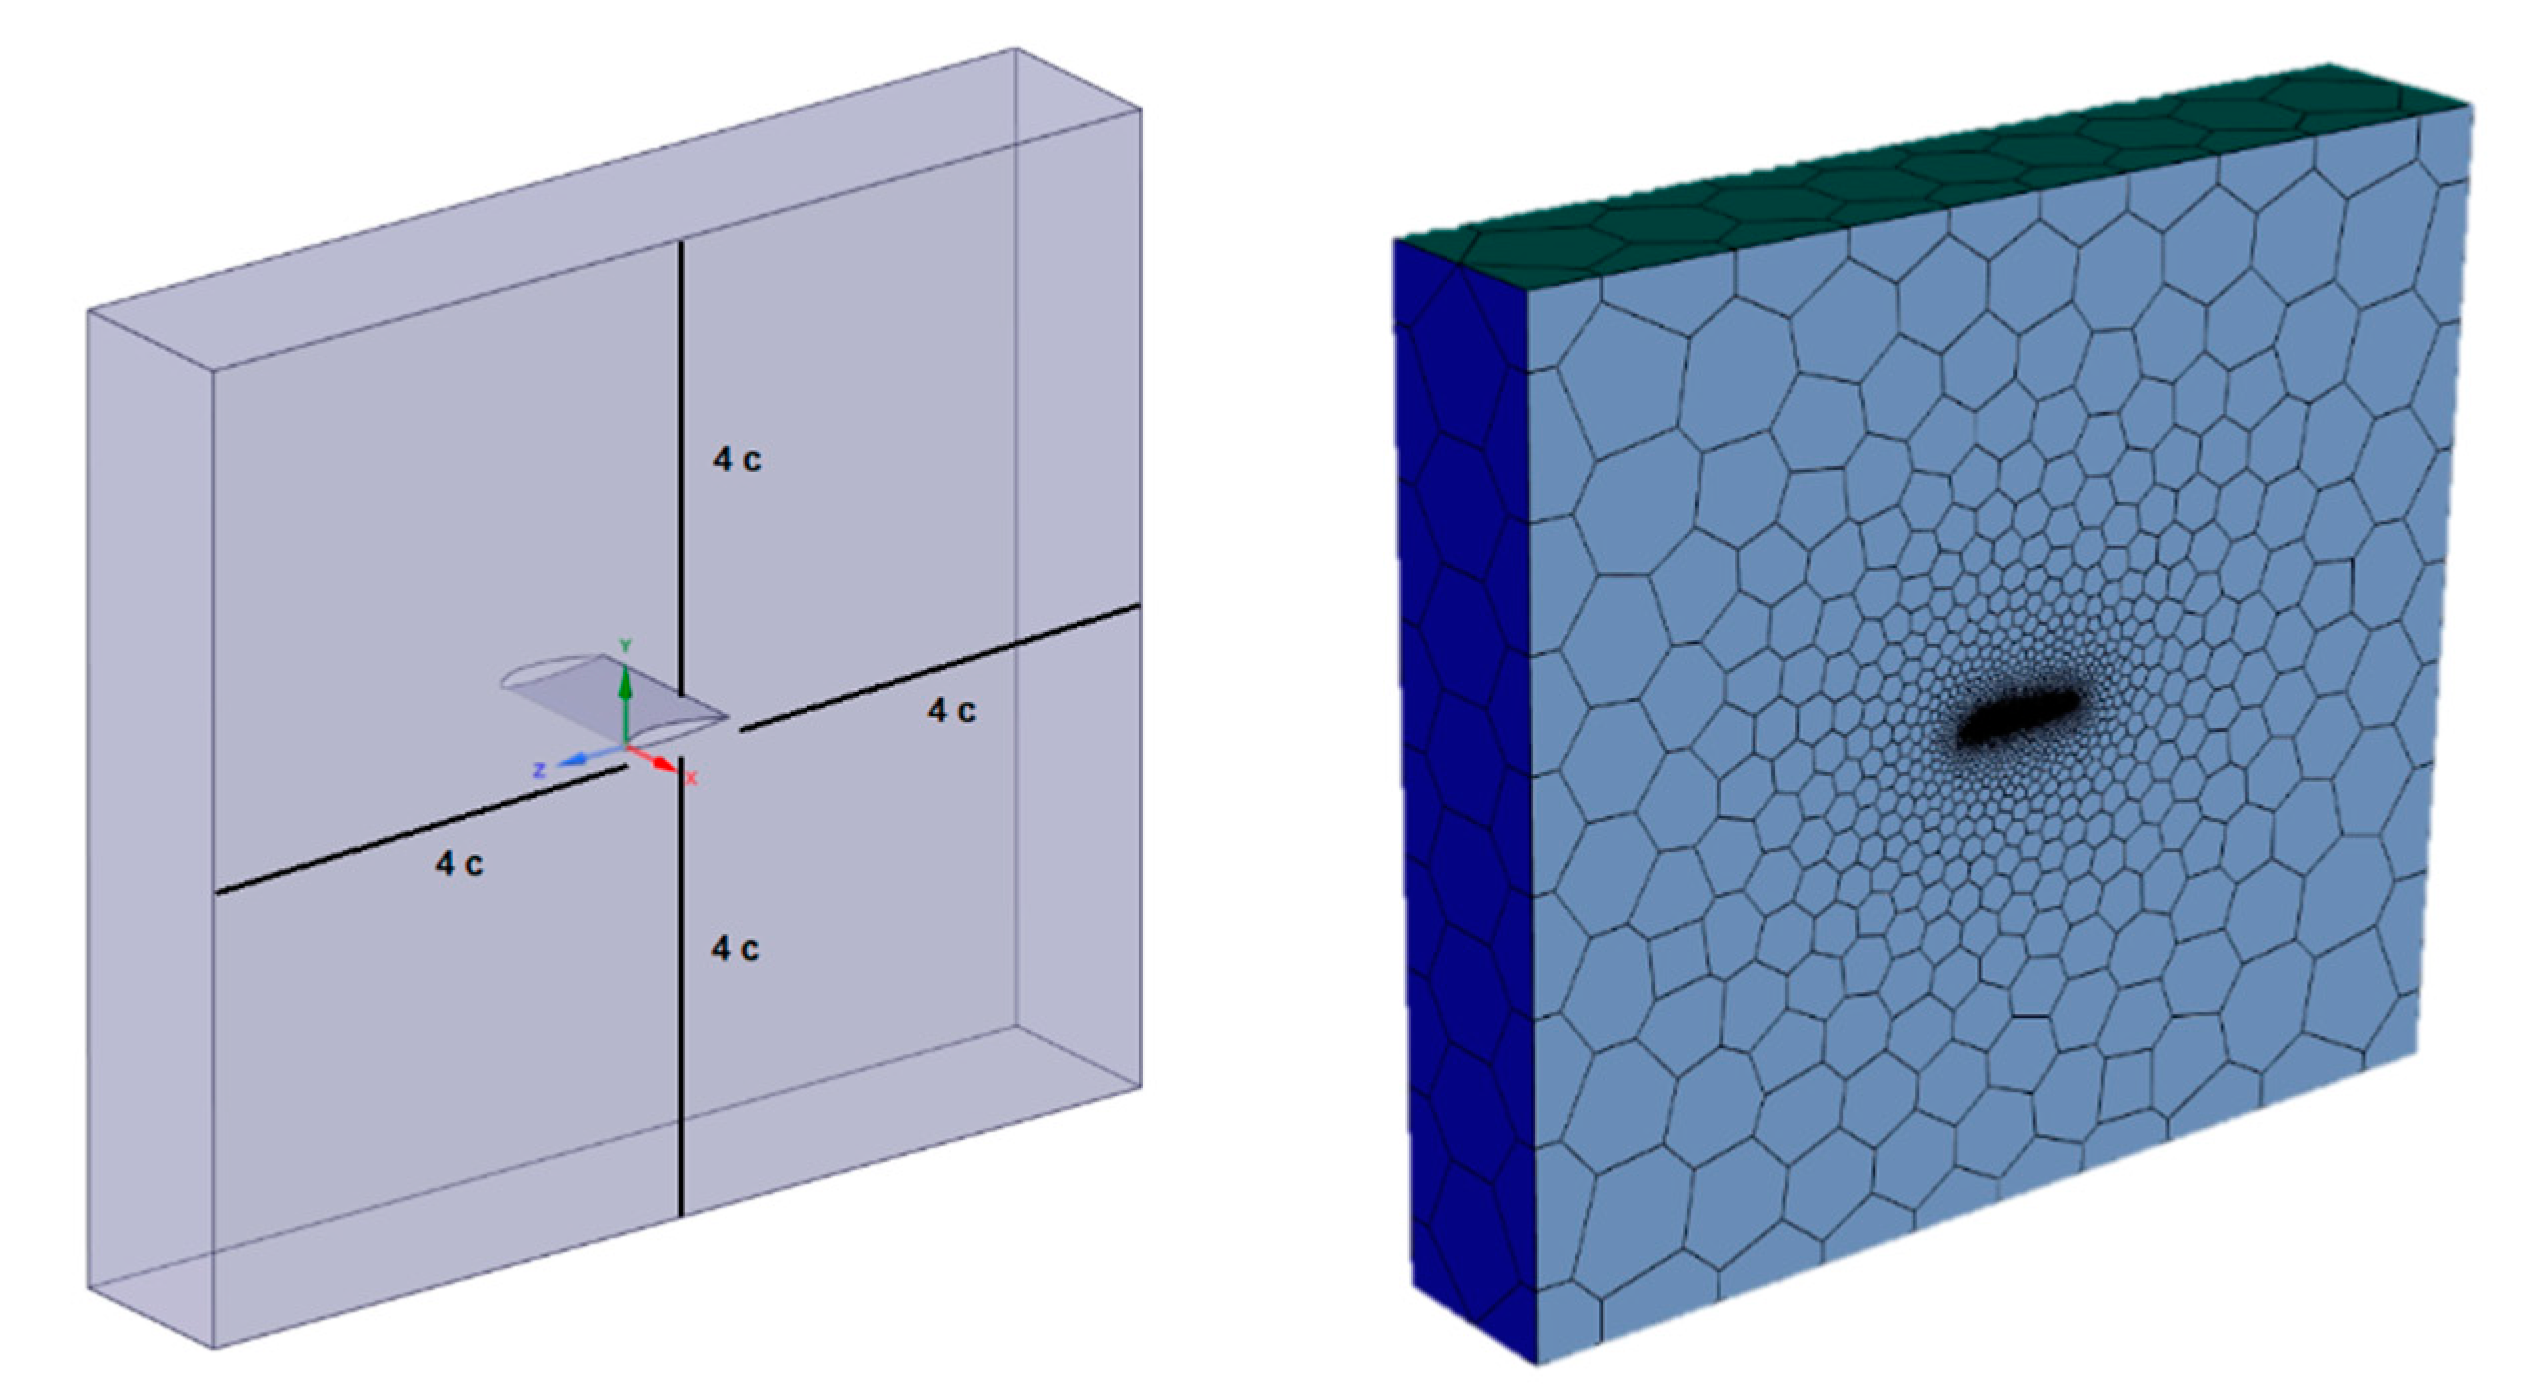
2.3. CFD Model
3. Results
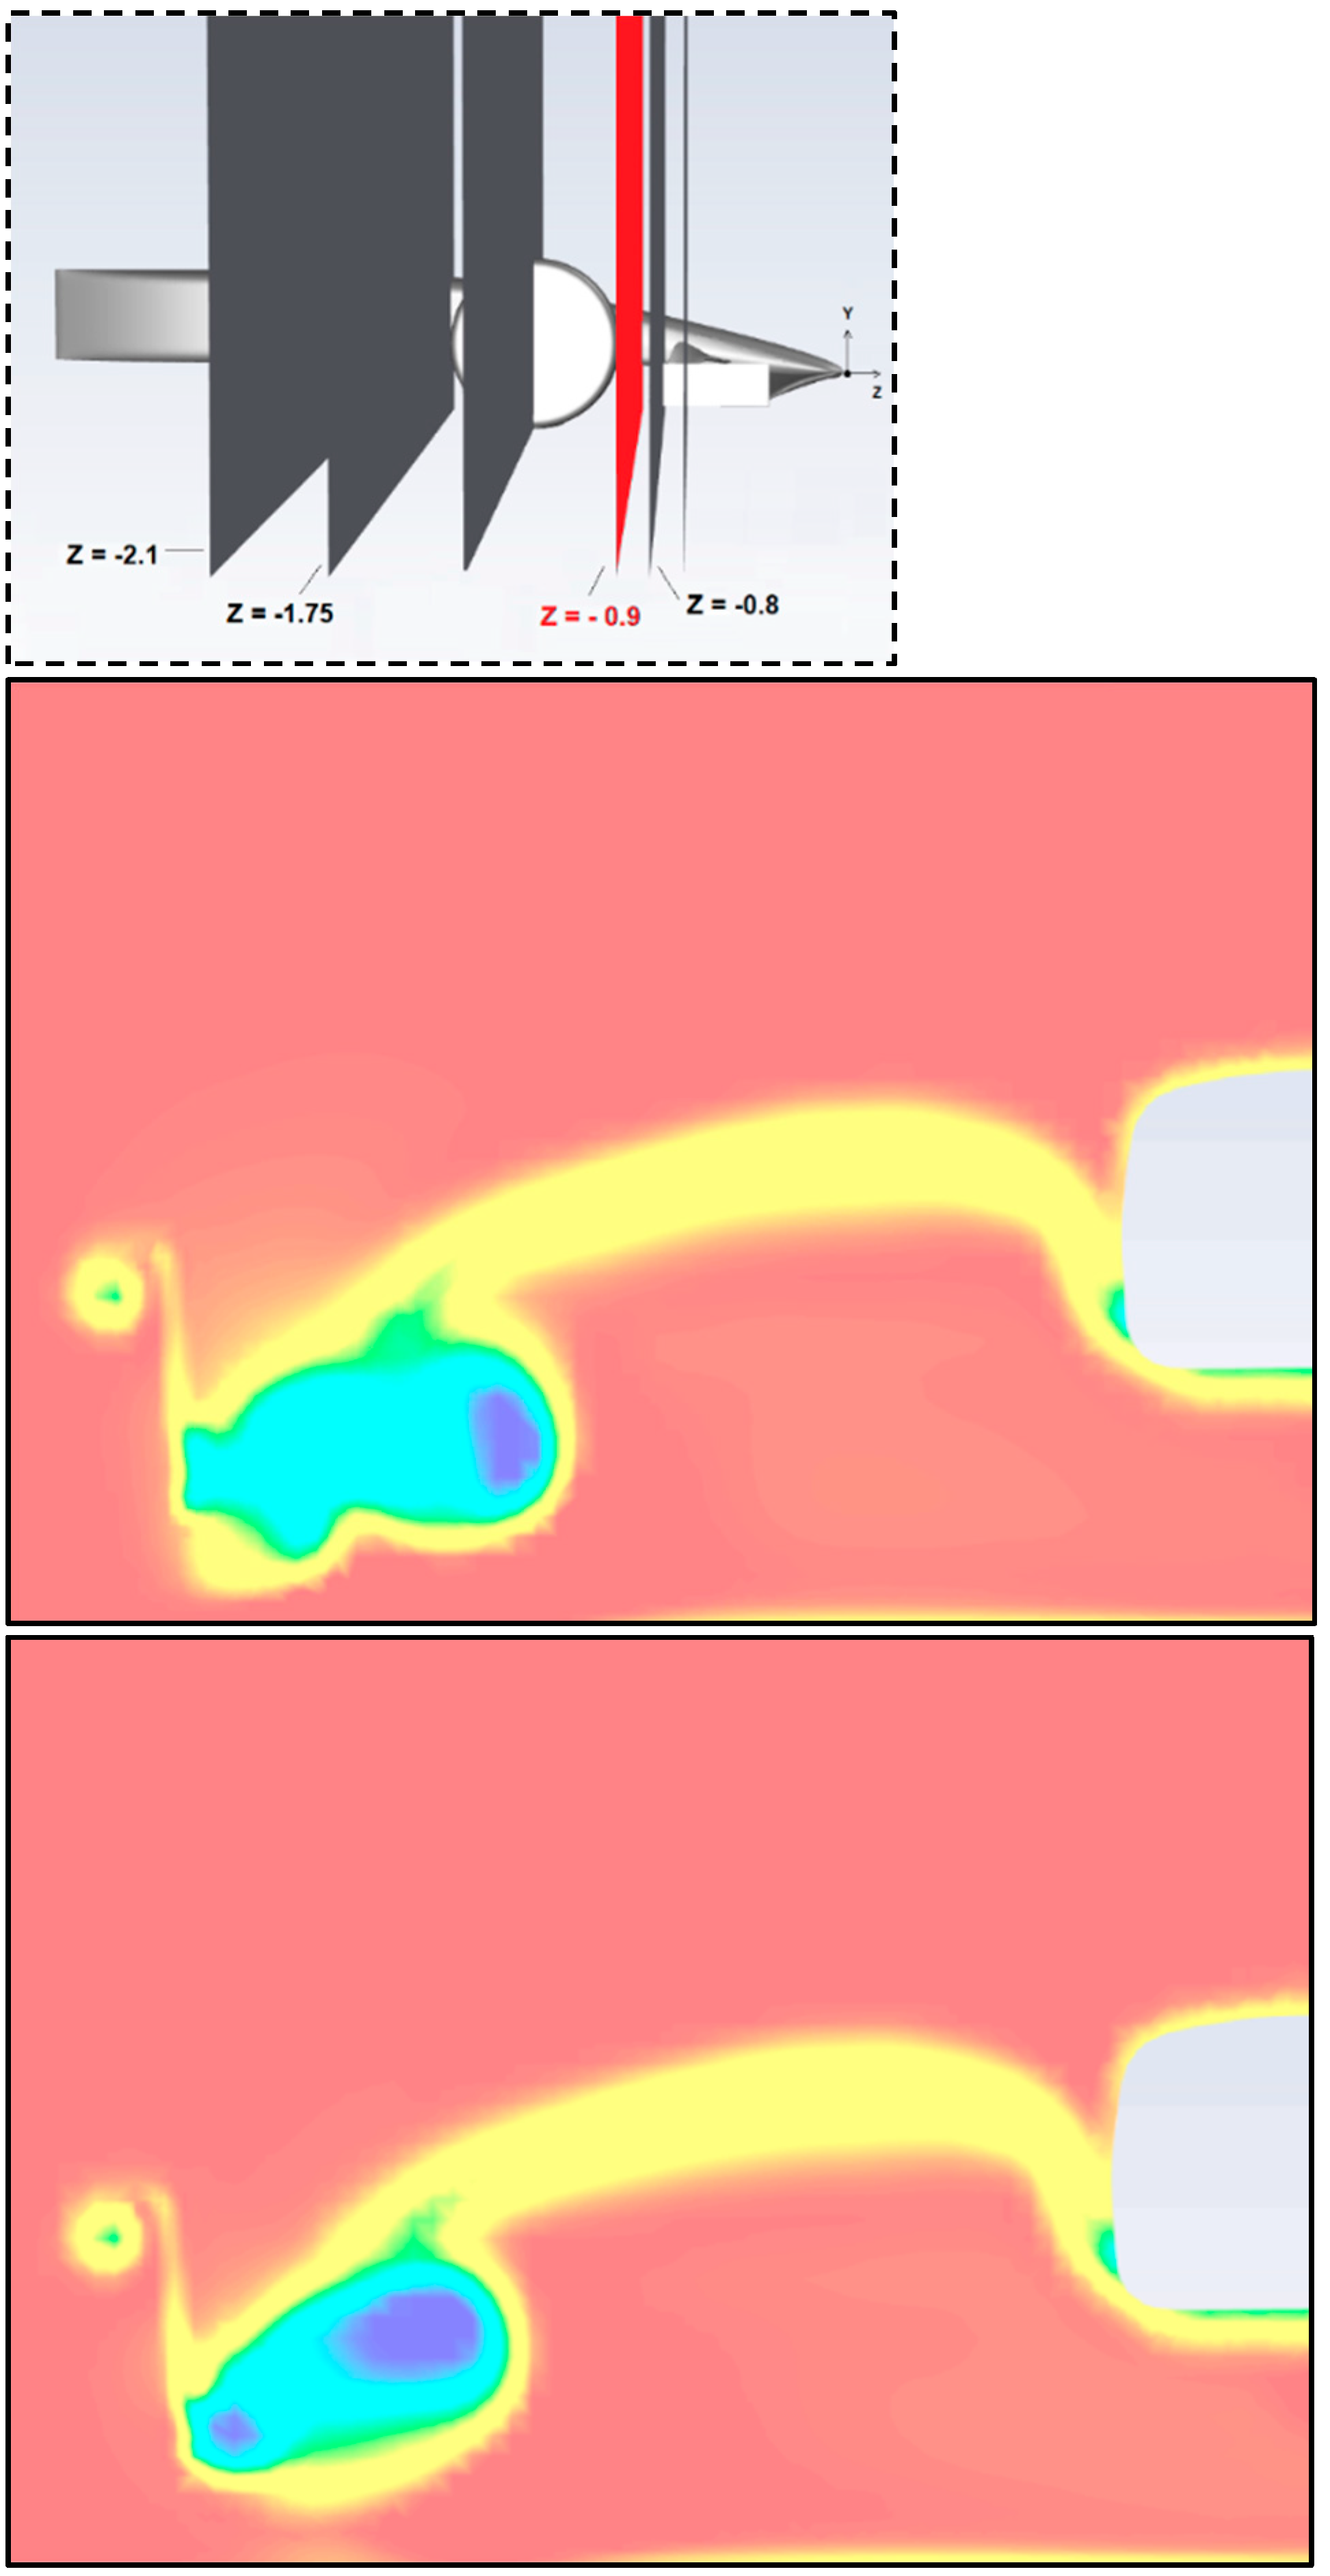
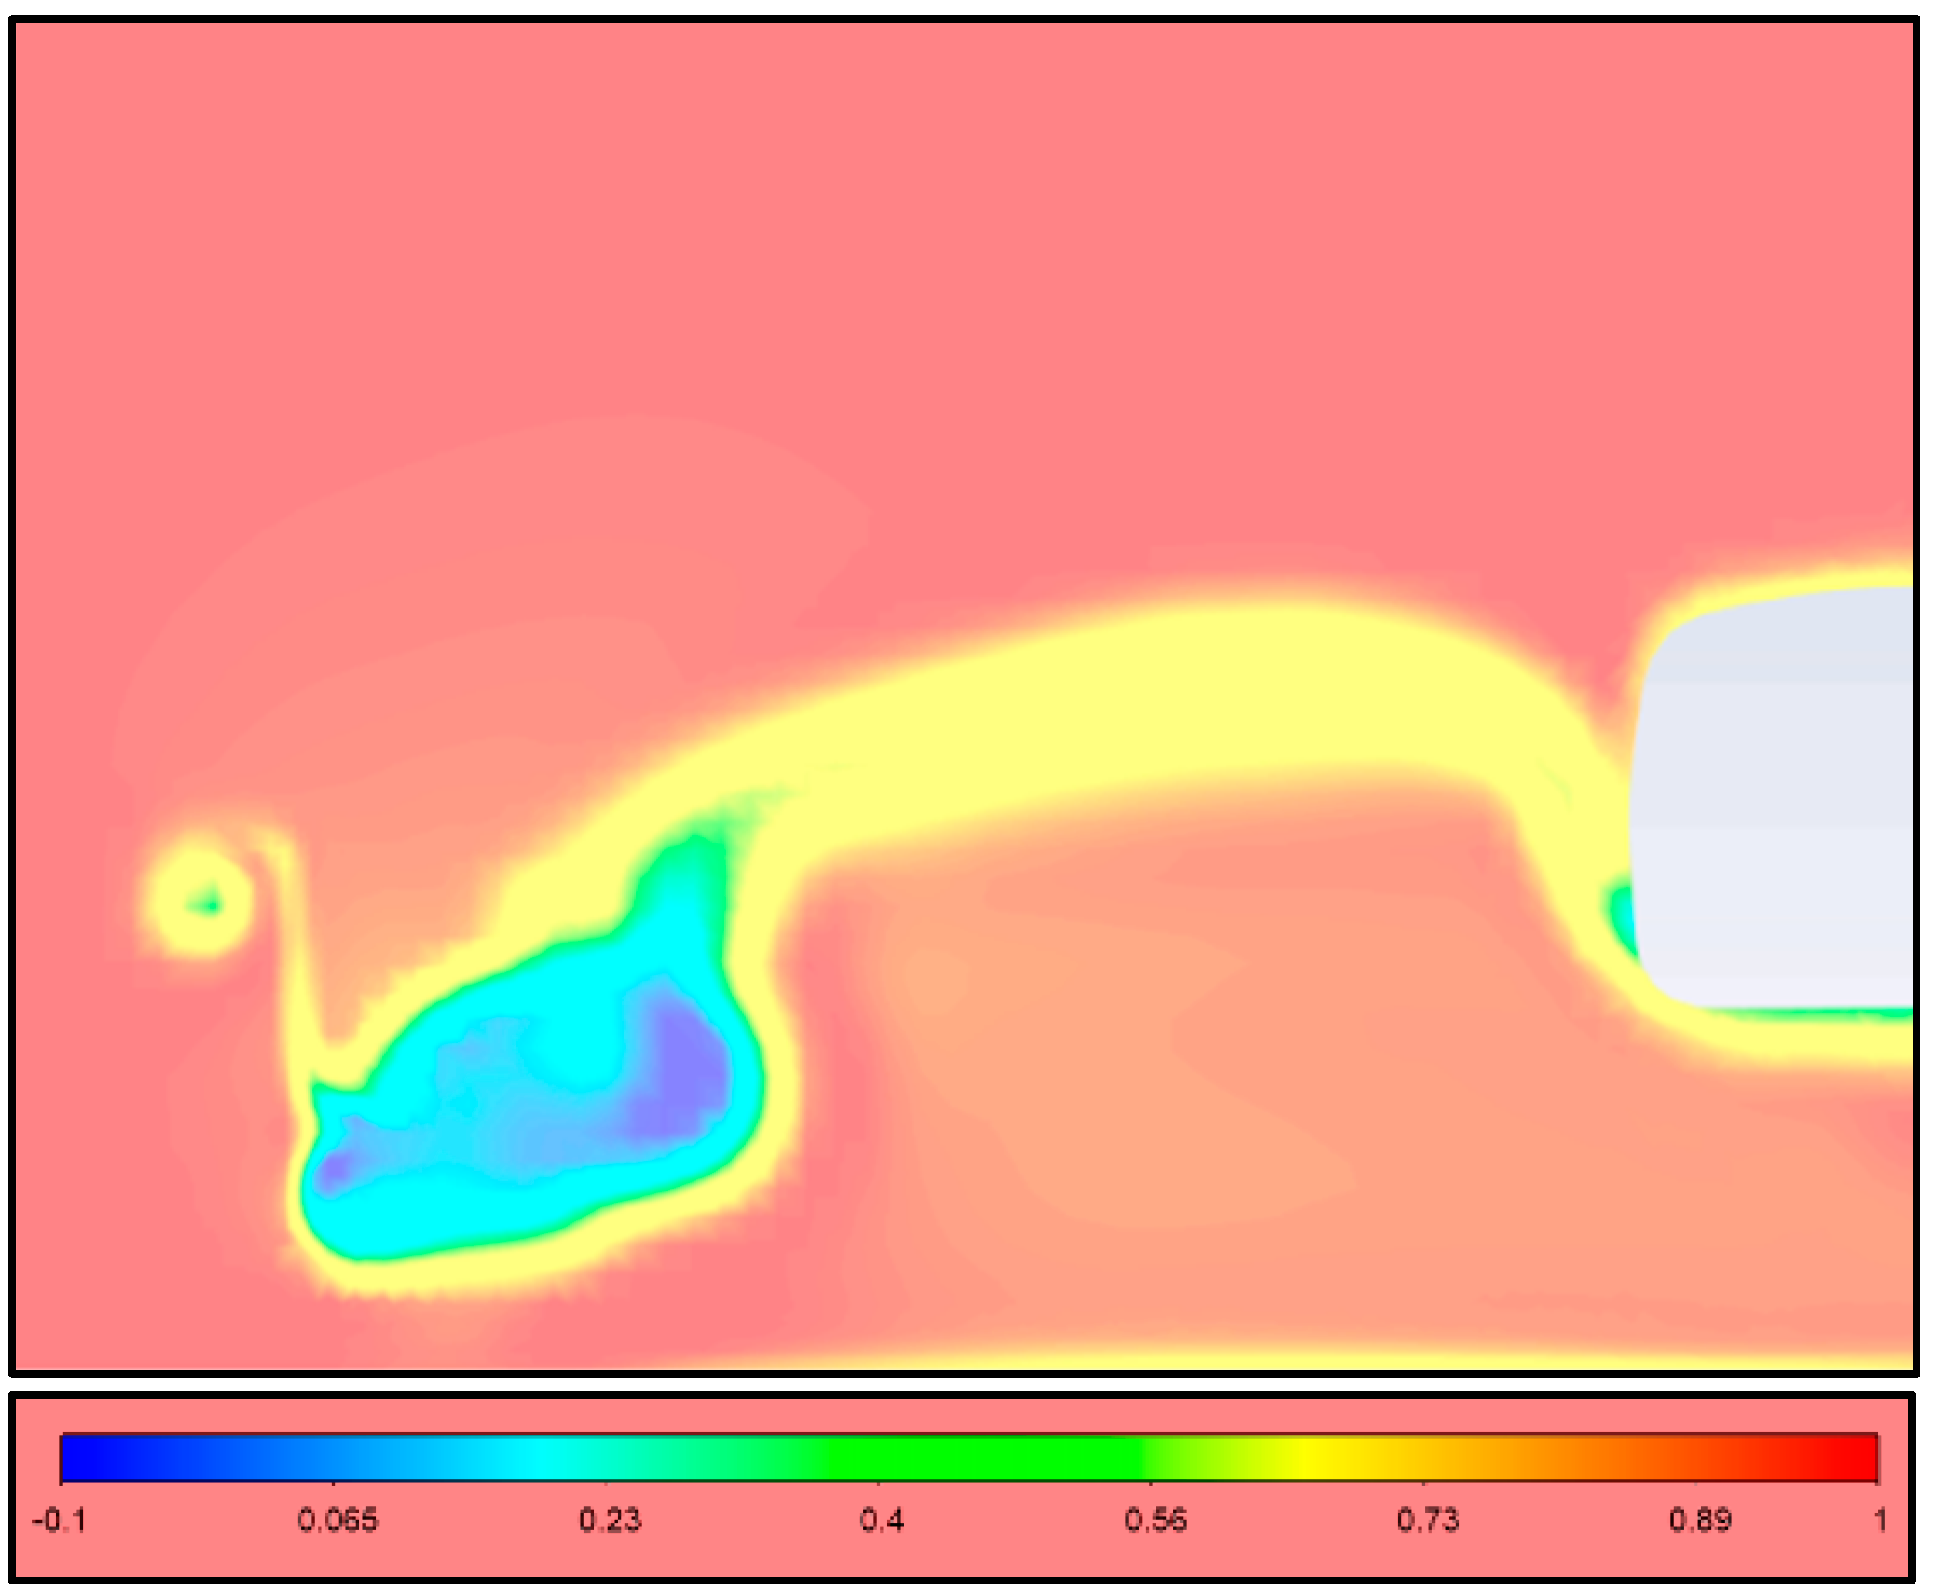
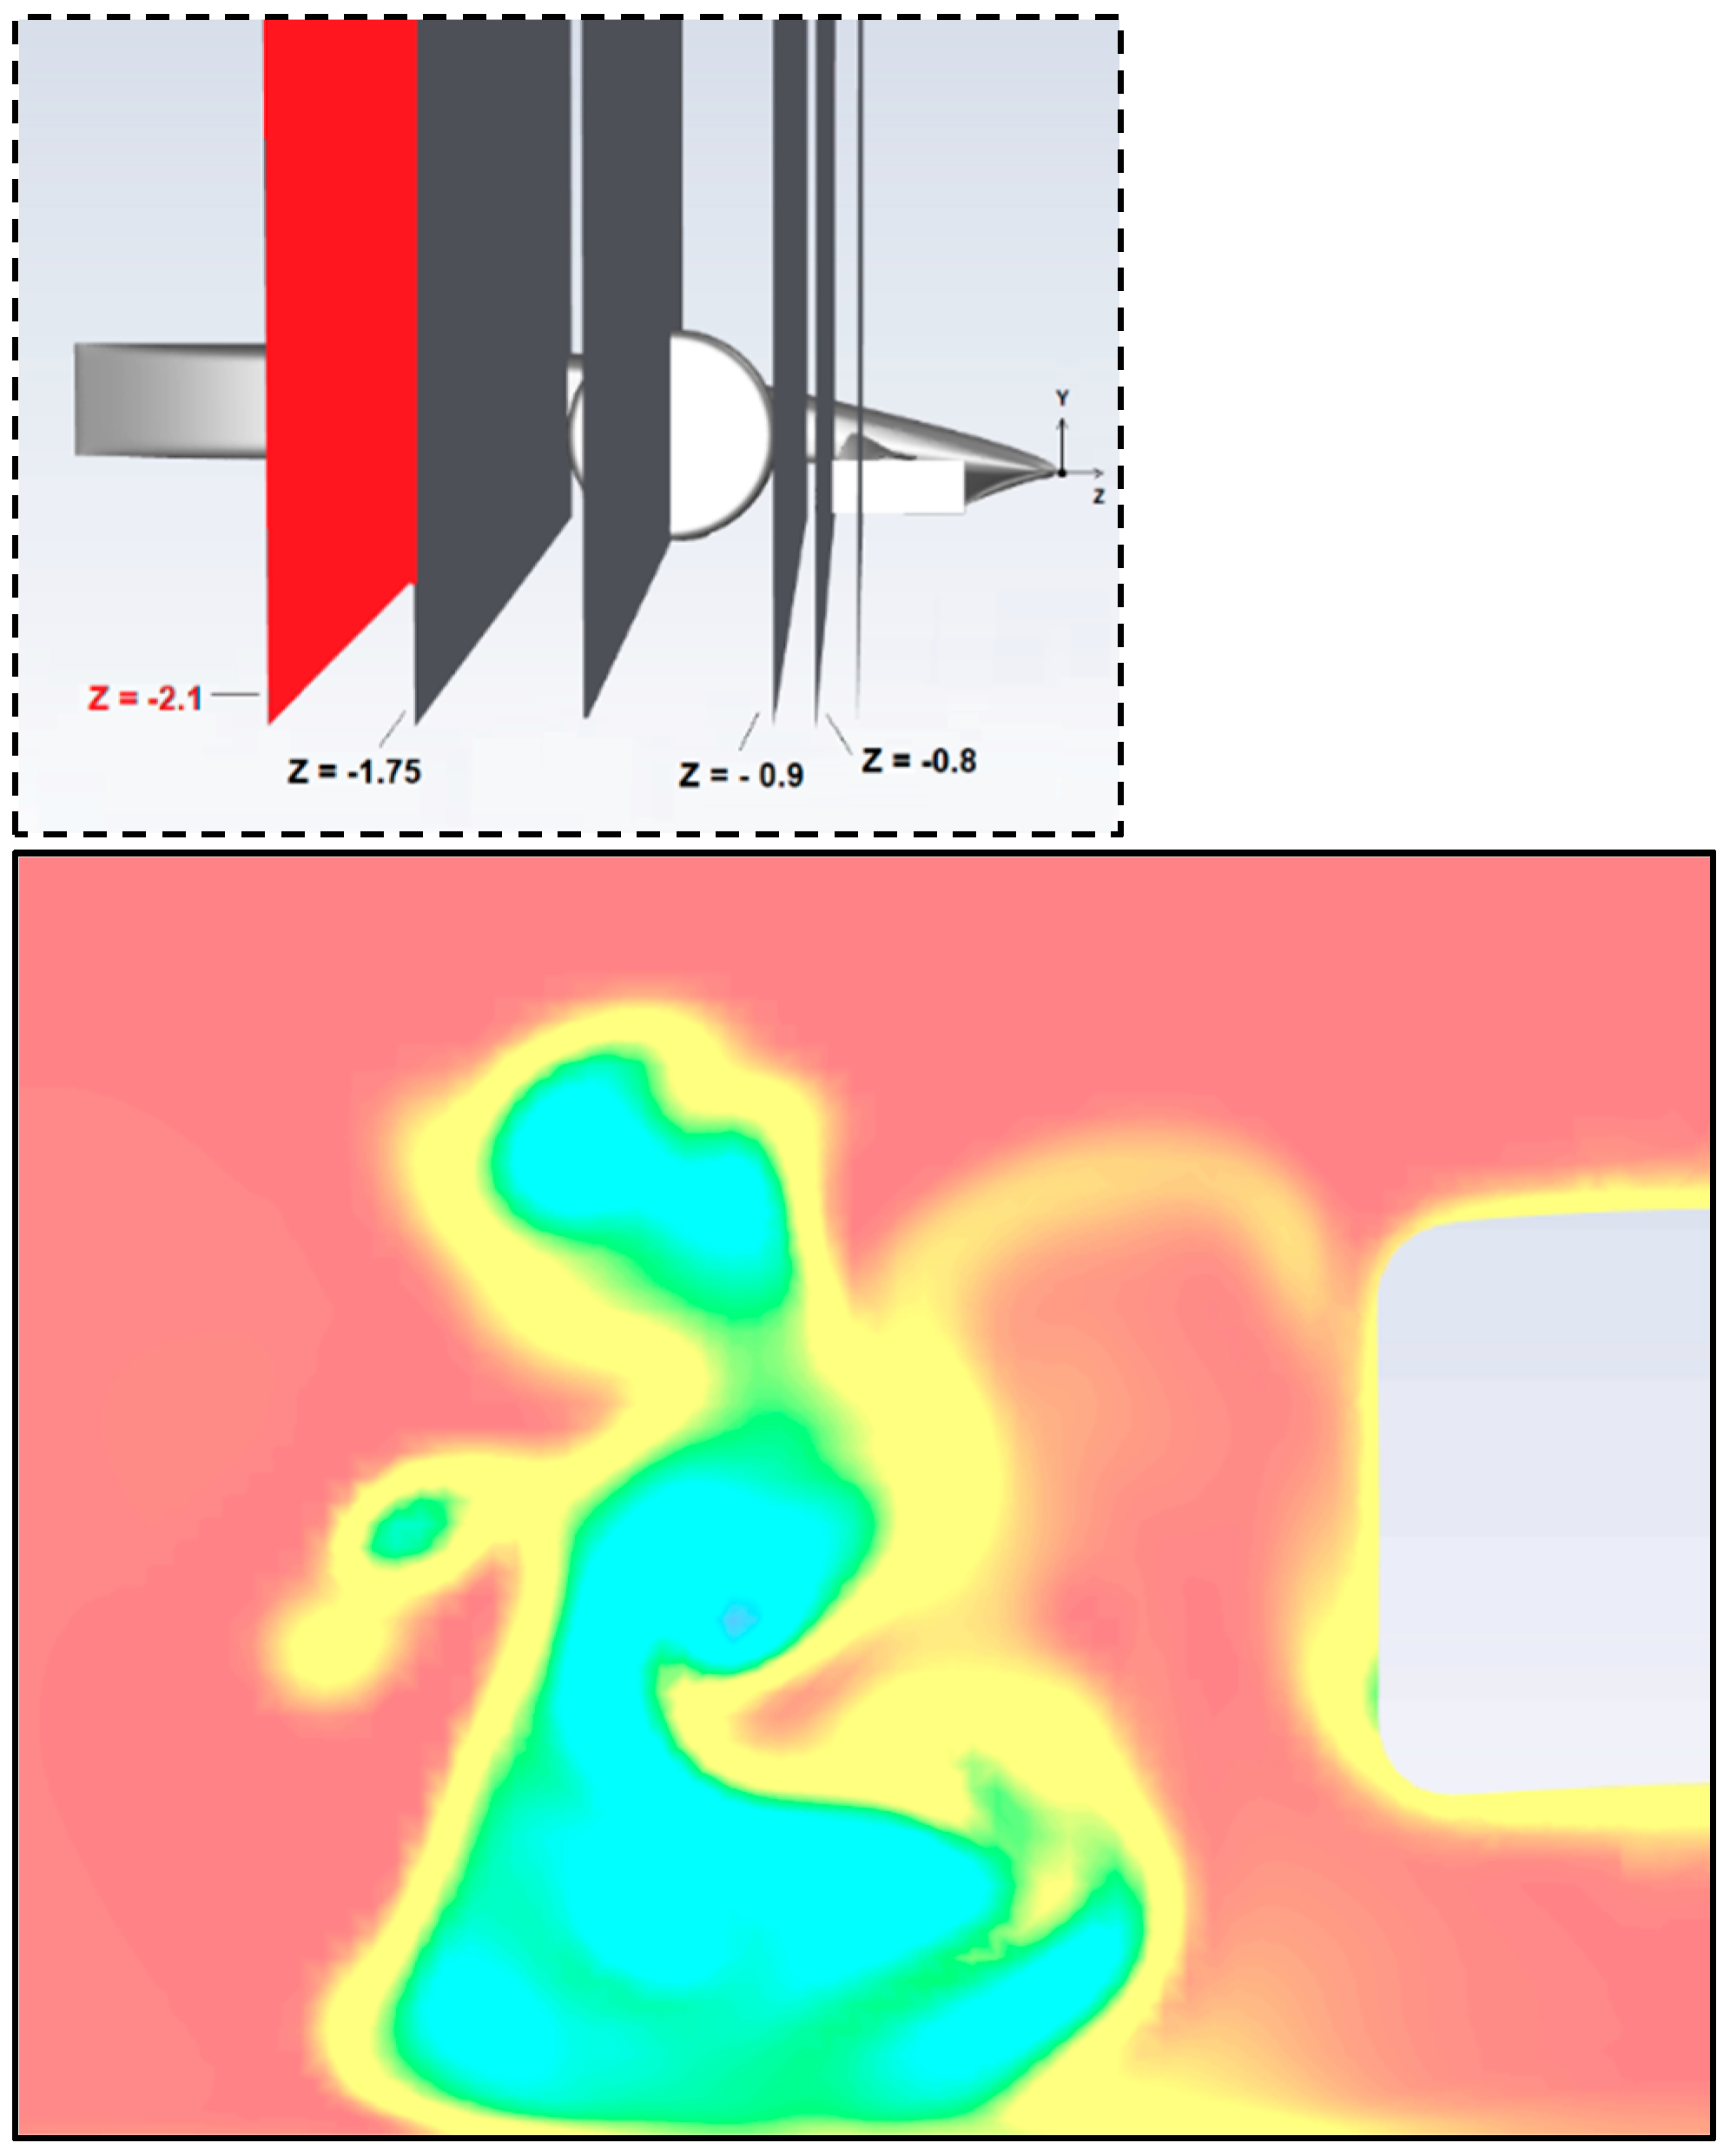
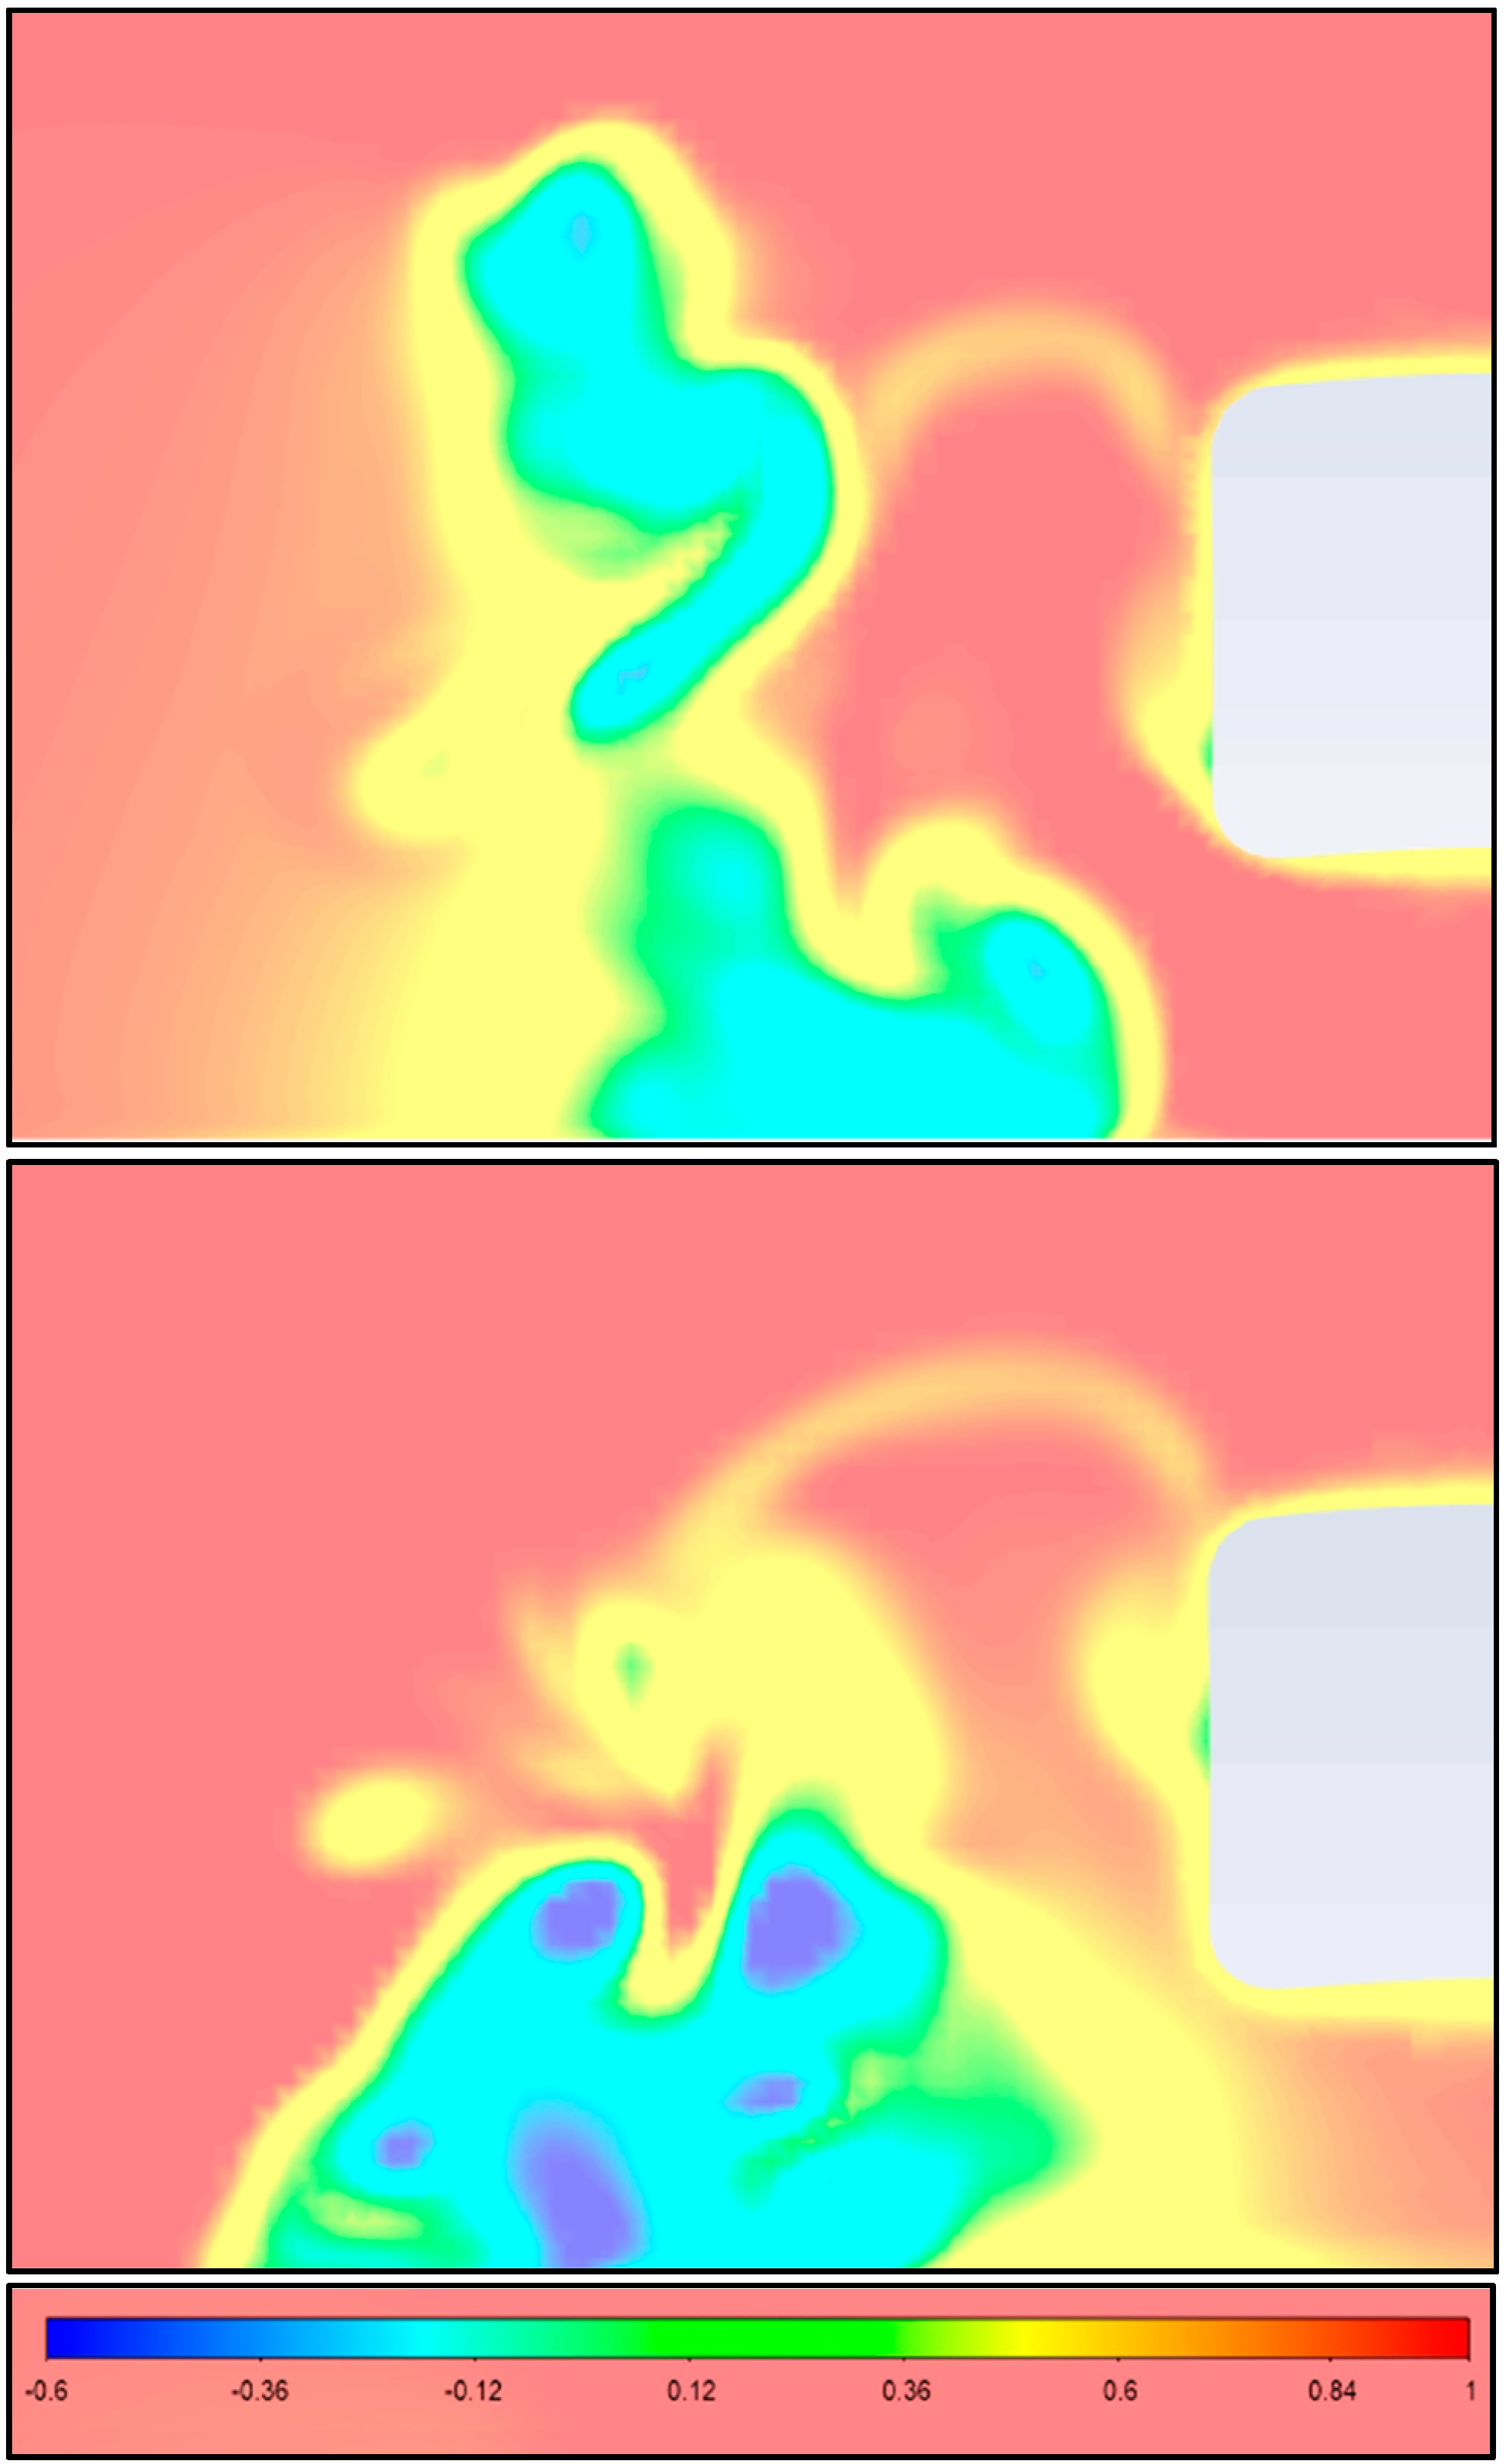
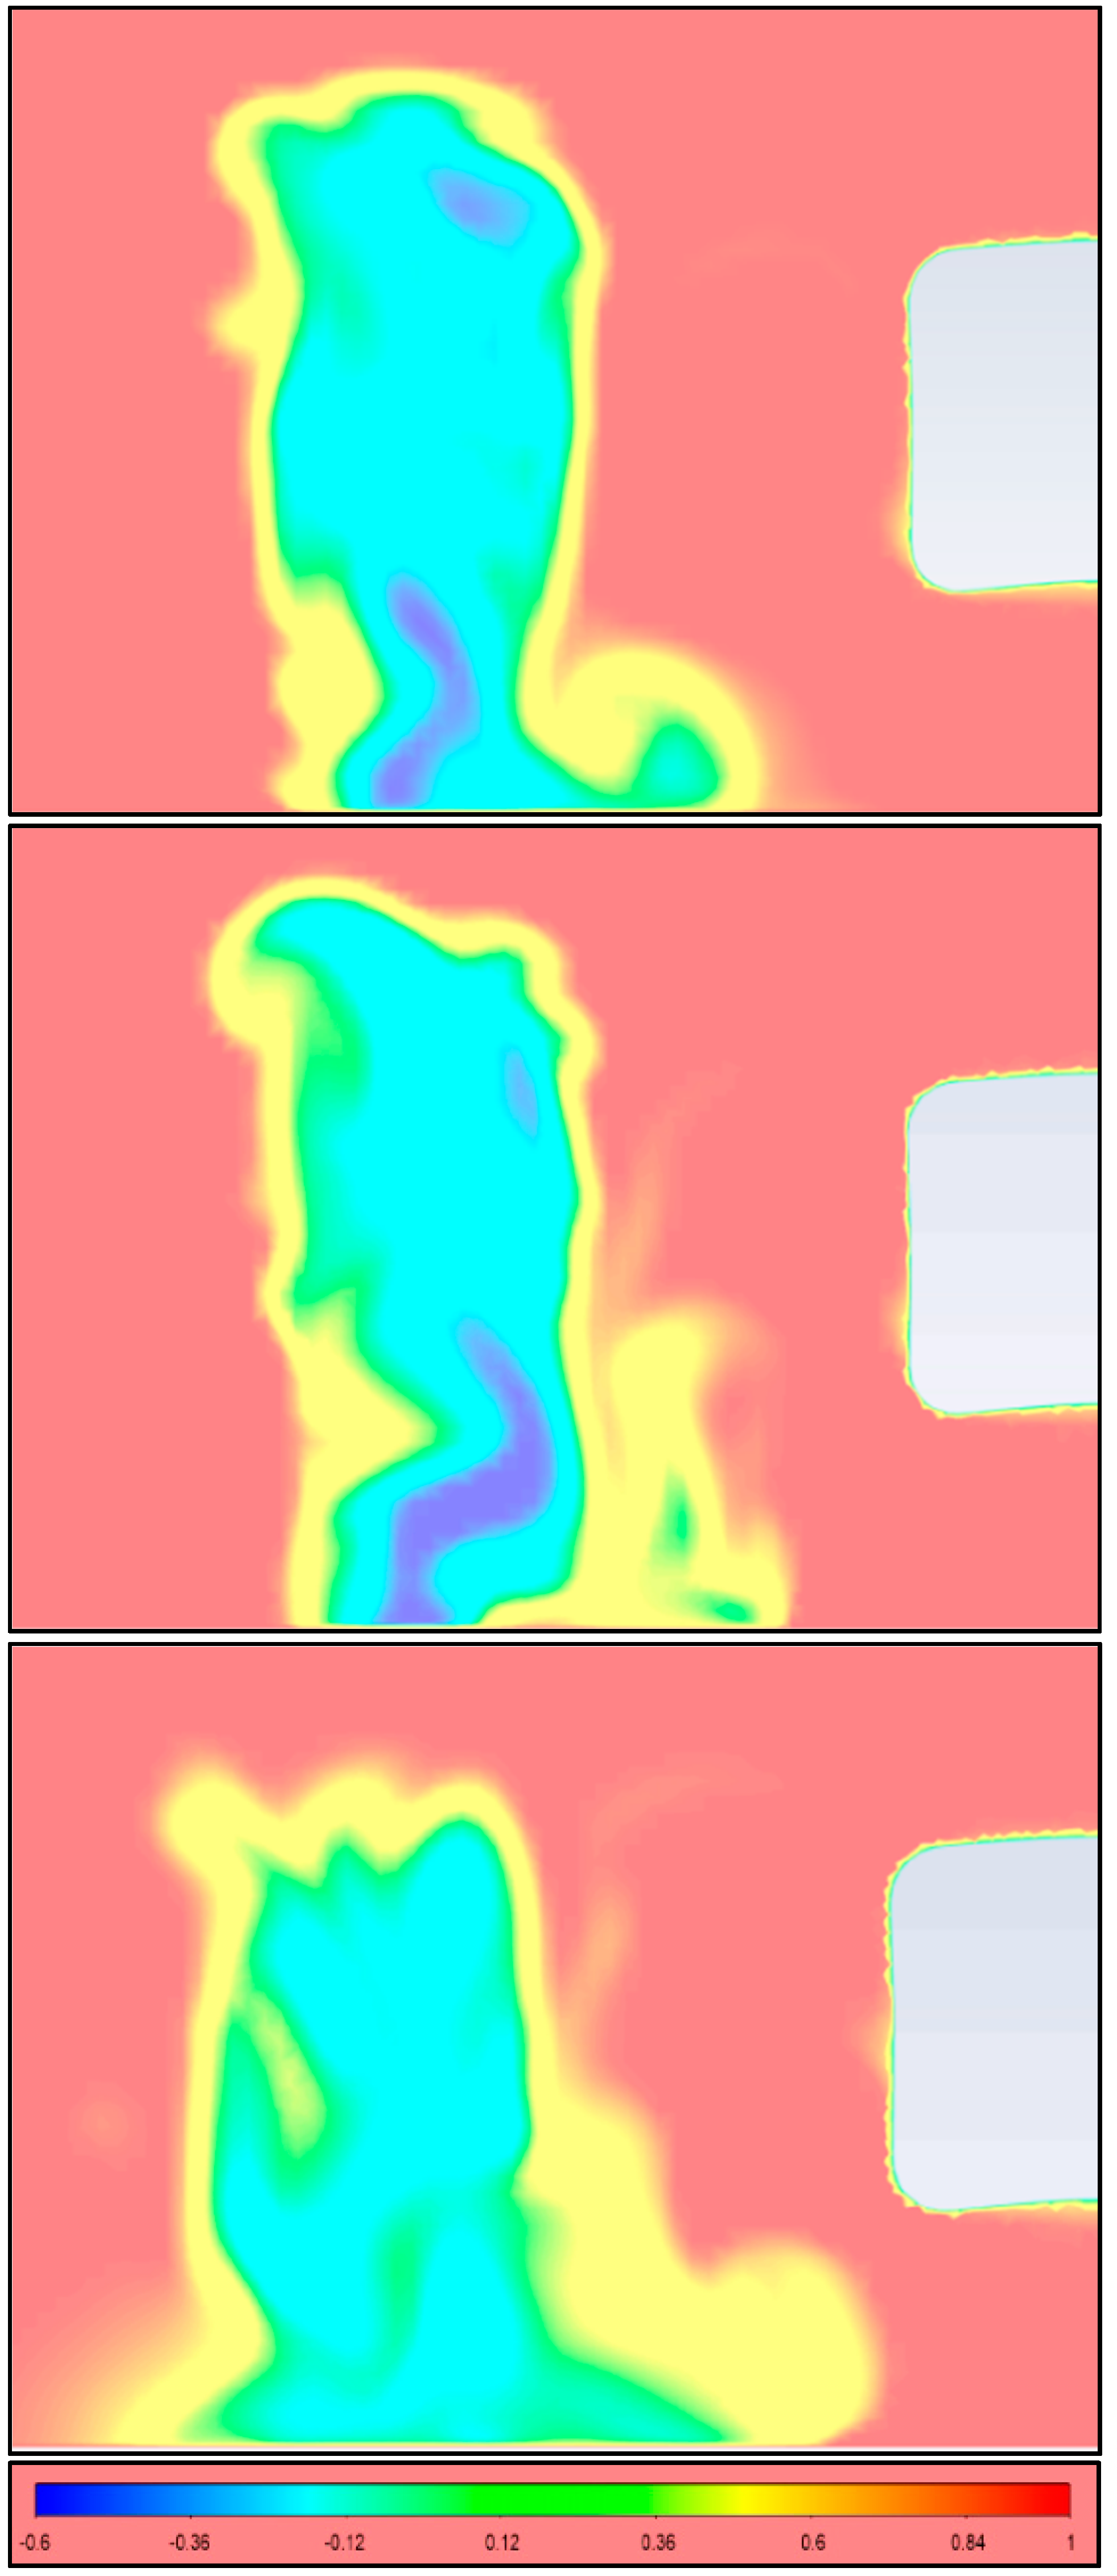
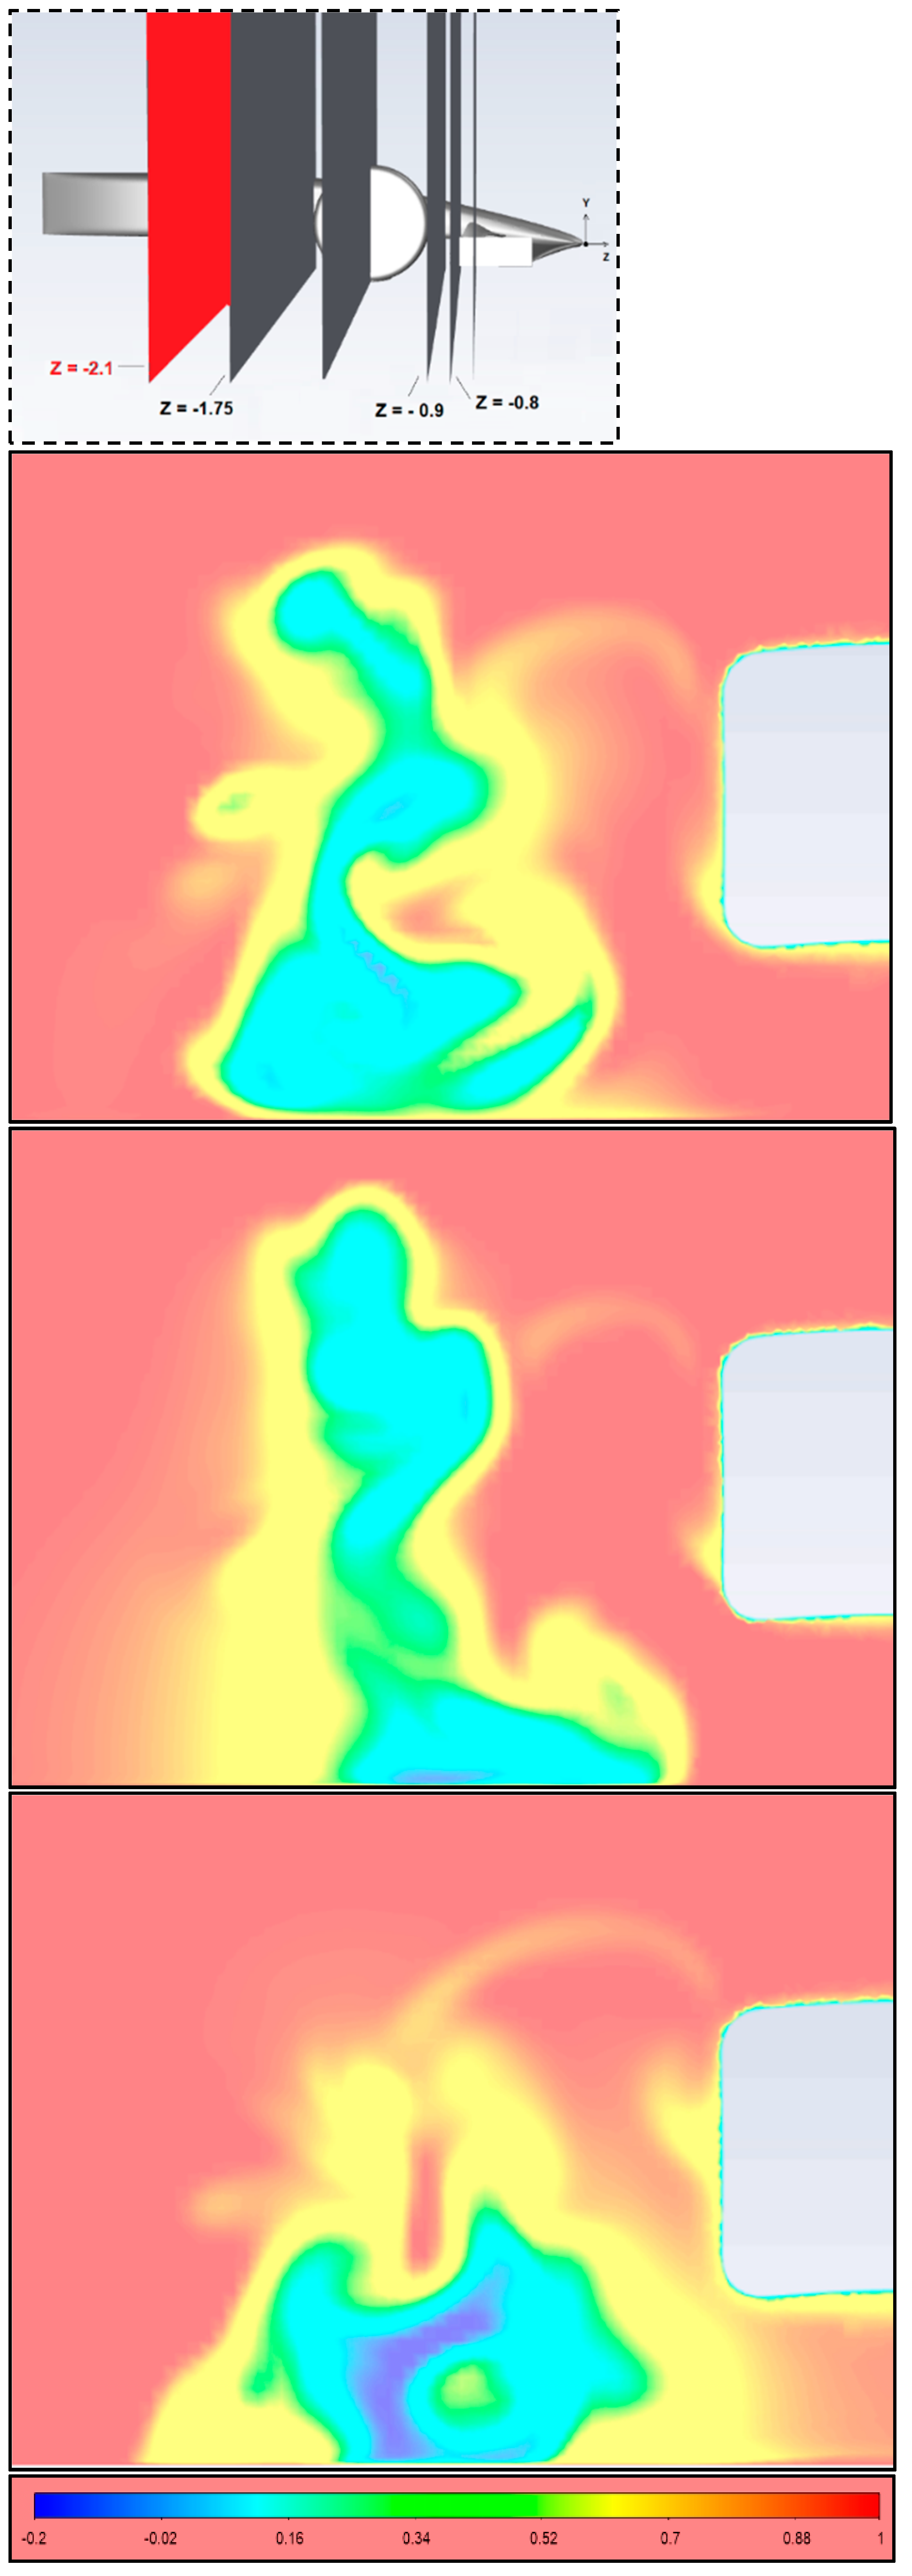
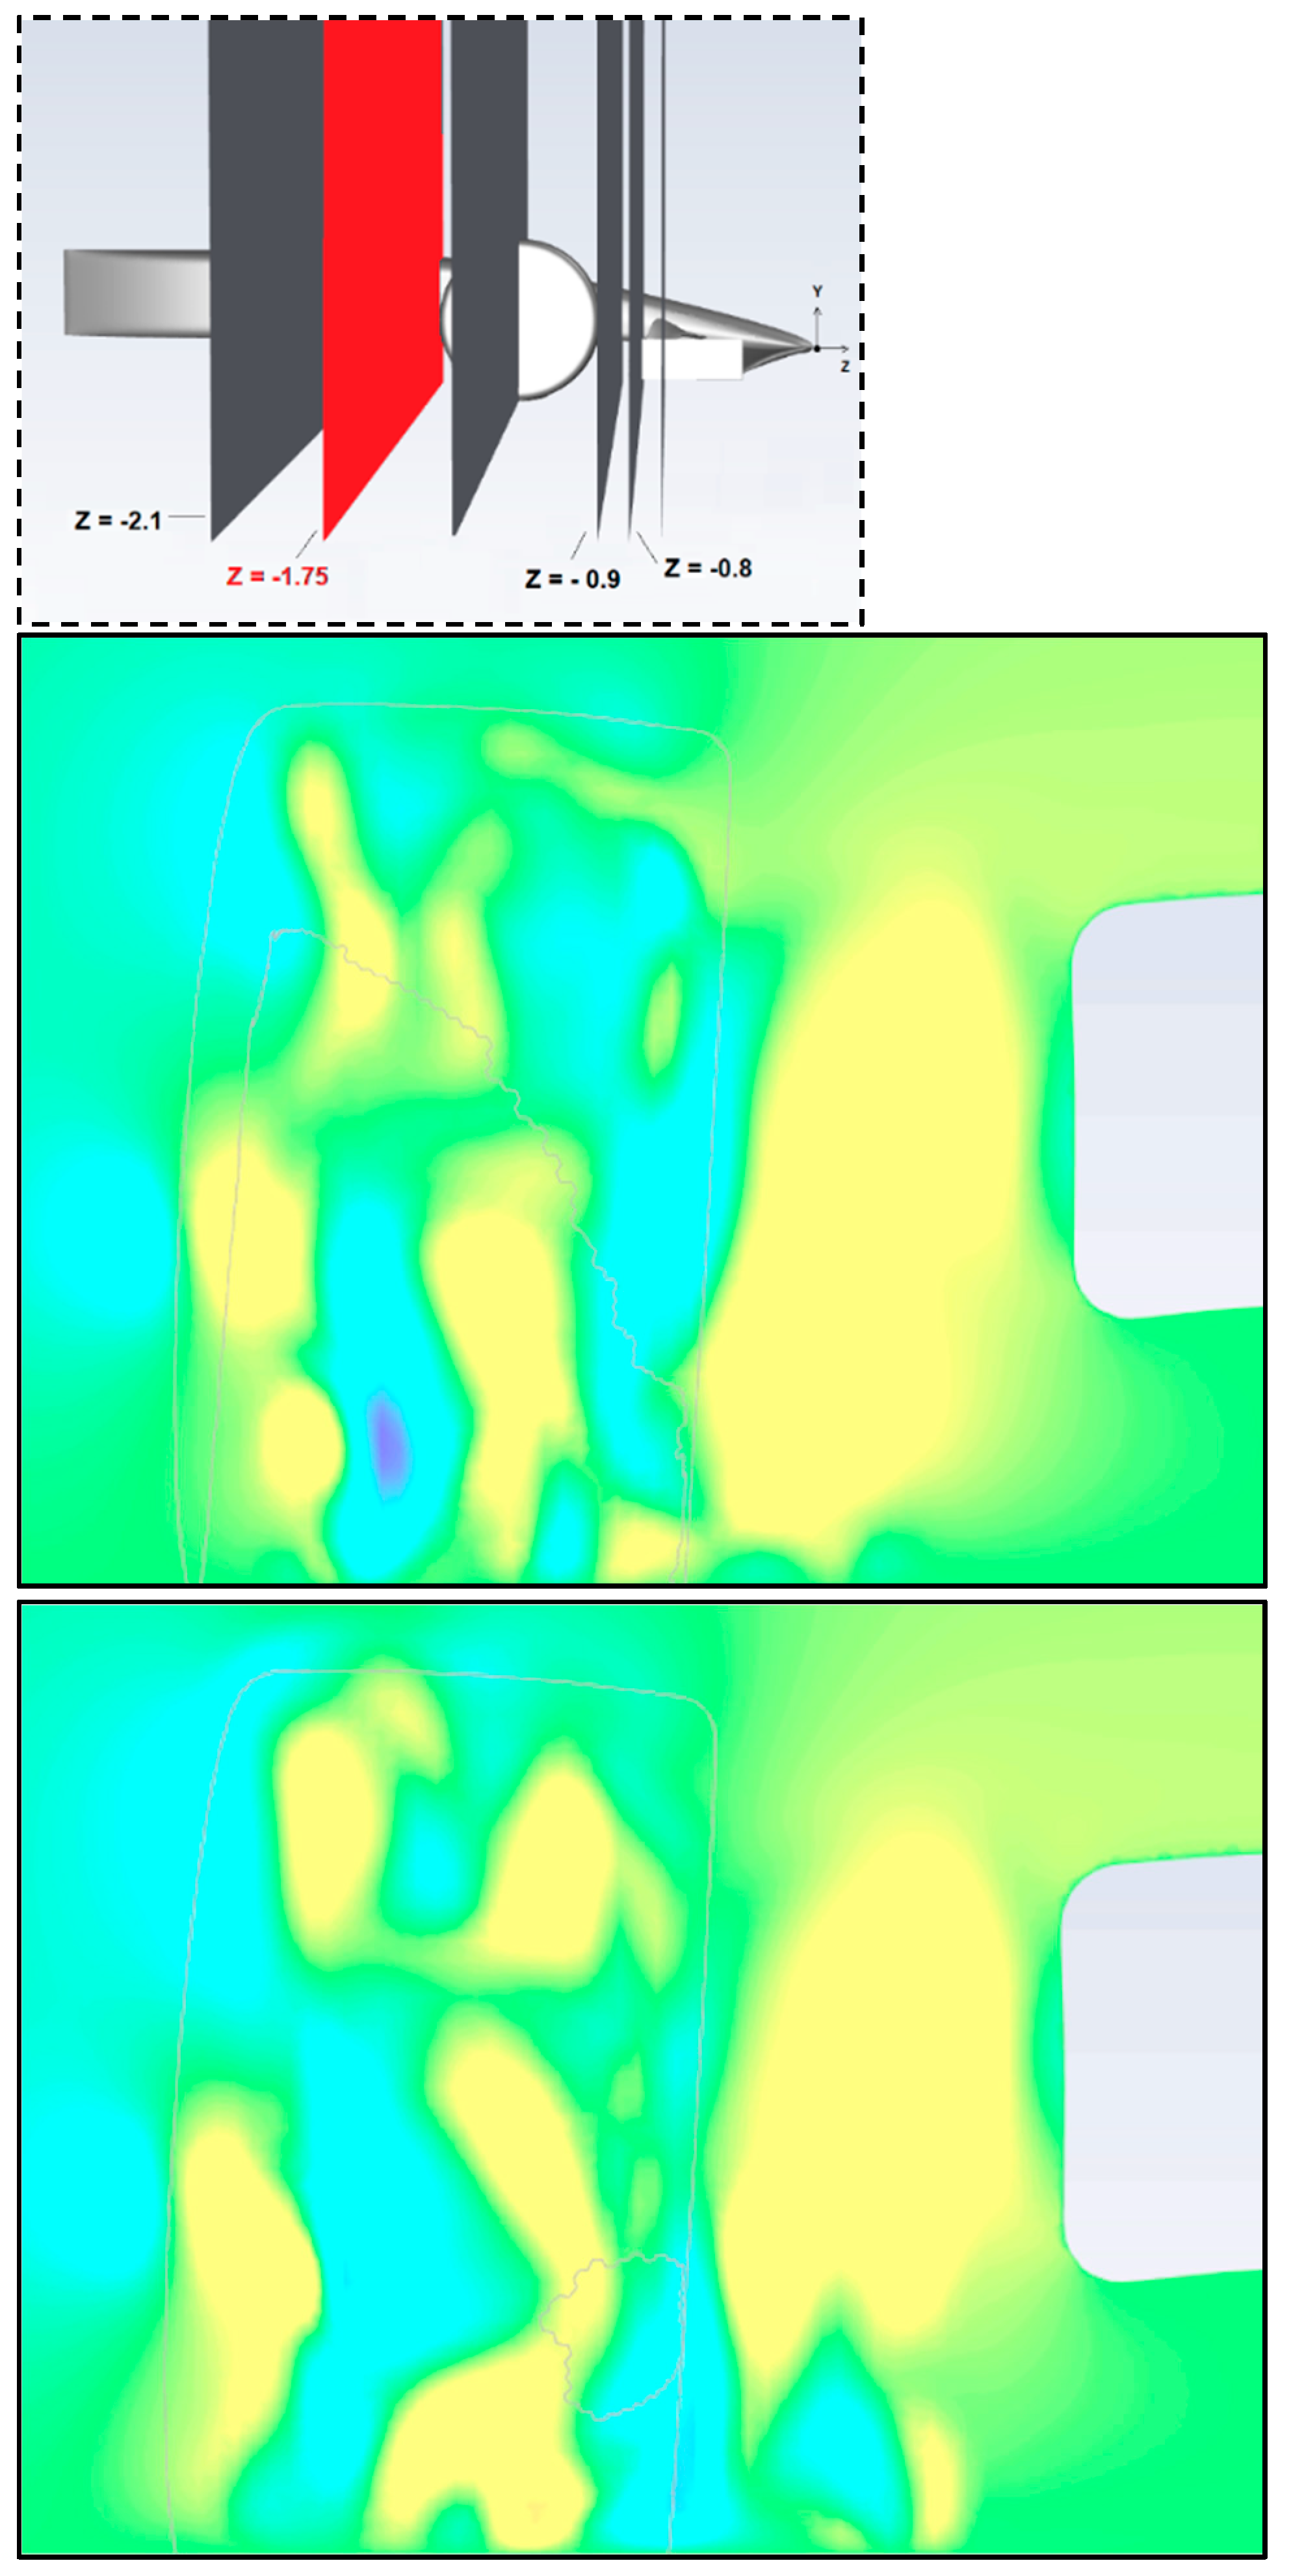
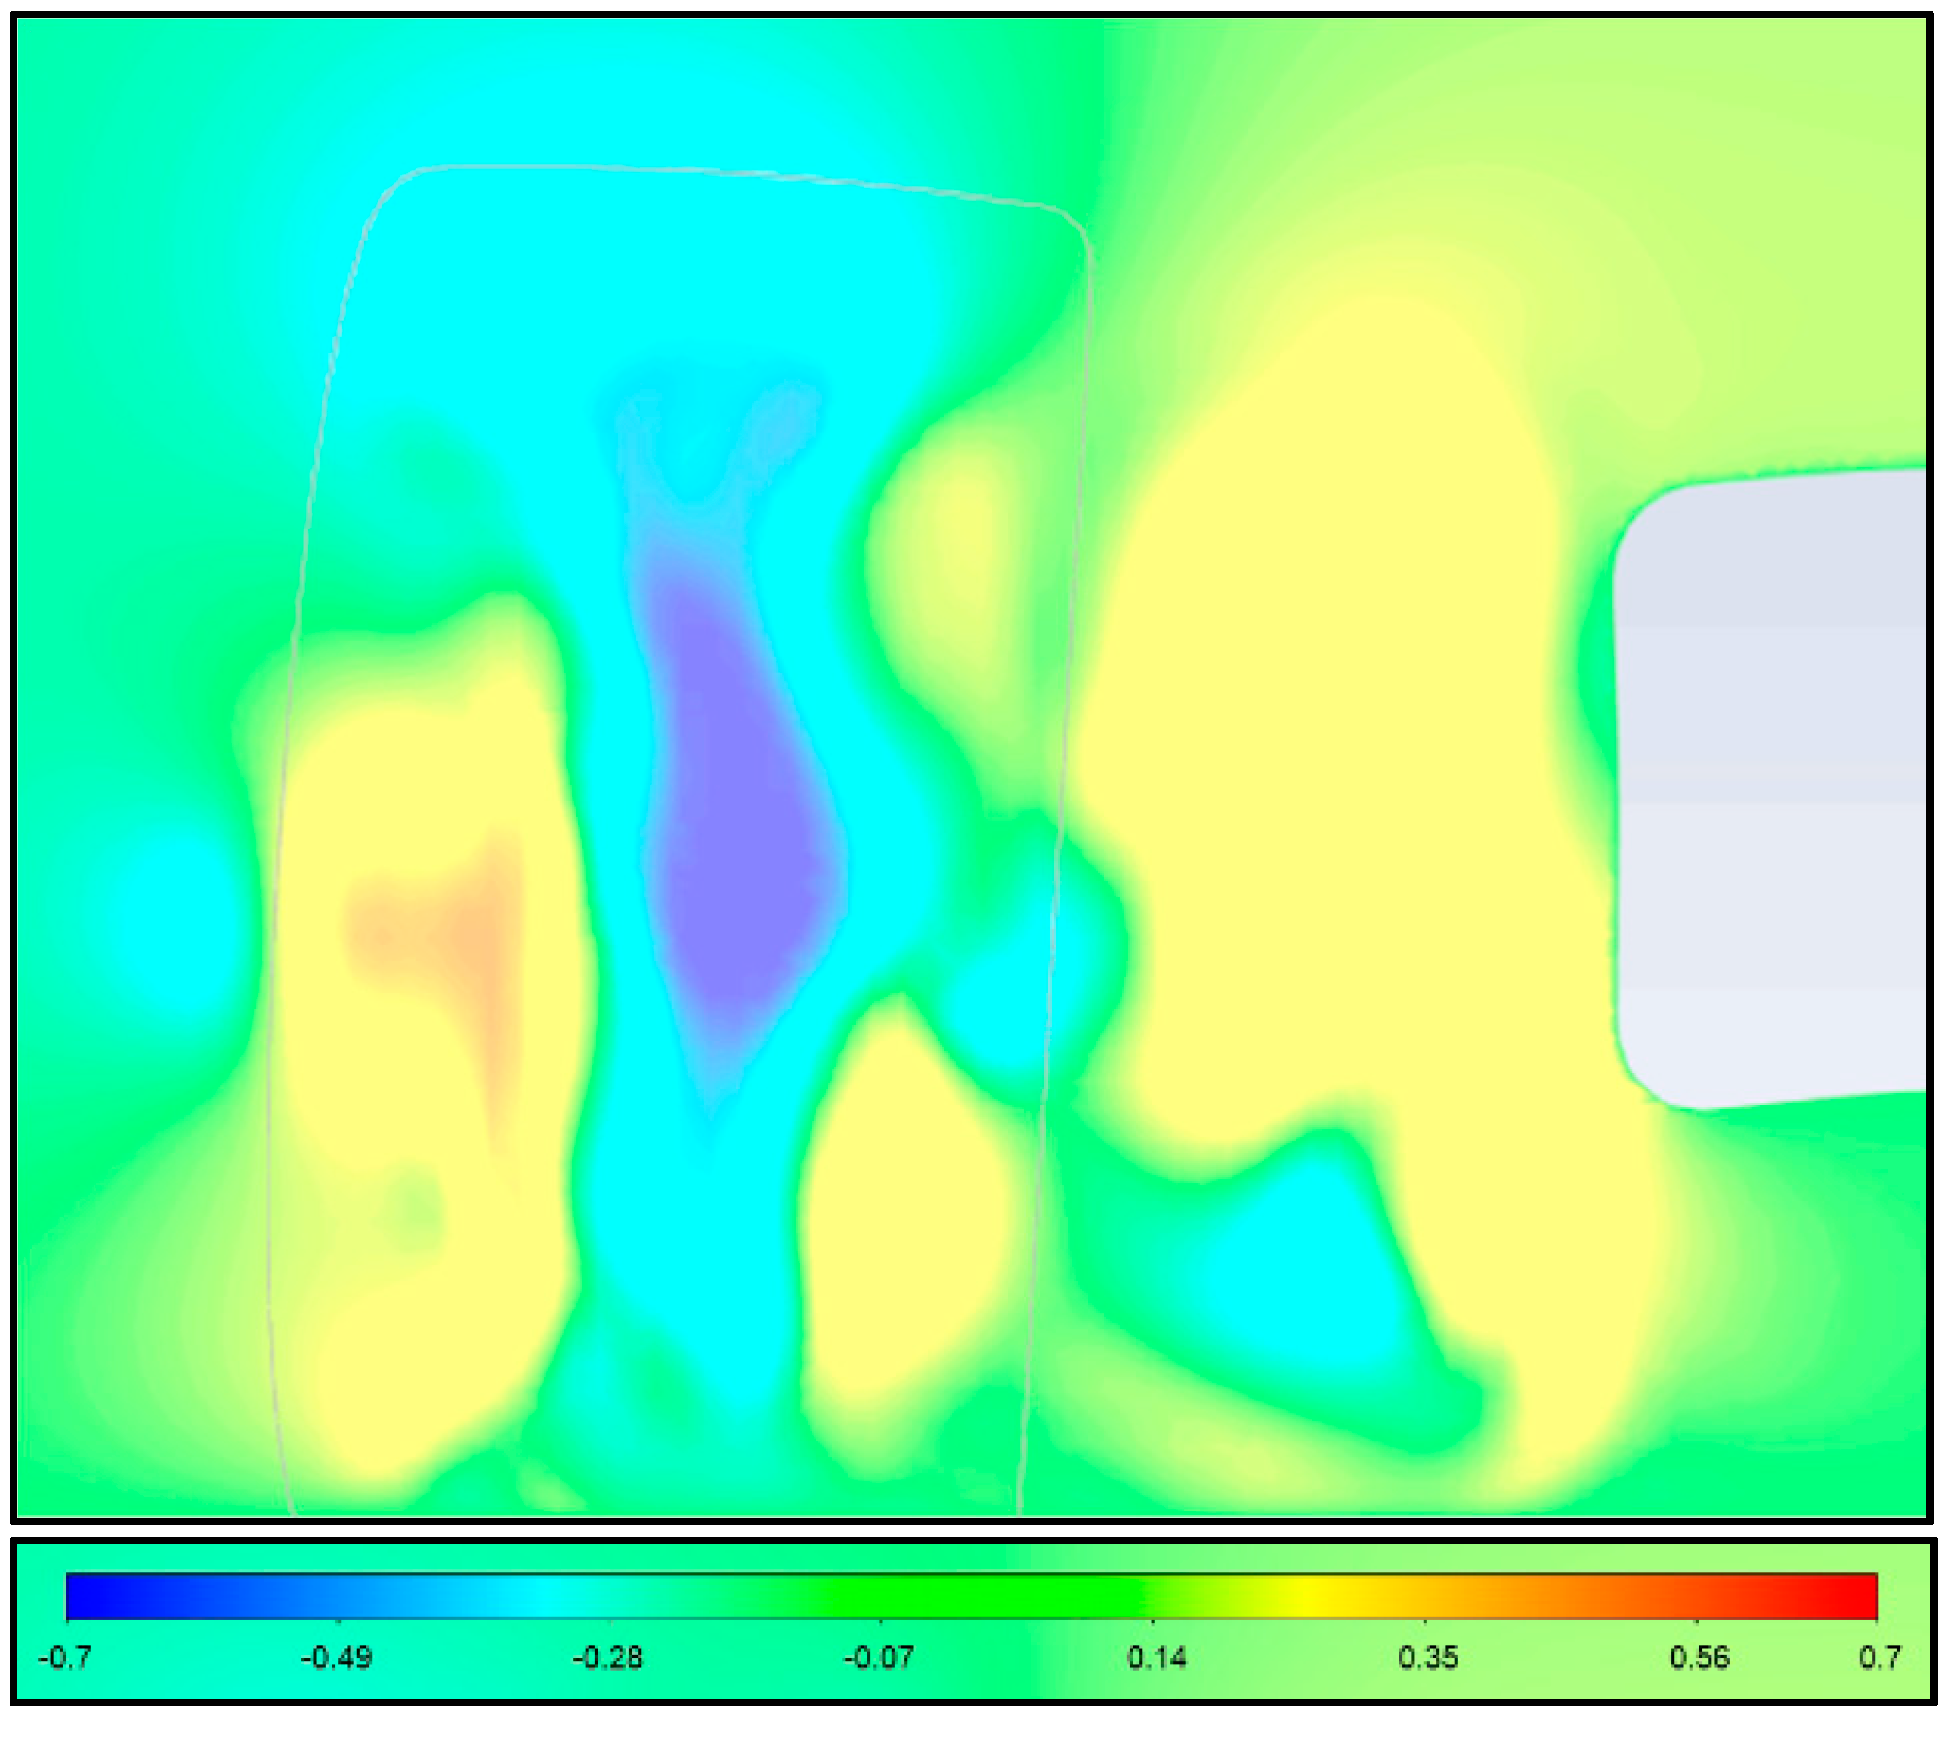
3.1. Flow Analysis
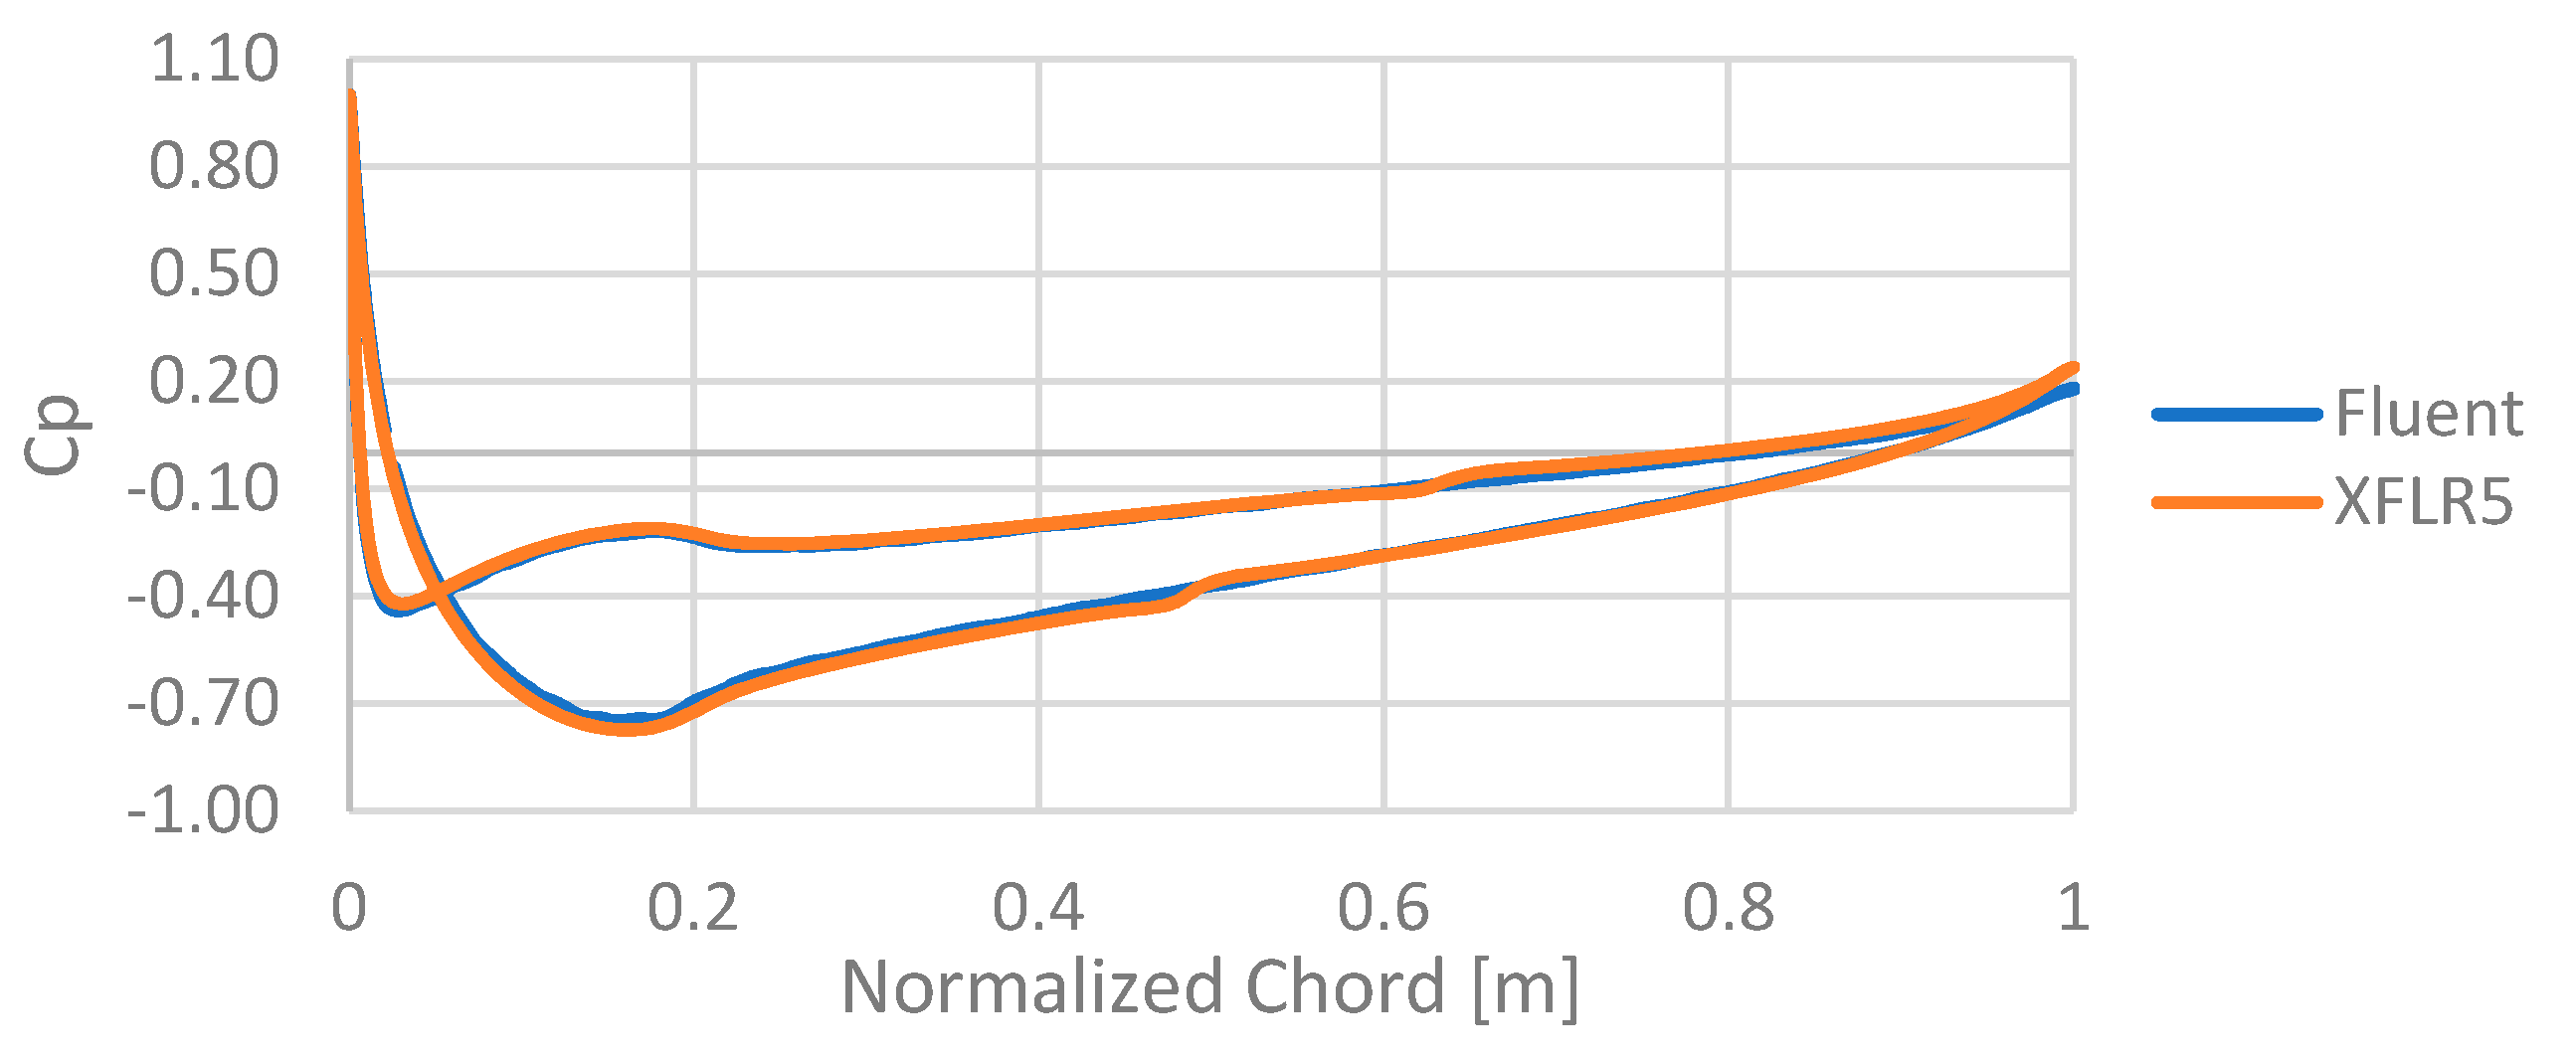
3.1.1. Wing
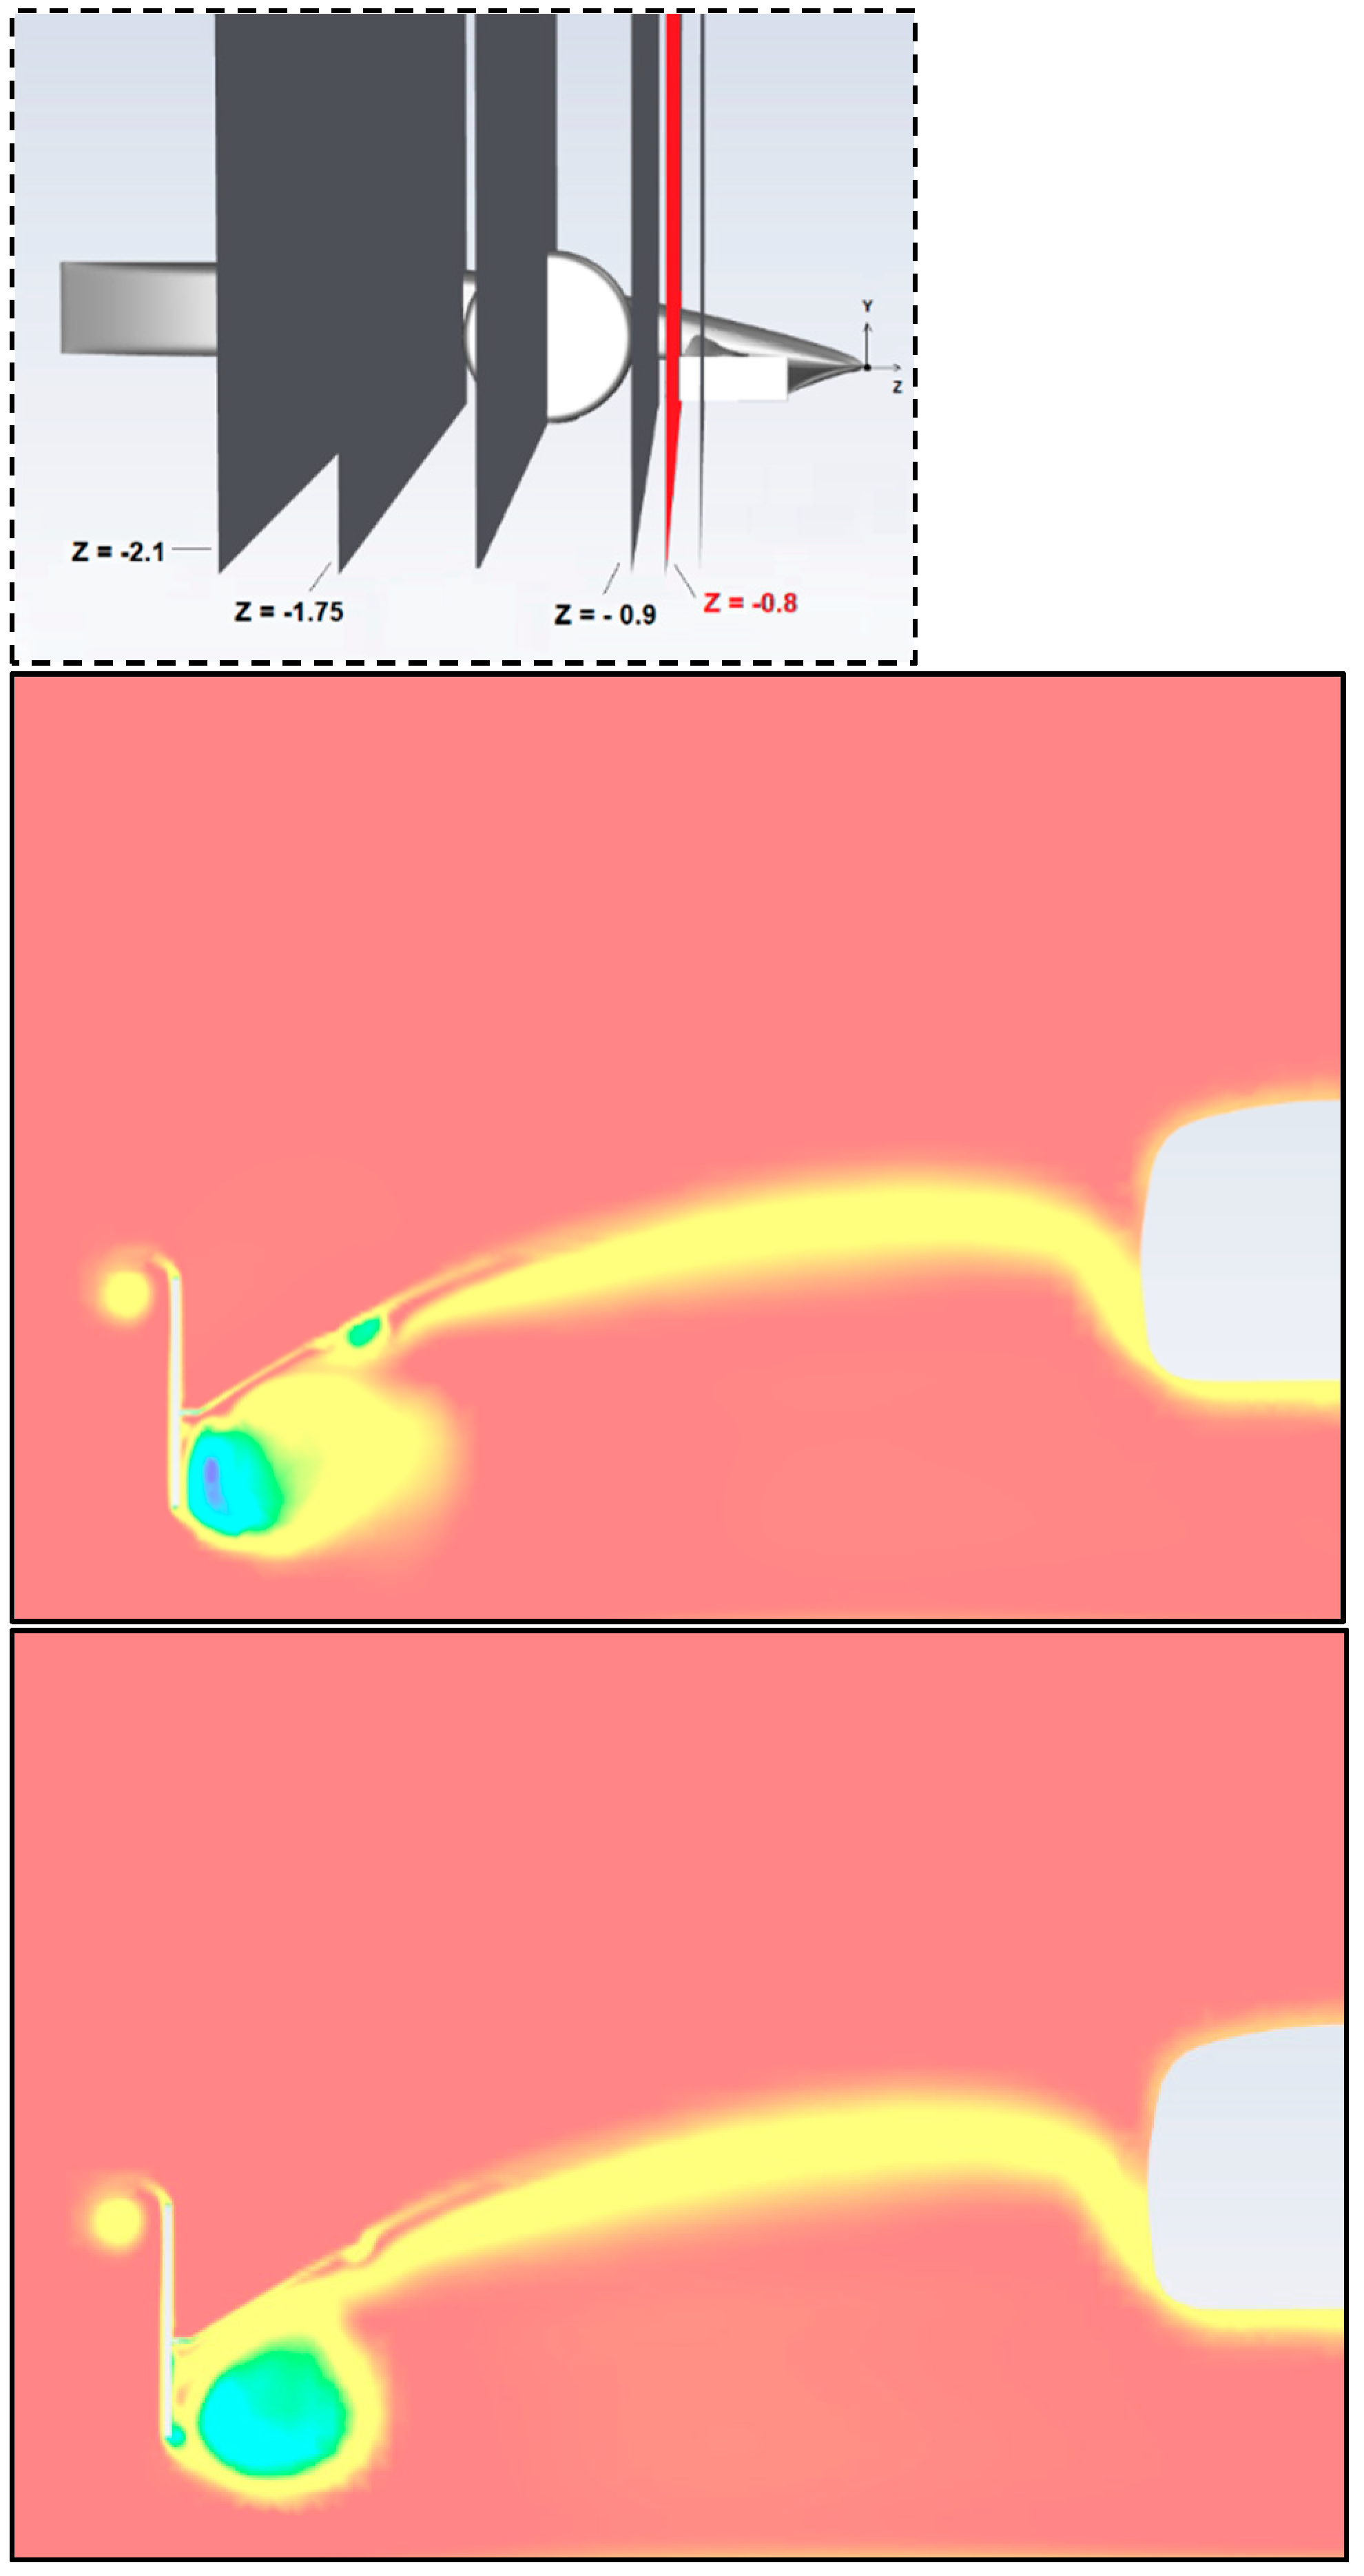
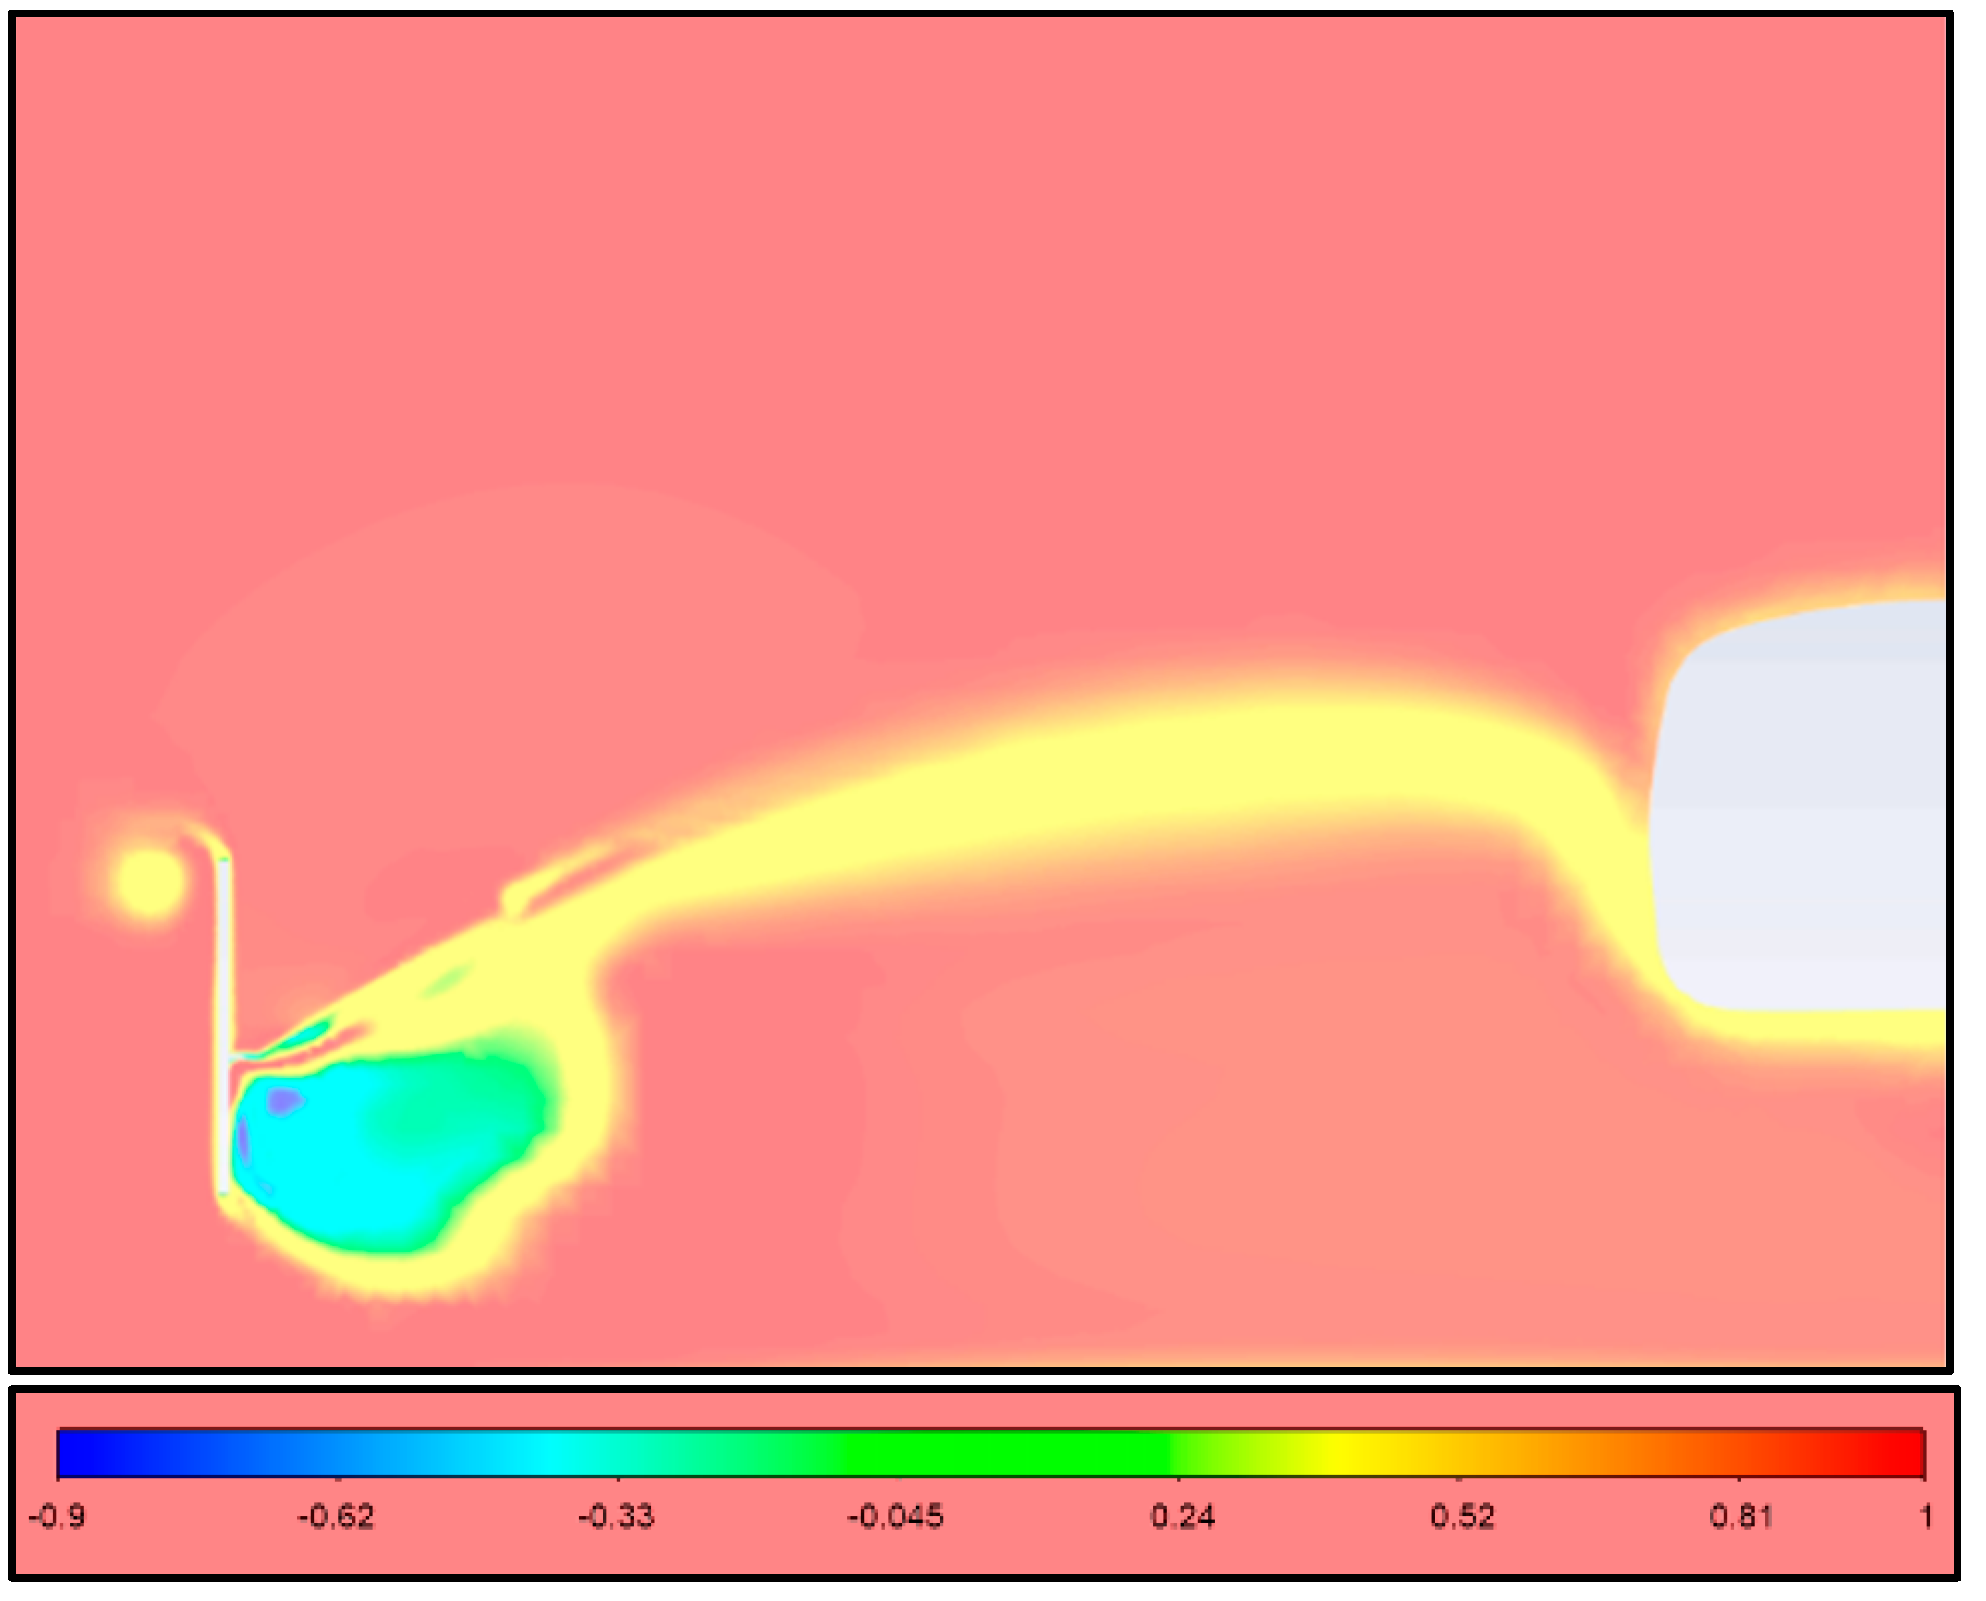
3.1.2. Wheel
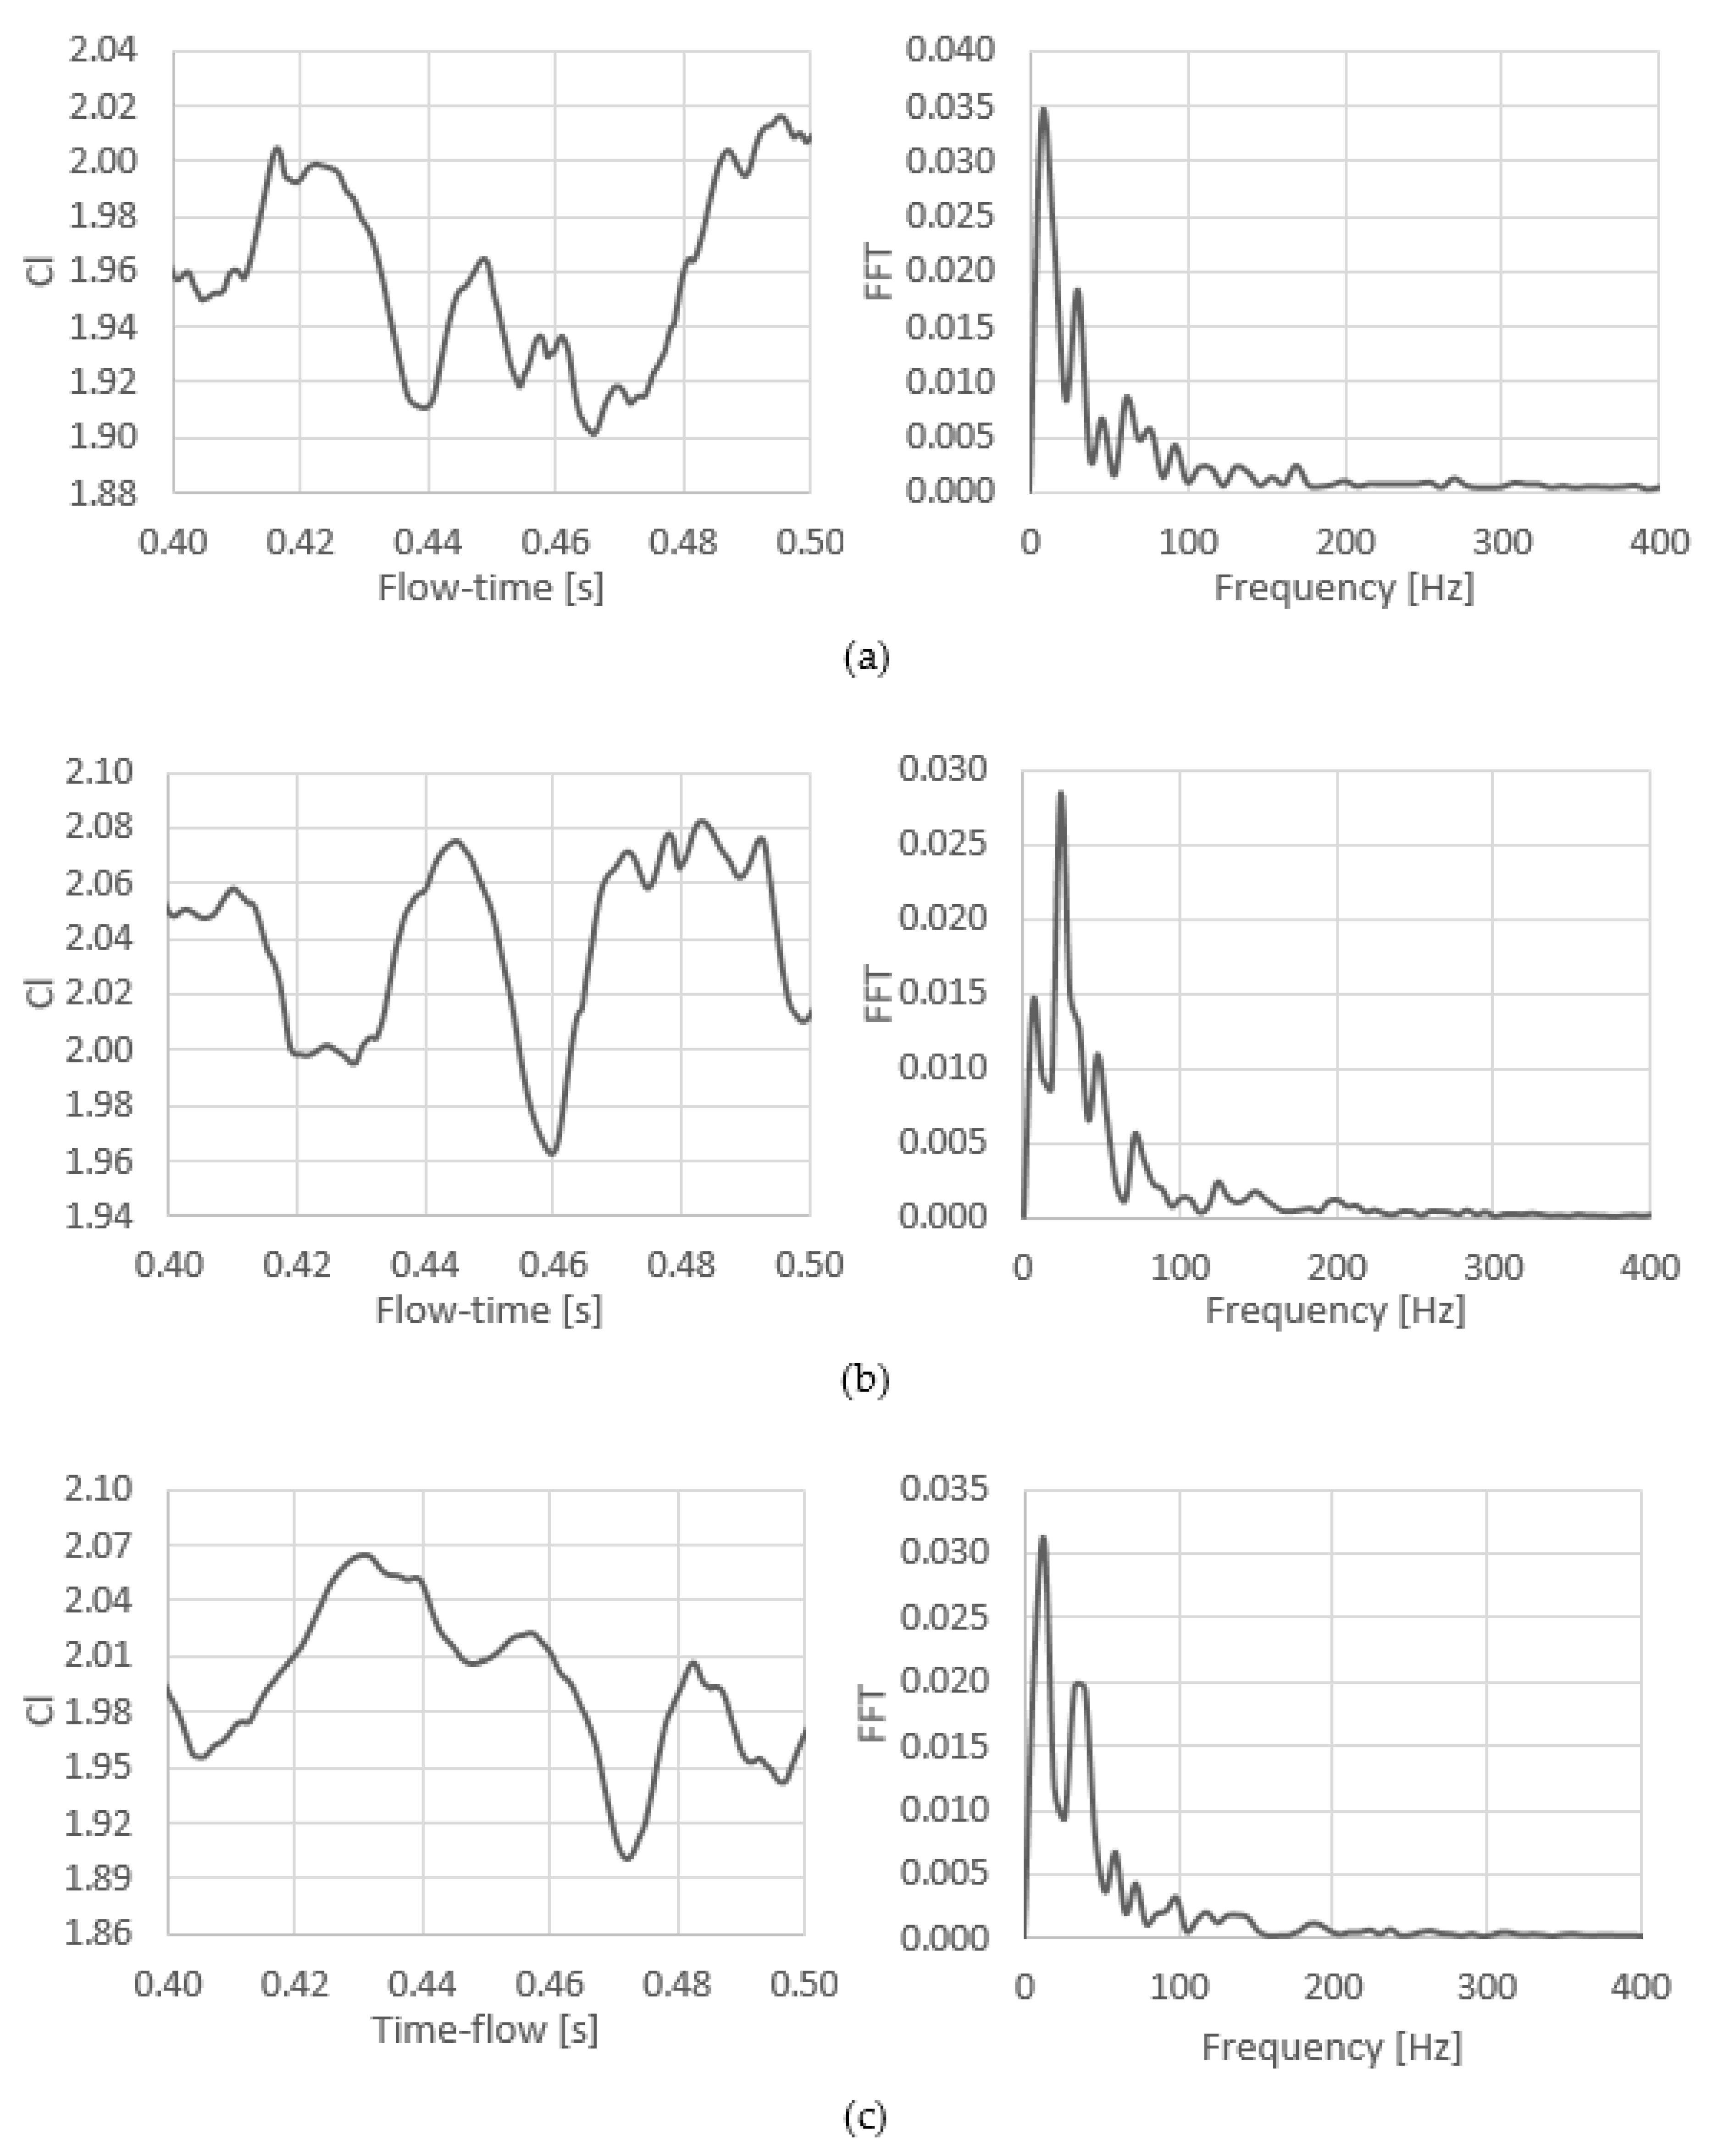
3.2. Force Analysis
4. Conclusions
Author Contributions
Funding
Institutional Review Board Statement
Informed Consent Statement
Data Availability Statement
Conflicts of Interest
Abbreviations
| AOA | Angle of Attack |
| CFD | Computational Fluid Dynamics |
| DES | Detached-Eddy Simulation |
| FFT | Fast Fourier Transform |
| FIA | Federation Internationale de l’Automobile |
| GF | Gurney Flap |
| LES | Large Eddy Simulations |
| PIV | Particle Image Velocimetry |
| RANS | Reynolds-averaged Navier–Stokes |
Nomenclature
| B | Wingspan |
| C | Wing chord |
| Freestream velocity | |
| x, y, z | Cartesian coordinates (horizontal, vertical, downstream) |
| Non-dimensional normal wall distance |
References
- Agathangelou, B.; Gascoyne, M. Aerodynamic Design Considerations of a Formula 1 Racing Car. In SAE Technical Papers; SAE International: Warrendale, PA, USA, 1998. [Google Scholar]
- Pegrum, J.M. Experimental Study of the Vortex System Generated by a Formula 1 Front Wing. Ph.D. Thesis, Imperial College London, London, UK, 2007. [Google Scholar]
- Mercker, E.; Breuer, N.; Berneburg, H.; Emmelmann, H.J. On the Aerodynamic Interference Due to the Rolling Wheels of Passenger Cars. In SAE Technical Papers; SAE International: Warrendale, PA, USA, 1991. [Google Scholar]
- Fackrell, J.E. The Aerodynamics of an Isolated Wheel Rotating in Contact with the Ground. Ph.D. Thesis, University of London, London, UK, 1974. [Google Scholar]
- Knowles, R.D. Monoposto Racecar Wheel Aerodynamics: Investigation of Near-Wake Structure and Support-Sting Interference. Ph.D. Thesis, Cranfield University, Cranfield, UK, 2007. [Google Scholar]
- Diasinos, S.; Gatto, A. Experimental Investigation into Wing Span and Angle-of-Attack Effects on Sub-Scale Race Car Wing/Wheel Interaction Aerodynamics. Exp. Fluids 2008, 45, 537–546. [Google Scholar] [CrossRef]
- Van Den Berg, M.A. Aerodynamic Interaction of an Inverted Wing with a Rotating Wheel. Ph.D. Thesis, University of Southampton, Southampton, UK, 2007. [Google Scholar]
- Van Den Berg, M.A.; Zhang, X. The Aerodynamic Interaction between an Inverted Wing and a Rotating Wheel. J. Fluids Eng. Trans. ASME 2009. [Google Scholar] [CrossRef]
- Heyder-Bruckner, J. The Aerodynamics of an Inverted Wing and a Rotating Wheel in Ground Effect. Ph.D. Thesis, University of Southampton, Southampton, UK, 2011. [Google Scholar]
- Basso, M.; Cravero, C.; Marsano, D. Aerodynamic Effect of the Gurney Flap on the Front Wing of a F1 Car and Flow Interactions with Car Components. Energies 2021, 14, 2059. [Google Scholar] [CrossRef]
- Roberts, L.S.; Correia, J.; Finnis, M.V.; Knowles, K. Aerodynamic Characteristics of a Wing-and-Flap Configuration in Ground Effect and Yaw. Automob. Eng. 2016, 230, 841–854. [Google Scholar] [CrossRef]
- Patel, D.; Garmory, A.; Passmore, M. The Effects of Cornering on the Aerodynamics of a Multi-Element Wing in Ground Effect. Fluids 2021, 6, 3. [Google Scholar] [CrossRef]
- Shur, M.; Spalart, P.R.; Strelets, M.; Travin, A. Detached-Eddy Simulation of an Airfoil at High Angle of Attack. In 4th International Symposium on Engineering Turbulence Modelling and Experiments; Elsevier Science Ltd.: Amsterdam, The Netherlands, 1999. [Google Scholar]
- Spalart, P.R.; Deck, S.; Shur, M.L.; Squires, K.D.; Strelets, M.K.; Travin, A. A New Version of Detached-Eddy Simulation, Resistant to Ambiguous Grid Densities. Theor. Comput. Fluid Dyn. 2006, 20, 181–195. [Google Scholar] [CrossRef]
- Diasinos, S. The Aerodynamic Interaction of a Rotating Wheel and a Downforce Producing Wing in Ground Effect. Ph.D. Thesis, University of New South Wales, Sydney, Australia, 2009. [Google Scholar]
- Knowles, R.D.; Saddington, A.J.; Knowles, K. On the near Wake of a Formula One Front Wheel. Proc. Inst. Mech. Eng. Part D J. Automob. Eng. 2013, 227, 1491–1502. [Google Scholar] [CrossRef] [Green Version]
- Alexander, D.E. Fluid Biomechanics. In Nature’s Machines; Academic Press: Cambridge, MA, USA, 2017. [Google Scholar]


| Flap Configuration | |||
|---|---|---|---|
| Dominant Frequency | |||
Publisher’s Note: MDPI stays neutral with regard to jurisdictional claims in published maps and institutional affiliations. |
© 2021 by the authors. Licensee MDPI, Basel, Switzerland. This article is an open access article distributed under the terms and conditions of the Creative Commons Attribution (CC BY) license (https://creativecommons.org/licenses/by/4.0/).
Share and Cite
Martins, D.; Correia, J.; Silva, A. The Influence of Front Wing Pressure Distribution on Wheel Wake Aerodynamics of a F1 Car. Energies 2021, 14, 4421. https://doi.org/10.3390/en14154421
Martins D, Correia J, Silva A. The Influence of Front Wing Pressure Distribution on Wheel Wake Aerodynamics of a F1 Car. Energies. 2021; 14(15):4421. https://doi.org/10.3390/en14154421
Chicago/Turabian StyleMartins, Daniel, João Correia, and André Silva. 2021. "The Influence of Front Wing Pressure Distribution on Wheel Wake Aerodynamics of a F1 Car" Energies 14, no. 15: 4421. https://doi.org/10.3390/en14154421
APA StyleMartins, D., Correia, J., & Silva, A. (2021). The Influence of Front Wing Pressure Distribution on Wheel Wake Aerodynamics of a F1 Car. Energies, 14(15), 4421. https://doi.org/10.3390/en14154421