Article

Theoretical and Numerical Study on Electrical Resistivity Measurement of Cylindrical Rock Core Samples Using Perimeter Electrodes

1
Radioactive Waste Disposal Research Division, Korea Atomic Energy Research Institute (KAERI), Daejeon 34057, Korea
2
Department of Civil Engineering, Sunchon National University, 225 Jungang-ro, Suncheon 57922, Korea
*
Author to whom correspondence should be addressed.
Energies 2021, 14(14), 4382; https://doi.org/10.3390/en14144382
Submission received: 19 March 2021 / Revised: 12 July 2021 / Accepted: 15 July 2021 / Published: 20 July 2021
(This article belongs to the Section H: Geo-Energy)

Abstract

:
The estimation of hydraulic and mechanical properties of bedrock is important for the evaluation of energy-related structures, including high-level nuclear waste repositories, hydraulic fracturing wells, and gas-hydrate production wells. The hydraulic conductivity and stress–strain curves of rocks are conventionally measured through laboratory tests on cylindrical samples. Both ASTM standards for hydraulic conductivity and compressive strength involve the use of the planar bases of a cylindrical sample. Hence, an alternative test method is required for the simultaneous measurement of hydraulic conductivity and stress–strain curves. This study proposes a novel electrical resistivity estimation method using two perimeter electrodes for the estimation of hydraulic properties. The theoretical background for the perimeter electrode setup is derived and the COMSOL MultiPhysics® finite element numerical simulation tool is employed to verify the derived theoretical equation. The accuracy of the numerical simulation tool is first validated by simulating the ASTM standard testing method for electrical resistivity. The electrical resistance values derived from the theoretical equation and numerical simulation are compared for different electrical resistivity and electrode radius. The assumed equidistant, circular equipotential surface results in a theoretical lower bound for the measured electrical resistance in the cylindrical specimen. The introduction of a phenomenological distortion factor to correct for the theoretical equipotential surface results in a good fit with the numerical simulation results. The effects of electrode length and equivalent strap electrodes were investigated to assess the applicability of the suggested method for laboratory testing. Consequently, this study presents an effective alternative theoretical assessment method for the lower bound electrical resistivity of cylindrical rock core samples under confining conditions when the installation of base electrodes is infeasible.

1. Introduction

Energy-related geostructures (e.g., high-level nuclear waste repositories, hydraulic fracturing wells, and gas-hydrate production wells) are exposed to high pressure and fully saturated conditions at depths ranging from hundreds of meters to several kilometers [1,2,3,4]. Hence, characterization of the hydro-mechanical properties of the surrounding rock mass is required for accurate safety assessment and numerical simulations. The standardized testing methods for the hydraulic conductivity and the uniaxial compressive strength of a cylindrical rock sample use both ends of planar bases [5,6]. In other words, the hydraulic gradient between two bases of the cylindrical sample measures the flow rate for hydraulic conductivity tests and the top loading plate helps measure the change in force-displacement during compression. However, simultaneous measurements of hydraulic and mechanical properties for a single cylindrical rock sample are infeasible as both bases are preoccupied for each test. In particular, the change in hydraulic conductivity during the loading stage should be estimated to predict the stability of energy-related geostructures. Therefore, there is a need to employ indirect methods of identifying variations in hydraulic conductivity that do not involve the use of the planar bases of cylindrical samples.
The electrical resistivity method has been widely used to obtain the water-related physical properties of samples such as porosity and saturation [7,8] and is closely related to the hydraulic conductivity [9,10]. The electrical resistivity of a rock core sample is typically acquired according to the ASTM G187 standard test method for measurement of soil resistivity. The electrical resistance is measured using electrodes installed on both planar bases of a cylindrical sample, yet the use of base electrodes hinders the simultaneous execution of uniaxial compressive strength tests. Several studies have attempted to measure the electrical resistivity of rock samples using point electrodes and ring electrodes [10,11,12,13]. However, point electrodes installed on the sample cause unfavorable contact resistance and stiffer ring electrodes around the perimeter of the rock sample imposes unexpected lateral confinement.
In this study, an alternative electrical resistivity estimation method is proposed for cylindrical rock samples under confining conditions using two cylindrical electrodes on the perimeter of the rock core. The theoretical electrical resistance is formulated based on the assumption that the equipotential surface line between the two perimeter electrodes is circular and evenly distributed with respect to the distance from the electrodes. Finite element analysis is conducted to validate the theoretical equation. In the discussion, the proposed method is extended to investigate the effects of electrode length and the consideration of an equivalent strap electrode for laboratory testing.

2. Governing Equations for Electrical Resistivity of Cylindrical Samples

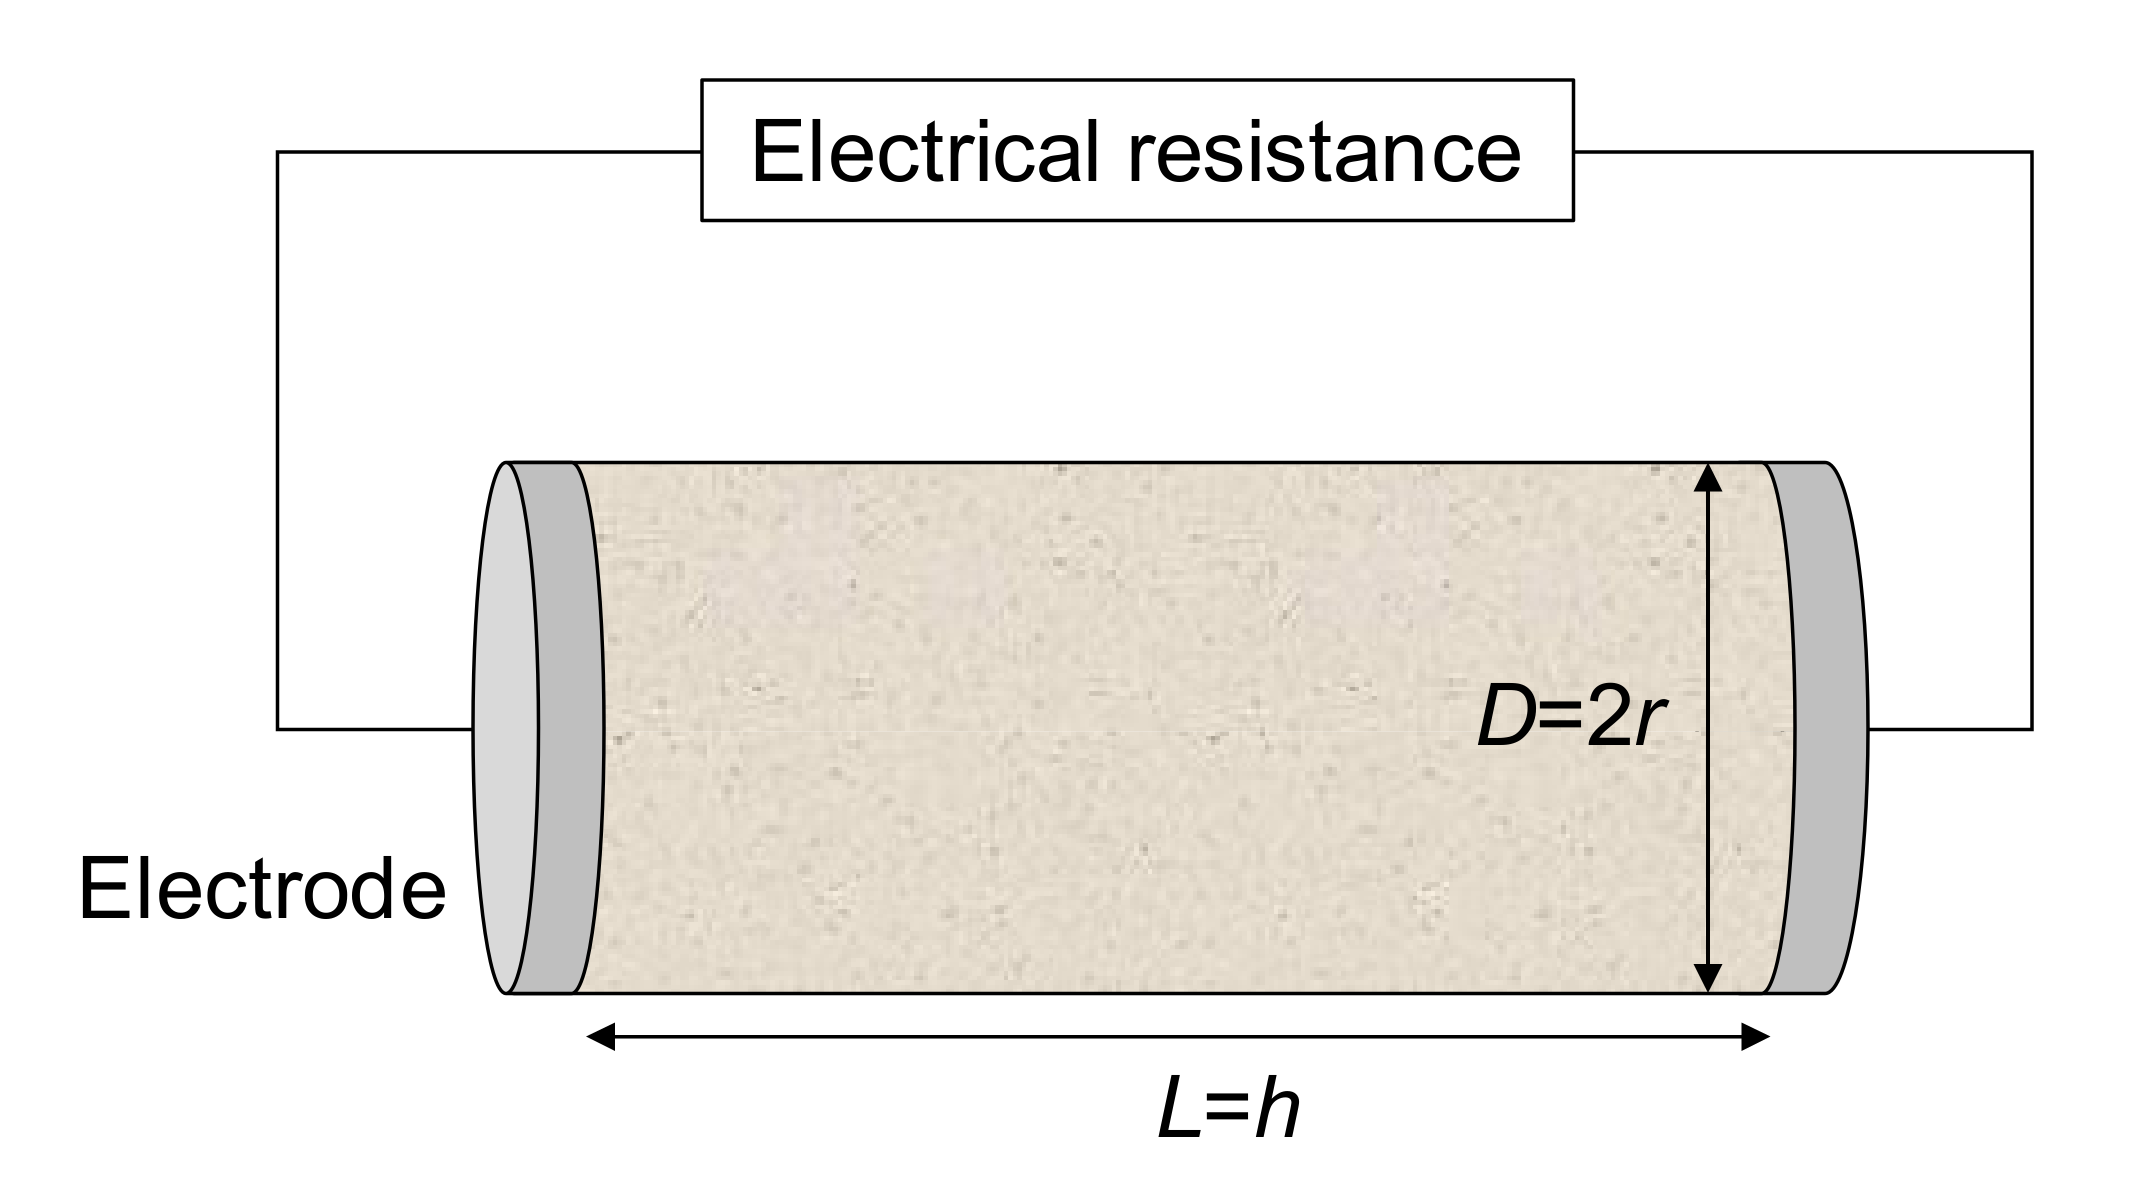
2.1. ASTM Standard for Electrical Resistivity (ASTM G187)

ASTM G187 is the standard method for measuring the electrical resistivity of soil and rock core samples [14]. The standard suggests the use of samples with a uniform sectional area (i.e., cylindrical or blocky samples), and the use of two electrodes with identical cross sections to the sample, as shown in Figure 1. The electrical resistivity of the sample (ρ) can be calculated using the following equation:
ρ = (A/L)R = (πr2/h)R,
where A is the cross-sectional area of the sample, L is the length of sample, and R is the measured electrical resistance. A/L is commonly referred to as the geometric factor for the electrode configuration, and is used to convert the measured electrical resistance to the inherent electrical resistivity. However, the electrical resistivity measurement according to the ASTM standard cannot be used simultaneously with loading tests such as the uniaxial compressive strength test, as both bases of the cylindrical sample are placed on the loading plates. Electrical interference between base electrodes and the metal loading plate can cause inaccurate measurements of both electrical resistivity and uniaxial compressive strength.

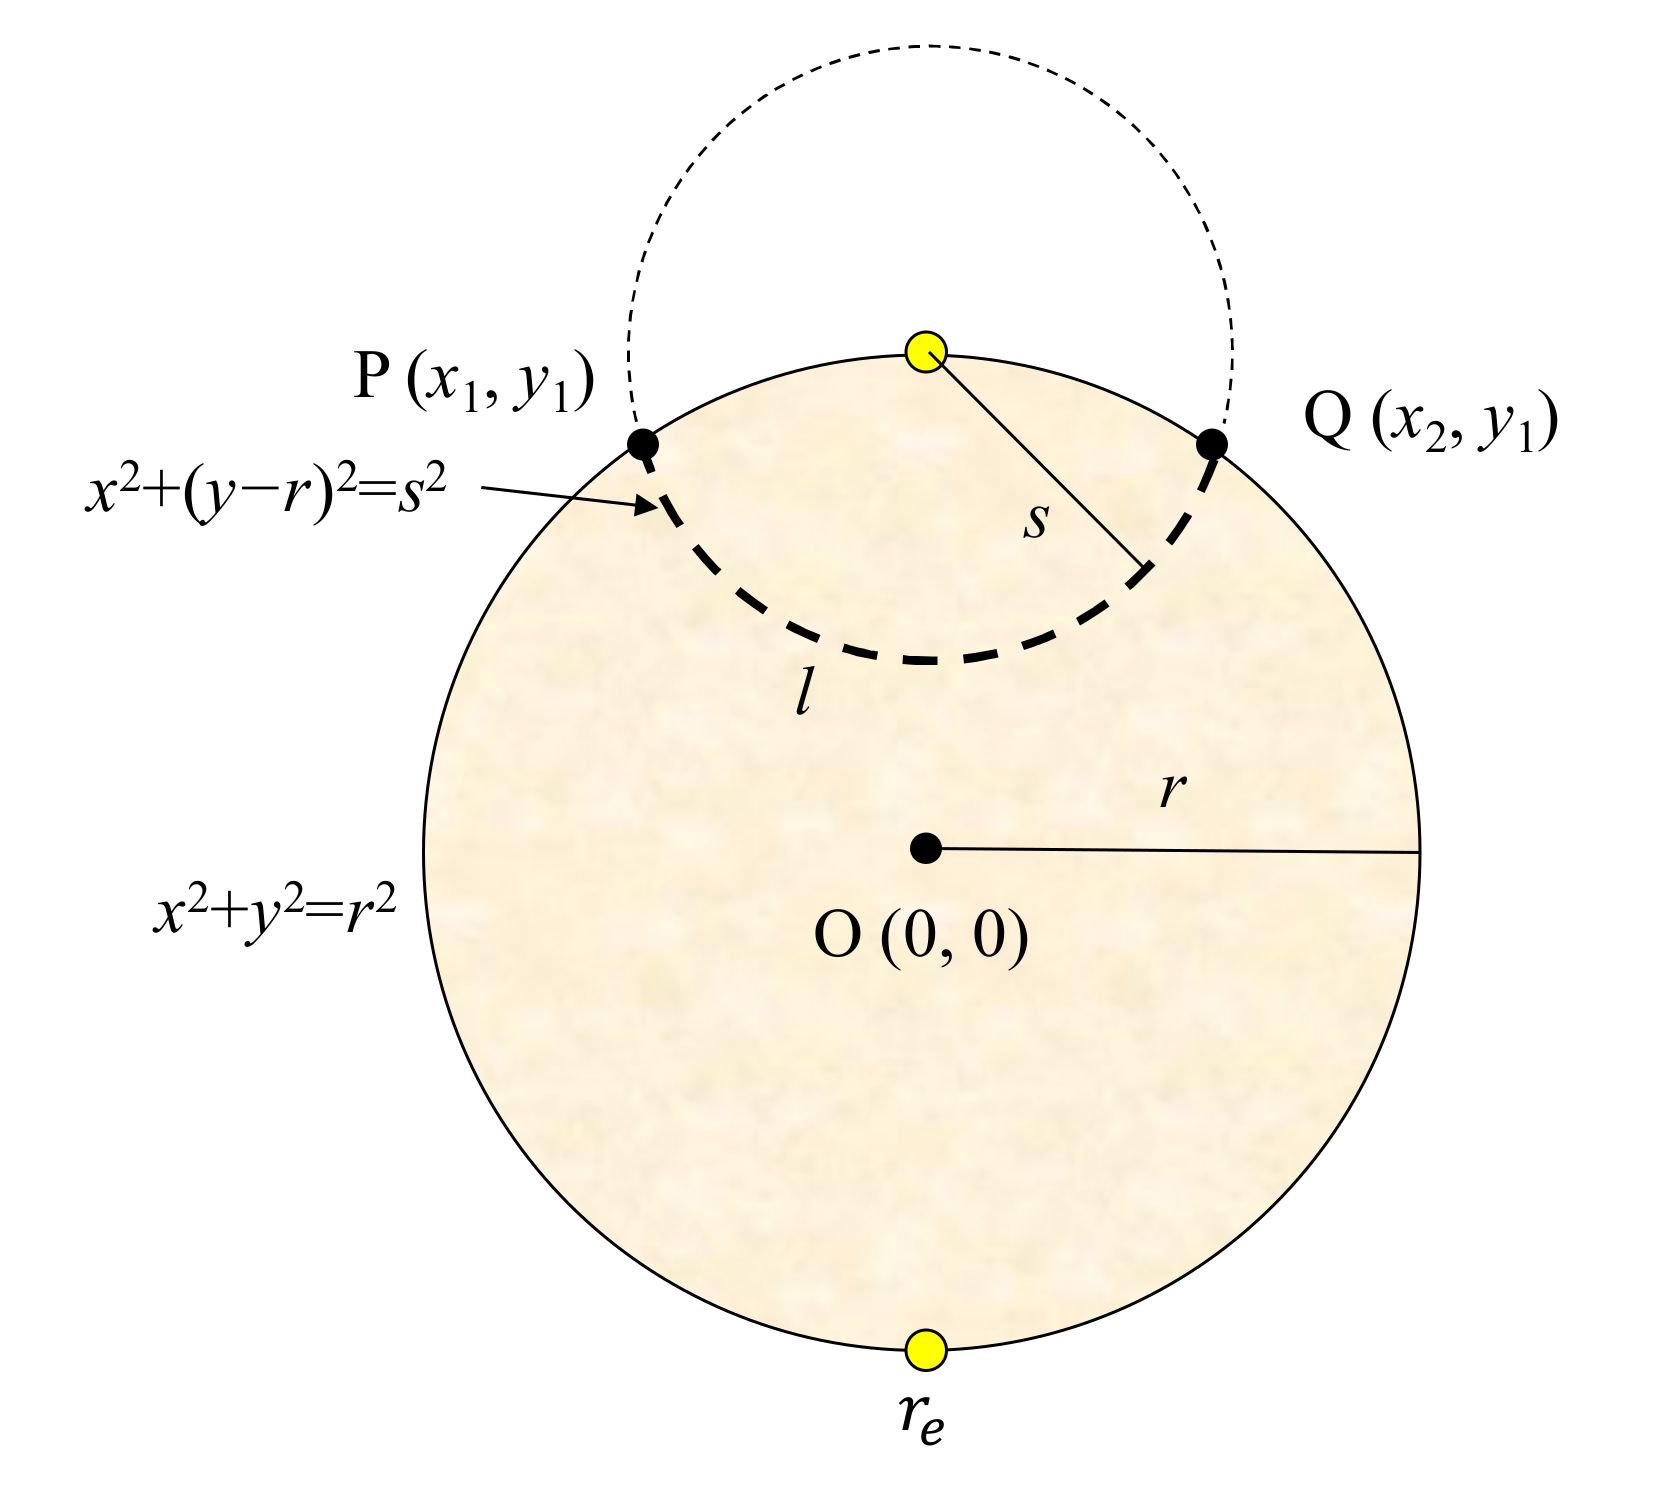
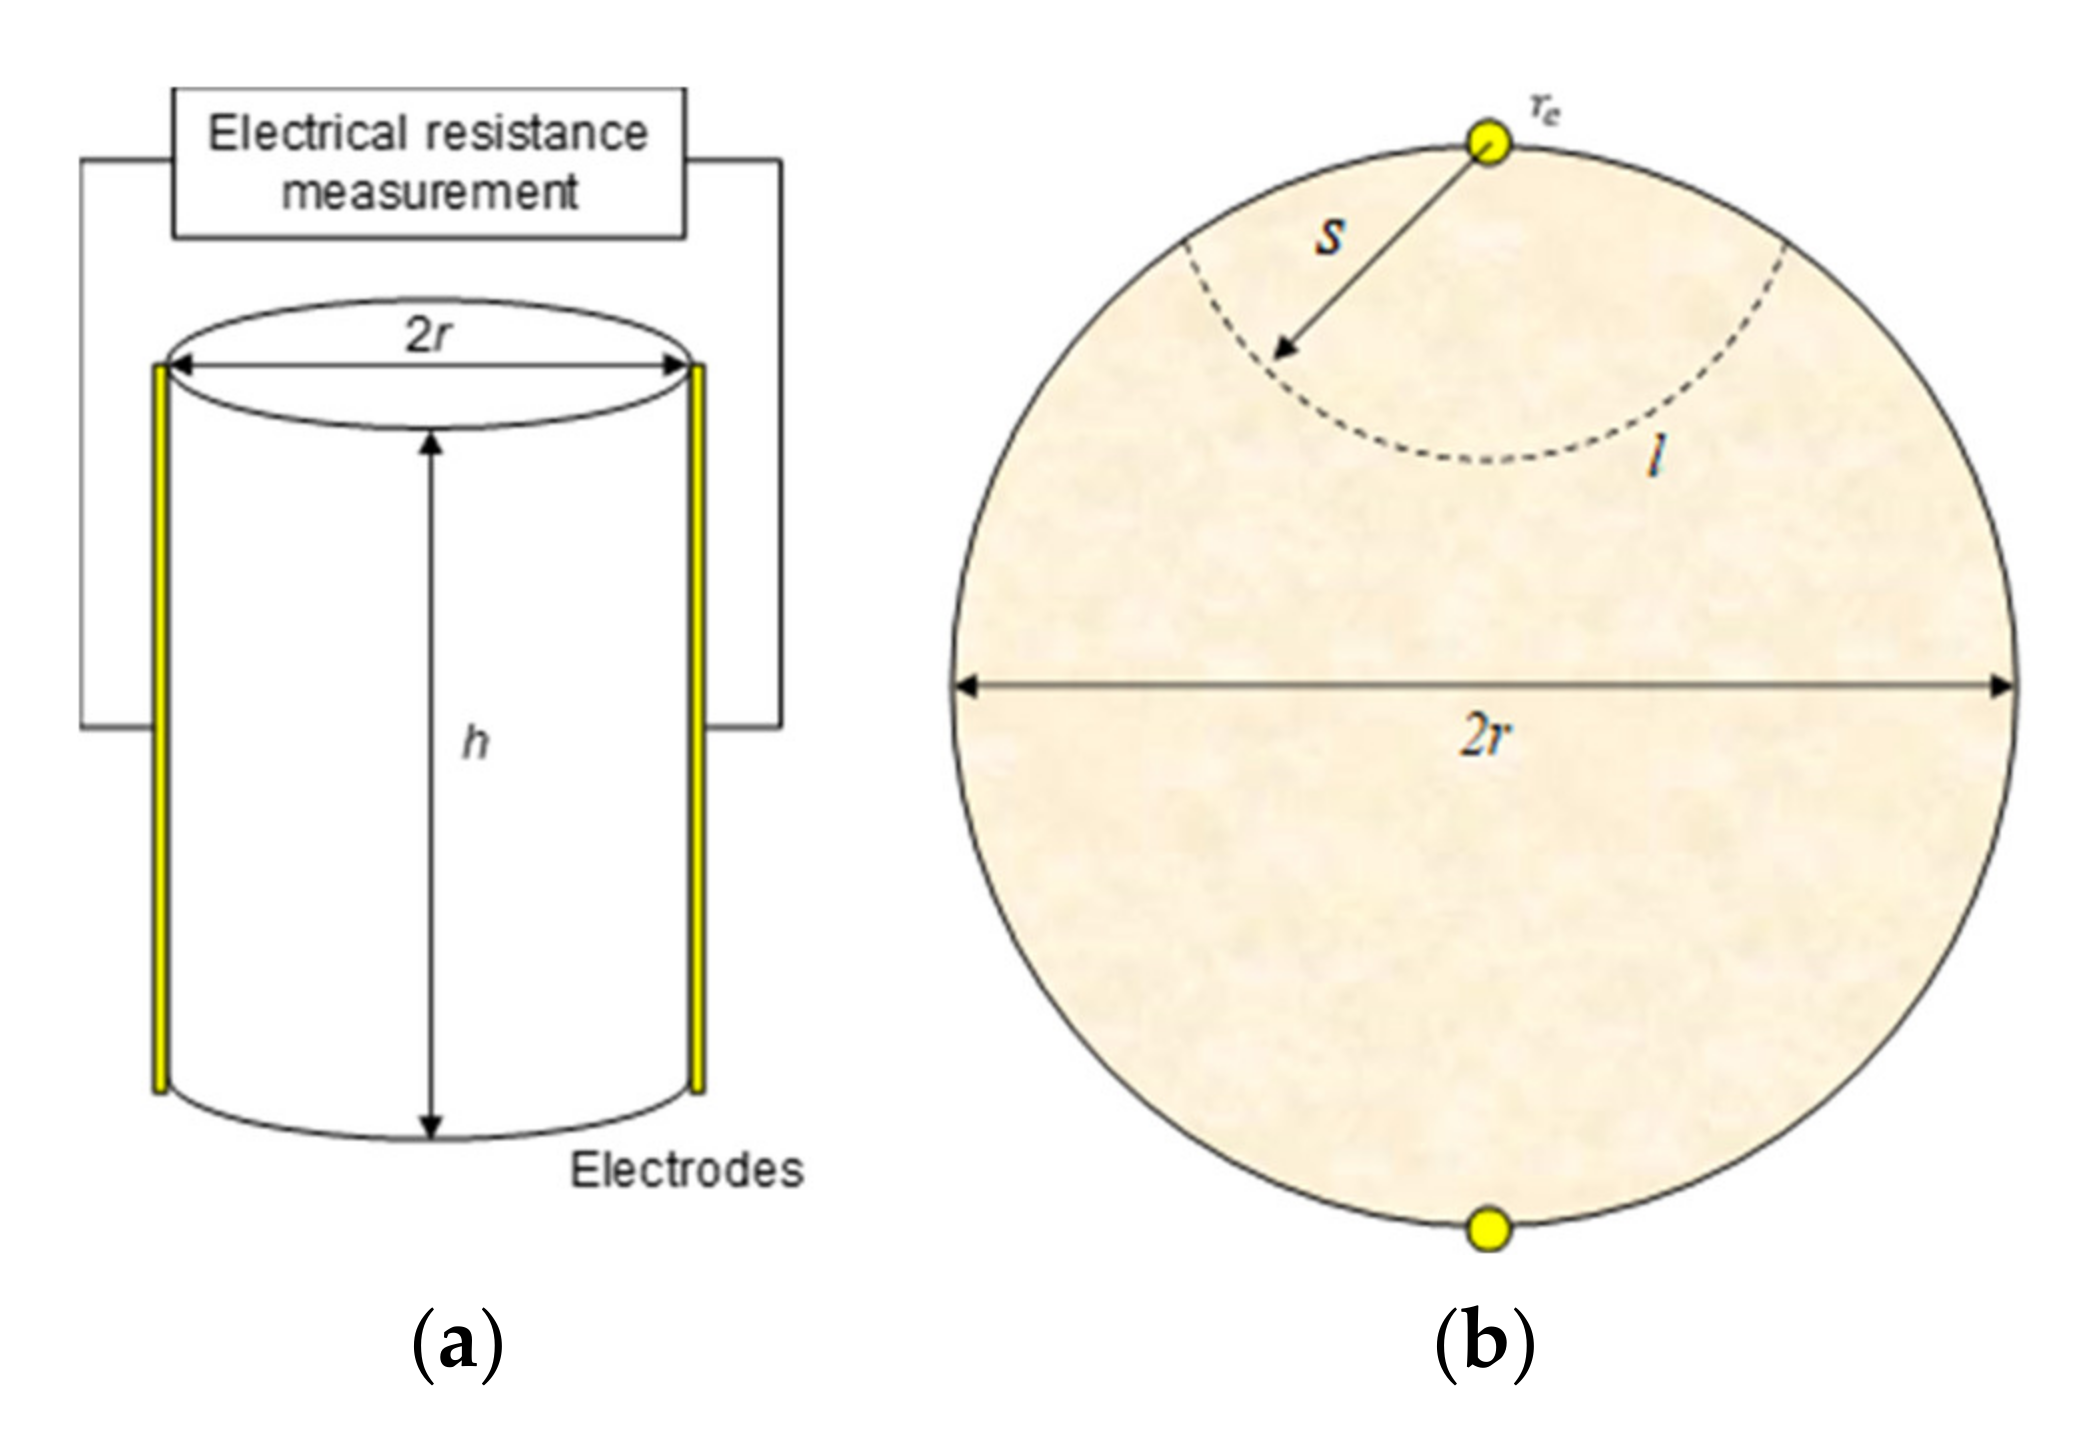
2.2. Electrical Resistivity Measurement with Two Perimeter Electrodes

The perimeter of the sample remains accessible during the uniaxial compressive strength test. The proposed method uses two cylindrical electrodes installed at diametrically opposite locations on the perimeter of a cylindrical sample, as shown in Figure 2a. The cylindrical electrodes have a height equal to the height of the sample (h) and a radius re. The electrical resistivity can be determined by the equipotential surface area, which varies with the electrode geometry and sample dimensions [12]. The equipotential surface area of the core sample measured on the perimeter is lh (Figure 2b). The arc length l is expressed as follows:
l = 2 s sin 1 1 s 2 r 2 ,
where s is the distance from the electrode center to an arbitrary point and r is the radius of the sample. The detailed derivation of l is explained in Appendix A. Note that the assumed equipotential surface line between the two perimeter electrodes is circular and evenly distributed with respect to the distance from the electrodes.
The electrical resistance (Rp) between the cylindrical electrodes on the sample perimeter is expressed as follows:
R p = ρ 1 A ( s ) d s = ρ 2 h r e 2 r r e 1 s sin 1 1 s 2 r 2 d s = ρ 2 h cos 1 r e 2 r cos 1 1 r e 2 r tan θ θ d θ ,
where ρ is the electrical resistivity of the rock sample, A(s) is the equipotential surface area in terms of s, re is radius of the electrodes, and θ is defined as cos−1(s/2r). The electrical resistance (Rp) and geometric factor (αp) between the cylindrical electrodes on the sample perimeter is expressed as follows:
α p = 2 h cos 1 r e 2 r cos 1 1 r e 2 r tan θ θ d θ ,
The negative signs of the electrical resistance and geometric factor will be eliminated as the inverse cosine function exhibits a lower value near unity. General mathematics software such as MATLAB is required to solve Equations (3) and (4), as the indefinite integral tan(x)/x is difficult to be expressed in an intrinsic form.

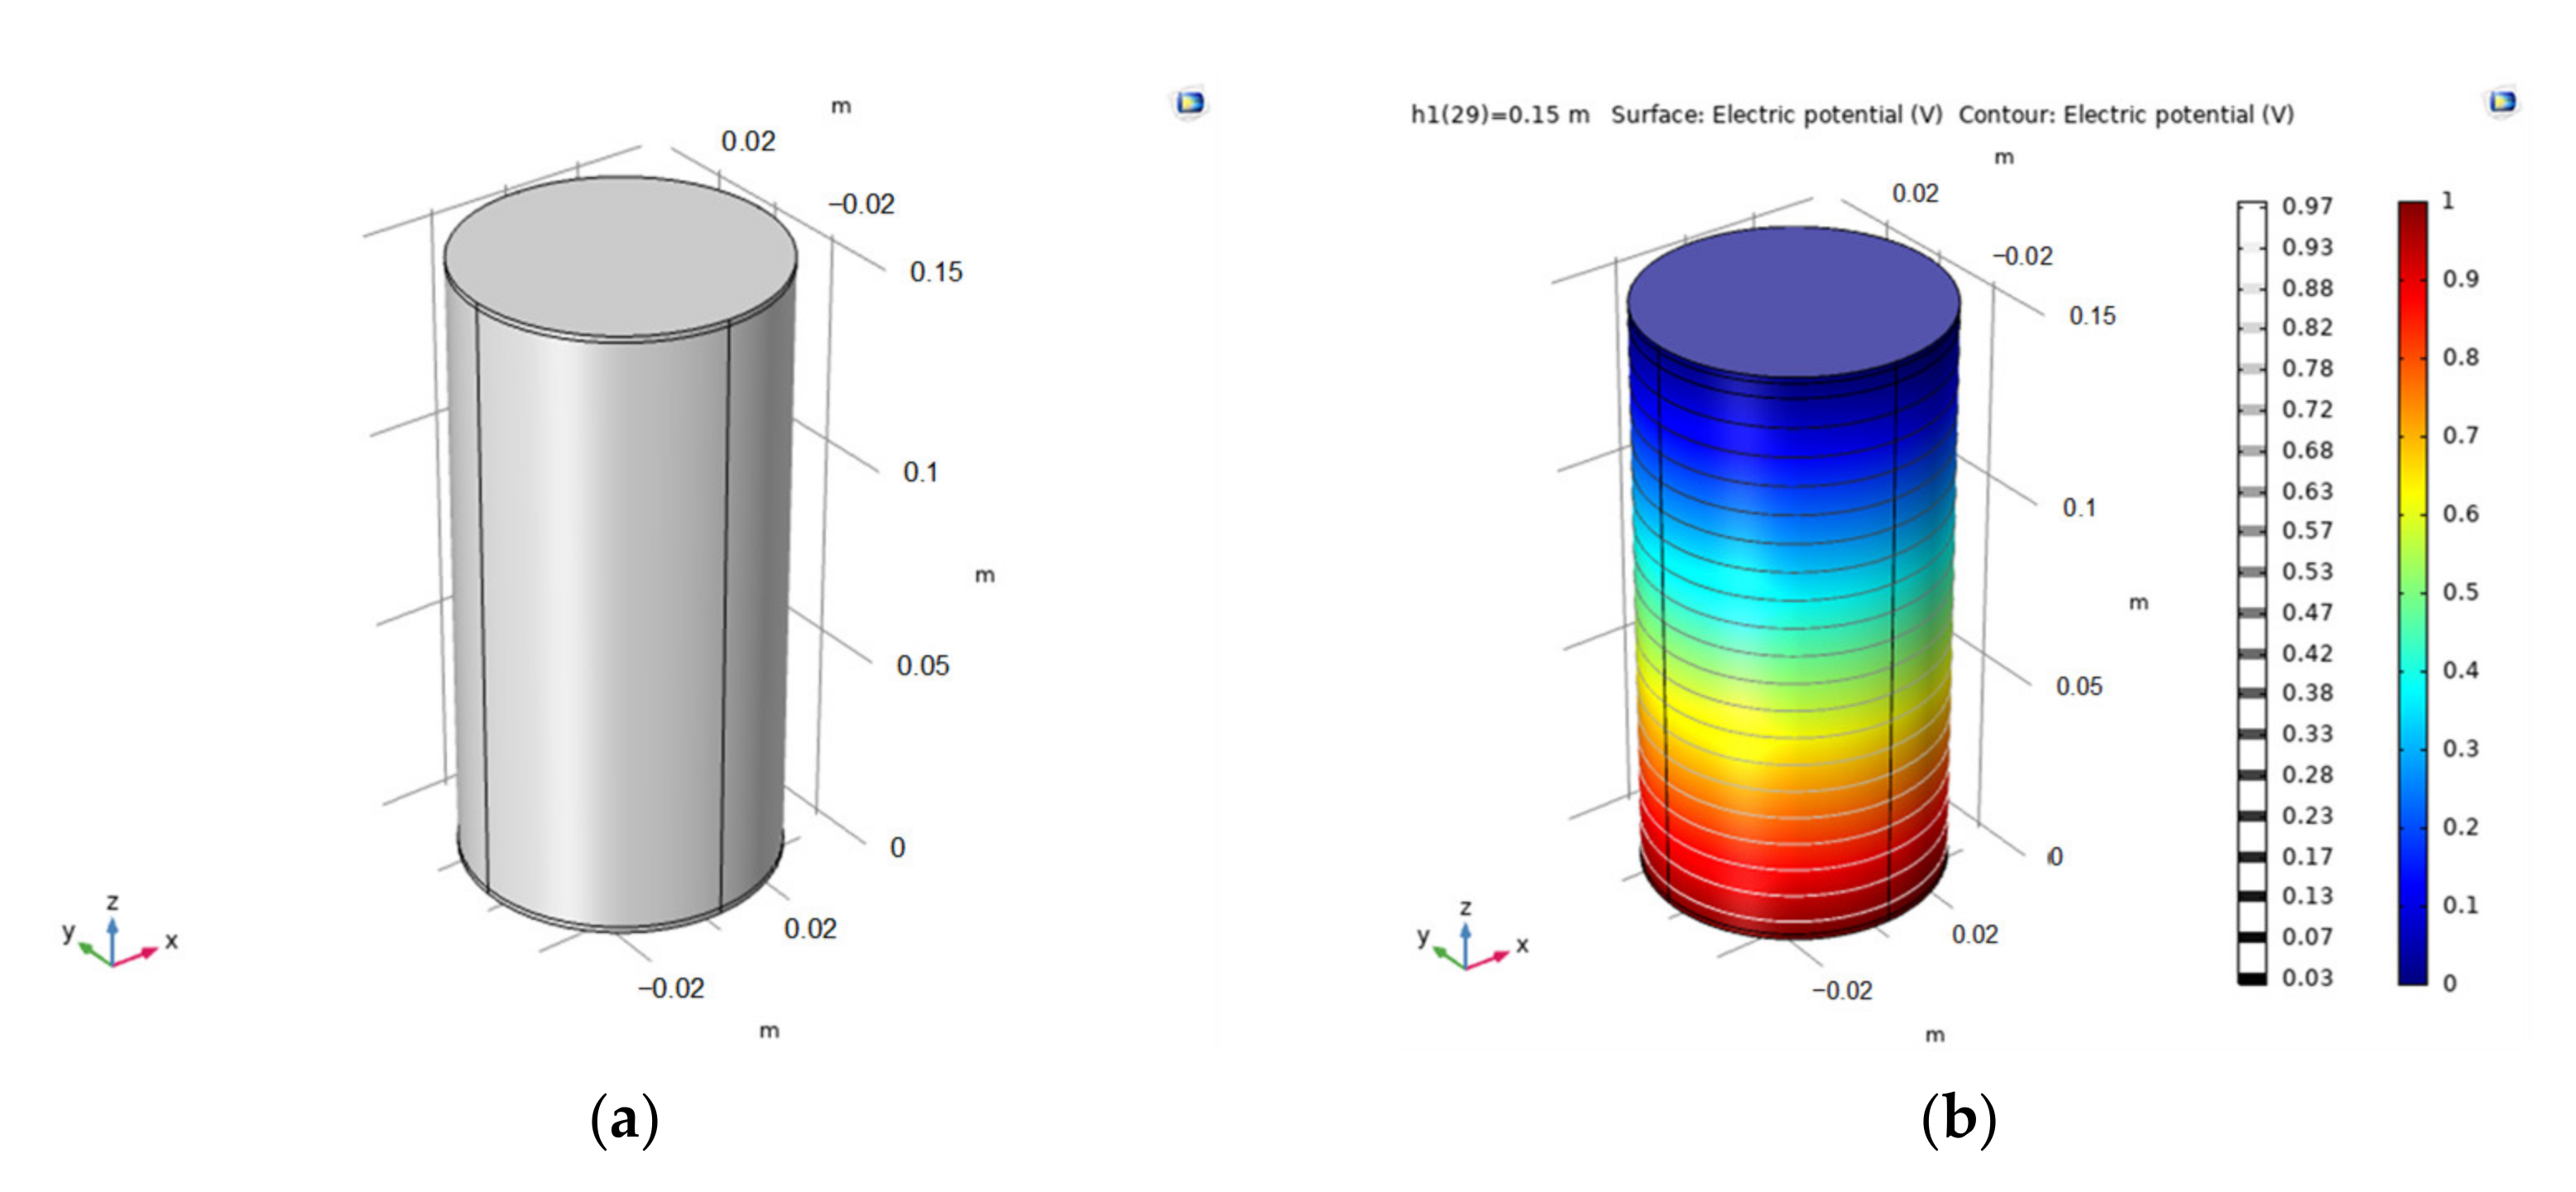
3. Numerical Simulation

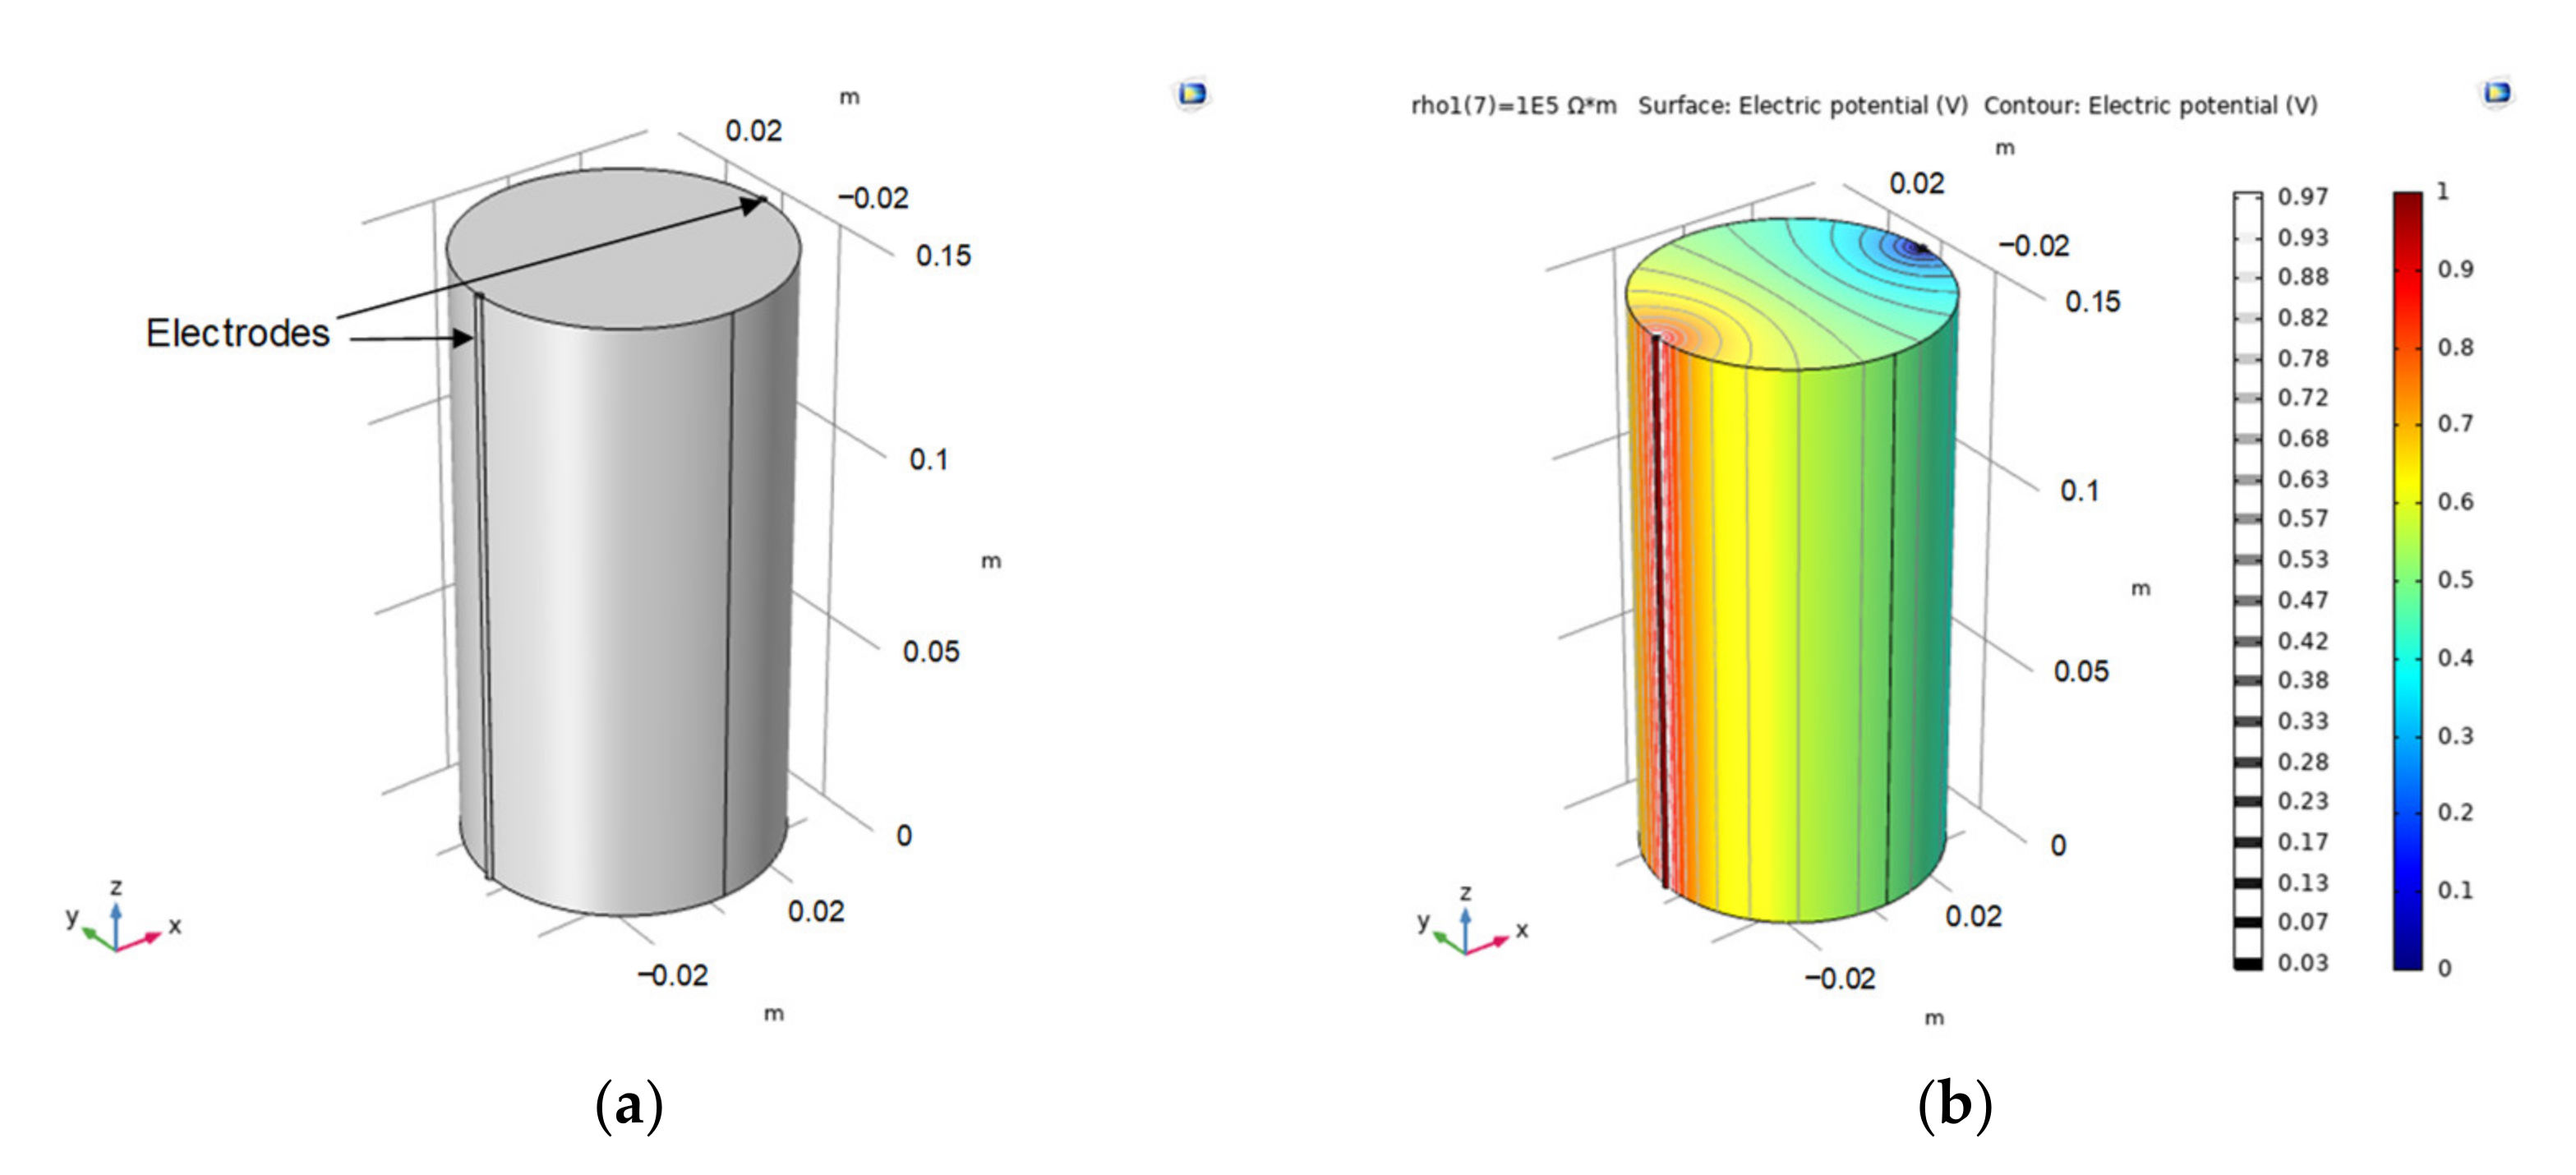
3.1. Simulation Setup

COMSOL MultiPhysics® is an increasingly popular finite element method that has been widely adopted to investigate various electromagnetic phenomena [15,16,17]. COMSOL solves partial differential equations such as Laplace’s equation using finite element theory. In this study, the inherent AC/DC module and auto meshing function are utilized for numerical simulations. An NX-size granite sample with a diameter of 0.076 m and a height of 0.150 m was prepared for the simulation. The auto meshing function in COMSOL was used to create ‘normal’-sized tetrahedral physics-controlled meshes. The electrical resistivity of the sample was input as 10,000 Ω·m, which is representative of granite specimens [18].

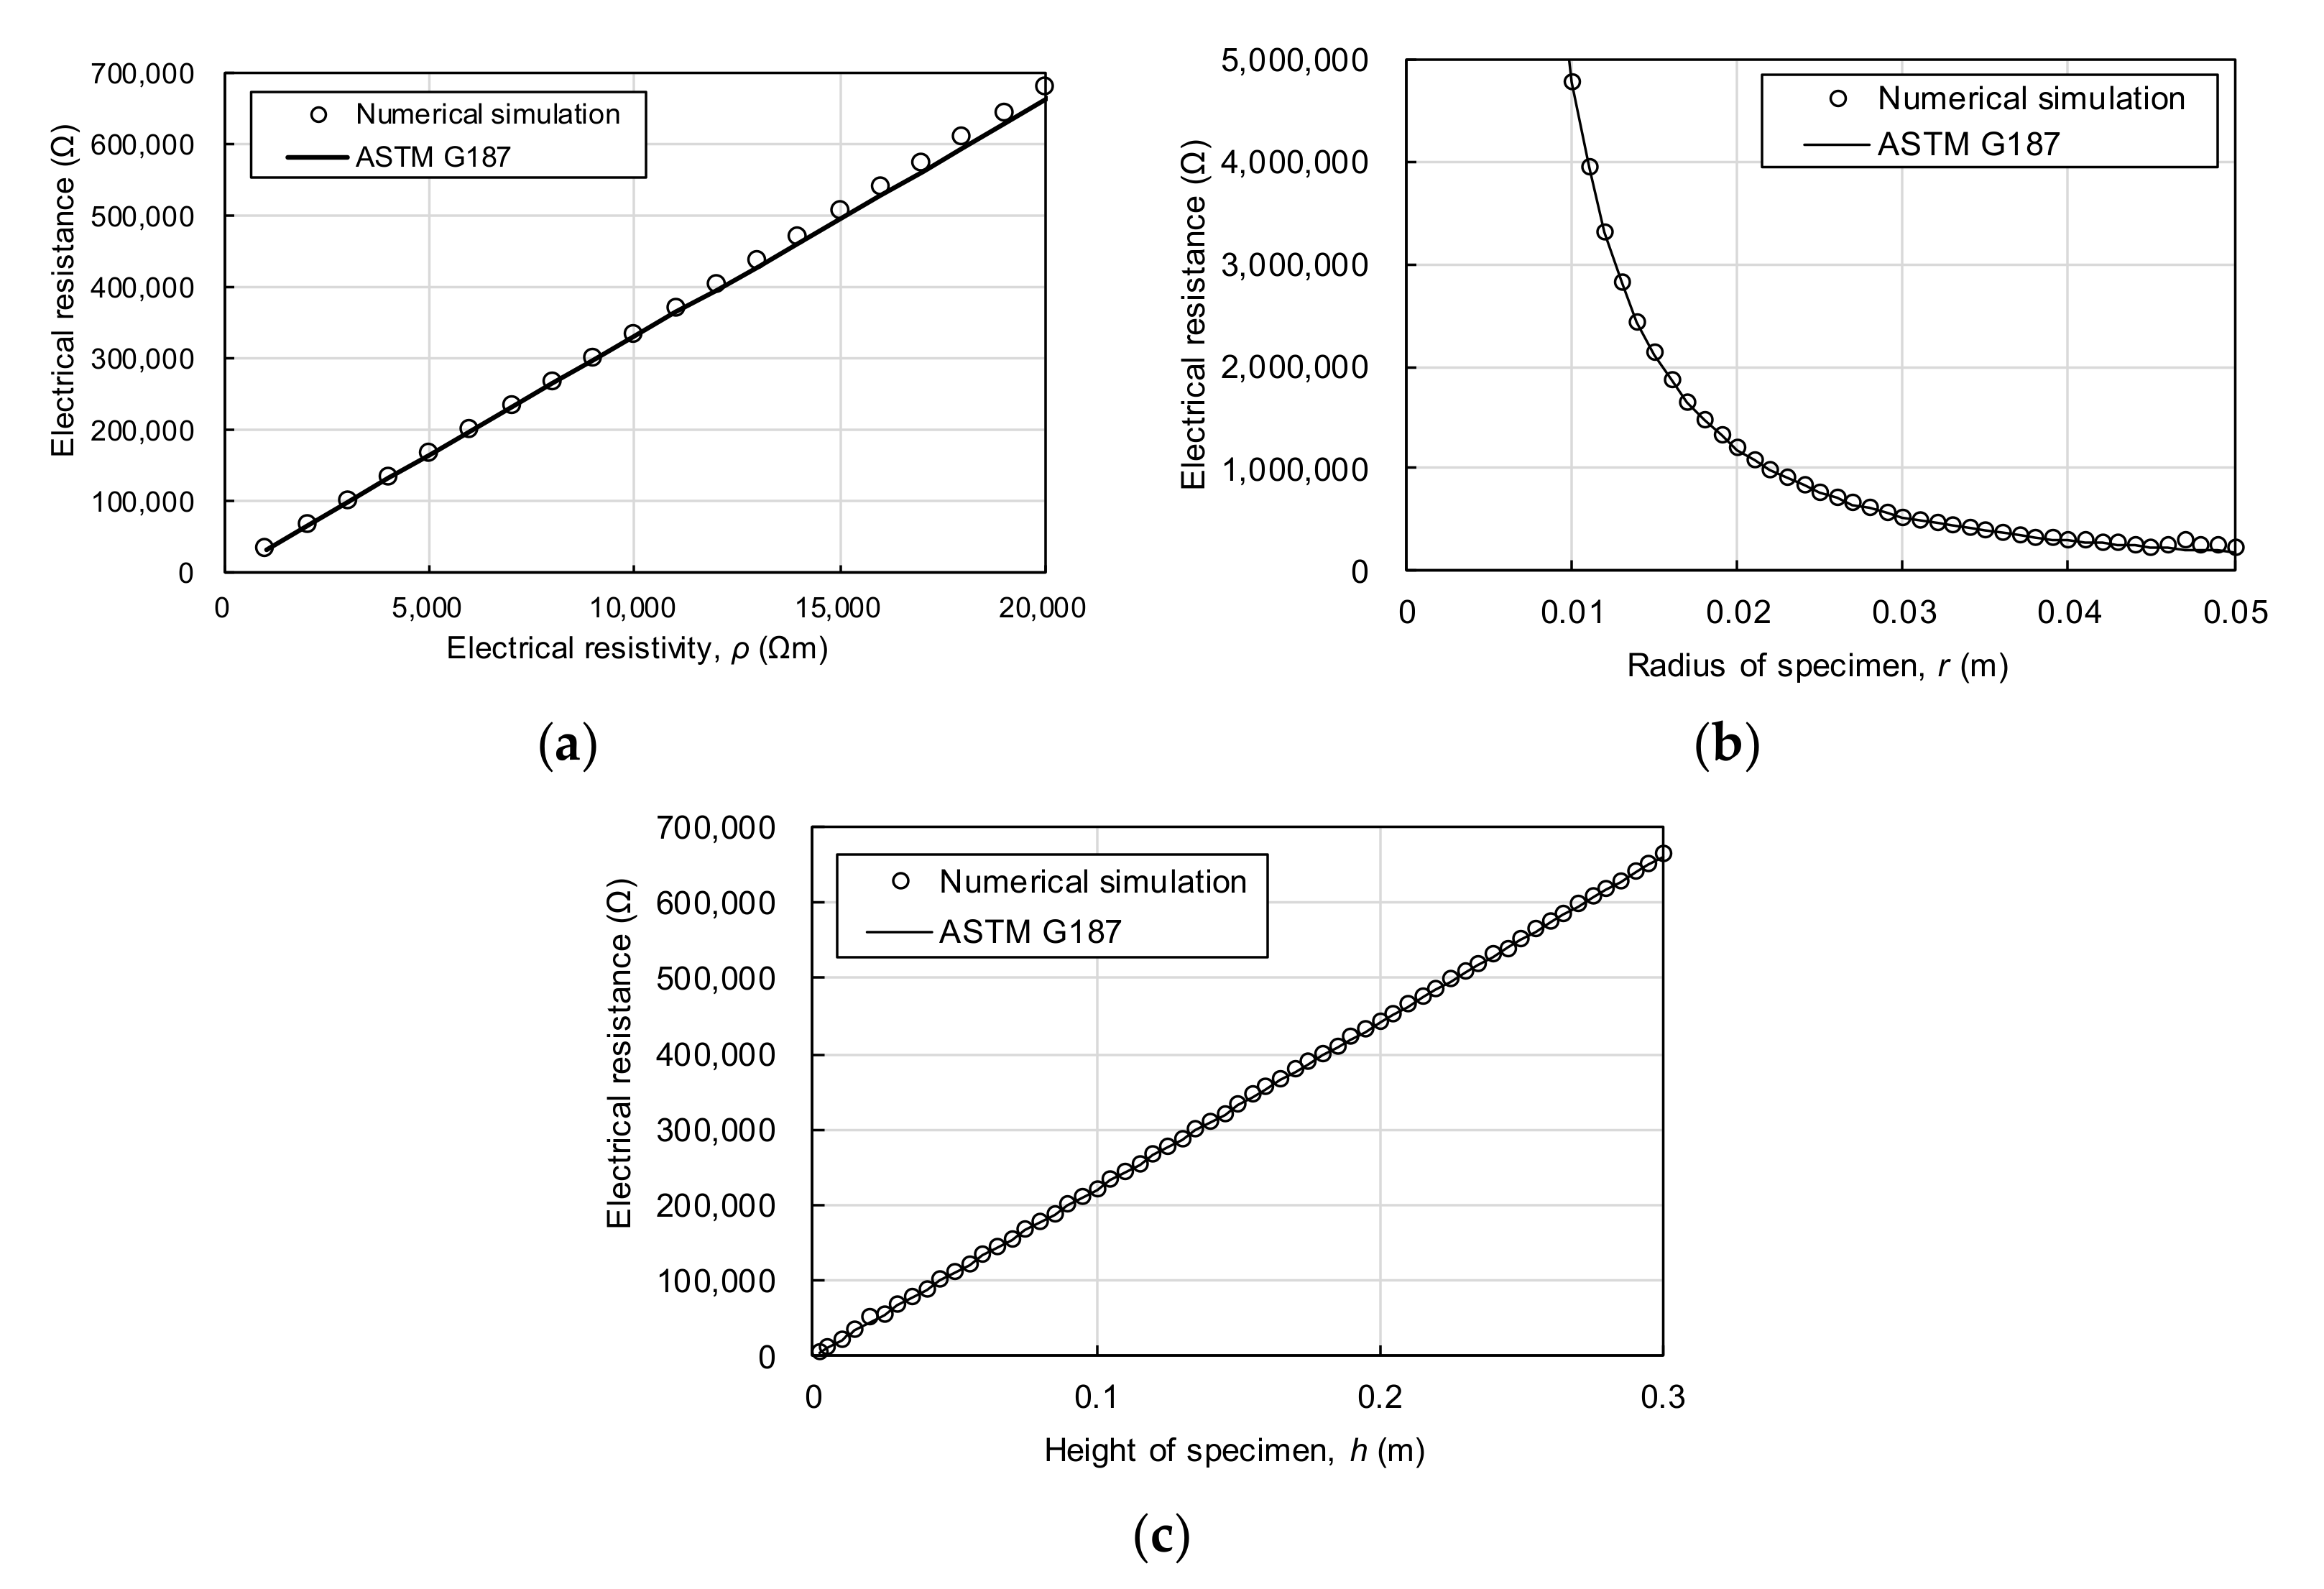
3.2. Verification of the Numerical Simulation Tool with ASTM G187

The ASTM G187 standard method was simulated to verify the accuracy of the numerical simulation tool, as shown in Figure 3. Two stainless steel disk electrodes (SUS304L) of 0.001 m thickness and the same cross section as the sample were modelled and placed on the top and bottom bases of the sample. An electric signal of 1 V was applied at one electrode and the resultant current was measured at the other electrode. The electrical resistance between the two electrodes was calculated by dividing the applied voltage by the resultant current. The electrical resistance between the two disk electrodes was obtained by changing the electrical resistivity, radius, and height of the sample to 1000–100,000 Ω·m, 0.01–0.05 m, and 0.002–0.300 m, respectively. A comparison between the electrical resistivity obtained from the theoretical equation and numerical simulations for different specimen geometries is displayed in Figure 4. The geometric factor derived from the numerical simulation is similar to that of the ASTM G187 standard obtained from Equation (1) for various values of electrical resistivity, specimen radius, and specimen height.

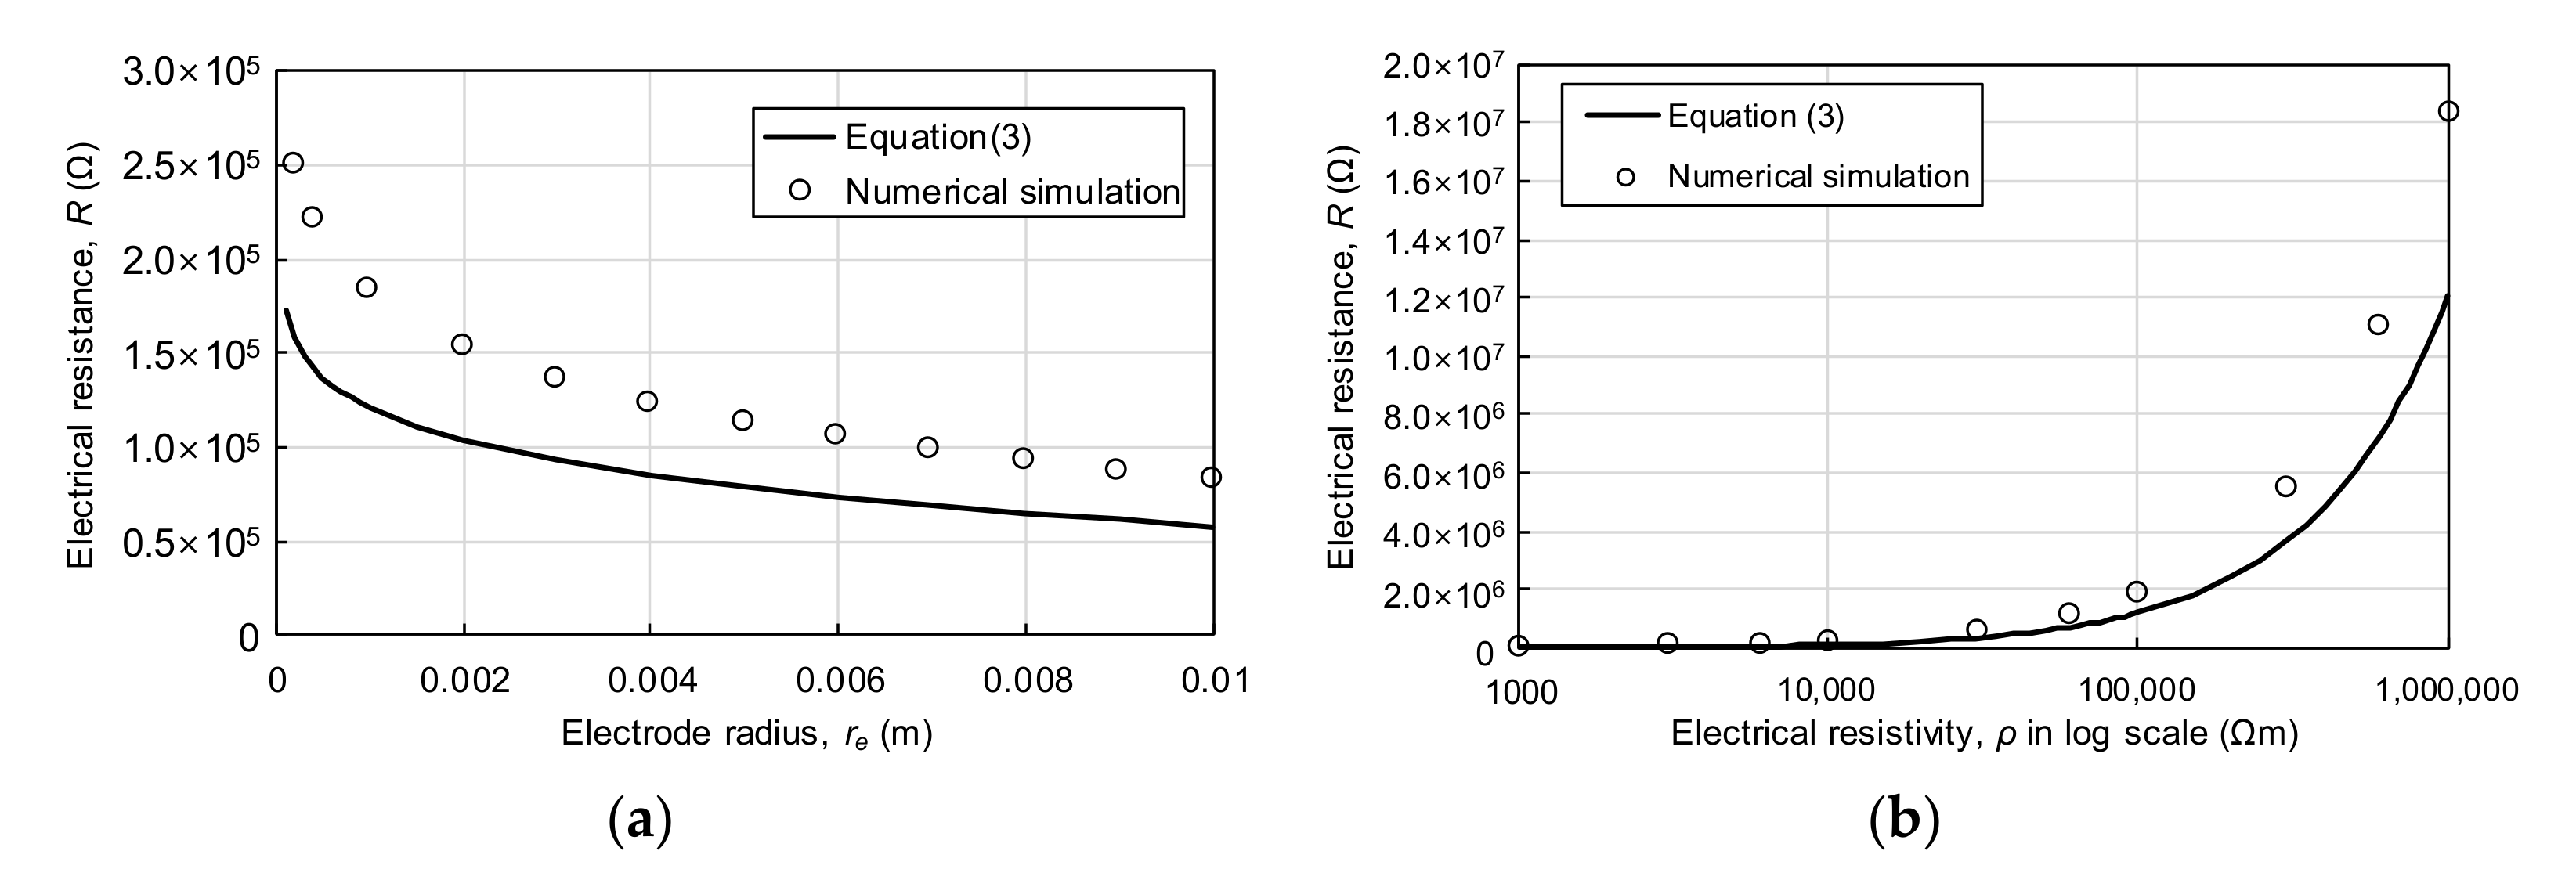
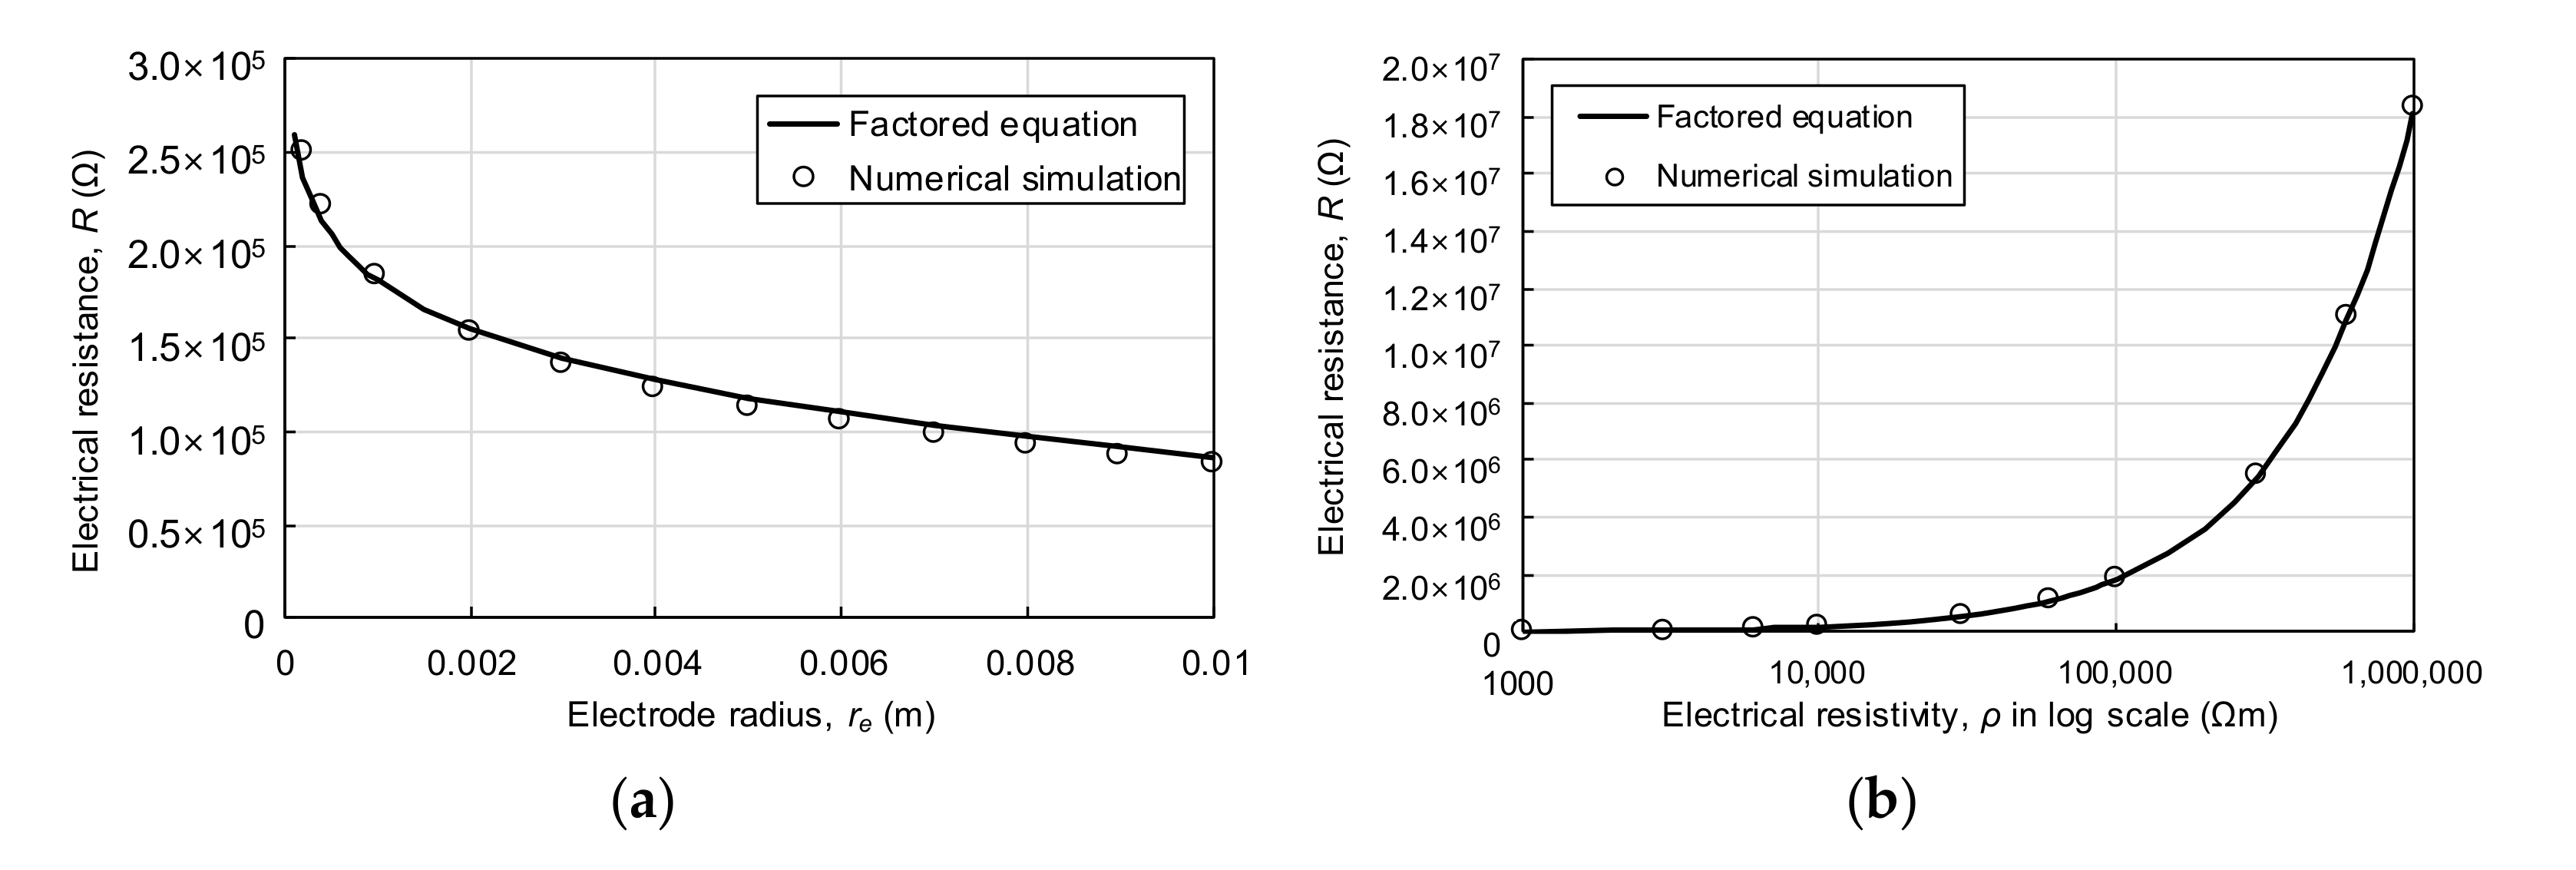
3.3. Verification of the Proposed Method

The same NX-size granite sample was adopted for verification of the proposed method. Two stainless steel cylindrical electrodes (SUS304L) with identical height as the sample were modelled on diametrically opposite positions on the sample perimeter. Circular grooves with a radius equal to the radius of the electrodes re were modelled on the sample perimeter, such that the cylindrical electrodes were in full contact with the sample. The electrical resistivity of the rock sample and re were used to verify the theoretical equation derived for the cylindrical perimeter electrode setup, as displayed in Figure 5. The electrical resistance between the two perimeter electrodes was obtained by changing the electrical resistivity of the sample and radius of the electrodes re to 1000–100,000 Ω·m and 0.001–0.01 m, respectively. The electrical resistance derived in Equation (3) exhibits a similar trend to the electrode radius and the electrical resistivity of the rock sample, as shown in Figure 6. However, large underestimation of the theoretical electrical resistance is observed for smaller electrode radii and larger electrical resistivity. Maximum errors in electrical resistance up to 51.7% for electrical resistivity of the sample and 44.7% for re were noted.

4. Discussion

4.1. Distortion of the Equipotential Surface

The underestimation of the theoretical electrical resistance can be owed to the assumption that the equipotential surface line is evenly distributed with respect to the distance from the electrodes. The limitation of this equidistance assumption and the resulting distortion of the equipotential surface are displayed in Figure 7. The theoretical equipotential surface displays a curved equipotential surface centered at (0, l) when s = √2r. However, the equipotential surface obtained from the numerical analysis displays an equivalent flat equipotential surface of length leq = 2r for the given condition.
Previous studies on electrical impedance tomography (EIT) have noted changes in the electrical field and equipotential surface for different electrode configurations around the perimeter of a circular cross-section [19,20,21]. However, such previous studies are primarily focused on the tomographic results, and the changes in the shape of the equipotential surface have not been adequately modelled. For mathematical simplicity, this study assumed that the equipotential surface follows a circular shape. This assumption allows the longest equipotential length and the most electrical current flow between two electrodes, resulting in reduced electrical resistance. Hence, the theoretical equation introduces a lower bound for the electrical resistivity of the cylindrical sample, and the change in curvature of the equipotential surface needs to be corrected for accurate measurements.
A distortion factor is applied to compensate the equipotential surface distortion. The distortion factor can be quantified with the shape of the equipotential surface formed by the potential difference between the two electrodes. Formal inversion was used to find the best fitting distortion factor. For the given geometric condition where the cylindrical electrodes are installed on the perimeter of the cylindrical sample, a distortion factor of 1.5 is applied to fit the theoretical electrical resistance to the numerical simulation results. The multiplication of the distortion factor results in a near exact fit between the electrical resistances obtained from the theoretical equation and numerical simulation, as shown in Figure 8. The nature of the distortion factor is yet unclear and further studies on the equipotential surface distortion depending on the position of the perimeter electrodes, as well as their respective distortion factors, need to be investigated.

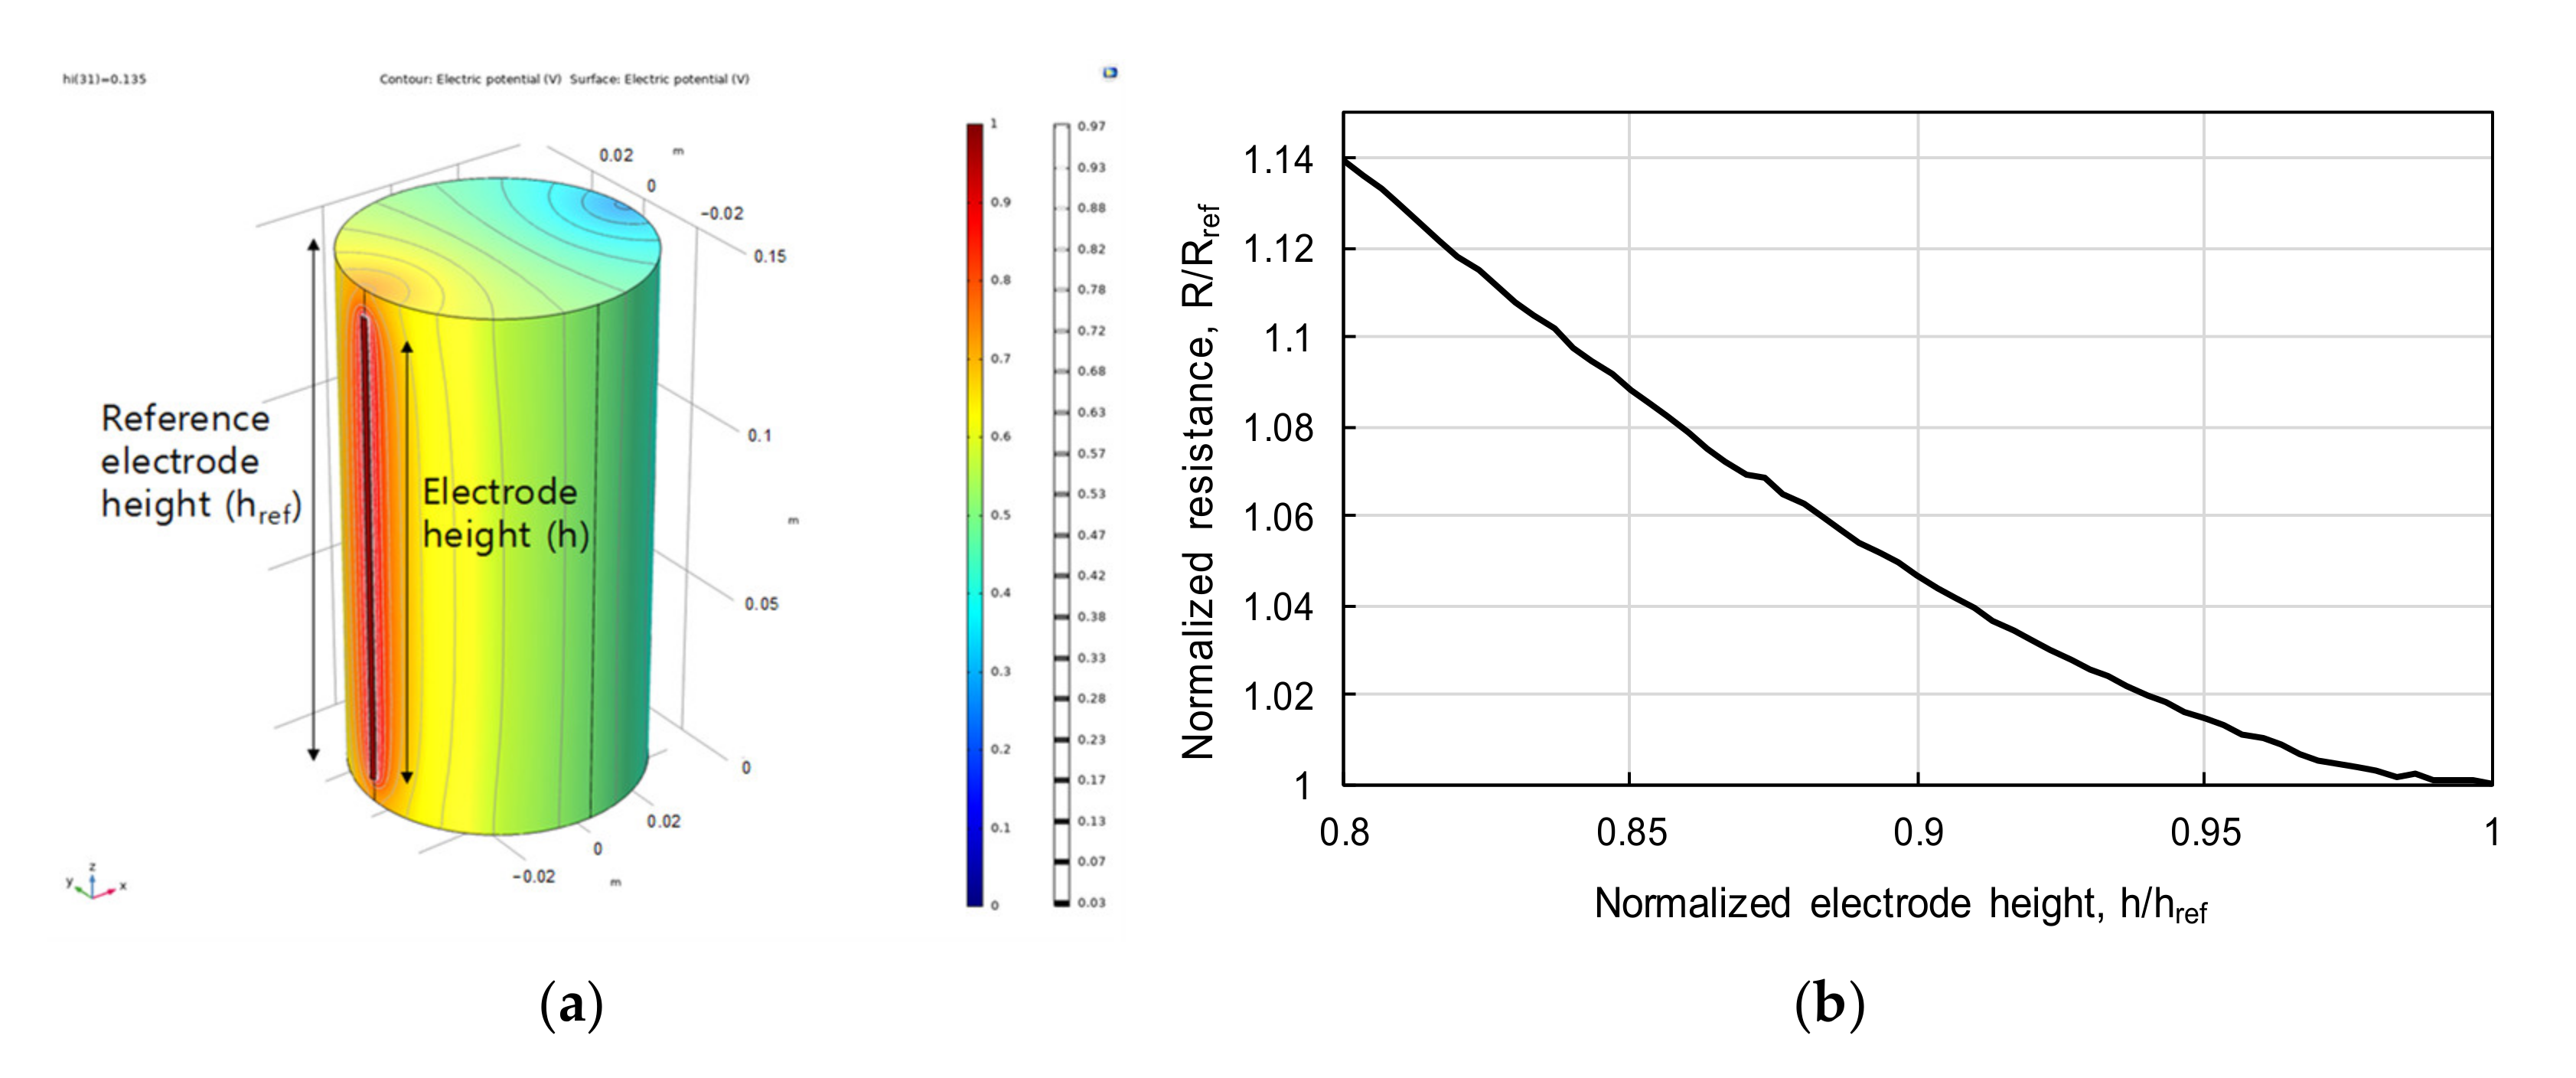
4.2. Effect of Electrode Length

The cylindrical electrodes installed on the perimeter of the cylindrical sample can affect the uniaxial compressive strength measurements, as the stiffness of the metal electrodes is generally greater than that of the rock sample. Numerical studies were conducted for different electrode heights with references to the height of the sample to evaluate the effects of electrode length. The resultant electrical resistance increases as the electrode length (h) decreases, owing to the reduced contact area between the electrode and the sample. The reference electrode height was set as 0.15 m, identical to the sample height, and the reference resistance is the electrical resistance measured using the reference electrodes (Figure 9a). When the length of the electrode is shortened by 5%, the measured electrical resistance increases by 1.5%, as shown in Figure 9b. For uniaxial compressive tests where the maximum strain of the sample is generally less than 5%, the use of electrodes shorter than 5% of the sample height can be adopted with minor errors in the measured resistance.

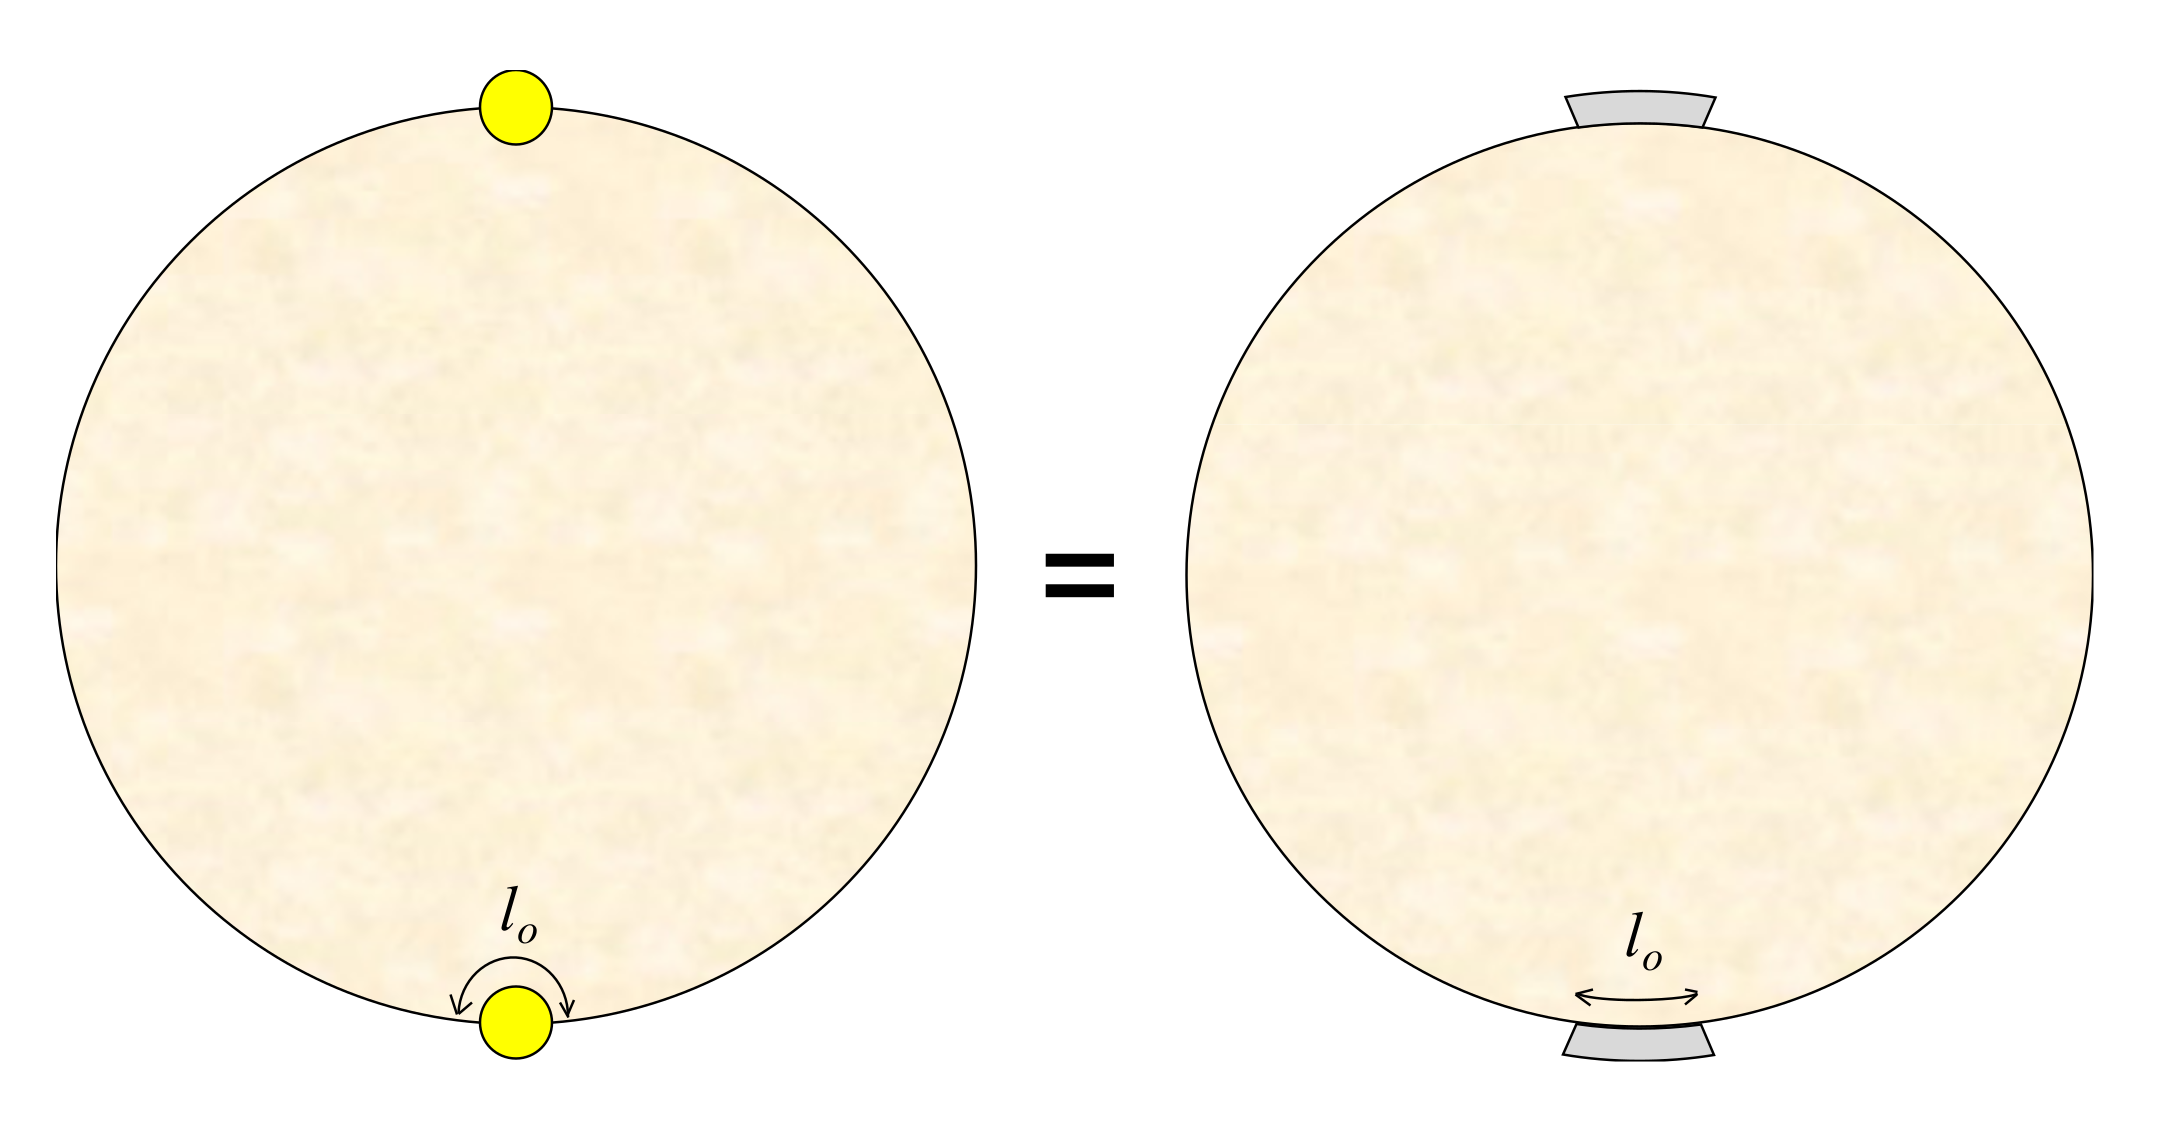
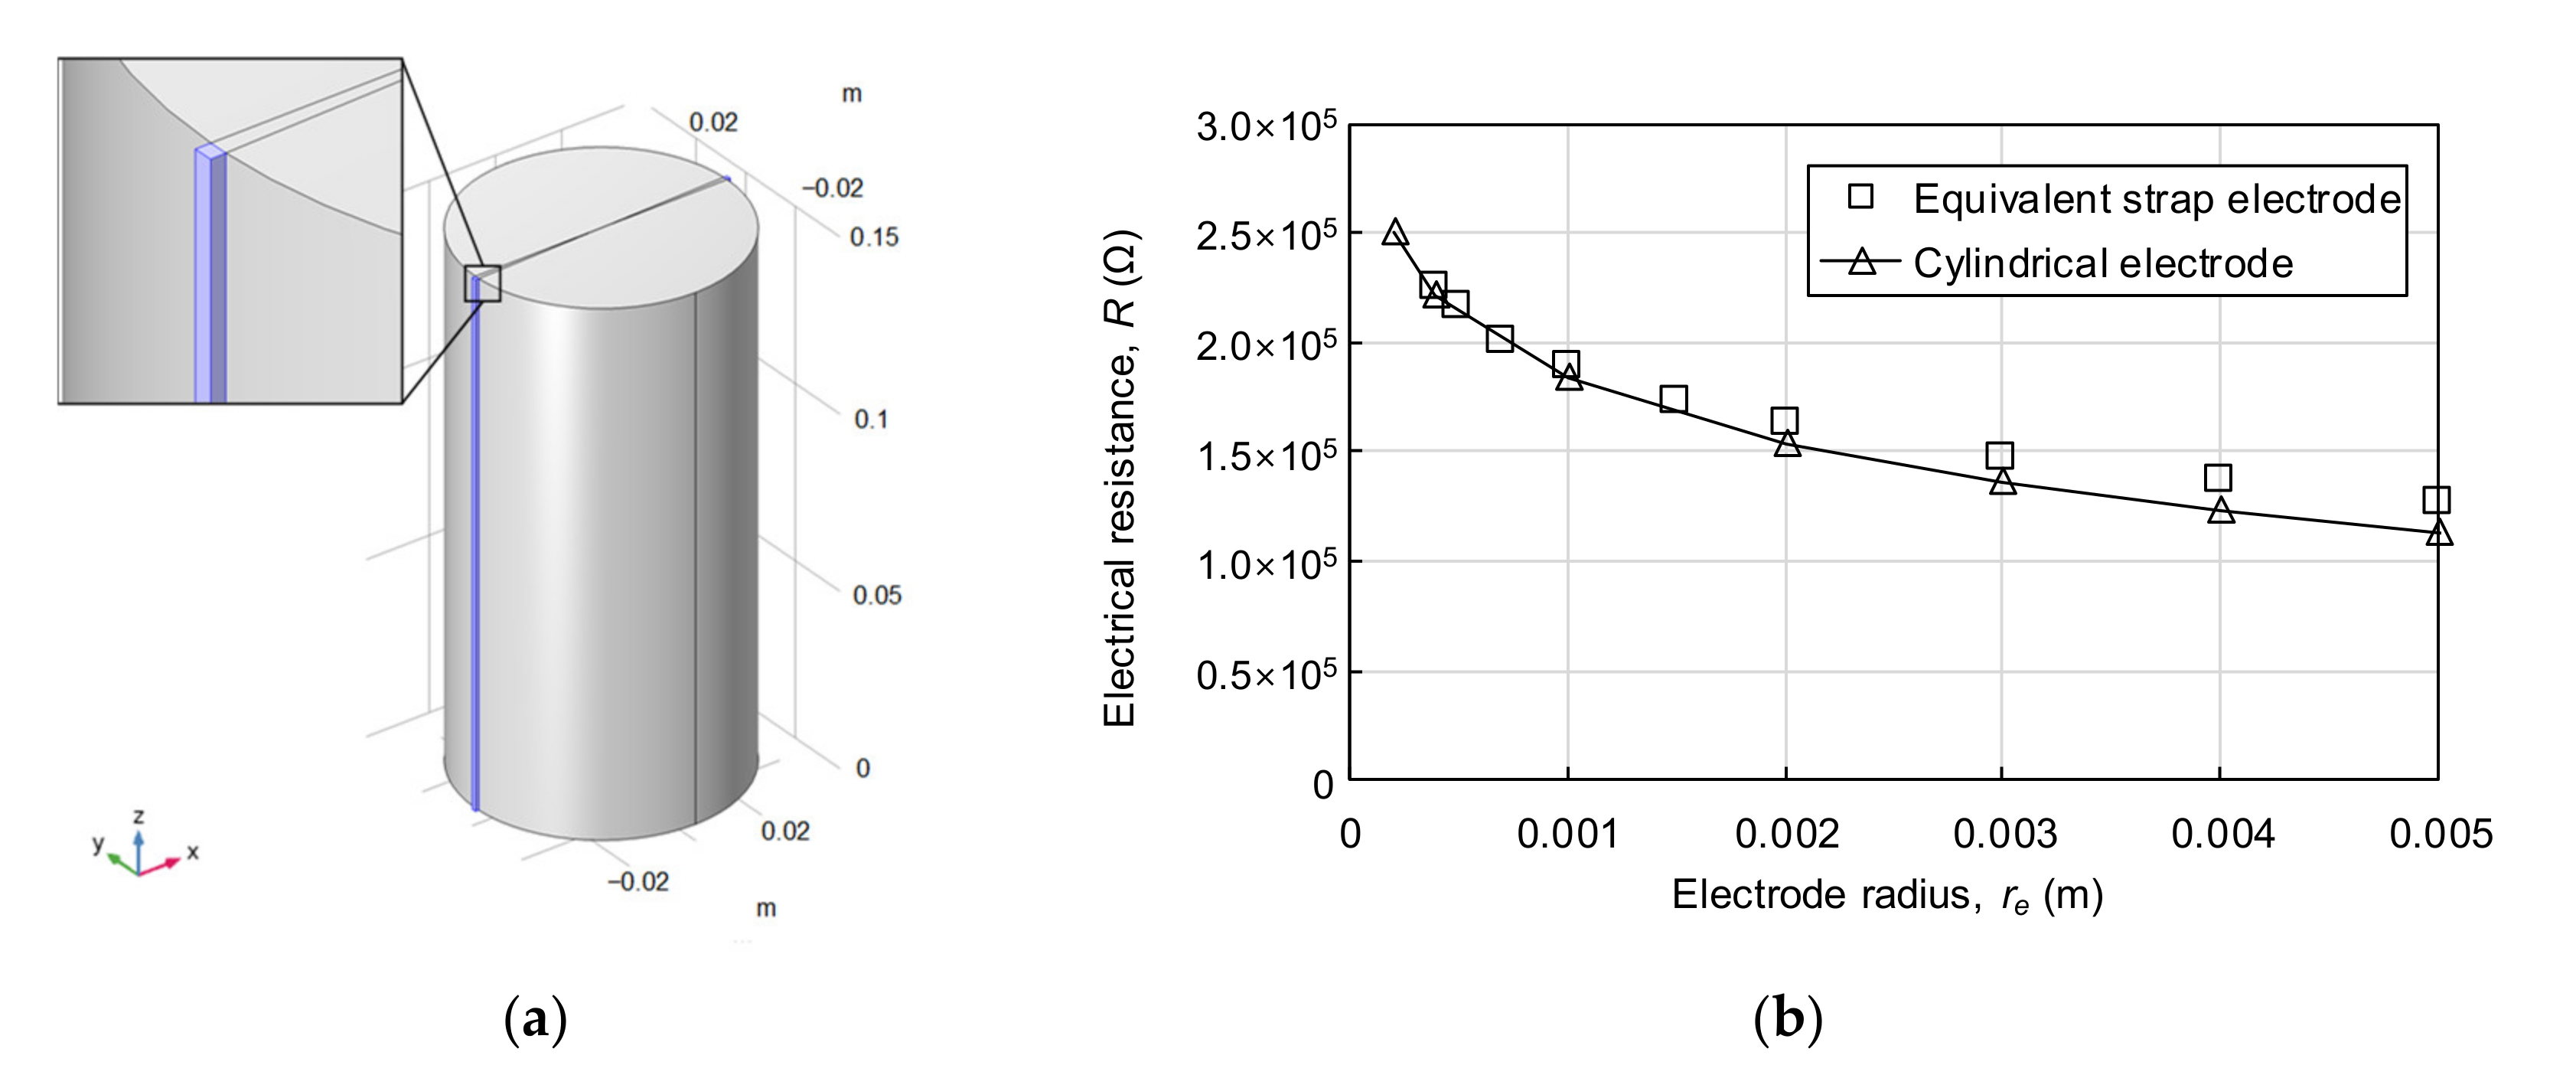
4.3. Equivalent Strap Electrode

The proposed test method is limited by the installation methods required for the cylindrical perimeter electrodes. For realistic experimentation, two grooves should be carved on the perimeter of the sample for the placement of cylindrical electrodes. This direct method requires additional work on the sample and has the potential for sample disturbance and the creation of microcracks, which affect the contact area between the electrode and the sample as well as the overall integrity of the sample. Hence, an equivalent electrode was investigated and employed for the simplification of the proposed equation and experimental convenience.
Strap-shaped electrodes can be easily installed on the sample surface using non-conductive adhesives placed on top of the electrodes, and the concise contact surface area can be obtained. The contact area of the cylindrical electrode is proportional to the arc length of the electrodes as the height is fixed (Figure 10). The contact arc length of the equivalent strap electrode (lo) can be expressed using Equation (5):
l o = 2 r e sin 1 1 r e 2 r 2 ,
An equivalent strap electrode is modelled using COMSOL and the electrical resistance from the cylindrical electrodes and equivalent strap electrodes are compared for various electrode radii in Figure 11. The results indicate that the measured electrical resistance for the cylindrical and equivalent strap electrodes are similar for small electrode radii, with the difference in measured electrical resistance increasing for increasing electrode radius. The numerical simulation results indicate that the equivalent strap electrodes can be used to replace the small diameter cylindrical electrodes for small electrode radii.

5. Conclusions

In this study, an alternative method for the estimation of electrical resistivity was proposed for cylindrical rock samples under confined conditions. The theoretical equation for the cylindrical electrodes on the perimeter of the rock sample was obtained from the equipotential surface area depending on the rock core geometry. Finite element simulations were conducted with COMSOL MultiPhysics® to verify the derived theoretical equation, and the ASTM G187 standard testing method was used to validate the numerical simulation tool. The estimated electrical resistance using the proposed theoretical equation for the two cylindrical electrodes on the sample perimeter was compared with the electrical resistance obtained from numerical simulation. The numerical simulation results displayed a larger electrical resistance compared to the theoretical value for smaller electrode radius and larger electrical resistivity. The underestimation of the theoretical electrical resistance can be owed to the assumption that the equipotential surface is evenly distributed with respect to the distance from the electrodes. This assumption computes a longer theoretical equipotential length compared to the phenomenological results, resulting in more electrical current flow between two electrodes and reduced electrical resistance. Hence, the theoretical equation introduces a lower bound for the electrical resistivity of the cylindrical sample. The application of a phenomenological distortion factor to correct the assumed equidistant equipotential surface resulted in a near exact fit between the numerical simulation results and the theoretical equation. The effects of the electrode length and equivalent strap electrodes were investigated to assess the applicability of the suggested method for laboratory testing. The results indicated that a 5% decrease in electrode height results in small error for the measured electrical resistance with minimal effects on the measurement of uniaxial compressive strength. In addition, equivalent strap electrodes can also be used to replace small diameter cylindrical electrodes for small electrode radii. The main result of this study highlights a method for computing the theoretical lower bound electrical resistance of a cylindrical rock sample. The results of this study can be used as an effective alternative method for electrical resistivity estimation of confined cylindrical rock core sample when the installation of base electrodes is infeasible.

Author Contributions

Conceptualization, C.-H.H., J.-S.K., and S.-H.C.; methodology, C.-H.H. and J.-S.K.; software, J.-W.K., C.-H.H., and J.-S.K.; validation, J.-W.K. and C.-H.H.; formal analysis, C.-H.H., J.-S.K., and S.-H.C.; investigation, J.-W.K.; resources, J.-W.K.; data curation, J.-W.K. and C.-H.H.; writing—original draft preparation, J.-W.K., C.-H.H., and S.-H.C.; writing—review and editing, J.-W.K., C.-H.H., J.-S.K., and S.-H.C.; visualization, J.-W.K.; supervision, S.-H.C.; project administration, J.-S.K. and S.-H.C.; funding acquisition, J.-S.K. and S.-H.C. All authors have read and agreed to the published version of the manuscript.

Funding

This research was mainly supported by the Nuclear Research and Development Program of the National Research Foundation of Korea (No. 2020 M2C9A1062949) grant funded by the Minister of Science and ICT. Additionally, the corresponding author was supported by a National Research Foundation of Korea (NRF) grant funded by the Korean government (No. 2021R1C1C1006003).

Institutional Review Board Statement

Not applicable.

Informed Consent Statement

Not applicable.

Data Availability Statement

The data presented in this study are available on request from the corresponding author.

Conflicts of Interest

The authors declare no conflict of interest.

Nomenclature

αpGeometric factor between the cylindrical electrodes on the sample circumference
θcos−1(s/2r)
ρElectrical resistivity of the rock sample
hHeight of the sample
lArc length of the curvature (derived in Appendix A.)
rRadius of the sample
reRadius of the electrodes
RpElectrical resistance between the cylindrical electrodes on the sample circumference
sDistance from the electrode center to an arbitrary point on the sample circumference

Appendix A. Derivation of l

Let us assume two circles are placed in the same 2D Cartesian coordinate centered at (0, 0) and (0, r), as shown in Figure A1. The intersections between two circles, denoted as P and Q, can be represented in terms of the radii of two circles, r and s. The x and y values of the intersection, x1, x2, and y1, are:
x 1 = s 1 s 2 r 2 x 2 = s 1 s 2 r 2 y 1 = r s 2 2 r ,
Figure A1. Definitions of variables to evaluate l (sectional view). Two cylindrical electrodes whose radius is re and height is h are placed with distance 2r, which is the diameter of the rock core sample. The dotted line indicates the equipotential surface from a perimeter electrode.
Energies 14 04382 g0a1
Then, the arc length of the curvature can be determined using the following equation because the integral is an even function:
l = x 1 x 2 1 + d y d x 2 d x = 2 0 x 2 s 2 s 2 x 2 d x = 2 s sin 1 1 s 2 r 2 ,
where dy/dx = x/(ry).

References

  1. Zhou, X.Y.; Sun, D.; Tan, Y.; Zhou, A. Canister spacing in high-level radioactive nuclear waste repository. Ann. Nucl. Energy 2020, 141, 107335. [Google Scholar] [CrossRef]
  2. Yoon, S.; Jeon, J.S.; Kim, G.Y.; Seong, J.H.; Baik, M.H. Specific heat capacity model for compacted bentonite buffer materials. Ann. Nucl. Energy 2019, 125, 18–25. [Google Scholar] [CrossRef]
  3. Kim, A.R.; Kim, H.S.; Cho, G.C.; Lee, J. Estimation of model parameters and properties for numerical simulation on geomechanical stability of gas hydrate production in the Ulleung Basin, East Sea, Korea. Quat. Int. 2017, 459, 55–68. [Google Scholar] [CrossRef]
  4. Davarpanah, A.; Mirshekari, B.; Behbahani, T.J.; Hemmati, M. Integrated production logging tools approach for convenient experimental individual layer permeability measurements in a multi-layered fractured reservoir. J. Pet. Explor. Prod. Technol. 2018, 8, 743–751. [Google Scholar] [CrossRef] [Green Version]
  5. Brace, W.F.; Walsh, J.B.; Frangos, W.T. Permeability of Granite under High Pressure. J. Geophys. Res. 1968, 73, 2225–2236. [Google Scholar] [CrossRef]
  6. Zhang, M.; Takahashi, M.; Morin, R.H.; Esaki, T. Evaluation and application of the transient-pulse technique for determining the hydraulic properties of low-permeability rocks—Part 1: Theoretical evaluation. Geotech. Test. J. 2000, 23, 83–90. [Google Scholar]
  7. Glover, P.W.J. A generalized Archie’s law for n phases. Geophysics 2010, 75, E247–E265. [Google Scholar] [CrossRef] [Green Version]
  8. Byun, Y.H.; Hong, W.T.; Yoon, H.K. Characterization of cementation factor of unconsolidated granular materials through TDR with variable saturated conditions. Materials 2019, 12, 1340. [Google Scholar] [CrossRef] [PubMed] [Green Version]
  9. Griffiths, D.H. Application of electrical resistivity measurements for the determination of porosity and permeability in sand-stones. Geoexploration 1976, 14, 207–213. [Google Scholar] [CrossRef]
  10. Kirkby, A.; Heinson, G.; Krieger, L. Relating permeability and electrical resistivity in fractures using random resistor network models. J. Geophys. Res. Solid Earth 2016, 121, 1546–1564. [Google Scholar] [CrossRef] [Green Version]
  11. Hong, C.H.; Chong, S.H.; Cho, G.C. Theoretical study on geometries of electrodes in laboratory electrical resistivity measurement. Appl. Sci. 2019, 9, 4167. [Google Scholar] [CrossRef] [Green Version]
  12. Rekapalli, R.; Sarma, V.S.; Phukon, P. Direct resistivity measurements of core sample using a portable in-situ DC resistivity meter in comparison with HERT data. J. Geol. Soc. India 2015, 86, 211–214. [Google Scholar] [CrossRef]
  13. Du Plooy, R.; Lopes, S.P.; Villain, G.; Dérobert, X. Development of a multi-ring resistivity cell and multi-electrode resistivity probe for investigation of cover concrete condition. NDT E Int. 2013, 54, 27–36. [Google Scholar] [CrossRef]
  14. ASTM Standard G187. Standard Test Method for Measurement of Soil Resistivity Using the Two-Electrode Soil Box Method; ASTM International: West Conshohocken, PA, USA, 2018. [Google Scholar]
  15. COMSOL Multiphysics® v. 5.5. COMSOL AB, Stockholm, Sweden. Available online: www.comsol.com (accessed on 11 February 2021).
  16. Clement, R.; Bergeron, M.; Moreau, S. COMSOL Multiphysics modelling for measurement device of electrical resistivity in laboratory test cell. In Proceedings of the 2011 COMSOL Conference, Stuttgart, Germany, 13 October 2011. [Google Scholar]
  17. Butler, S.L.; Sinha, G. Forward modeling of applied geophysics methods using Comsol and comparison with analytical and laboratory analog models. Comput. Geosci. 2012, 42, 168–176. [Google Scholar] [CrossRef]
  18. Carmichael, R.S. Practical Handbook of Physical Properties of Rocks and Minerals; CRC Press: Boca Raton, FL, USA, 1988. [Google Scholar]
  19. Yan, W.; Hong, S.; Chaoshi, R. Optimum design of electrode structure and parameters in electrical impedance tomography. Physiol. Meas. 2006, 27, 291. [Google Scholar] [CrossRef] [PubMed]
  20. Malmivuo, J.; Plonsey, R. Bioelectromagnetism: Principles and Applications of Bioelectric and Biomagnetic Fields; Oxford University Press: New York, NY, USA, 1995. [Google Scholar]
  21. Bera, T.K.; Chowdhury, A.; Mandai, H.; Kar, K.; Haider, A.; Nagaraju, J. Thin domain wide electrode (TDWE) phantoms for Electrical Impedance Tomography (EIT). In Proceedings of the 2015 Third International Conference on Computer, Communication, Control and Information Technology (C3IT), Hooghly, India, 7–8 February 2015. [Google Scholar]
Figure 1. Schematic of electrical resistivity estimation for a specimen with a uniform cross-section (ASTM G187).
Energies 14 04382 g001
Figure 2. Electrical resistivity estimation of rock sample using perimeter electrodes: (a) schematic of the setup; (b) definitions of variables (re = radius of the electrodes, r = radius of the rock core sample, h = height of the rock core sample, s = distance from the electrode center to an arbitrary point, and l = equipotential surface length).
Energies 14 04382 g002
Figure 3. COMSOL Simulation of the ASTM G187 standard using the numerical simulation tool: (a) geometry employed for the simulation; (b) the resulting electric potential.
Energies 14 04382 g003
Figure 4. Verification of COMSOL finite element analysis using ASTM G187 simulations for different (a) electrical resistivity; (b) radius; (c) height of the rock specimen.
Energies 14 04382 g004
Figure 5. COMSOL simulation of electrical resistivity for two cylindrical perimeter electrodes: (a) geometry employed for the simulation; (b) the resulting electric potential.
Energies 14 04382 g005
Figure 6. Verification of the proposed electrical resistivity estimation method using numerical simulations: (a) electrical resistance according to electrode radius; (b) electrical resistance according to electrical resistivity of the rock sample.
Energies 14 04382 g006
Figure 7. Distortion of the equipotential surface: (a) length of the theoretical equipotential surface l and length of the equivalent flat equipotential surface leq for s = √2r; (b) change in curvature of the equipotential surface observed in numerical simulations.
Energies 14 04382 g007
Figure 8. Comparison of the numerical simulation results and factorized equation: (a) electrical resistance according to electrode radius; (b) electrical resistance according to electrical resistivity of the rock sample.
Energies 14 04382 g008
Figure 9. Effect of electrode height on measured electrical resistance: (a) geometry employed for the simulation; (b) change in normalized resistance with normalized electrode height.
Energies 14 04382 g009
Figure 10. Equivalent strap electrode.
Energies 14 04382 g010
Figure 11. COMSOL simulation of electrical resistivity for two equivalent strap perimeter electrodes: (a) geometry employed for the simulation; (b) electrical resistance of cylindrical electrodes and equivalent strap electrodes.
Energies 14 04382 g011
Publisher’s Note: MDPI stays neutral with regard to jurisdictional claims in published maps and institutional affiliations.

