Article

An Improved Method Based on Deep Learning for Insulator Fault Detection in Diverse Aerial Images

1
College of Mechanical and Electrical Engineering, Chizhou University, Chizhou 247000, China
2
College of Electronic and Information Engineering, Nanjing University of Aeronautics and Astronautics, Nanjing 211106, China
*
Author to whom correspondence should be addressed.
Energies 2021, 14(14), 4365; https://doi.org/10.3390/en14144365
Submission received: 7 July 2021 / Revised: 16 July 2021 / Accepted: 16 July 2021 / Published: 20 July 2021

Abstract

:
Insulators play a significant role in high-voltage transmission lines, and detecting insulator faults timely and accurately is important for the safe and stable operation of power grids. Since insulator faults are extremely small and the backgrounds of aerial images are complex, insulator fault detection is a challenging task for automatically inspecting transmission lines. In this paper, a method based on deep learning is proposed for insulator fault detection in diverse aerial images. Firstly, to provide sufficient insulator fault images for training, a novel insulator fault dataset named “InSF-detection” is constructed. Secondly, an improved YOLOv3 model is proposed to reuse features and prevent feature loss. To improve the accuracy of insulator fault detection, SPP-networks and a multi-scale prediction network are employed for the improved YOLOv3 model. Finally, the improved YOLOv3 model and the compared models are trained and tested on the “InSF-detection”. The average precision (AP) of the improved YOLOv3 model is superior to YOLOv3 and YOLOv3-dense models, and just a little (1.2%) lower than that of CSPD-YOLO model; more importantly, the memory usage of the improved YOLOv3 model is 225 MB, which is the smallest between the four compared models. The experimental results and analysis validate that the improved YOLOv3 model achieves good performance for insulator fault detection in aerial images with diverse backgrounds.

1. Introduction

With the enlargement of high-voltage transmission lines, more and more insulators are being applied to power grids. As one of the indispensable components, the insulator plays the role of conductor conjunction and electrical insulation for high-voltage transmission lines [1,2]. Most insulators are exposed to the outdoors for a long time, making them prone to damage. Thus, safe and stable operation of the power grid can be threatened, in severe cases, resulting in widespread power outages and huge economic losses. According to statistics, accidents caused by insulator faults account for the largest percent of the total power grid accidents [3]. Therefore, automatic and timely detection of insulator faults in high-voltage transmission lines has important practical significance [4,5]. In the last decade, with the development of computer vision and image processing technology, the traditional manual patrol has gradually been replaced by unmanned aerial vehicle (UAV) inspection [6,7,8], and aerial images captured by UAV have been widely used for high-voltage transmission lines off-line inspection. Insulators and their fault images used for detection are shown in Figure 1. Extensive research activity has been conducted on insulators and their fault detection in aerial images by traditional object detection methods [9,10,11,12,13].
The traditional object detection methods used for insulator recognition generally can be divided into three steps: first, the sliding window method is used to extract regions of interest (RoI) in aerial images; and then, feature extraction is performed on the RoI area, including texture feature, shape feature, and color feature, etc.; finally, classifiers are manually designed to recognize insulators and their faults [9]. Specifically, in [10], a robust algorithm was proposed to extract insulators from aerial images with complex backgrounds. To improve the precision and robustness of the proposed algorithm, multiple-feature and multiple-scale descriptors were employed to extract the local features of insulators. However, the coarse-to-fine matching strategy is complex, resulting in a time-consuming algorithm. In order to reduce the background interference caused by texture feature and lighting conditions, in [11], a method combining shape feature, color feature, and texture feature was presented to demonstrate fault detection in insulators. Experimental results demonstrate that the accuracy of insulator detection is improved effectively, but multiple-feature extraction and complicated computation are needed in the proposed method, therefore, the method is not applicable to recognize insulators in aerial images with multiple backgrounds. Occlusion may occur between insulator strings in aerial images due to the uncertainty of filming perspective. To solve the problem that insulators are difficult to detect under different occluding conditions, in the work of Cheng [12], a method based on spatial features was proposed to recognize glass insulators. Experimental results revealed that the method had a good detection precision (92.54%), but the performance of running time (0.58 s/per image) did not meet the requirements of real-time applications. In the work of [13], a spatial morphological algorithm was proposed for the bunch-drop fault detection of both glass and ceramic insulators in aerial images with background interference. Firstly, a color model was established to segment RoI area of insulators from the complex background. Secondly, the localization of insulators were detected by the spatial morphological features. Finally, a series of rules were created to distinguish insulators and their faults. Compared with some of other existing methods, this method can recognize and locate insulator faults efficiently from aerial images with complex backgrounds, however, it will not work well when the insulator’s color is similar to the background. In addition, it can merely achieve single-fault detection in each aerial image. Therefore, the traditional object detection methods based on manual designed features merely detect insulators and their faults under specific detection conditions. Furthermore, aerial images are collected by UAVs with different filming distances and angles in real application, and it is difficult for such methods to detect different sizes of insulators and their faults in aerial images with diverse backgrounds.
In recent years, with the rapid development of artificial intelligence technology, deep learning theory has been widely used in the fields of image classification, target detection [14,15,16,17,18], scene recognition, automatic driving of vehicles, and so on. The architectures of deep learning are composed of convolutional neural networks (CNNs), many state-of-the-art algorithms based on CNNs have been put forward and successfully applied for object detection, including two-stage algorithms—Regions with Convolutional Neural Network (R-CNN) [19], Fast R-CNN [20], and Faster R-CNN [21,22,23]; and one-stage algorithms—Single Shot multi-box Detector (SSD) [24], You Only Look Once (YOLO) [25,26,27,28]. Naturally, the existing deep learning-based object detection algorithms can be employed for insulators and detection of their faults by transfer learning strategy. In [29], a novel method based on deep learning was presented to recognize insulators and their faults. Firstly, Faster R-CNN was adopted to locate the RoI area in aerial images with complex backgrounds from high-voltage transmission lines. Secondly, the fully convolutional network (FCN) was used to perform the segmentation on the RoI area. Finally, the GoogLeNet network model was adopted to recognize insulator faults in the segmented images. Experimental results reveal that the accuracy of insulator fault detection by the Faster R-CNN is more than 90%, which is obviously superior to that of the traditional object detection algorithms. To realize insulator fault detection under the low signal-noise-ratio (SNR) conditions, in the work of [30], two deep learning network models (Faster R-CNN and U-net) were cascaded for detecting insulators and their faults in aerial images with background interference. Faster R-CNN was used to accurately recognize and locate insulators in aerial images with complicated backgrounds, and the precise classification of insulators and their faults with different sizes was realized by U-net. As one of the two-stage algorithms, Faster R-CNN can achieve a slightly higher detection accuracy than one-stage algorithms in some public datasets. However, the average running time in two-stage algorithms is much longer than that of one-stage algorithms [31,32,33], so the two-stage algorithms are not suitable for high real-time applications, while one-stage algorithms are faster, and better results are achieved by using one-stage algorithms. To automatically extract multiple-level features from aerial images, in [34], a deep learning method based on SSD was adopted to detect insulators. A two-stage fine-tuning strategy was proposed to improve the accuracy of insulator detection in aerial images with different scenes. Experimental results show that the proposed method can achieve real-time detection in aerial images with complex backgrounds. Compared with Faster R-CNN and SSD models [35], the running time of YOLO model is much faster, so the YOLO models can be applied to inspect the real-time status of insulators from high-voltage transmission lines. In [36], YOLOv3 was adopted to perform insulator localization and fault detection, and the average running time of insulator detection reached 45 images per second. To reduce the impact of background interference on insulator fault detection, in [37] an improved YOLOv3 model was proposed to detect insulators from a complex background. Experimental results reveal the proposed model has a good performance in accuracy and real-time (89.96% of average precision and 0.02 s/per image in the testing set). In our previous work [38], to improve the accuracy of insulator detection with multiple sizes, YOLOv3-dense network model was proposed to perform insulator detection in aerial images with diverse background interference. Experimental results show that the average precision of the proposed model can reach 94.47%, however, since the fault area of insulator is relatively small, the fault area will be lost after the feature extraction network of YOLOv3-dense, resulting in a decrease in the accuracy of insulator fault detection. In [39], a Cross Stage Partial Network was introduced to YOLOv3, and the Cross Stage Partial Dense YOLO (CSPD-YOLO) model was proposed to detect insulator faults. The proposed model achieves a good effect on insulator fault detection (with the average precision of 98.18%), however, the memory usage of the proposed model (265 MB) is larger than that of YOLOv3 (240 MB).
In general, deep learning algorithms make full use of CNNs to learn deep features automatically, and optimize the network parameters to improve the accuracy of object detection. Compared with the traditional object detection methods, deep learning-based methods have a strong advantage in feature extraction. However, there are several challenges in performing insulator fault detection based on deep learning methods, including a limited amount of insulator fault images, the extreme smallness of the insulator fault area, the complexity of the background of aerial images, and so on. To solve these issues, based on our previous work [38,39] and DenseNet, an improved YOLOv3 model is proposed for insulator fault detection in diverse aerial images from high-voltage transmission lines. To solve the problem of insufficient fault images, a novel insulator fault dataset named “InSF-detection” is created; to enhance feature reuse and feature propagation of high-resolution feature layer, DenseNets are adopted to the feature extraction network of improved YOLOv3 network model; to improve the accuracy and robustness of insulator fault detection, Spatial Pyramid Pooling networks (SPP-networks) and improved multi-scale prediction network are employed to the improved YOLOv3 network model.
The rest of this paper is organized, as follows. (1) Section 1 reports the existing works of insulators and their fault detection. (2) Section 2 introduces the network of YOLOv3 model. (3) Section 3 details the proposed network model for insulator fault detection. (4) Section 4 gives experimental results and analysis. (5) Finally, Section 5 presents the conclusion of this paper.

2. YOLOv3 Network

YOLOv3 network model is one of state-of-the-art algorithms proposed by Redmon et al. in 2018. Different from the two-stage algorithms, YOLOv3 network extracts features based on regression methods without generating a large number of candidate windows, and directly uses a single neural network to predict and classify the input image, which is helpful to reduce the running time of object detection. This is the reason why the running time of one-stage algorithms is faster than that of two-stage algorithms.
In order to achieve deeper feature extraction, residual structure is adopted to the feature extraction network of YOLOv3, which is composed of Convolutional layer (Conv) 1 × 1, Conv 3 × 3, and shortcut connection. Darknet-53, composed of different sizes of residual blocks, is used in the feature extraction network of YOLOv3, as shown in Figure 2. Five residual blocks (1×, 2×, 8×, 8×, 4×) are used for the feature extraction network, including 23 residual modules in total, and the residual operation is carried out through Convolutional layer (Conv), Batch Normalization (BN), and Rectified Linear (ReLU) activated function.
The prediction process of YOLOv3 network model is as follows: The feature extraction network of YOLOv3 divides the input image into S × S grid cells according to the size of the feature map, if the center of an object falls into a cell, the cell is responsible for predicting the object, and each cell outputs multiple prediction boxes and confidence. Three effective feature maps (13 × 13, 26 × 26, and 52 × 52), extracted by feature extraction network, are used for multi-scale object prediction. To improve the detection accuracy of multiple sizes of objects, Feature Pyramid Network (FPN) is adopted to YOLOv3, such as the feature map (26 × 26) followed by up-sampling fused with the feature map (52 × 52). Similarly, the feature map (13 × 13) followed by up-sampling is fused with the feature map (26 × 26). The outputs of YOLOv3 network model are predicted by three different scales of detection heads, (e.g., the Scale1 is responsible for the prediction of large-size objects, the Scale2 is responsible for the prediction of medium-size objects, and the Scale3 is responsible for the prediction of small-size objects, respectively).

3. Materials and Methods

As it is well known, the depth of a neural network is very important to the performance of the object detection model. High-efficiency features can be extracted for object recognition with the deepening of network layers, however, as the network depth increases, the accuracy of the network model will quickly reach saturation, or even begin to decline rapidly, causing the gradient disappearance or explosion. To avoid this problem, Residual network (ResNet) [40,41] and densely connected network (DenseNet) [42,43,44] are proposed to train the network model with hundreds of layers.
In the insulator images, the insulator is composed of a series of insulator strings, but the fault of insulator string is extremely small compared with the size of insulator. Furthermore, the backgrounds of aerial images captured by UAV are complex, and the appearance of different insulators are diverse under different shooting angles. Therefore, it is necessary to select a stable and efficient detection algorithm to recognize insulators and their faults. The accuracy of detection based on deep learning methods can be improved when the depth of neural network is increased, however, the deeper the network layers, the more complicated the detection network. In addition, during the training of the YOLOv3 network model, the feature extraction network loses much shallow-level feature information, which leads to the lack of position information in the feature map of detection head. To recognize insulator faults accurately from complex backgrounds, in this study, on the basis of DenseNet and YOLOv3, an improved YOLOv3 network model is proposed for insulator fault detection. The structure of improved YOLOv3 model is shown in Figure 3. In order to improve high-resolution feature reuse and feature propagation, DenseNets are adopted to the feature extraction network of improved YOLOv3 network model; to enlarge multi-scale receptive fields of insulator fault detection, SPP-networks are employed to the improved YOLOv3 model; to obtain richer semantic features for insulator fault detection, a novel multi-scale feature fusion strategy is adopted to the improved YOLOv3 model.

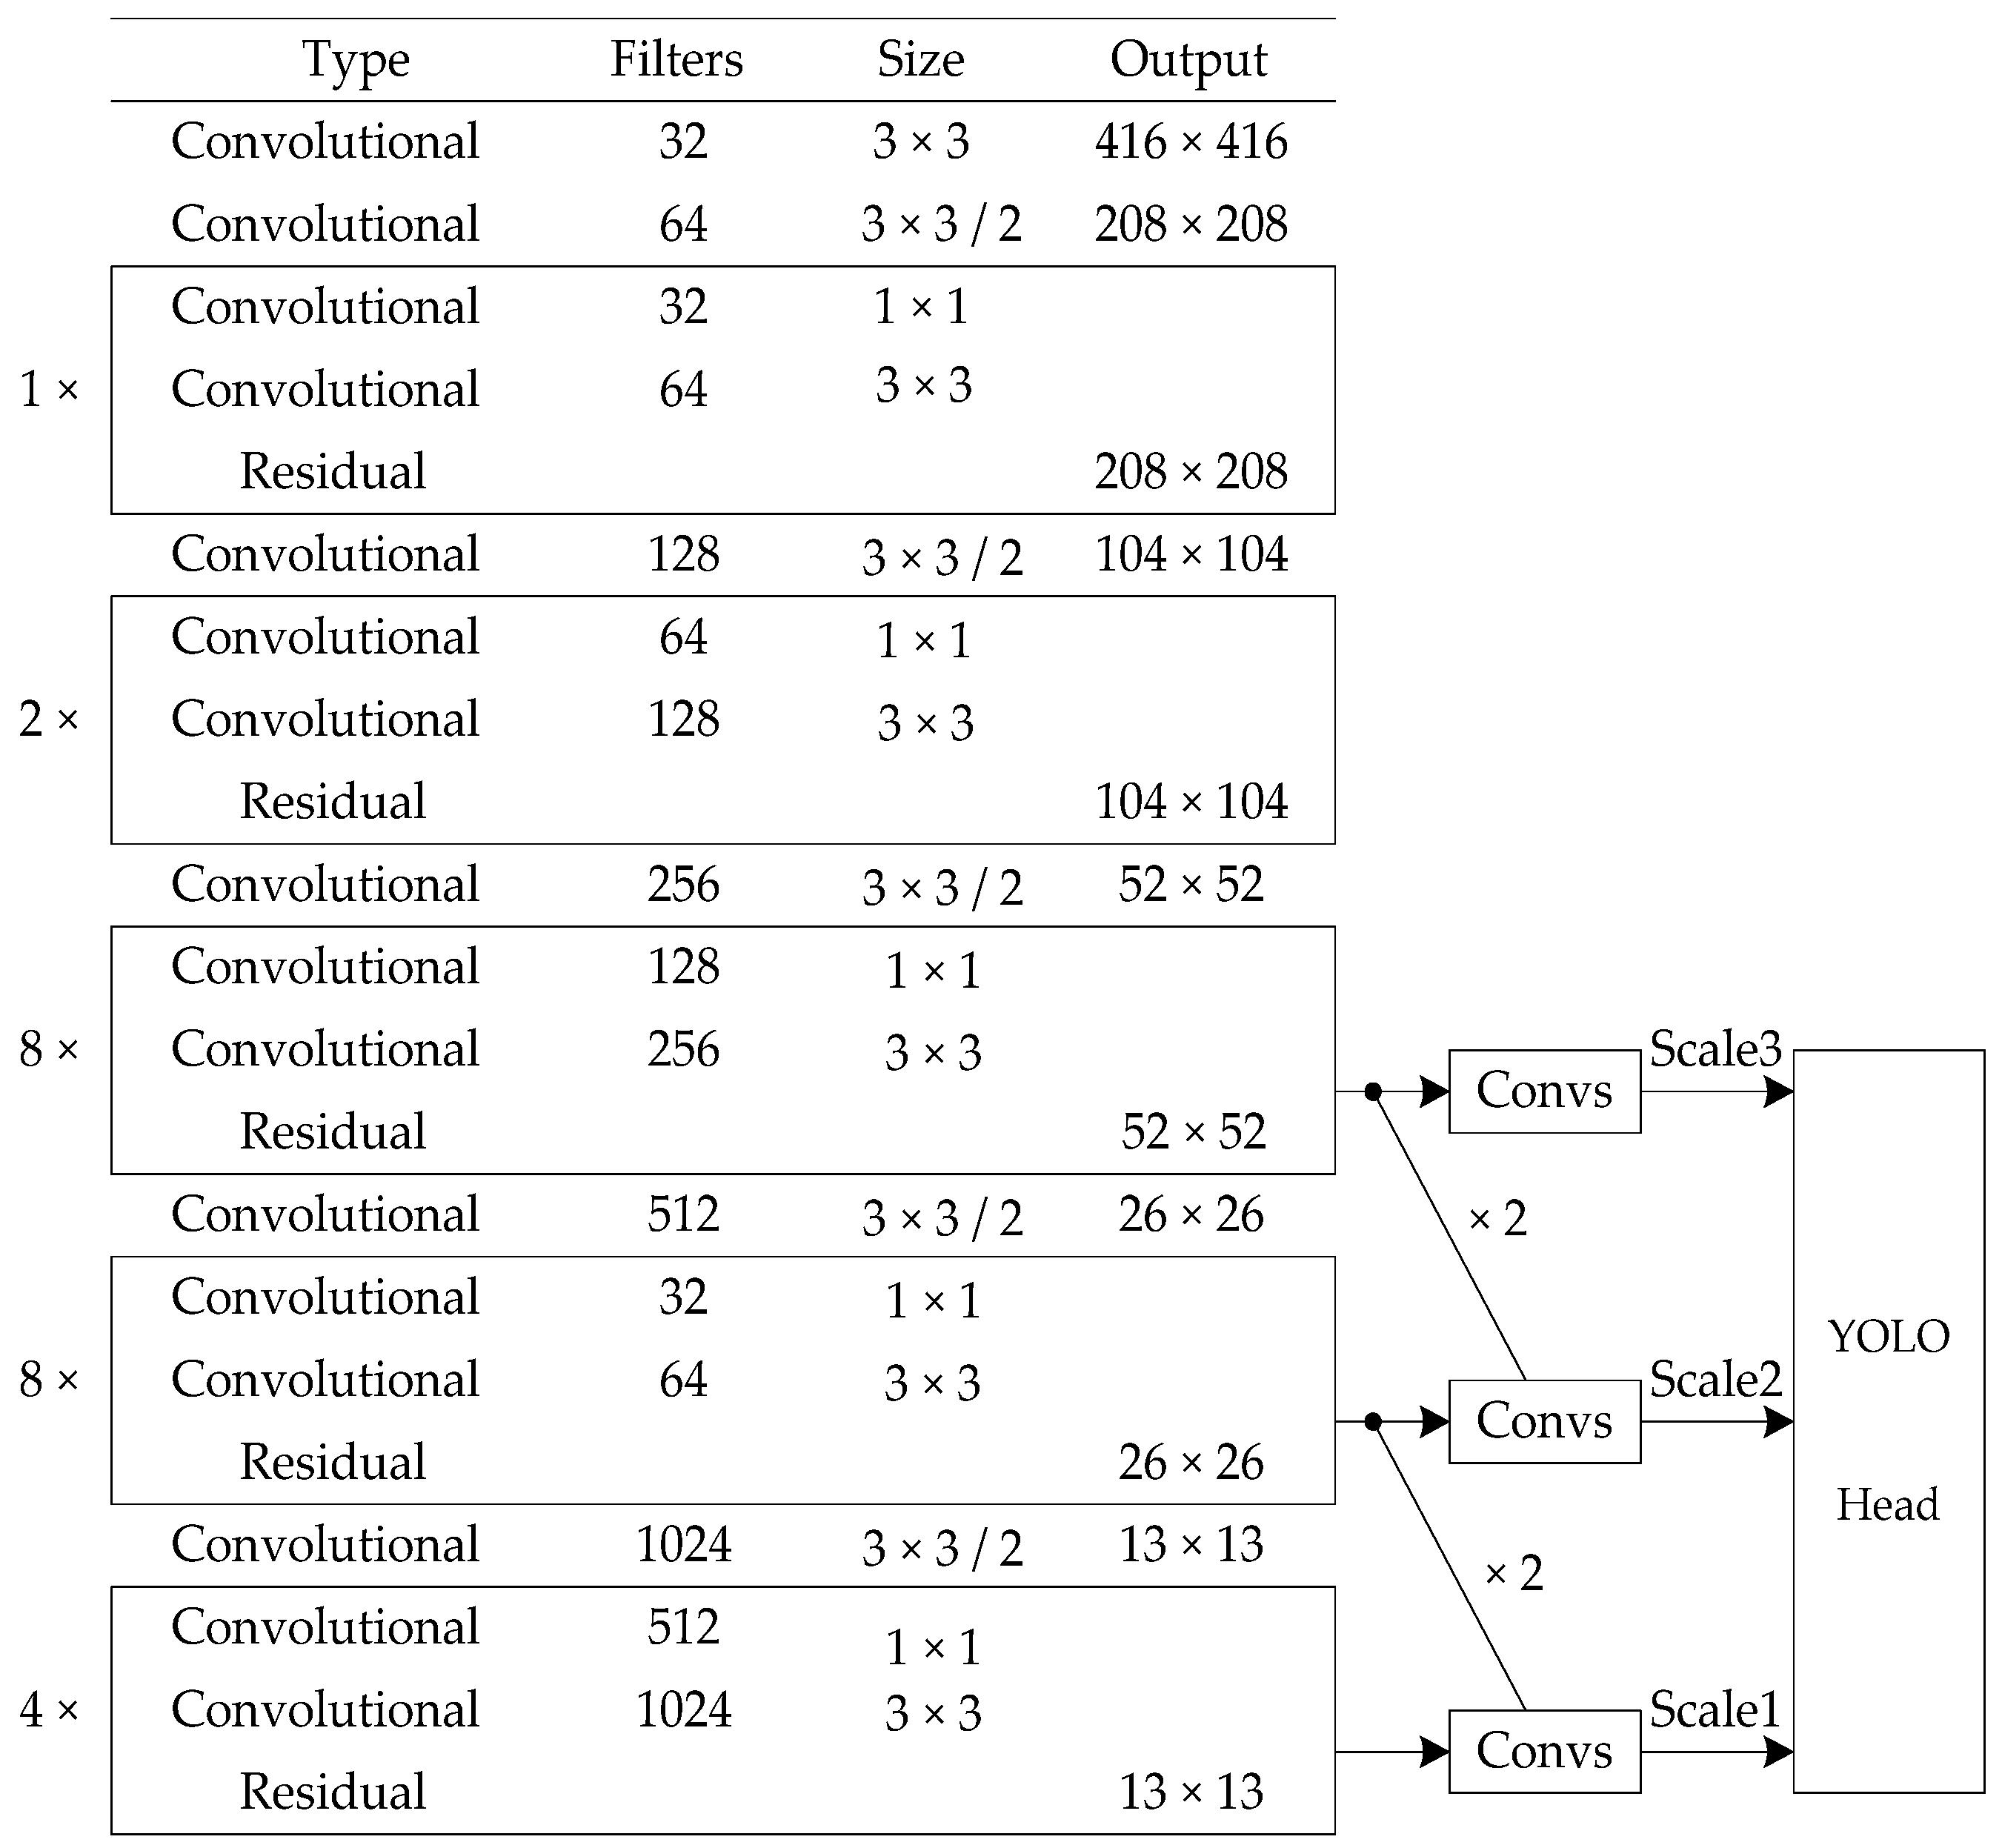
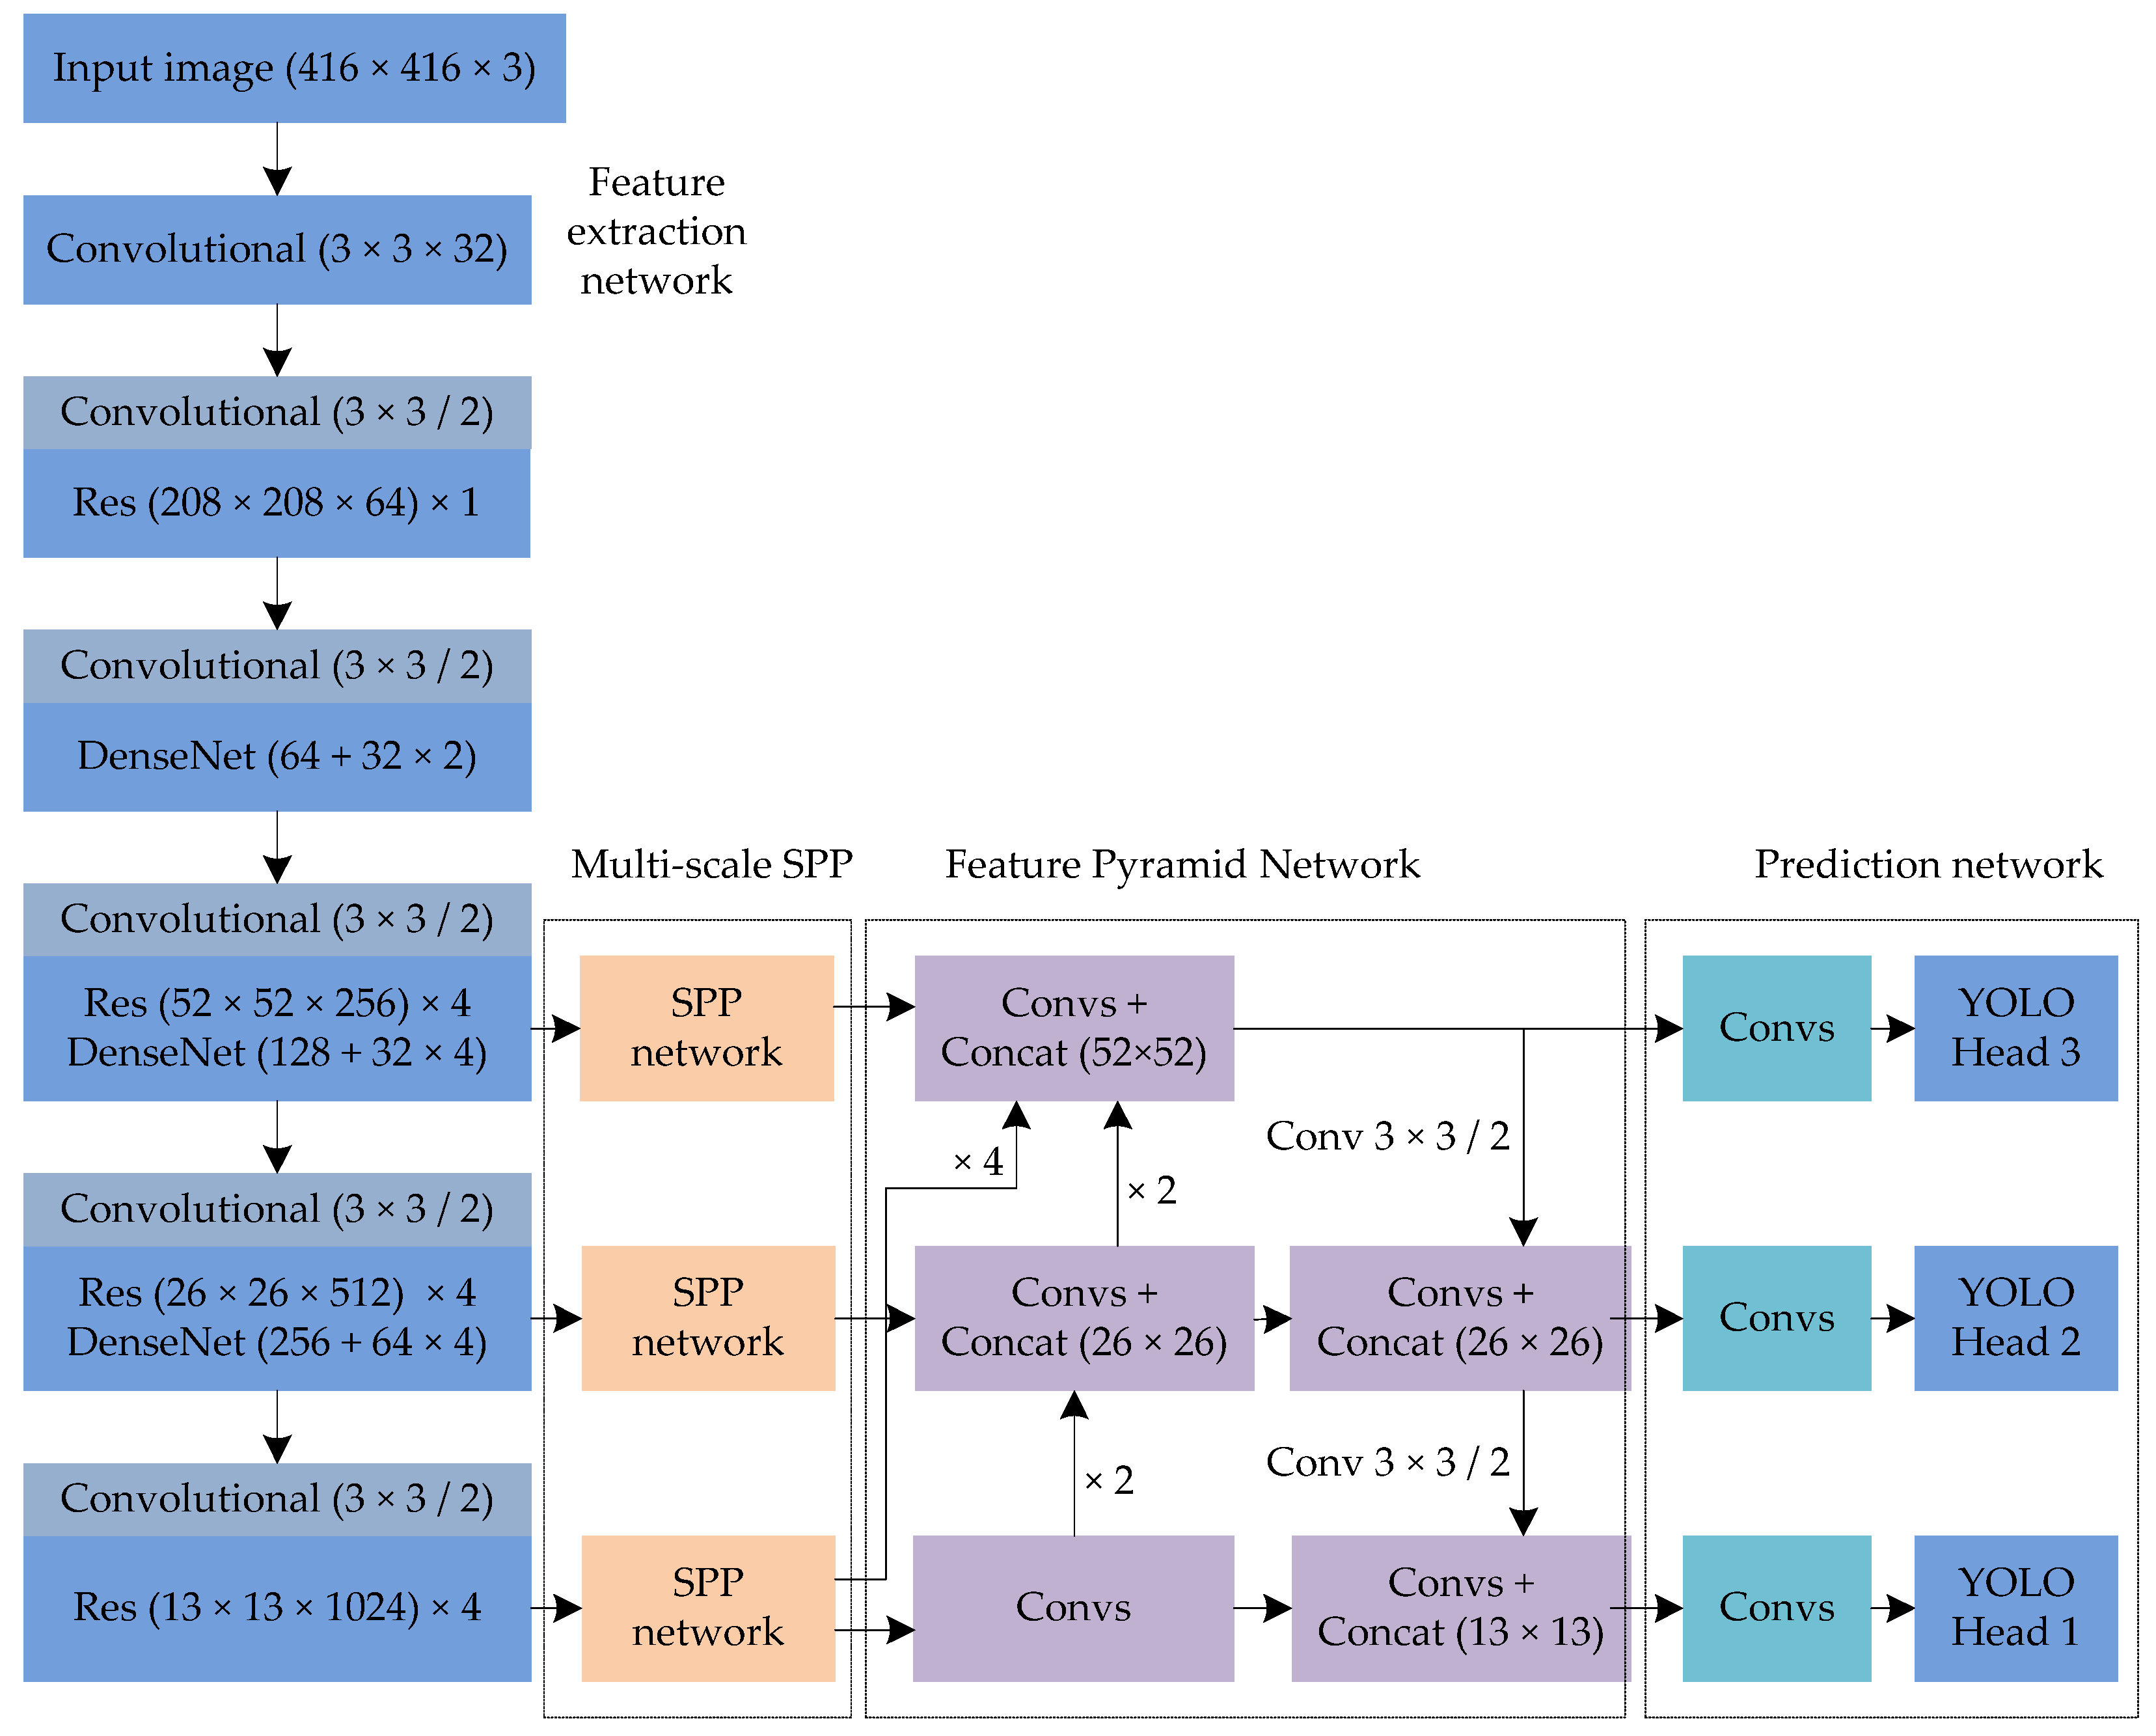
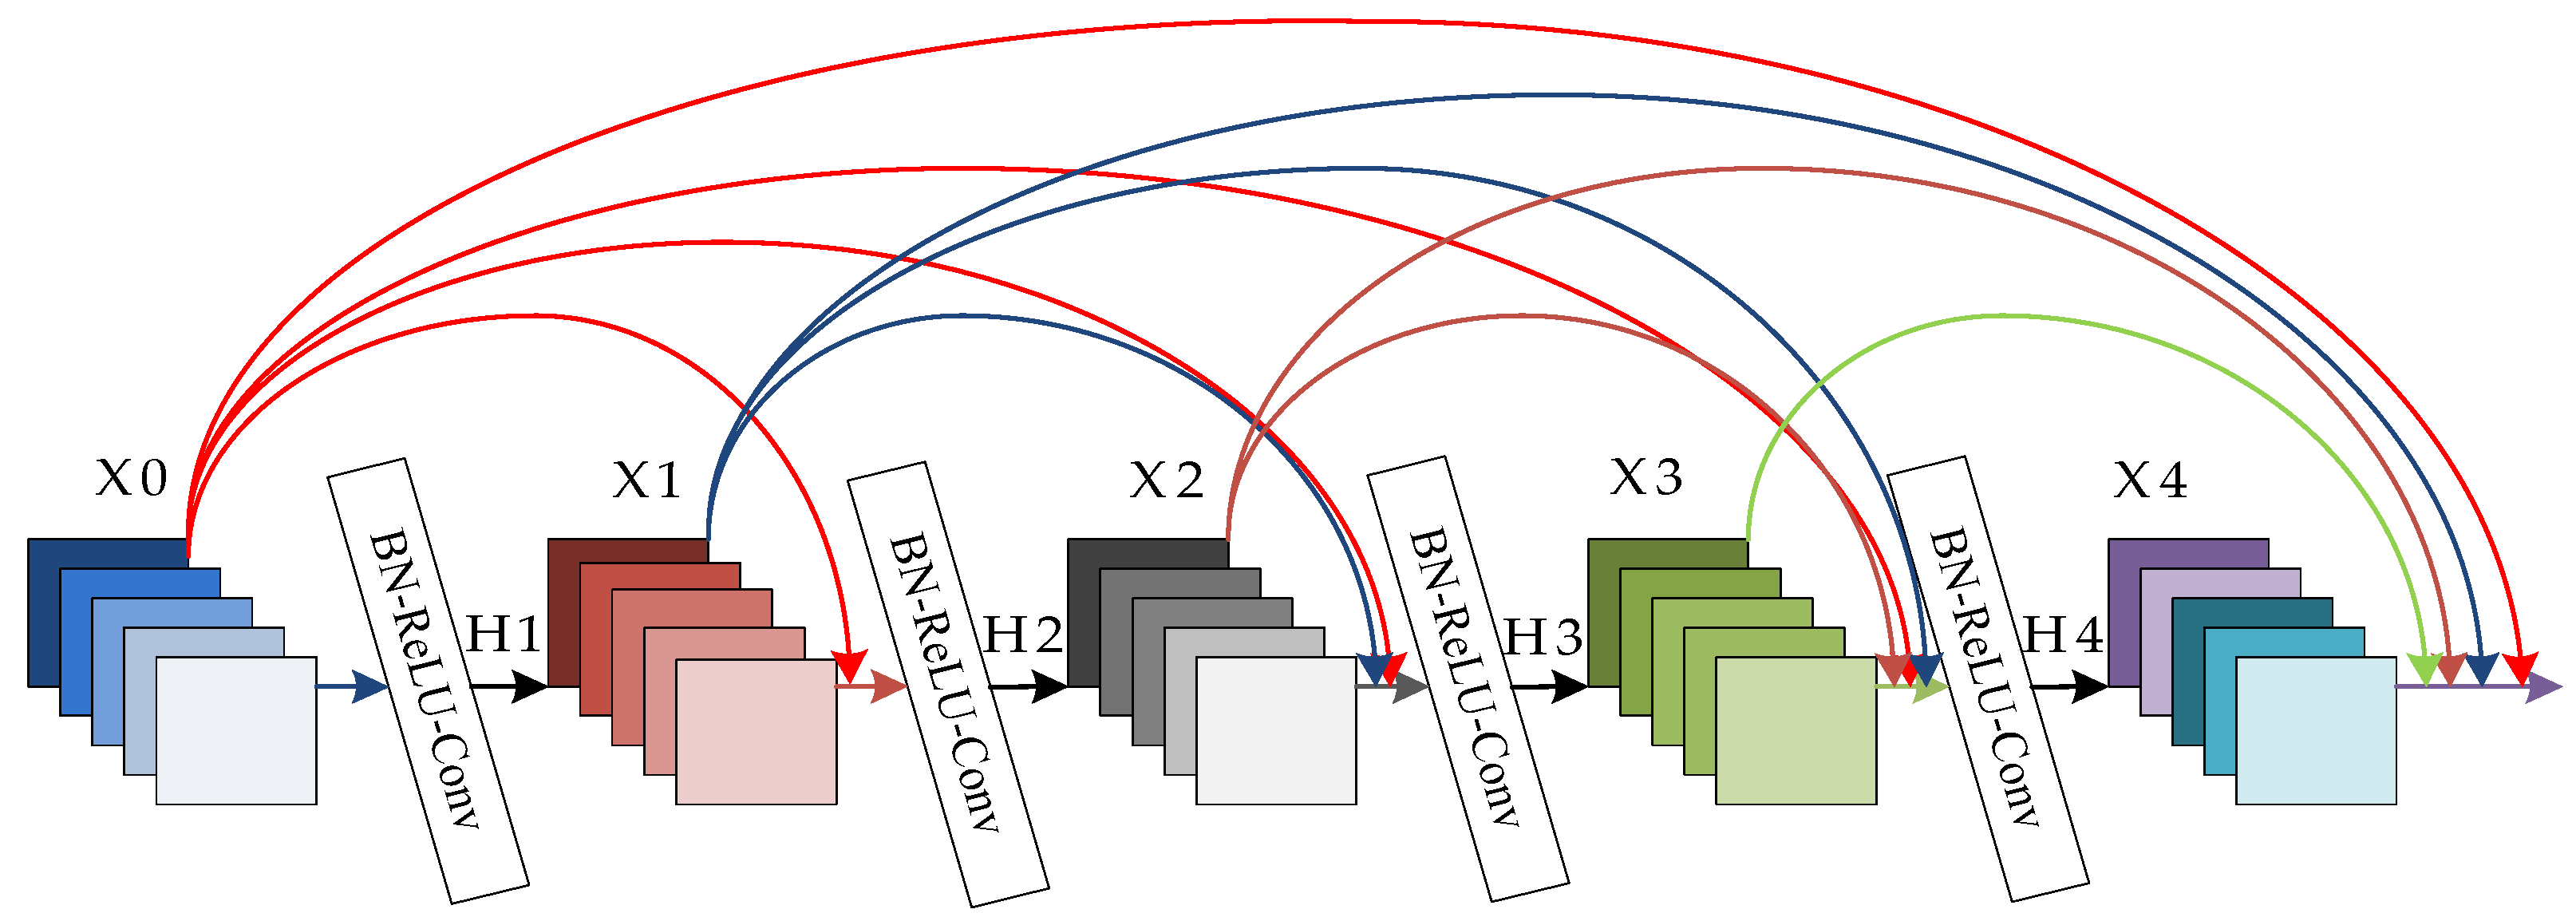
3.1. Feature Extraction Network of the Improved YOLOv3

In order to effectively reduce the network model parameters, while keeping the shallow-level feature in the high-level layers as much as possible, and further realize the multiple layer feature reuse and fusion, DenseNet is adopted to the YOLOv3 network model. In DenseNet, the previous layer is connected to the following layers in a manner of feed-forward, in other words, the input feature of each layer comes from the output of all the previous layers, and the structure of DenseNet is shown in Figure 4. Hn is defined as a transform function, which is composed of Batch Normalization (BN), Rectified Linear (ReLU), and Convolutional layer (Conv), providing a non-linear transform to Convolutional layers X0, X1, ..., and X(n – 1). In general, BN-ReLU-Conv (1 × 1) and BN-ReLU-Conv (3 × 3) are the commonly used transform functions. The feature map of X1 is generated after the operation of H1, and the feature map of X0 and X1 are spliced into [X0, X1] as the input features of function H2. The feature map of X2 is obtained after the operation of H2, and the feature map of X0, X1, and X2 are spliced into [X0, X1, X2] as the input feature of function H3. Similarly, the spliced feature maps [X0, X1, X2, X3] are the input feature of function H4, and the feature map X4 is generated after the operation of H4. Finally, the feature map of Xn is defined in Formula (1).
X n = H n ( [ X 0 , X 1 , , X ( n 1 ) ] )
To further reduce background interference and detect insulator faults accurately, as shown in Figure 3, three DenseNets were adopted to the extraction network of the improved YOLOv3 network model for the feature reuse, to achieve the feature fusion of shallow-level feature and high-level feature. Specifically, in the network architecture of DenseNet1, two transform functions were used. The input feature map of DenseNet 1 was 64 × 104 × 104, and after the operation of the first transform function by BN-ReLU-Conv (32 × 1 × 1) and BN-ReLU-Conv (32 × 3 × 3), the output feature map of the first layer was 32 × 104 × 104. The feature maps 64 × 104 × 104 and 32 × 104 × 104 were spliced into 96 × 104 × 104 as the input feature of the second layer. After the operation of the second transform function by BN-ReLU-Conv (32 × 1 × 1) and BN-ReLU-Conv (32 × 3 × 3), the output feature map of the second layer was 32 × 104 × 104. Finally, the feature maps of 64 × 104 × 104, 32 × 104 × 104, and 32 × 104 × 104 were spliced into 128 × 104 × 104 as the output feature map of DenseNet 1. Similarly, in the network architecture of DenseNet 2, four transfer functions were used. The input feature map of DenseNet 2 was 128 × 52 × 52, and after the operation of transform function by BN-ReLU-Conv (32 × 1 × 1) and BN-ReLU-Conv (32 × 3 × 3), the output feature map of each layer was 32 × 52 × 52. The input feature maps of each transfer function were 128 × 52 × 52, 160 × 52 × 52, 192 × 52 × 52, and 224 × 52 × 52, respectively. The final output feature map of DenseNet2 was 256 × 52 × 52. The network architecture of DenseNet 3 is similar to that of DenseNet 2. The input feature map of DenseNet 3 was 256 × 26 × 26, and after the operation of transfer function by BN-ReLU-Conv (64 × 1 × 1) and BN-ReLU-Conv (64 × 3 × 3), the output feature map of each layer was 64 × 26 × 26. The input feature maps of each transfer function were 256 × 26 × 26, 320 × 26 × 26, 384 × 26 × 26, and 448 × 26 × 26, respectively. Finally, the output feature map of DenseNet 3 was 512 × 26 × 26.
Compared with the feature extraction network of YOLOv3, DenseNet 1 is adopted to the shallow-level layers (high-resolution feature layers) of the improved YOLOv3 network model. The feature of shallow-level layers can be better and faster transmitted to the high-level layers, the network model parameters can be reduced effectively, while ensuring that the shallow-level feature is not lost, which is helpful to perform insulator fault detection; DenseNet2, and DenseNet3 are employed to the feature extraction network to extract features (52 × 52, and 26 × 26), multi-level features can be reused and fused, and the transmission efficiency of information can be further improved.

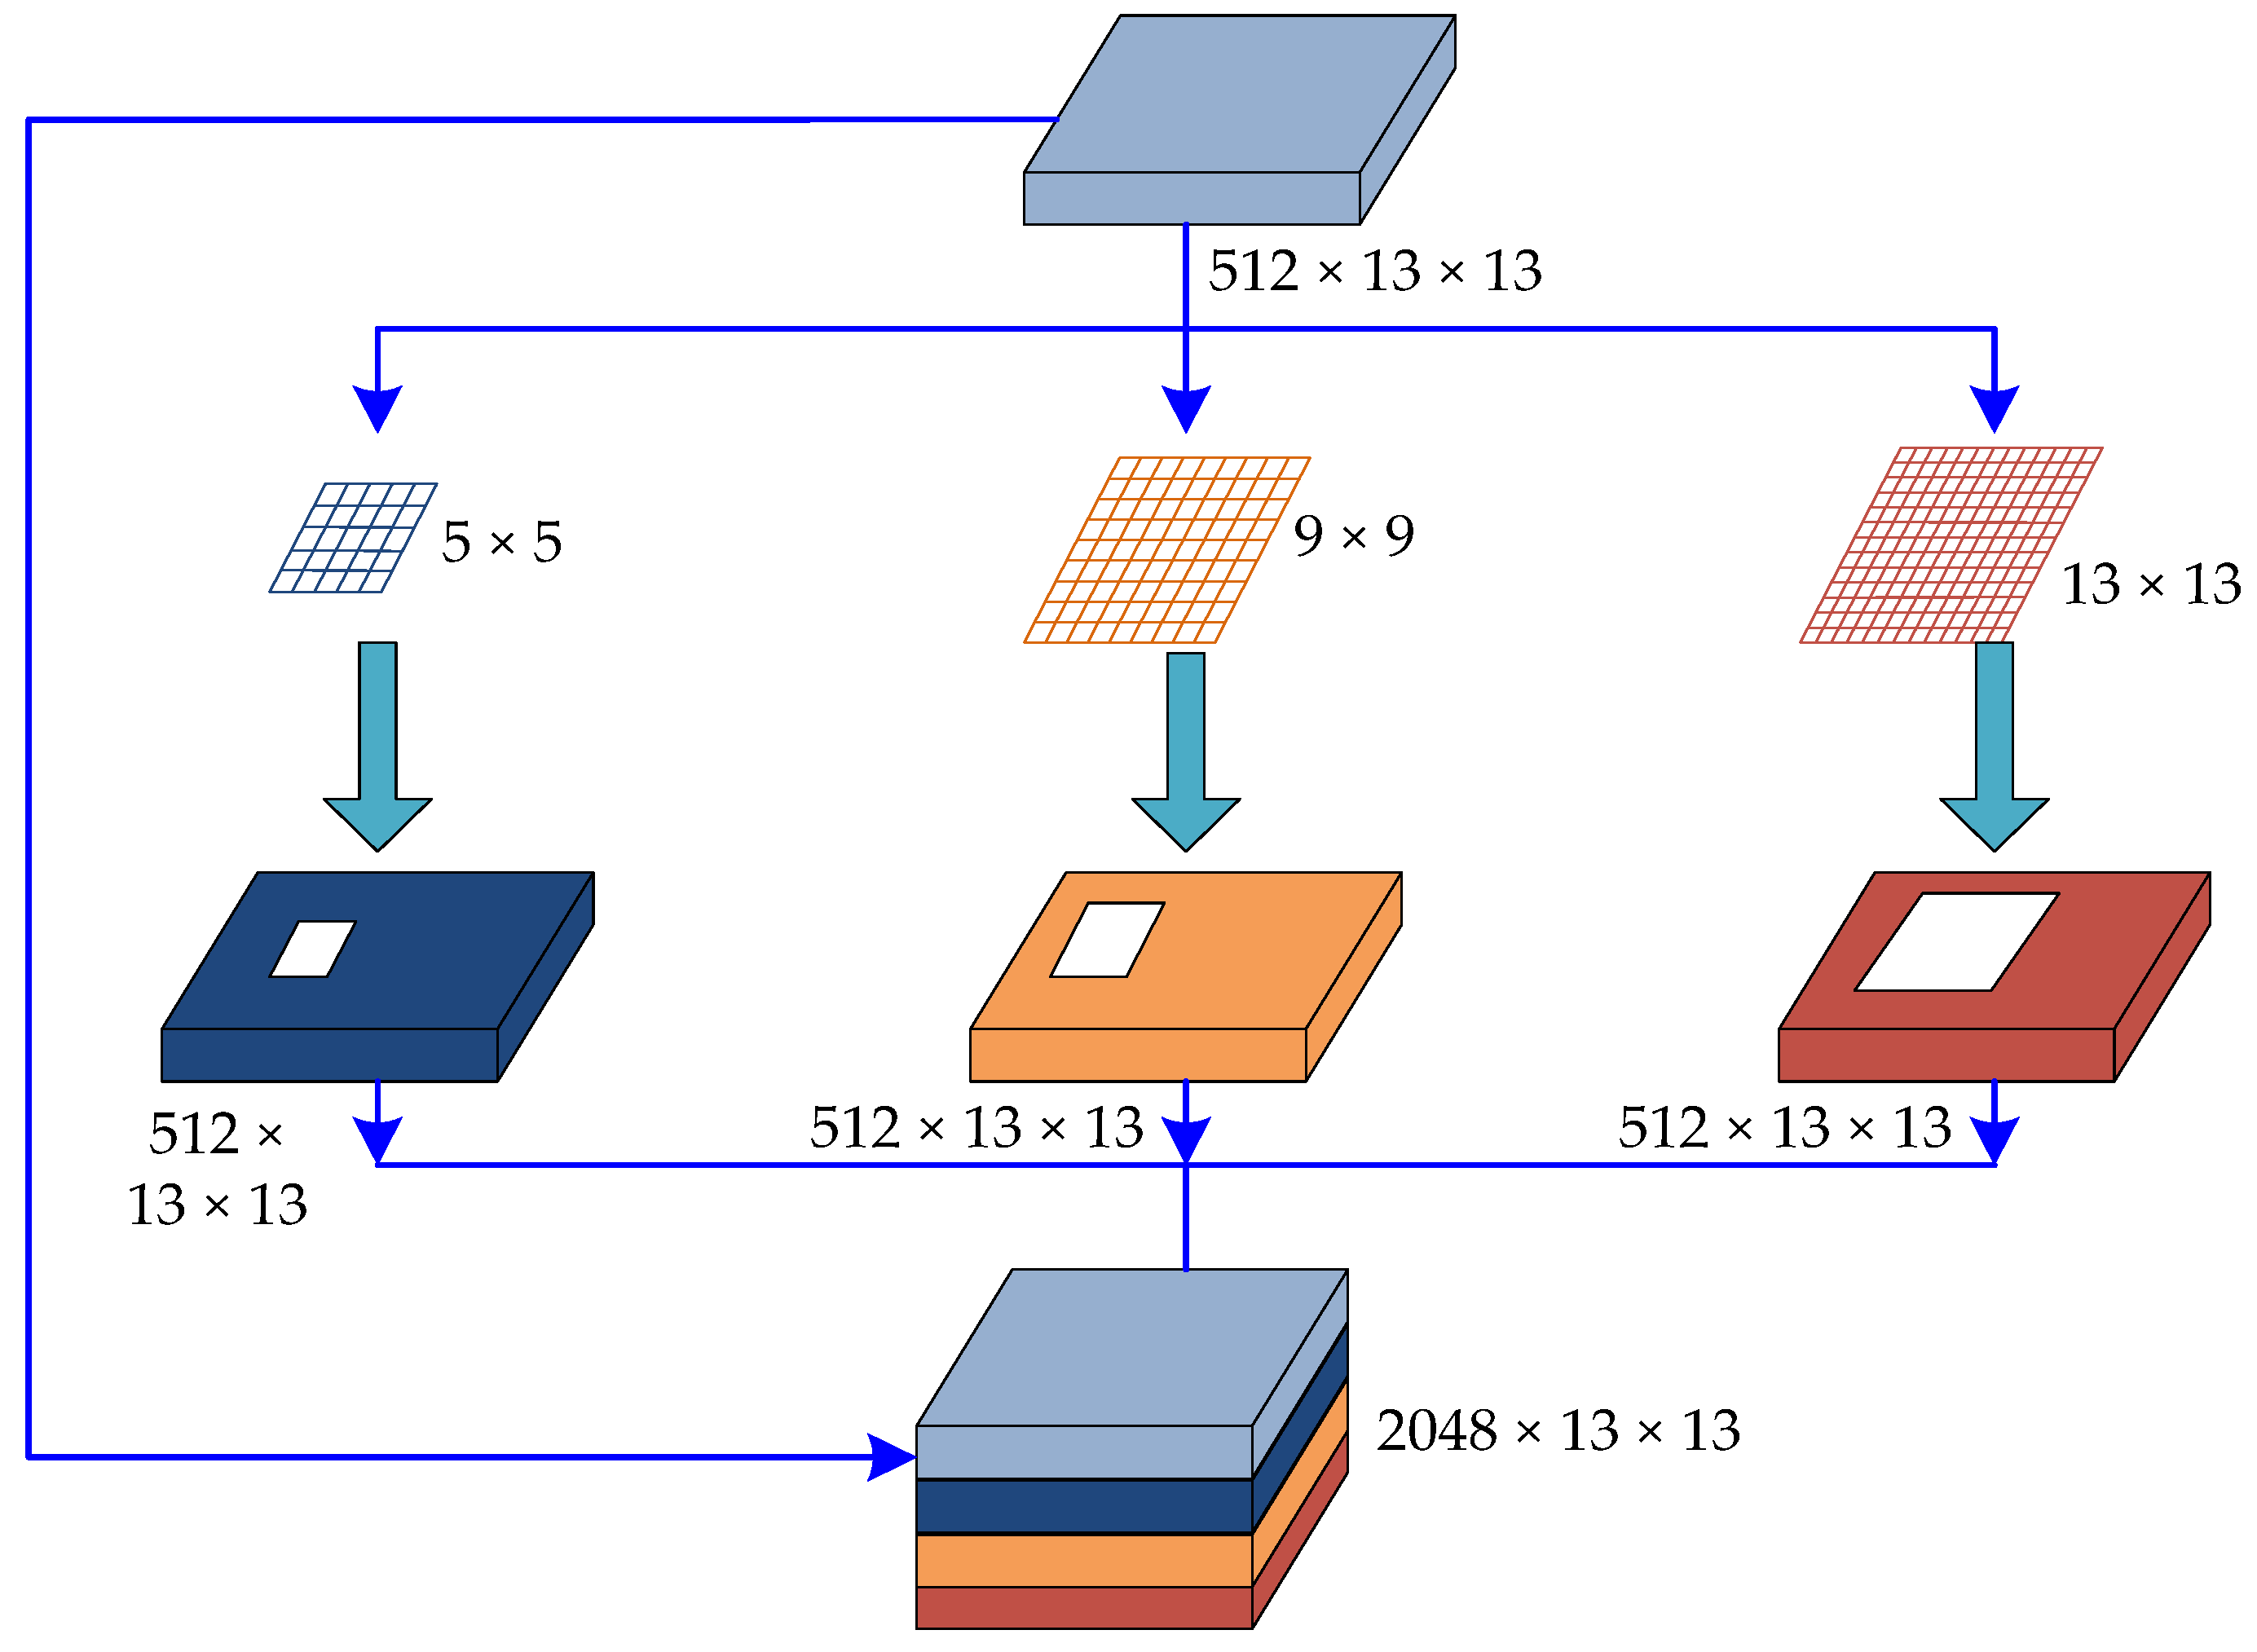
3.2. Structure of SPP-Networks

Pooling operation is indispensable for neural networks because it makes the network model more focused on the main features, increases the receptive fields of the convolution kernel, and enhances the fitting ability of the neural network. SPP-network is a kind of pooling method, which reduces the dimensions of feature representation through multi-scale pooling layers, to capture features under different scales. To generate multiple effective receptive fields of the specific scale of insulator faults, inspired by the works of [45,46,47], three SPP-networks were employed to the improved YOLOv3 network model, using filters and pooling operations to process the input feature maps at different rates. The structure of SPP-network is shown in Figure 5, which is composed of max pooling layers with different kernel sizes (5 × 5, 9 × 9, 13 × 13).
Specifically, the SPP-networks were connected to the output feature layers (13 × 13, 26 × 26, and 52 × 52) of the feature extraction network, respectively. Firstly, the input feature maps of SPP-networks were adjusted to (512 × 13 × 13), (256 × 26 × 26), and (128 × 52 × 52). Secondly, pooling operations with the filters of (5 × 5, 9 × 9, and 13 × 13) were performed on the input feature maps (512 × 13 × 13), (256 × 26 × 26), and (128 × 52 × 52) to generate multi-scale local feature maps. Finally, the generated multi-scale local feature maps were concatenated with the input feature maps to obtain the output feature maps (2048 × 13 × 13), (1024 × 26 × 26), and (512 × 52 × 52), respectively. Compared with the original local region feature maps, the final feature maps obtain larger receptive fields and more abundant local feature information. SPP-network eliminates the effect of inconsistent effective feature information, which is helpful to improve the accuracy of insulator fault detection.

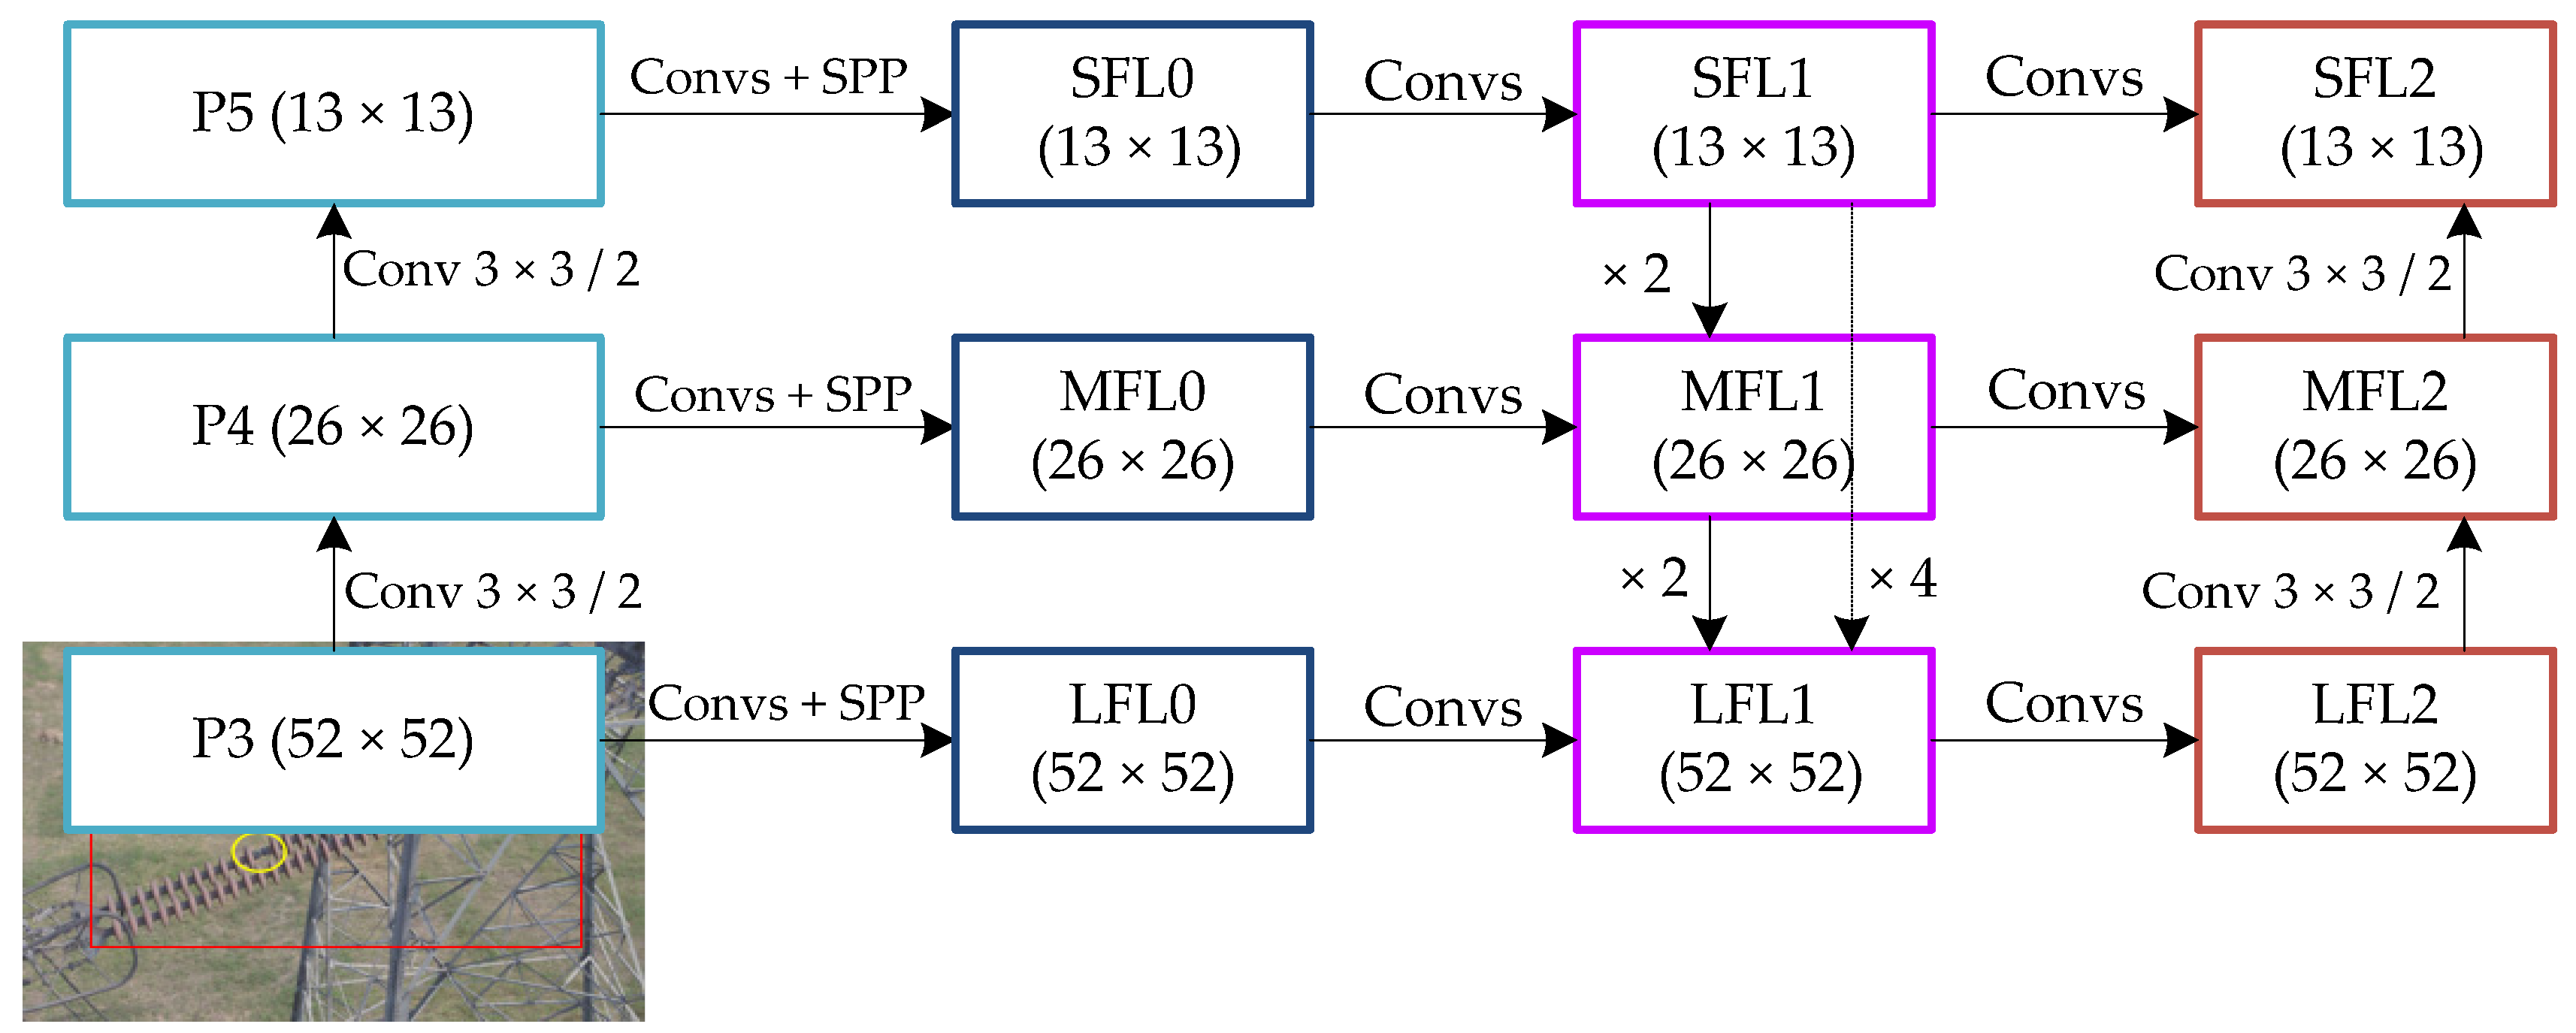
3.3. Feature Pyramid Network of the Improved YOLOv3

Compared with high-level feature layers, the detail and position information of the shallow-level feature layers is generally richer, however, due to the gradual deepening of feature layers, some detail and position information decreases, while the semantic information increases, so the deeper the high-level feature layers, the more abundant the semantic information. Therefore, after adding the structure of SPP-networks, to enhance the feature representation and further realize the feature reuse, the top-down and bottom-up fusion strategy was presented to improve the multi-scale prediction network [48]. The structure of improved multi-scale prediction network is shown in Figure 6.
As can be seen from Figure 6, the specific improvement process of the multi-scale prediction structure in this work was as follows: Three effective feature layers P3 (256 × 52 × 52), P4 (512 × 26 × 26), and P5 (1024 × 13 × 13) were extracted through the feature extraction network of the improved YOLOv3 network model. Firstly, convolution operations and SPP were performed on the effective feature layers P3, P4, and P5 to obtain large feature layer (LFL0), medium feature layer (MFL0), and small feature layer (SFL0). Secondly, the small feature layer (SFL1) was obtained by performing convolution operations of SFL0; and the result of up-sampling (×2) of SFL1 was fused with the result of convolution operations of MFL0 to obtain medium feature layer (MFL1); and then the results of up-sampling (×4) of SFL1, up-sampling (×2) of MFL1, and convolution operations of LFL0 were concatenated to obtain large feature layer (LFL1), thereby the bottom-up feature fusion is completed. Finally, the large feature layer (LFL2) was obtained by performing convolution operations of LFL1; and the result of down-sampling of LFL2 was fused with the result of convolution operations of MFL1 to obtain medium feature layer (MFL2); and then the results of down-sampling of MFL2, and convolution operations of SFL1 were concatenated to obtain small feature layer (SFL2), thereby the top-down feature fusion is completed. The final obtained large feature layer (LFL2), medium feature layer (MFL2), and small feature layer (SFL2) were used for multi-scale (52 × 52, 26 × 26, and 13 × 13) prediction, respectively. In this paper, the top-down and bottom-up feature fusion strategy were used to improve the multi-scale prediction network. Although the computational complexity has increased to some extent, the prediction accuracy can be improved.

3.4. Loss Function of the Improved YOLOv3

In the improved YOLOv3 model, the input image (416 × 416) is divided into S × S grids, and each grid predicts B bounding boxes at three scales (52 × 52, 26 × 26, and 13 × 13). The loss function l o s s in the improved YOLOv3 model is defined in Formula (2), which can be divided into four parts: the position loss function l x y , the scale loss function l w h , the confidence loss function l c o n , and the classification loss function l c l s . The position loss function, scale loss function, confidence loss function, and classification loss function are defined in Formulas (3)–(6), respectively.
l o s s = l x y + l w h + l c o n + l c l s
l x y = λ c o o r d × i = 0 S 2 j = 0 B 1 i j o b j [ ( x i j x ¯ i j ) 2 + ( y i j y ¯ i j ) 2 ]
l w h = λ c o o r d × i = 0 S 2 j = 0 B 1 i j o b j [ ( w i j w ¯ i j w ¯ i j ) 2 + ( h i j h ¯ i j h ¯ i j ) 2 ]
l c o n = i = 0 S 2 j = 0 B 1 i j o b j [ ( C i j C ¯ i j ) 2 ] + λ n o o b j i = 0 S 2 j = 0 B 1 i j n o o b j [ ( C i j C ¯ i j ) 2 ]
l c l s = i = 0 S 2 1 i j o b j c c l a s s [ ( p i ( c ) p ¯ i ( c ) ) 2 ]
Concretely, in Formulas (3)–(6), λ c o o r d denotes the weight of coordinate error, and λ n o o b j is the weight of Intersection over Union (IoU) error. 1 i j o b j refers to whether an object falls in the j t h bounding box of grid i . ( x ¯ , y ¯ ) is the center coordinate of bounding box, ( w ¯ , h ¯ ) are the width and height of bounding box, and ( x , y ) is the center coordinate of true value, ( w , h ) are the width and height of true value. C ¯ and C denote the predicted confidence and true confidence, p i ( c ) and p i ¯ ( c ) are the true probability and predicted probability of object classification, respectively.

4. Experiments Results and Discussion

In this work, the experimental conditions are as follows: in terms of hardware, the CPU is Intel(R) Core(TM) i9-9900K with 3.60GHz, the GPU is NVIDIA GeForce GTX 3080 with 10G memory, and the total memory is 32GB; in terms of software, CUDA 11.1 and cuDNN 8.0.5 are equipped with Open CV 3.4.0, Visual Studio 2017, Windows 10, and training framework of Dark-net [49], as shown in Table 1.

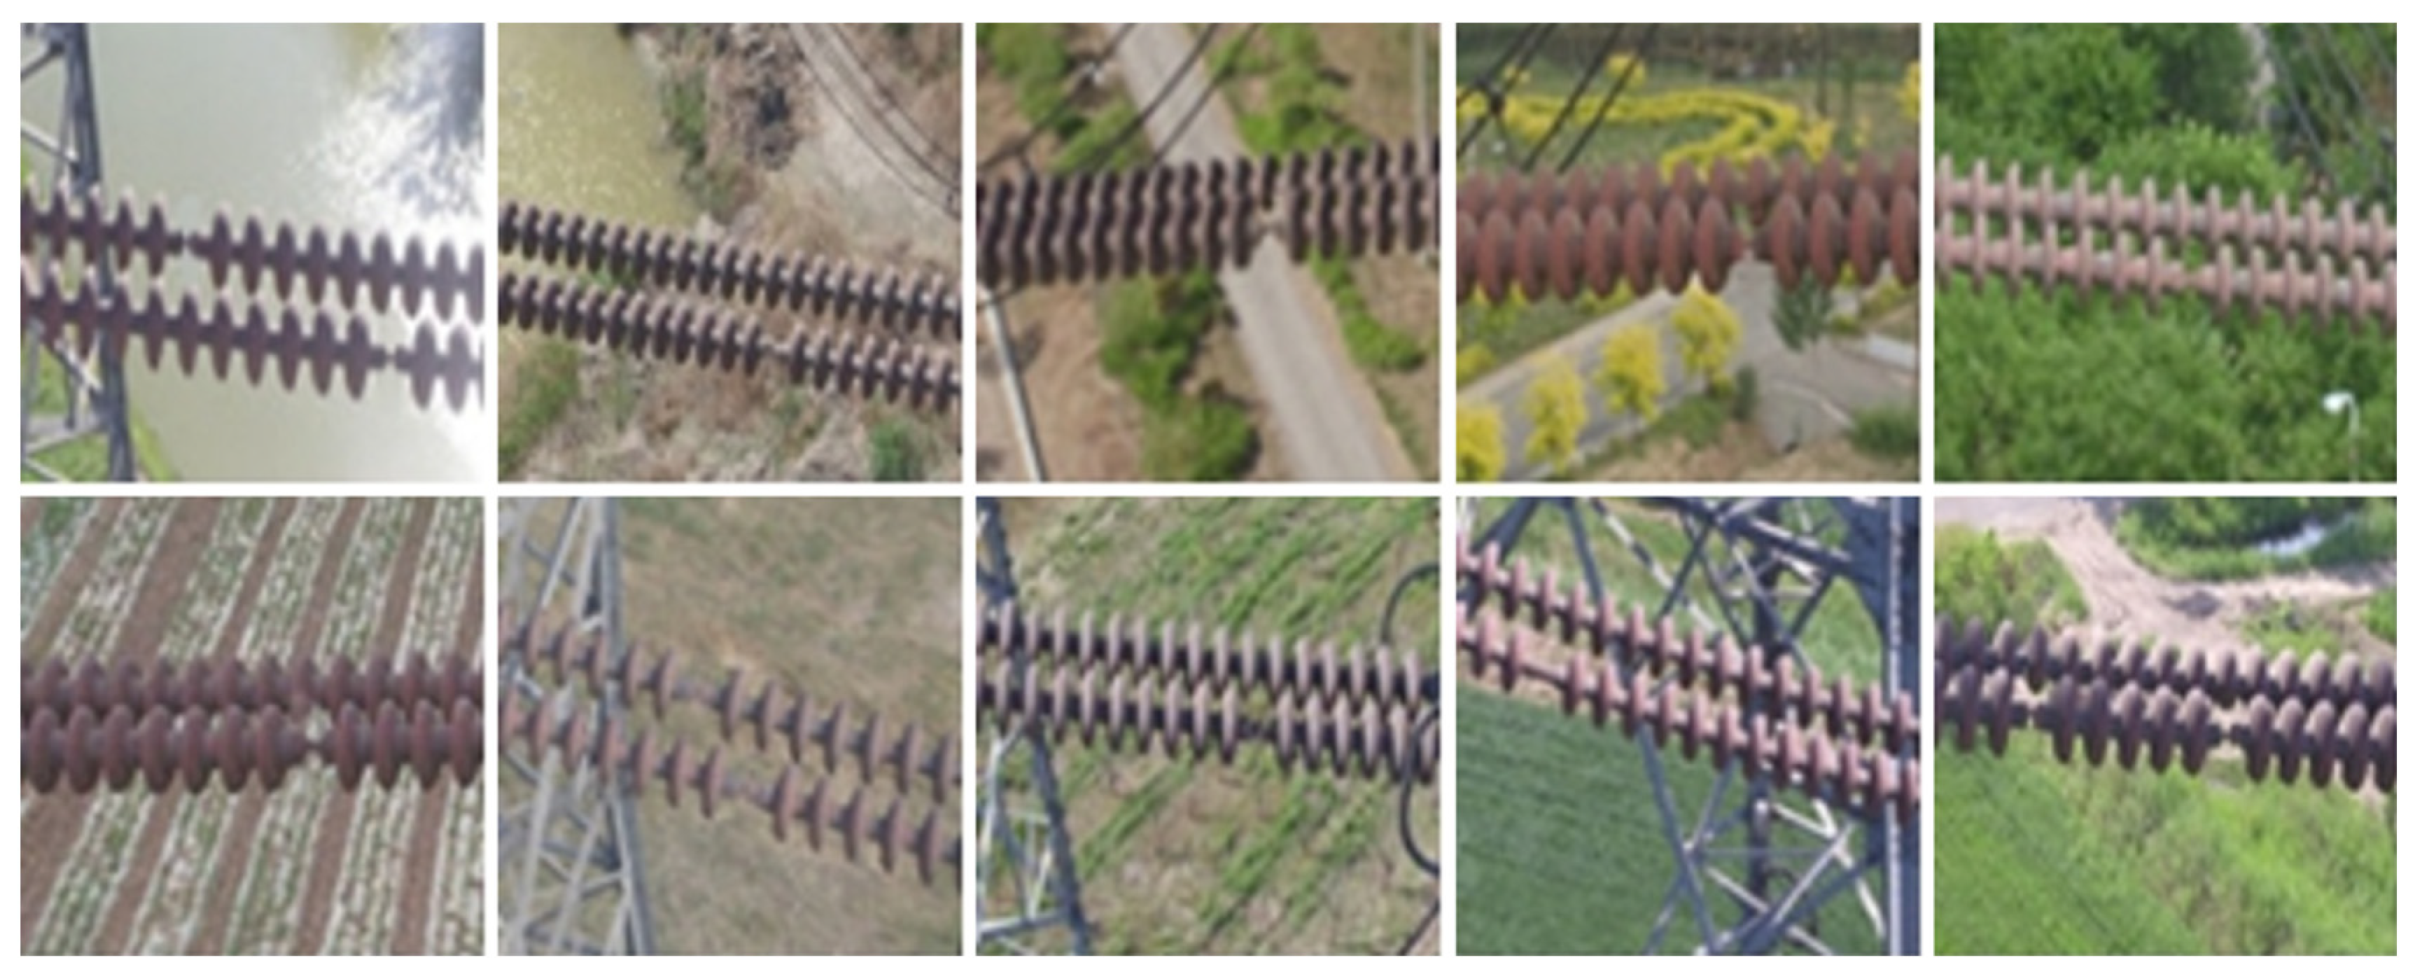
4.1. Dataset Preparation

Since aerial images of insulator faults are rare, it is hard to obtain enough fault images for training and testing. To solve this problem, the simulated insulator fault samples were created using the Photoshop tool based on the dataset “CPLID” (Chinese Power Line Insulator Dataset) [50], the samples of insulator faults are shown in Figure 7. Then, the Label-Image tool [51] was used to label the fault position of insulators in aerial images, finally, the insulator fault dataset named ‘InSF-detection’ (Insulator Fault, InSF) was created, including 864 aerial images with single-fault or multi-fault. Among them, 576 aerial images were randomly selected as a training set, and the other 288 aerial images were assigned to be a testing set. All the images were resized as 416 × 416 pixels. The details of dataset ‘InSF-detection’ are shown in Table 2.

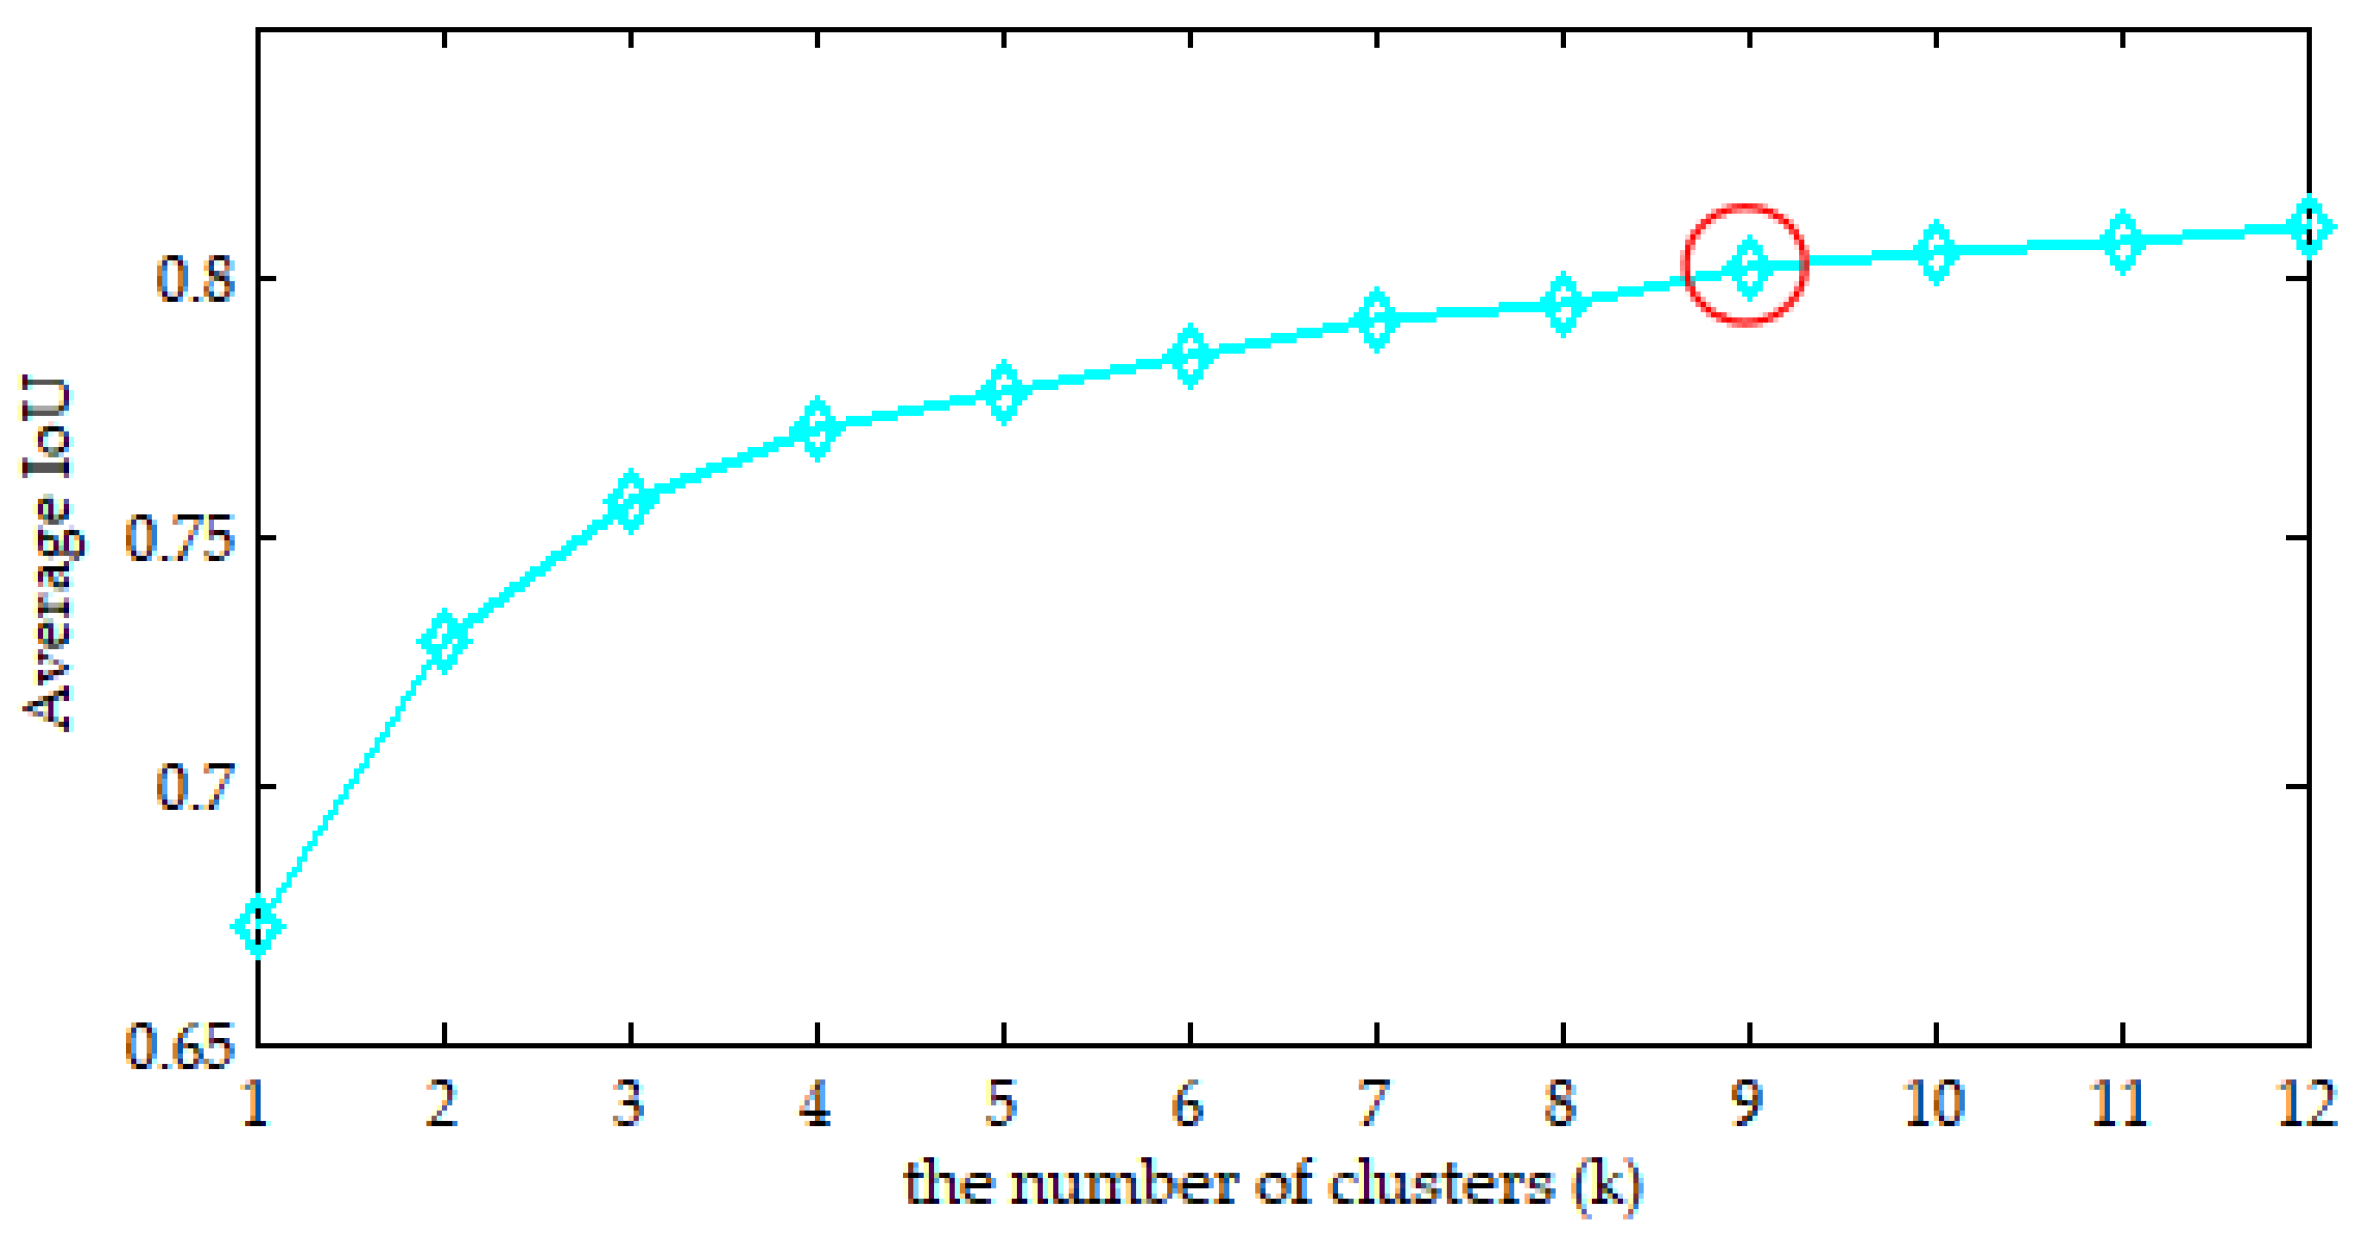
4.2. Anchor Boxes Clustering

Anchor boxes are a series of candidate boxes with a certain width and height, which directly affect the accuracy and detection speed of deep learning models. Generally, k-means clustering algorithm is adopted to YOLOv3 network. In this work, k-mean++ clustering algorithm [52] was employed to the improved YOLOv3 model. The algorithm was performed on dataset “InSF-detection” and the result is shown in Figure 8. In this experiment, a total of 12 cluster centers were selected to analysis dataset ‘InSF-detection’, when the number k = 9, the corresponding average IoU = 80.25%. And when the number k is greater than 9, the average IoU varies slowly. Finally, the clustering center of dataset “InSF-detection” was chosen to be 9, and the corresponding anchor boxes for insulator fault detection were obtained as follows: (18 × 14), (22 × 17), (22 × 20), (21 × 23), (26 × 19), (24 × 23), (28 × 23), (26 × 29), and (32 × 29), respectively.

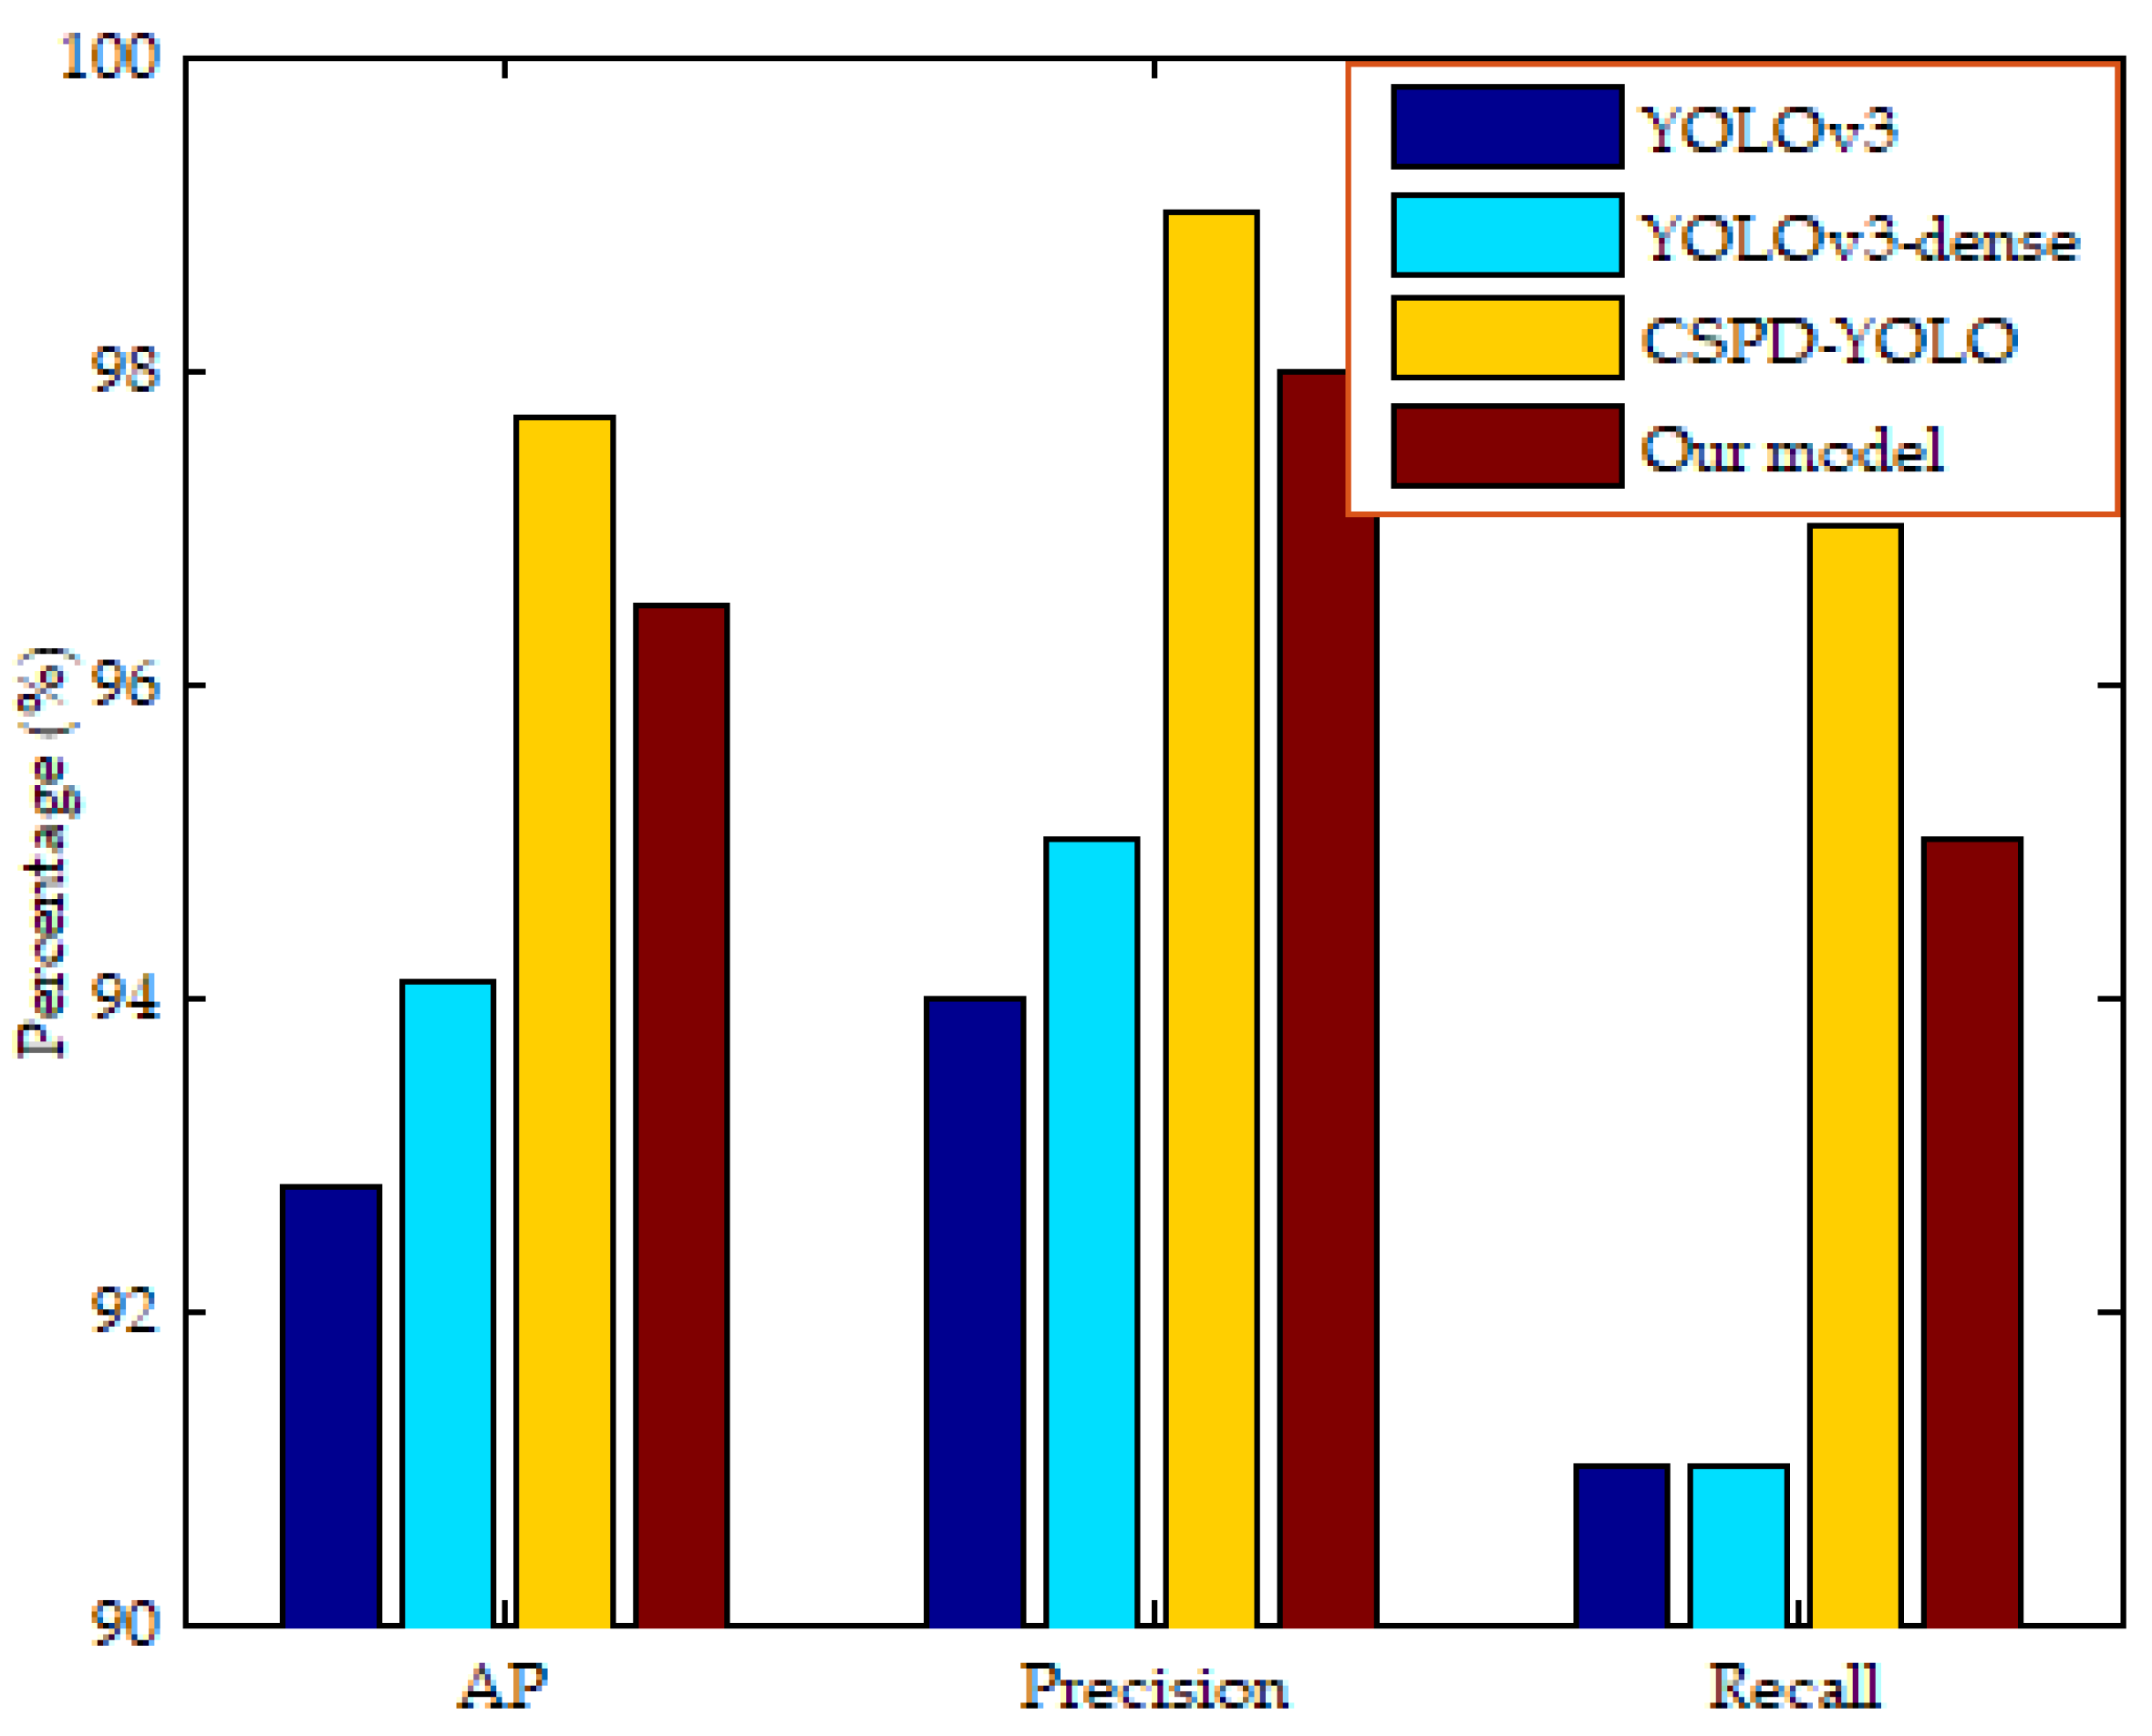
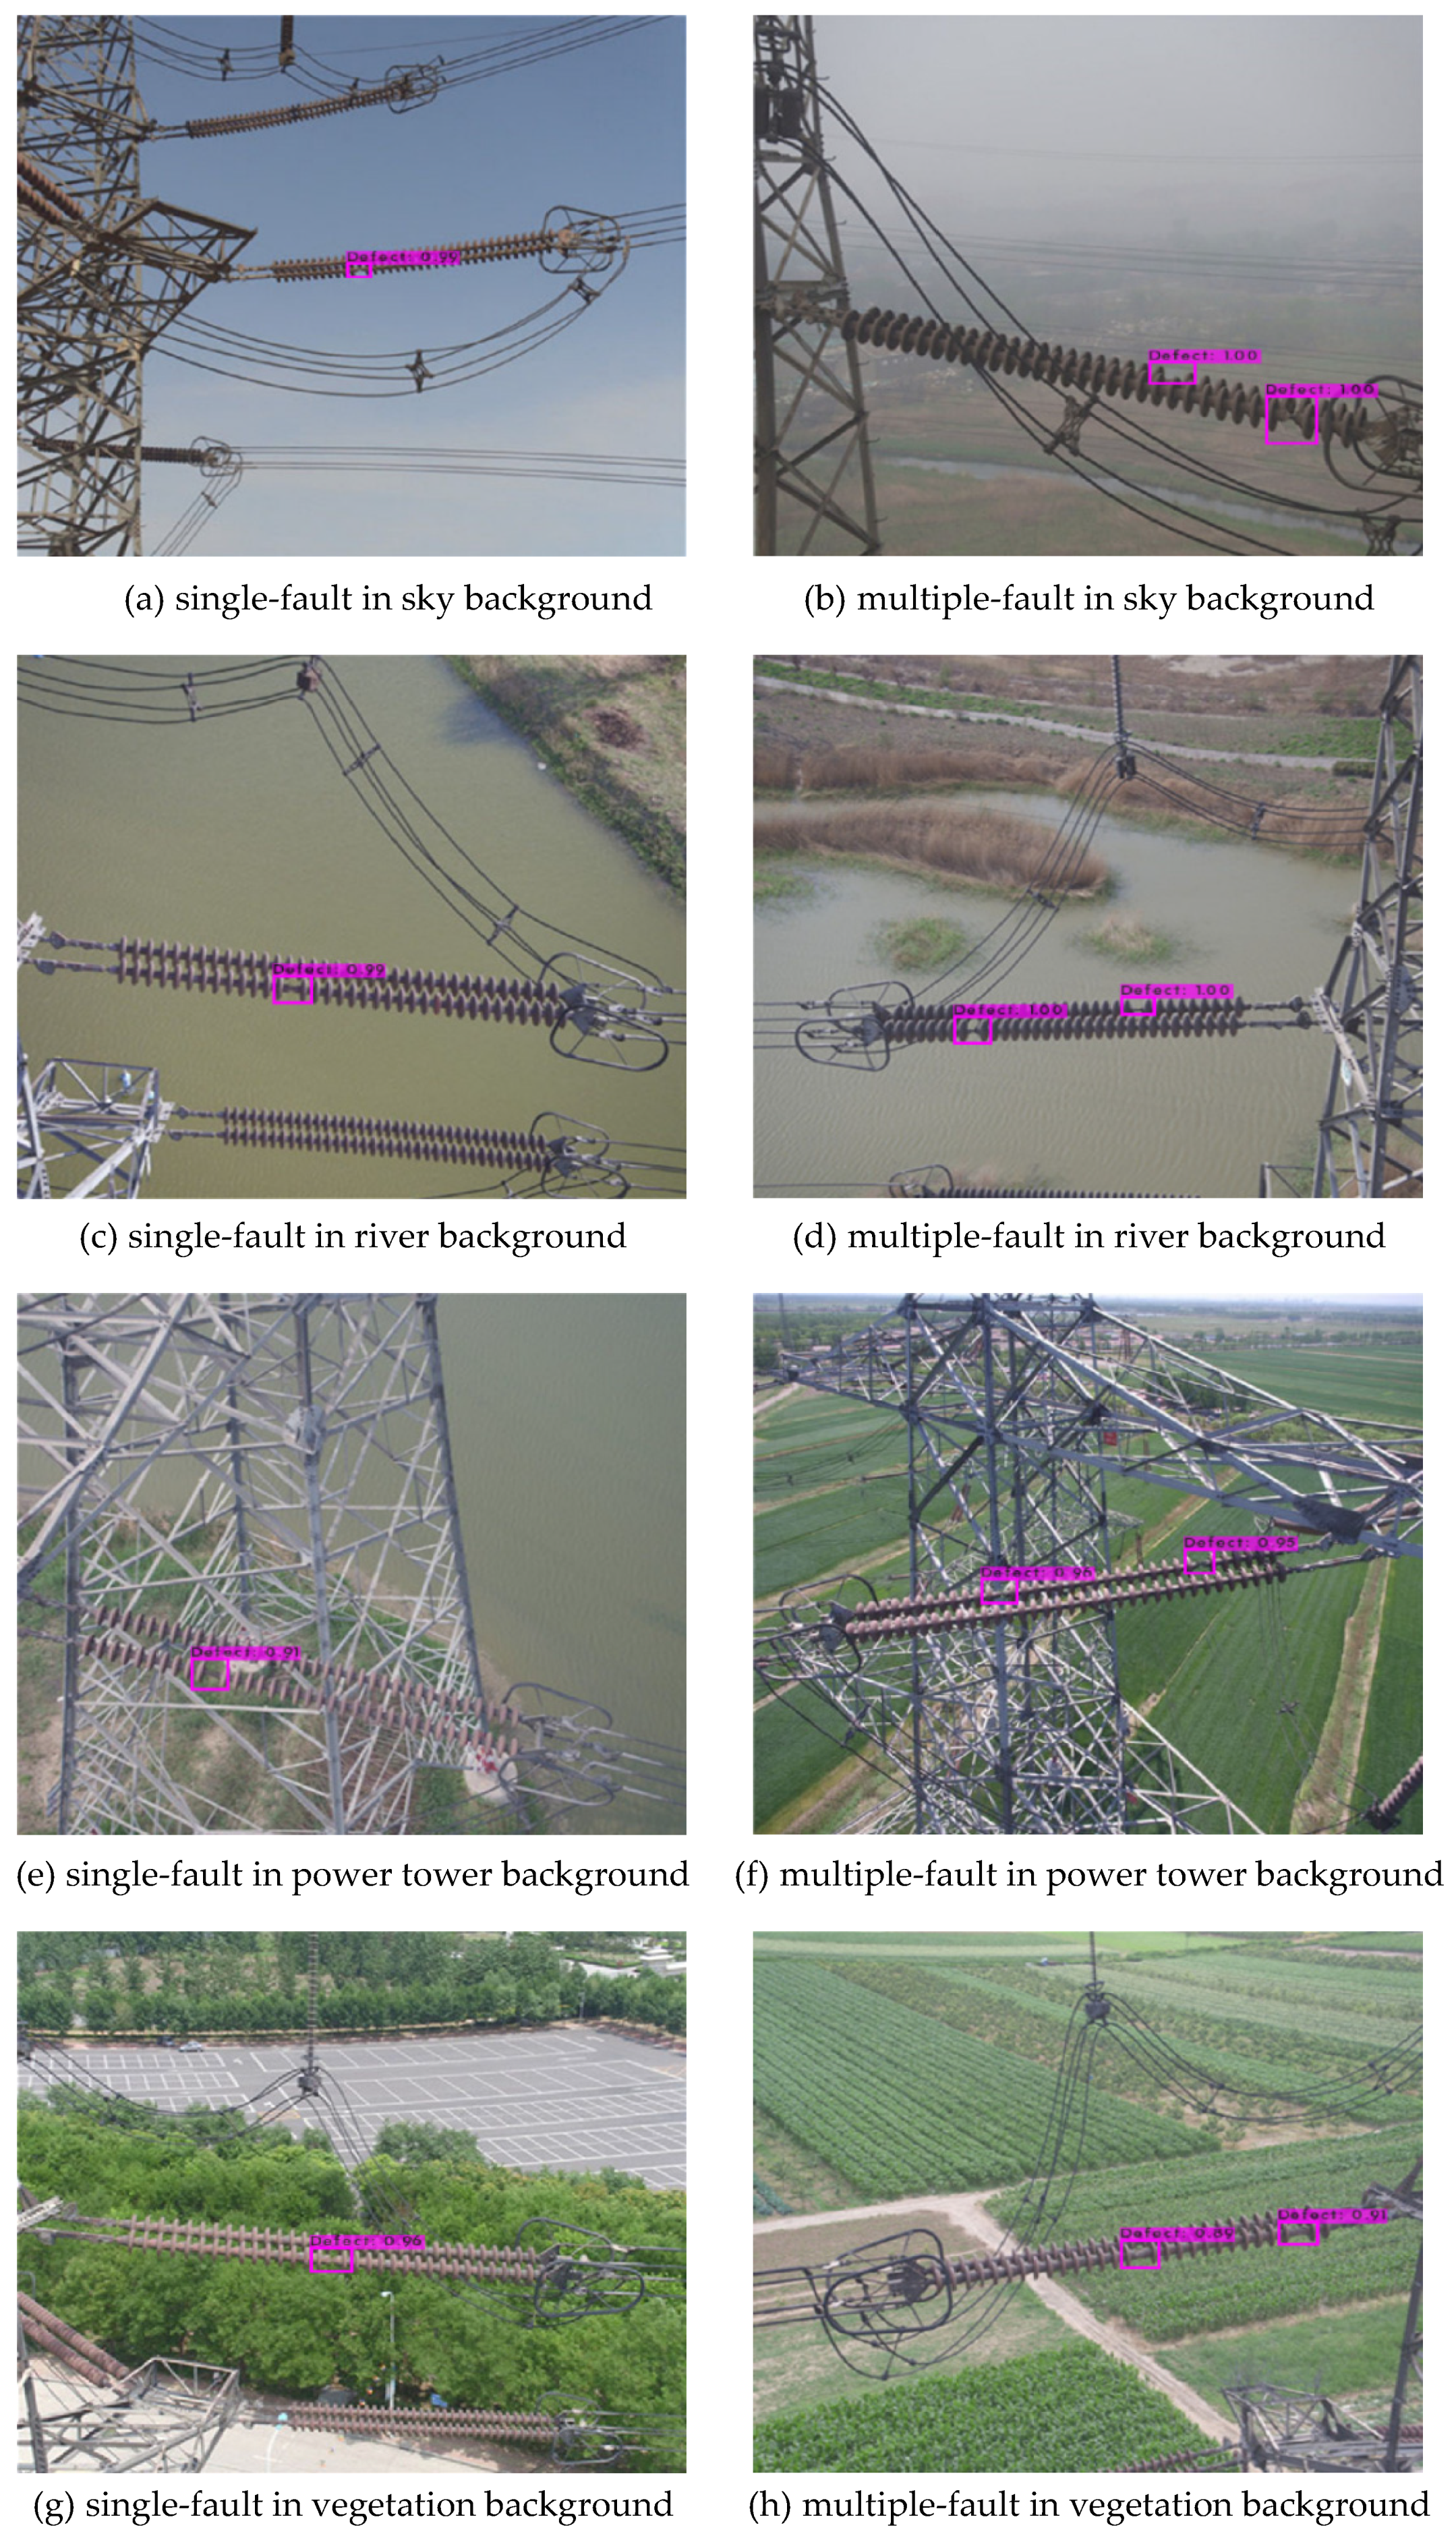
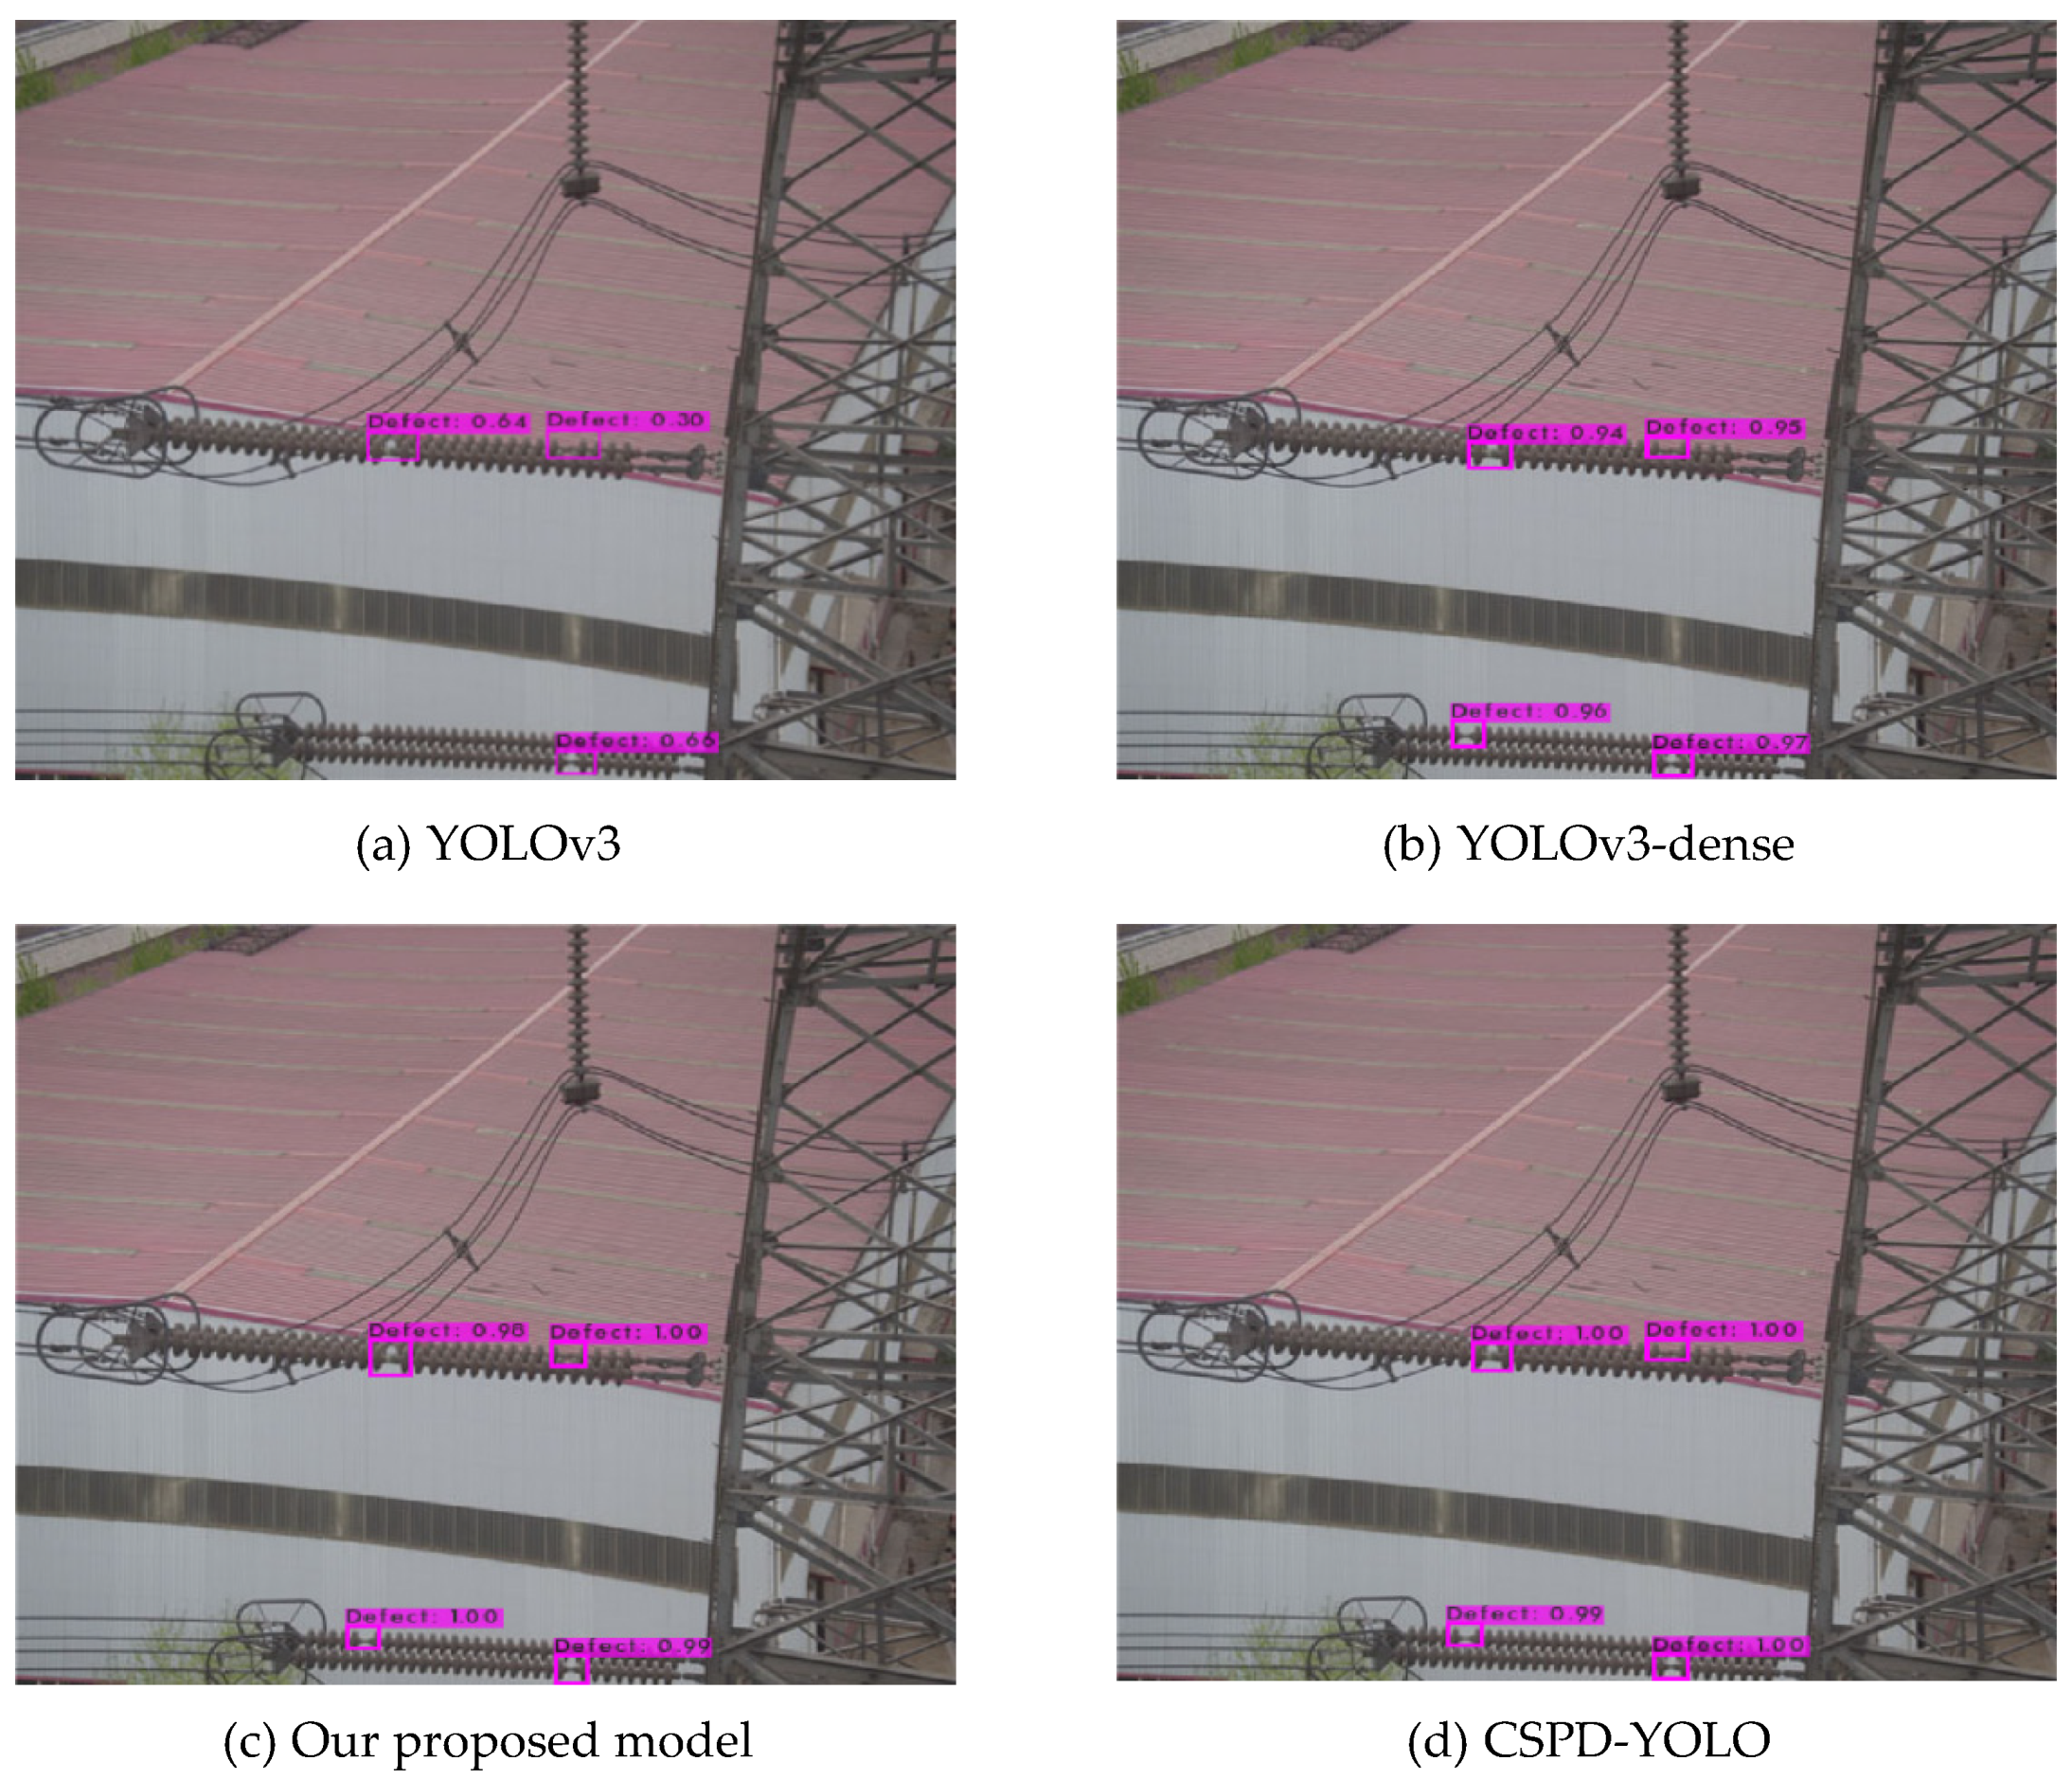
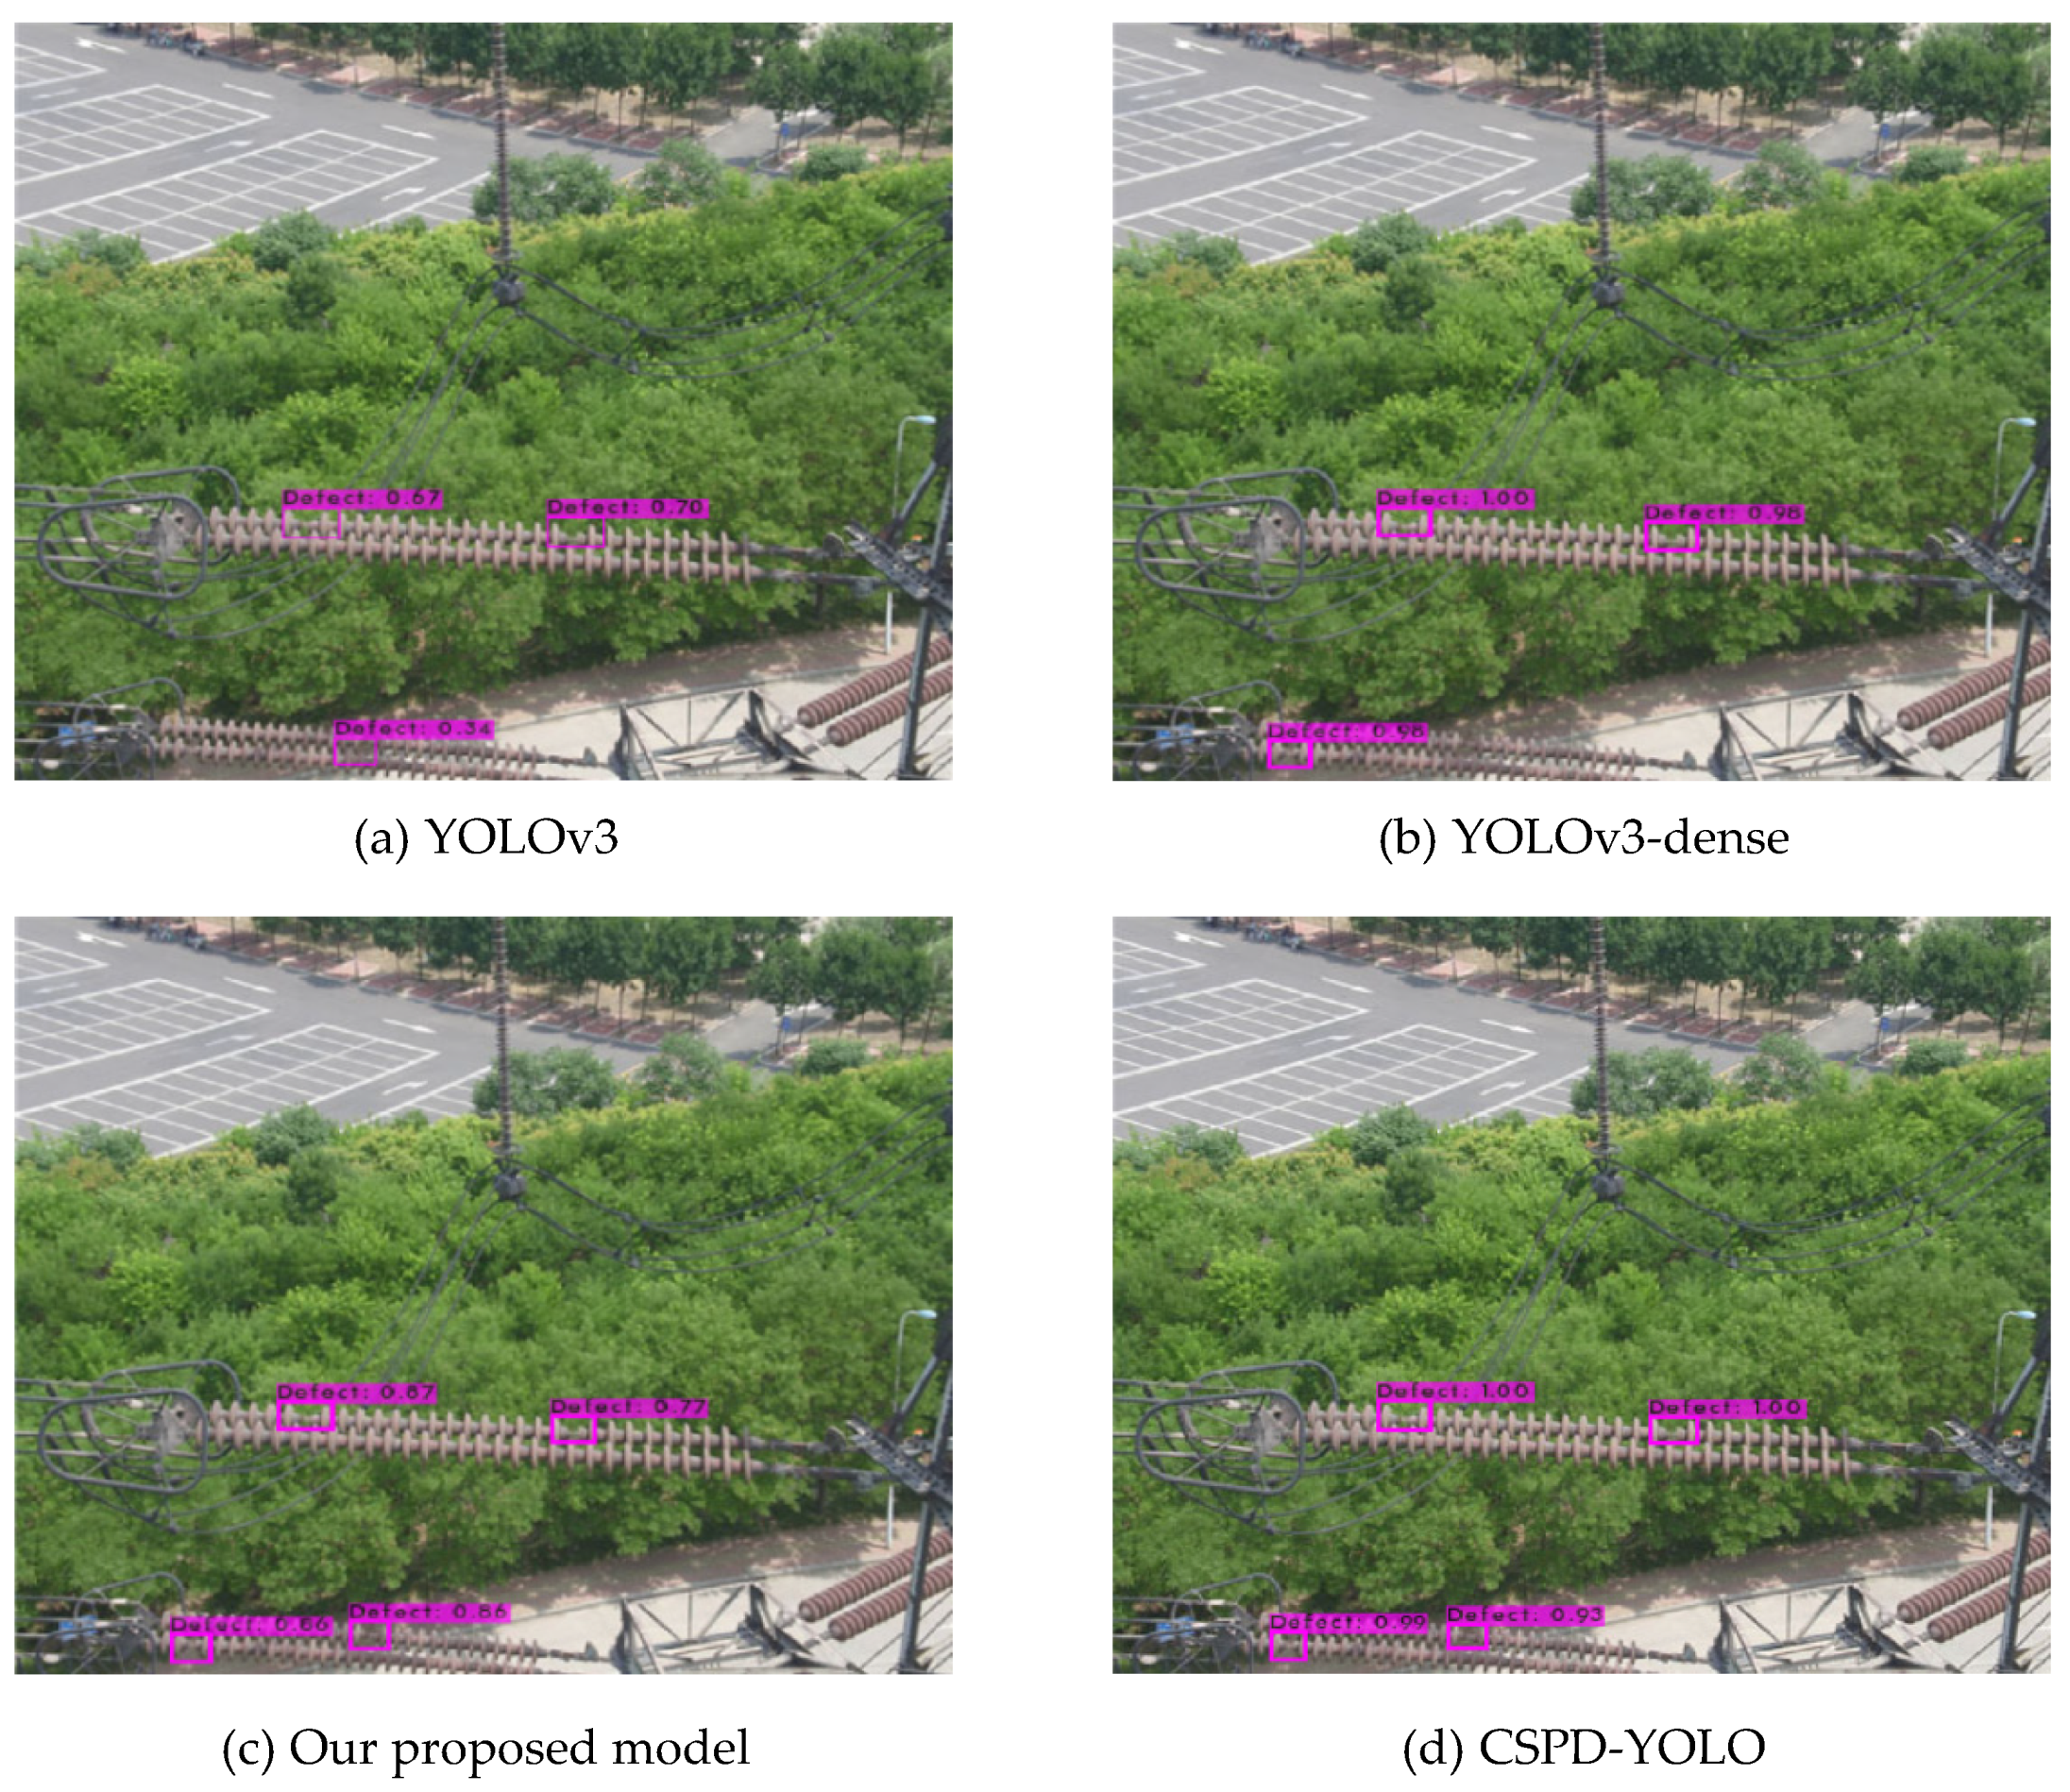
4.3. Quantitative and Qualitative Analysis

To verify the practicability of the improved YOLOv3 model proposed in this paper for insulator fault detection, experiments were conducted on four network models: YOLOv3, YOLOv3-dense [38], CSPD-YOLO [39], and our proposed model (improved YOLOv3 model). The four models were trained and then tested on the same dataset “InSF-detection” for a fair comparison. The values of Average Precision (AP), Precision (P), Recall (R), and the curve of Precision-Recall (P-R) are used to evaluate the effects of the improved YOLOv3 and the compared models. The true positive (TP), false positive (FP), true negative (TN), and false negative (FN) used in binary classification problem are defined as shown in Table 3.
Precision (P), which denotes the proportion of all correctly detected results to all the predicted results, is defined as Formula (7). Recall (R), which denotes the proportion of all correctly detected results to all the results that should be predicted, is defined as Formula (8). The P-R curve is obtained by using the precision as y-axis and the recall as the x-axis. The Average Precision (AP), which can be calculated by the area under the P-R curve, is defined as Formula (9).
P r e c i s i o n ( P ) = T P T P + F P
R e c a l l ( R ) = T P T P + F N
A P = 0 1 P ( R ) dR
To evaluate the effectiveness of insulator fault detection, the proposed model and the compared models (YOLOv3, YOLOv3-dense, and CSPD-YOLO) were trained, and then tested on the testing set of ‘InSF-detection’. The experimental effects (AP, Precision, Recall, and Memory usage) of the models for insulator fault detection are listed in Table 4. Specifically, the AP values of the four models were YOLOv3 (92.8%), YOLOv3-dense (94.1%), CSPD-YOLO (97.7%), and the improved YOLOv3 (96.5%); the Precision (P) values of the four models were YOLOv3 (94%), YOLOv3-dense (95%), CSPD-YOLO (99%), and the improved YOLOv3 (98%); the Recall (R) values of the four models were YOLOv3 (91%), YOLOv3-dense (91%), CSPD-YOLO (97%), and the improved YOLOv3 (95%), respectively, and the corresponding histogram is shown in Figure 9.
Based on the observation of Figure 9, the AP value of our proposed model was 3.7% higher than that of YOLOv3 and 2.4% higher than that of YOLOv3-dense, while slightly (1.2%) lower than that of CSPD-YOLO; the precision of our proposed model was 4% higher than that of YOLOv3 and 3% higher than that of YOLOv3-dense, while just a little (1%) lower than that of CSPD-YOLO; the recall of our proposed model was 4% higher than that of YOLOv3 and YOLOv3-dense, while just a little (2%) lower than that of CSPD-YOLO. Compared with the models of YOLOv3, YOLOv3-dense, and CSPD-YOLO, the performance (AP, Precision, and Recall) of our proposed model is superior to the YOLOv3 and YOLOv3-dense, and almost consistent with that of the CSPD-YOLO model. Moreover, the performances of the four models were also evaluated by memory usage, and the memory usages of the four models were YOLOv3 (240 MB), YOLOv3-dense (248 MB), CSPD-YOLO (265 MB), and our proposed model (225 MB); the memory usage of our proposed model was 6.25%, 9.27%, and 15.1% lower than those of YOLOv3, YOLOv3-dense, and CSPD-YOLO, respectively. Therefore, to achieve a good trade-off among the AP, Precision, Recall, and Memory usage, our proposed model is more advantageous than YOLOv3, YOLOv3-dense, and CSPD-YOLO models, and our proposed model can be deployed on embedded devices for insulator fault on-line detection in aerial images from high-voltage transmission lines.
Furthermore, due to aerial images captured by UAV including different backgrounds, to further evaluate the detection performance of the proposed model, the experimental results conducted on the improved YOLOv3 model are provided in Figure 10a–h, under the conditions of simple backgrounds or complex backgrounds. Specifically, Figure 10a,c,e,g are experimental results with single-fault in each image, and Figure 10b,d,f,h are experimental results with multiple-fault in each image. Figure 10a,b reveals the experimental scene of sky with single-fault and multiple-fault, respectively. Figure 10c,d exhibits the background interference of river with single-fault and multiple-fault, respectively. Since the backgrounds of sky and river are relatively simple, all the insulator faults in the aerial images were detected easily by the proposed model. Figure 10e,f demonstrates the experimental scene of tower with single-fault and multiple-fault, and the image background interference of vegetation with single-fault and multiple-fault are shown in Figure 10g,h. Although the backgrounds of tower and vegetation are complex, all the insulator faults in aerial images were detected accurately by the proposed model. Meanwhile, some insulator strings in the image are occluded, but the insulator faults were effectively detected. Therefore, experimental results indicate that the proposed model can obtain good detection results in aerial images with different backgrounds.
Compared with the models of YOLOv3, YOLOv3-dense, and CSPD-YOLO, to verify the robustness and effectiveness of the improved YOLOv3 model, some typical aerial images were selected to present the visualized experimental results of the four network models, as shown in Figure 11, Figure 12 and Figure 13. Specifically, the backgrounds of river, building, and vegetation are shown in Figure 11, Figure 12 and Figure 13, respectively. Based on the observation of figures, the backgrounds of aerial images are complicated, and there are multiple-fault of insulators in each image. As it can be seen in Figure 11, there are four faults in each image, although the faults of insulator are extremely small and the color of insulator is similar to that of background, all the insulator faults were correctly detected by CSPD-YOLO (Figure 11d). While two insulator faults were correctly detected by YOLOv3 (Figure 11a) and YOLOv3-dense (Figure 11b), and three insulator faults were correctly detected by our proposed model (Figure 11c), moreover, there is a misdetection in Figure 11a. The experimental results with background of building are shown in Figure 12, three insulator faults were correctly detected by YOLOv3 (Figure 12a). All the faults of insulators were accurately detected by YOLOv3-dense (Figure 12b), our proposed model (Figure 12c), and CSPD-YOLO (Figure 12d). Figure 13 shows the detection results with the background of vegetation. Due to the background complexity, three insulator faults were detected by YOLOv3 (Figure 13a) and YOLOv3-dense (Figure 13b), and the position of predicted boxes of YOLOv3 are inaccurate. All the insulator faults in the images were effectively detected by our proposed model (Figure 13c) and CSPD-YOLO (Figure 13d). Consequently, compared with the networks of YOLOv3, and YOLOv3-dense, our proposed network model achieves better performance for insulator fault detection with complex backgrounds.
When insulator faults occur, they should be located and repaired as soon as possible, otherwise, the electrical insulation performance of insulators will be reduced and the stability of the high-voltage transmission lines will be affected. It is necessary to detect insulator faults timely and accurately. Our proposed model has good prospects for applications on UAV for real-time inspection of high-voltage transmission lines. For a future study, the proposed model could be utilized on UAV for real-time insulator fault detection. In addition, it would be necessary work to perform fault detection on insulator string with flashover, and contamination.

5. Conclusions

This study presented an improved YOLOv3 model for insulator fault detection in aerial images from high-voltage transmission lines. First, a novel insulator fault dataset named ‘InSF-detection’ was created, solving the problem of insufficient insulator fault images. After that, DenseNets were adopted to the feature extraction network of our proposed model for reusing and preventing the loss of features. SPP-networks and improved multi-scale prediction network were employed in our proposed model to improve the accuracy of insulator fault detection. Finally, our proposed model and the compared models were trained and tested on the same testing set. Experimental results with the compared models showed that: the AP values of YOLOv3, YOLOv3-dense, CSPD-YOLO, and the improved YOLOv3 were 92.8%, 94.1%, 97.7%, and 96.5%, respectively, proving that the improved YOLOv3 was superior to YOLOv3 and YOLOv3-dense models, and was close to CSPD-YOLO model. More importantly, the memory usage of the improved YOLOv3 (225 MB) was 6.25%, 9.27%, and 15.1% lower than those of YOLOv3 (240 MB), YOLOv3-dense (248 MB), and CSPD-YOLO (265 MB), respectively. To achieve a good trade-off among the AP, Precision, Recall, and Memory usage, the improved YOLOv3 model is more advantageous than the compared models. Consequently, it can be concluded that the improved YOLOv3 model achieves good performance for insulator fault detection in aerial images with diverse backgrounds, the improved YOLOv3 model has the potential of actual applications for high-voltage transmission lines on-line inspection.

Author Contributions

Writing—original draft, J.L.; Writing—review & editing, Y.W.; methodology, experiments, C.L.; validation, H.X.; data curation, Z.S. All authors have read and agreed to the published version of the manuscript.

Funding

This research was funded by the National Nature Science Founding of China under grant 61573183; Open Project Program of the National Laboratory of Pattern Recognition (NLPR) under grant 201900029; Excellent Young Talents support plan in Colleges of Anhui Province Grant gxyq 2019109, gxgnfx 2019056.

Institutional Review Board Statement

Not applicable.

Informed Consent Statement

Not applicable.

Data Availability Statement

Not applicable.

Acknowledgments

The authors wish to thank the editor and reviewers for their suggestions and thank Yiquan Wu for his guidance.

Conflicts of Interest

The authors declare no conflict of interest.

References

  1. Zhao, Z.; Zhen, Z.; Zhang, L.; Qi, Y.; Kong, Y.; Zhang, K. Insulator Detection Method in Inspection Image Based on Improved Faster R-CNN. Energies 2019, 12, 1204. [Google Scholar] [CrossRef] [Green Version]
  2. Nguyen, V.N.; Jenssen, R.; Roverso, D. Automatic Autonomous Vision-Based Power Line Inspection: A Review of Current Status and the Potential Role of Deep Learning. Int. J. Electr. Power Energy Syst. 2018, 99, 107–120. [Google Scholar] [CrossRef] [Green Version]
  3. Zhai, Y.; Wang, D.; Zhang, M.; Wang, J.; Guo, F. Fault Detection of Insulator Based on Saliency and Adaptive Morphology. Multimed. Tools Appl. 2017, 76, 12051–12064. [Google Scholar] [CrossRef]
  4. Siddiqui, Z.A.; Park, U. A Drone Based Transmission Line Components Inspection System with Deep Learning Technique. Energies 2020, 13, 3348. [Google Scholar] [CrossRef]
  5. Han, J.; Yang, Z.; Xu, H.; Hu, G.; Zhang, C.; Li, H.; Lai, S.; Zeng, H. Search Like an Eagle: A Cascaded Model for Insulator Missing Faults Detection in Aerial Images. Energies 2020, 13, 713. [Google Scholar] [CrossRef] [Green Version]
  6. Li, Y.; Zhang, W.; Li, P.; Ning, Y.; Suo, C. A Method for Autonomous Navigation and Positioning of UAV Based on Electric Field Array Detection. Sensors 2021, 21, 1146. [Google Scholar] [CrossRef]
  7. Rahman, E.; Zhang, Y.; Ahmad, S.; Ahmad, H.; Jobaer, S. Autonomous Vision-Based Primary Distribution Systems Porcelain Insulators Inspection Using UAVs. Sensors 2021, 21, 974. [Google Scholar] [CrossRef]
  8. Ma, Y.; Li, Q.; Chu, L.; Zhou, Y.; Xu, C. Real-Time Detection and Spatial Localization of Insulators for UAV Inspection Based on Binocular Stereo Vision. Remote Sens. 2021, 13, 230. [Google Scholar] [CrossRef]
  9. Zhao, Z.; Liu, N.; Wang, L. Localization of Multiple Insulators by Orientation Angle Detection and Binary Shape Prior Knowledge. IEEE Trans. Dielectr. Electr. Insul. 2015, 22, 3421–3428. [Google Scholar] [CrossRef]
  10. Liao, S.; An, J. A Robust Insulator Detection Algorithm Based on Local Features and Spatial Orders for Aerial Images. IEEE Geosci. Remote Sens. Lett. 2014, 12, 963–967. [Google Scholar] [CrossRef]
  11. Wang, W.; Wang, Y.; Han, J.; Yue, L. Recognition and Drop-Off Detection of Insulator Based on Aerial Image. In Proceedings of the International Symposium on Computational Intelligence & Design, Hangzhou, China, 10–11 December 2016; IEEE: Piscataway, NJ, USA, 2017. [Google Scholar] [CrossRef]
  12. Cheng, H.; Zhai, Y.; Chen, R.; Wang, D.; Dong, Z.; Wang, Y. Self-Shattering Defect Detection of Glass Insulators Based on Spatial Features. Energies 2019, 12, 543. [Google Scholar] [CrossRef] [Green Version]
  13. Zhai, Y.; Chen, R.; Yang, Q.; Li, X.; Zhao, Z. Insulator Fault Detection Based On Spatial Morphological Features of Aerial Images. IEEE Access 2018, 6, 35316–35326. [Google Scholar] [CrossRef]
  14. Huang, X.; Shang, E.; Xue, J.; Ding, H. A Multi-Feature Fusion-Based Deep Learning for Insulator Image Identification and Fault Detection. In Proceedings of the 2020 IEEE 4th Information Technology, Networking, Electronic and Automation Control Conference (ITNEC), Chongqing, China, 12–14 June 2020; IEEE: Piscataway, NJ, USA, 2020. [Google Scholar] [CrossRef]
  15. Ge, C.; Wang, J.; Wang, J.; Qi, Q.; Liao, J. Towards Automatic Visual Inspection: A Weakly Supervised Learning Method for Industrial Applicable Object Detection. Comput. Ind. 2020, 121, 103232. [Google Scholar] [CrossRef]
  16. Shi, C.; Huang, Y. Cap-Count Guided Weakly Supervised Insulator Cap Missing Detection in Aerial Images. IEEE Sens. J. 2020, 21, 685–691. [Google Scholar] [CrossRef]
  17. Sadykova, D.; Pernebayeva, D.; Bagheri, M.; James, A. IN-YOLO: Real-time Detection of Outdoor High Voltage Insulators Using UAV Imaging. IEEE Trans. Power Del. 2019, 35, 1599–1601. [Google Scholar] [CrossRef]
  18. Wang, Y.; Li, Z.; Yang, X.; Luo, N.; Zhao, Y.; Zhou, G. Insulator Defect Recognition Based on Faster R-CNN. In Proceedings of the 2020 International Conference on Computer, Information and Telecommunication Systems (CITS), Hangzhou, China, 5–7 October 2020. [Google Scholar] [CrossRef]
  19. Girshick, R.; Donahue, J.; Darrell, T.; Malik, J. Rich Feature Hierarchies for Accurate Object Detection and Semantic Segmentation. In Proceedings of the IEEE Conference on Computer Vision and Pattern Recognition, Columbus, OH, USA, 23–28 July 2014; pp. 580–587. [Google Scholar]
  20. Girshick, R. Fast R-CNN. In Proceedings of the IEEE International Conference on Computer Vision, Santiago, Chile, 7–13 December 2015; pp. 1440–1448. [Google Scholar] [CrossRef]
  21. Ren, S.; He, K.; Girshick, R.; Sun, J. Faster R-CNN: Towards Real-Time Object Detection with Region Proposal Networks. IEEE Trans. Pattern Anal. Mach. Intell. 2017, 39, 1137–1149. [Google Scholar] [CrossRef] [Green Version]
  22. Wen, Q.; Luo, Z.; Chen, R.; Yang, Y.; Li, G. Deep Learning Approaches on Defect Detection in High Resolution Aerial Images of Insulators. Sensors 2021, 21, 1033. [Google Scholar] [CrossRef] [PubMed]
  23. Lin, T.; Liu, X. An Intelligent Recognition System for Insulator String Defects Based on Dimension Correction and Optimized Faster R-CNN. Electr. Eng. 2020, 103, 541–549. [Google Scholar] [CrossRef]
  24. Liu, W.; Anguelov, D.; Erhan, D.; Szegedy, C.; Reed, S.; Fu, C.Y.; Berg, A.C. Ssd: Single Shot Multibox Detector. In Proceedings of the European Conference on Computer Vision, Amsterdam, The Netherlands, 8–16 October 2016; Springer: Cham, Switzerland, 2016; pp. 21–37. [Google Scholar] [CrossRef] [Green Version]
  25. Redmon, J.; Farhadi, A. Yolov3: An Incremental Improvement. arXiv 2018, arXiv:1804.02767. [Google Scholar]
  26. Bochkovskiy, A.; Wang, C.; Liao, H. YOLOv4: Optimal Speed and Accuracy of Object Detection. arXiv 2020, arXiv:2004.10934. [Google Scholar]
  27. Yolov5 Code Repository. Available online: https://gitee.com/atari/ultralytics_yolov5 (accessed on 20 January 2021).
  28. Wang, H.; Hu, Z.; Guo, Y.; Yang, Z.; Zhou, F.; Xu, P. A Real-Time Safety Helmet Wearing Detection Approach Based on CSYOLOv3. Appl. Sci. 2020, 10, 6732. [Google Scholar] [CrossRef]
  29. Wang, Y.; Wang, J.; Gao, F.; Hu, P.; Xu, L.; Zhang, J.; Yu, Y.; Xue, J.; Li, J. Detection and Recognition for Fault Insulator Based on Deep Learning. In Proceedings of the 11th International Congress on Image and Signal Processing, BioMedical Engineering and Informatics (CISP-BMEI), Beijing, China, 13–15 October 2018. [Google Scholar] [CrossRef]
  30. Ling, Z.; Zhang, D.; Qiu, R.; Jin, Z.; Zhang, Y.; He, X.; Liu, H. An Accurate and Real-Time Self-Blast Glass Insulator Location Method Based on Faster R-CNN and U-Net with Aerial Images. CSEE J. Power Energy Syst. 2019, 5, 474–482. [Google Scholar] [CrossRef]
  31. Wang, H.; Yang, G.; Li, E.; Tian, Y.; Liang, Z. High-Voltage Power Transmission Tower Detection Based on Faster R-CNN and YOLO-V3. In Proceedings of the 2019 Chinese Control Conference (CCC), Guangzhou, China, 27–29 July 2019. [Google Scholar] [CrossRef]
  32. Zhang, P.; Zhong, Y.; Li, X. SlimYOLOv3: Narrower, Faster and Better for Real-Time UAV Applications. In Proceedings of the 2019 IEEE/CVF International Conference on Computer Vision Workshop (ICCVW), Seoul, Korea, 27–28 October 2020; IEEE: Piscataway, NJ, USA, 2020. [Google Scholar] [CrossRef] [Green Version]
  33. Wu, W.; Li, Q. Machine Vision Inspection of Electrical Connectors Based on Improved Yolo-v3. IEEE Access 2020, 8, 166184–166196. [Google Scholar] [CrossRef]
  34. Miao, X.; Liu, X.; Chen, J.; Zhuang, S.; Fan, J.; Jiang, H. Insulator Detection in Aerial Images for Transmission Line Inspection Using Single Shot Multibox Detector. IEEE Access 2019, 7, 9945–9956. [Google Scholar] [CrossRef]
  35. Wang, X.; Xu, T.; Zhang, J.; Chen, S. SO-YOLO Based WBC Detection with Fourier Ptychographic Microscopy. IEEE Access 2018, 6, 51566–51576. [Google Scholar] [CrossRef]
  36. Adou, M.; Xu, H.; Chen, G. Insulator Faults Detection Based on Deep Learning. In Proceedings of the International Conference on Anti-Counterfeiting, Security, and Identification, Xiamen, China, 25–27 October 2019. [Google Scholar] [CrossRef]
  37. Han, J.; Yang, Z.; Zhang, Q.; Chen, C.; Li, H.; Lai, S.; Hu, G.; Xu, C.; Xu, H.; Wang, D. A Method of Insulator Faults Detection in Aerial Images for High-Voltage Transmission Lines Inspection. Appl. Sci. 2019, 9, 2009. [Google Scholar] [CrossRef] [Green Version]
  38. Liu, C.; Wu, Y.; Liu, J.; Sun, Z. Improved YOLOv3 Network for Insulator Detection in Aerial Images with Diverse Background Interference. Electronics 2021, 10, 771. [Google Scholar] [CrossRef]
  39. Liu, C.; Wu, Y.; Liu, J.; Sun, Z.; Xu, H. Insulator Faults Detection in Aerial Images from High-Voltage Transmission Lines Based on Deep Learning Model. Appl. Sci. 2021, 11, 4647. [Google Scholar] [CrossRef]
  40. He, K.; Zhang, X.; Ren, S.; Sun, J. Identity Mappings in Deep Residual Networks. In Proceedings of the 14th European Conference on Computer Vision, Amsterdam, The Netherlands, 11–14 October 2016. [Google Scholar] [CrossRef] [Green Version]
  41. Wang, S.; Liu, Y.; Qing, Y.; Wang, C.; Yao, R. Detection of Insulator Defects with Improved ResNeSt and Region Proposal Network. IEEE Access 2020, 8, 184841–184850. [Google Scholar] [CrossRef]
  42. Huang, G.; Liu, Z.; Laurens, V.D.M.; Weinberger, K.Q. Densely Connected Convolutional Networks. arXiv 2016, arXiv:1608.06993. [Google Scholar]
  43. Zhu, Y.; Newsam, S. DenseNet for Dense Flow. In Proceedings of the 2017 24th IEEE International Conference on Image Processing, Beijing, China, 17–20 September 2017; pp. 790–794. [Google Scholar] [CrossRef]
  44. Yuan, X.; Xia, J.; Wu, J.; Shi, J.; Deng, L. Low Altitude Small UAV Detection Based on YOLO Model. In Proceedings of the 2020 39th Chinese Control Conference (CCC), Shenyang, China, 27–29 July 2020. [Google Scholar] [CrossRef]
  45. Huang, Z.; Wang, J. DC-SPP-YOLO: Dense Connection and Spatial Pyramid Pooling Based YOLO for Object Detection. arXiv 2019, arXiv:1903.08589. [Google Scholar] [CrossRef] [Green Version]
  46. Kim, K.J.; Kim, P.K.; Chung, Y.S.; Choi, D.H. Performance Enhancement of YOLOv3 by Adding Prediction Layers with Spatial Pyramid Pooling for Vehicle Detection. In Proceedings of the 2018 15th IEEE International Conference on Advanced Video and Signal Based Surveillance (AVSS), Auckland, New Zealand, 27–30 November 2018; IEEE: Piscataway, NJ, USA, 2018. [Google Scholar] [CrossRef]
  47. Kim, K.J.; Kim, P.K.; Chung, Y.S.; Choi, D.H. Multi-Scale Detector for Accurate Vehicle Detection in Traffic Surveillance Data. IEEE Access 2019, 7, 78311–78319. [Google Scholar] [CrossRef]
  48. Liu, S.; Qi, L.; Qin, H.; Shi, J.; Jia, J. Path Aggregation Network for Instance Segmentation. In Proceedings of the 2018 IEEE/CVF Conference on Computer Vision and Pattern Recognition (CVPR), Salt Lake City, UT, USA, 18–22 June 2018; IEEE: Piscataway, NJ, USA, 2018. [Google Scholar]
  49. Project of the Dark-Net Framework. Available online: https://github.com/AlexeyAB/darknet (accessed on 25 October 2020).
  50. Insulator Data Set—Chinese Power Line Insulator Dataset (CPLID). Available online: https://github.com/InsulatorData/InsulatorDataSet (accessed on 15 September 2020).
  51. Project of the LabelImg Tool. Available online: https://github.com/tzutalin/labelImg (accessed on 25 October 2020).
  52. Wu, T.; Wang, W.; Yu, L.; Xie, B.; Yin, W.; Wang, H. Insulator Defect Detection Method for Lightweight YOLOV3. Comput. Eng. 2019, 45, 275–280. [Google Scholar] [CrossRef]
Figure 1. Insulators and their faults in aerial images: (a) single-fault (in the red circle) in an insulator; (b) multiple-fault (in the yellow circles) in an insulator.
Energies 14 04365 g001
Figure 2. The structure of YOLOv3 network model.
Energies 14 04365 g002
Figure 3. The structure of improved YOLOv3 model.
Energies 14 04365 g003
Figure 4. The structure of DenseNet.
Energies 14 04365 g004
Figure 5. The structure of SPP-network.
Energies 14 04365 g005
Figure 6. The structure of improved multi-scale prediction network.
Energies 14 04365 g006
Figure 7. The samples of simulated insulator fault.
Energies 14 04365 g007
Figure 8. Clustering result on dataset “InSF-detection”. The x-axis shows the number of clusters (k), and the y-axis indicates the average IoU.
Energies 14 04365 g008
Figure 9. Histogram of accuracy indexes.
Energies 14 04365 g009
Figure 10. Experimental results with different scenes conducted on the improved YOLOv3 network model. From the first row to the fourth row show experimental scene with background of sky, river, towers, and vegetation, respectively.
Energies 14 04365 g010
Figure 11. Experimental results of insulator fault detection with the background of river.
Energies 14 04365 g011
Figure 12. Experimental results of insulator fault detection with the background of building.
Energies 14 04365 g012
Figure 13. Experimental results of insulator fault detection with the background of vegetation.
Energies 14 04365 g013
Table 1. Experimental conditions.
ParametersConfiguration
CPUIntel(R) Core(TM) i9-9900K, CPU/3.60 GHz
GPUNvidia GeForce GTX 3080/10 GB
Accelerated EnvironmentCUDA 11.1, cuDNN 8.0.5
Visual Studio FrameworkOpen CV 3.4.0, Visual Studio 2017
Operating SystemWindows 10
Training FrameworkDark-net
Table 2. The dataset of “InSF-detection”.
Images NumberTraining SetTesting SetImage SizeFaults Number
864576288416 × 4161172
Table 3. The definition of TP, FP, FN, and TN.
Ground TruthPredicted ResultDefinition
11TP
10FN
01FP
00TN
Table 4. The experimental effects of different network models.
NetworksAPPrecisionRecallMemory Usages
YOLOv392.8%94%91%240 MB
YOLOv3-dense94.1%95%91%248 MB
CSPD-YOLO97.7%99%97%265 MB
Our improved YOLOv396.5%98%95%225 MB
Publisher’s Note: MDPI stays neutral with regard to jurisdictional claims in published maps and institutional affiliations.

