1. Introduction
Gas turbine performance estimation and adaptive diagnostics are strongly dependent on the detailed information of component maps [
1]. Accurate component maps for performance simulation are quite significant to prevent unexpected downtime and catastrophic accidents [
2]. The component maps remain the proprietary information of the original equipment manufacturer, and gas turbine customers could not obtain the actual component maps [
3]; instead, they may be provided with generalized component maps within the same type. However, the variations of component maps from gas turbine to gas turbine within the same type can never be avoided, due to small discrepancies as to the result of manufacturing tolerance, assembly, and overhaul of gas turbines [
4]. Therefore, a performance model using the component maps of the same type may produce a performance that is slightly different from individual gas turbines of the same type [
5].
In order to overcome the above limitations, many studies have been developed. The key to these studies is to control the shape of the component maps, which determines the outputs of performance simulation models [
3]. These studies can be generally categorized into two areas: (1) tuning the existing component maps, (2) constructing new component maps.
The first area involves cycle design point matching, scaling, extension, and auxiliary coordinates. Cycle design point must be matched in the preliminary phase of component map tuning, because the cycle design point can specify the dimensional reference point of the component maps [
6,
7]. In 2020, Yan et al. [
8] proposed a novel cycle design point tuning method to minimize the simulated error caused by the undetermined parameters. The cycle design point matching is a vital aid to the performance simulation at design points, but cannot significantly reduce the simulated error caused by the deviation of component maps. The scaling method could overcome the limitation and obtain accurate component maps if the generalized component maps within the same type are available. The traditional scaling method is implemented by multiplying the scaling factors at design point to off-design point data of the original performance maps [
9]. With the development of adaptive simulation technology, the scaling method was further enhanced [
4,
10,
11,
12]. In 1990, Stamatis et al. [
13] introduced such a method of adapting a gas turbine model through an optimal set of scaling factors applied to the compressor map after an optimization process, which was further developed by Lambiris et al. [
14]; the method was implemented by an off-design point adaptation and the matching method was carried out by tuning maps with an optimization procedure. In 2000, (Kurzke et al.) a statistical analysis of many compressor maps was performed by Kurzke et al. [
15]. However, various kinds of component performance maps cannot be obtained for most users. Therefore, the performance adaptation based on field data has attracted significant attention. In 2003, Kong et al. [
9] introduced a new scaling method for component maps using a set of linear functions, which can reduce the analyzed error at off-design points. In 2020, Li et al. [
16] proposed a novel adaptation scheme, in which a similarity between the components’ predicted performance curves and the performance regression curve is used as the criterion with which to evaluate the adaptation accuracy.
The method of the first area has reduced the simulated error to a certain degree, but the simulated error still exists. Furthermore, the scaling method cannot predict well the shape of the speed lines, as there is a limitation in the adaptation of the component maps.
The approaches of the second area, including generation method and component analytical solution, could overcome the above limitations [
17,
18,
19]. In 2012, Tsoutsanis et al. [
3] proposed a compressor map generation method with elliptic equations, and successfully applied in ref. [
20] to match off-design operating data of an industrial gas turbine. The generation method using elliptic equations were further developed by Tsoutsanis et al. to improve the accuracy and fidelity of diagnostics [
21,
22,
23]. Recently, Yang et al. [
24] simplified the generation method proposed by Tsoutsanis, and more accurate results were obtained with fewer correction coefficients. However, the understanding of the quantitative relationship between the part-load performance and the shape-determining parameters of the gas turbine component maps is far from enough because of its complexity [
25], and the generated component map is not completely in conformity with the fitting expressions, owing to the complex character of the component [
24]. Component analytical solution, based on more complicated expressions and concerning the physical process of the gas turbine, may overcome the above limitations. Drummond et al. [
26] explored the shape quantitative features of component maps and related the quantitative features with thermophysical phenomena. Jones et al. [
27] and Sethi et al. [
28] proposed a backbone compressor map fitting method using the quasi-physics-based scheme. In 2002, Zhang et al. derived the explicit analytical solutions of part-load performances of a constant rotating speed single-shaft gas turbine and its cogeneration [
25]. The component analytical solution could match the shape of component maps in the whole region, which is appropriate for rig tests of the gas turbines in the same type. However, for individual gas turbines in the field, this method can not decrease the deviation caused by manufacturing, assembly tolerance, and overhaul of gas turbines.
The method of the second area could overcome the limitation that the original component maps are proprietary, but can not completely conform to the fitting expressions due to the complex nonlinear characteristic of the component.
Overall, the approaches in the first area are suitable for situations where the default characteristic curve is available, and the simulated errors at off-design points far away from the design point are reduced significantly. The approaches in the second area can optimize the component maps by newly constructed mathematic models, and the simulated errors at off-design points of the middle-speed region were reduced considerably. Besides, the adaptive techniques, especially multipoint adaptation, simultaneously enhanced the availability of the two areas’ methods. However, the simulation accuracy of the first method in the low-speed region needs to be further improved; the simulation accuracy of the second method in the low and high-speed region needs to be further improved. Although the component analytical solution could match the shape of component maps in the whole speed region, the deviation caused by manufacturing, assembly tolerance, overhaul of gas turbines, and the physical process of components has not been well considered. Besides, the nonlinear relationships between different key variables are still inexplicit up to now, which show that the computational accuracy and applicability of these approaches are still worth further investigation [
16,
23]. Furthermore, renewable energy sources, such as natural gas and hydrogen energy, are widely used as fuels in the operation of gas turbines to produce energy in an environmentally friendly manner, which has transformed the gas turbines role in terms of their operation, and further triggered a series of challenges for the accuracy of adaptive simulation and diagnostics. We have discovered that the constructed tuning factors could produce special adaptive characteristics for performance adaptation of gas turbines. First, the component analytical solution could match the shape of component maps in the whole region. Second, the constructed tuning factors could lock the shape of the design point during the adaptive process.
Therefore, an enhanced component analytical solution (ECAS) is proposed to improve the current adaptation and diagnostics scheme. ECAS based on component analytical solution and the extracted tuning factors has more complicated expressions concerning the physical process of the gas turbine, which could match the shape of component maps in the whole speed region. In this paper, first a set of tuning factors is defined to construct the enhanced component analytical solution and identify the nonlinear behaviors more accurately. Second, a sensitivity analysis for tuning factors is performed to understand the effect of each factor. Then, the particle swarm optimization is used to capture the optimal tuning factors, and then determine the ECAS. Finally, the gas path diagnostics based on the ECAS method are implemented. The main contributions of our work can be summarized as follows.
- (1)
The proposed ECAS method could remain the appropriate nonlinear matching characteristics of the component analytical solution in all speed regions, and simultaneously further reduce the deviation caused by manufacturing, assembly tolerance, and overhaul of gas turbines.
- (2)
Compared with the map scaling method, the proposed method has higher simulation accuracy at off-design points far away from design points.
- (3)
Compared with the map generation method, the method in this paper has better adaptive accuracy at operation points near two edge regions.
- (4)
The proposed two methods also have good performance in the field data analysis and realize fault diagnostics.
2. Component Analytical Solution
The component analytical solution is constructed to express the component characteristic in the same type, which could accurately capture the mathematical analytical relationship of the corrected parameters, including corrected rotational speed, pressure ratio, corrected flow capacity, and isentropic efficiency. The analytical relationship is performed by relating the corrected parameters. The component analytical solution includes flow capacity analytical solution and isentropic efficiency analytical solution, which is all in the shape of the three-dimensional curved surface. The shape of flow capacity maps is obviously different between compressor and turbine, while the efficiency maps are basically similar.
The component analytical solution selected in this paper used the normalized corrected parameters (for example, the normalized corrected flow capacity), and the split-shaft gas turbine is selected to describe the detailed information of the component analytical solution follows in the next subsections.
After an extensive evaluation of the existing compressor analytical solution in ref. [
25,
27,
28] for expressing the mathematical analytical relationship between normalized rotational speed (
), normalized pressure ratio (
), normalized corrected flow capacity (
), and normalized isentropic efficiency (
), the most mathematically robust approach was the component analytical solution in ref. [
25]. The analytical formulas are given by
where
:
where
,
, and
.
The turbine analytical formulas present a more uniform pattern in comparison to the compressor maps, since the turbine operates most of its time in choked conditions. Therefore, constructing the axial turbine analytical solution is not as mathematically challenging as it is for the compressors. An improved Flügel formula is used to approximately describe the mass flow characteristics of the turbine [
25]. In this paper, the turbine analytical formulas about normalized rotational speed (
), normalized pressure ratio (
), normalized corrected flow capacity (
), and normalized isentropic efficiency (
) are given by
3. The Proposed Method
3.1. Enhanced Component Analytical Solution
According to the research of Tsoutsanis et al. [
23], the key to component map adaptation is to control the shape of the component maps. The component analytical solutions are close to the actual characteristics of gas turbine components. To utilize the nonlinear matching characteristics of the component analytical solution in all speed regions, the component analytical solutions are chosen as the initial component maps. The deviation is reduced by modifying the initial component analytical solution of the gas turbine, where the tuning factors are defined, including the tuning factors of compressor, turbine, and power turbine. Since the analytical solutions of turbine and power turbine are similar, only the turbine tuning factors are shown here.
According to the research of Zhang [
25] and Drummer [
26], the physical interpretation of tuning factors refers to the effect of the update factor on the thermodynamic physical characteristics of gas turbine components, which is equivalent to the effect of the update factor on the shape of the component characteristic diagram, where the tuning factors (
,
,
) are related to the physical characteristics of compressor flow capacity, the tuning factor (
) is related to the physical characteristics of compressor isentropic efficiency, the tuning factor (
) is the physical characteristics of turbine flow capacity, and the tuning factor (
) is the physical characteristics of turbine isentropic efficiency.
We found that the tuning factors could control the shape of component maps. The coefficients of the mass flow characteristics of the compressor are designed as the tuning factors to effectively adapt the analytical solution. The tuning factors are given by
where
,
,
, and
.
A constant variance of the efficiency characteristics of the compressor is defined as the tuning factors (
) to effectively adapt the analytical solution. The tuning factors are given by
where
, and
.
Similarly, the tuning factors of the turbine (
) are defined to effectively adapt the analytical solution. The tuning factors are given by
where
, and
.
where
, and
.
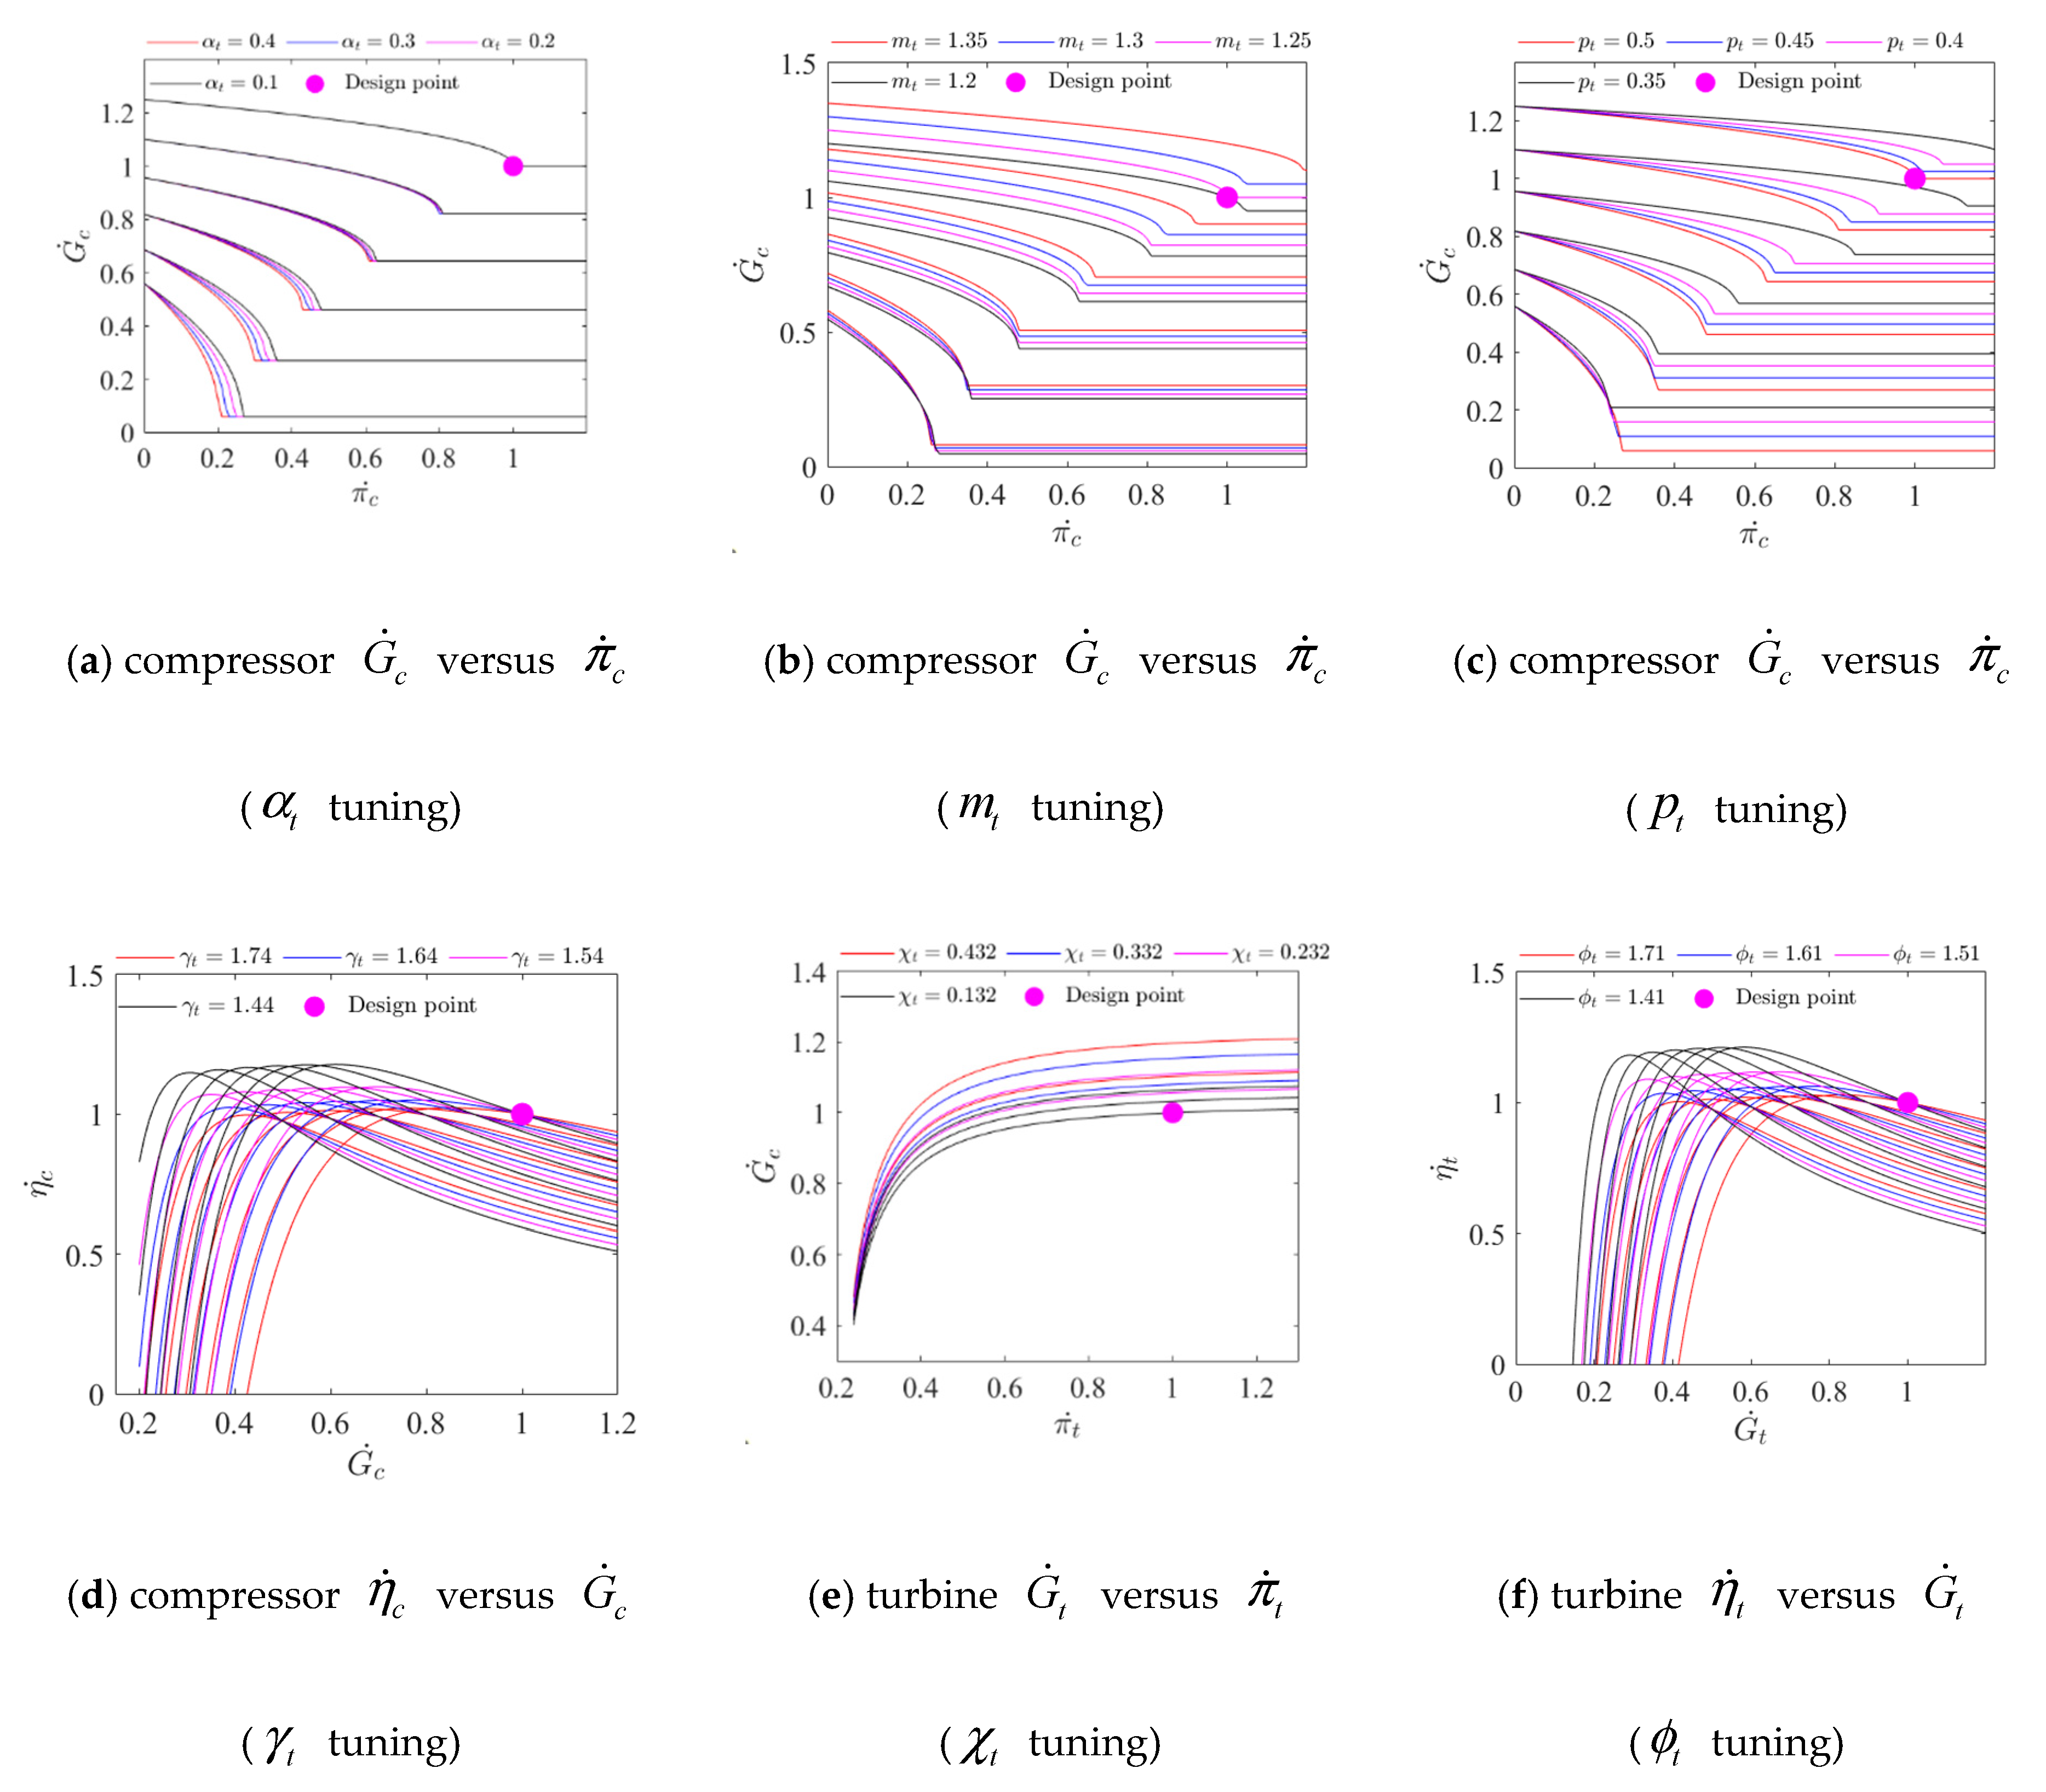
The effects of the above tuning factors on the shape of the component maps are shown in
Figure 1.
Figure 1a–c represent the effects of tuning factors (
,
,
) on the compressor map of corrected flow capacity.
Figure 1c represents the effect of tuning factor (
) on the compressor map of isentropic efficiency.
Figure 1d represents the effect of tuning factor (
) on the turbine map of corrected flow capacity.
Figure 1e represents the effect of tuning factor (
) on the turbine map of isentropic efficiency. It can be seen from
Figure 1 that the tuning factors have good matching characteristics; the characteristics refers to the good adaptation characteristics between enhanced component analytical solution and field measured data. The good adaptation characteristics include two aspects.
Figure 1a,d,f show the first characteristic, that the design point can be locked during the adaptive process, and
Figure 1b,c,e show the second characteristic, that the enhanced component analytical solution could match the shape of component maps in the whole region.
3.2. Sensitivity Analysis
Proper selection of the tuning factors is crucial to the adaptation of the enhanced component analytical solution. Some key points must be considered in the selection of the tuning factors, as follows:
A highly related functional relationship between the tuning factors and the target performance parameters should remain. Otherwise, the searching space may not be sufficient in the adaptation, and the tuning factors could not contribute much to more reasonable optimization results.
The number of the tuning factors has no limitation, but the optimization results may be diverse if the combination of the tuning factors is different. Besides, as the number of tuning factors increases, the searching space is expanded, and the optimization results may be improved.
The boundary of searching space depends on the upper and lower thresholds of the tuning factors.
Therefore, a reasonable threshold is crucial for the optimization, and several tests may be necessary before determining the suitable optimization scheme and ensuring that the optimal solutions are in the searching space.
The sensitivity analysis is used find the most sensitive tuning factors using the deviation of the target performance parameters caused by the set deviation of tuning factors. For ensuring the tuning factors to be selected reasonably, most target performance parameters must be obviously sensitive to the selected tuning factors, which means the amplitude response deviation of the target performance parameters should be similar enough to or even larger than the set amplitude change of the selected tuning factors. The demonstration of the sensitivity analysis is shown later in the paper.
3.3. Particle Swarm Optimization
Particle Swarm Optimization (PSO), a heuristic computational algorithm that is inspired by the behavior of birds, was proposed by Eberhardt et al. in 1995. The specific description of PSO refers to ref. [
29]. PSO consists of a set of particles named a population, and each particle in the population equals a potential solution. The elements of each particle refer to the selected tuning factors. Particles run in the searching space with a specific speed for finding for the optimal tuning factors. The particles could remember and track the previous best factor. The personal best position and global best position were named
and
separately; the speed of each particle is tuned on the basis of its historical information and the information of its neighbors, during running through the searching space. Each step movement of particles is significantly affected by its historical information of previous useful factors, including its current position, and the group information of the swarm. Therefore, the particles tend to run towards improved search space during the searching process.
During the searching process of the tuning factors, the personal best position
and global best position
are observed and updated, as follows:
where
is the acceleration constant of
;
is the acceleration constant of
;
;
and
are random numbers in the range of 0–1;
refers to inertia weight, and its range is 0.1–0.9.
refers the speed of the
particle in the
generation;
represents the present position of each particle;
refers to the previous personal best position of each particle, and
refers to the global best position of all of the particles.
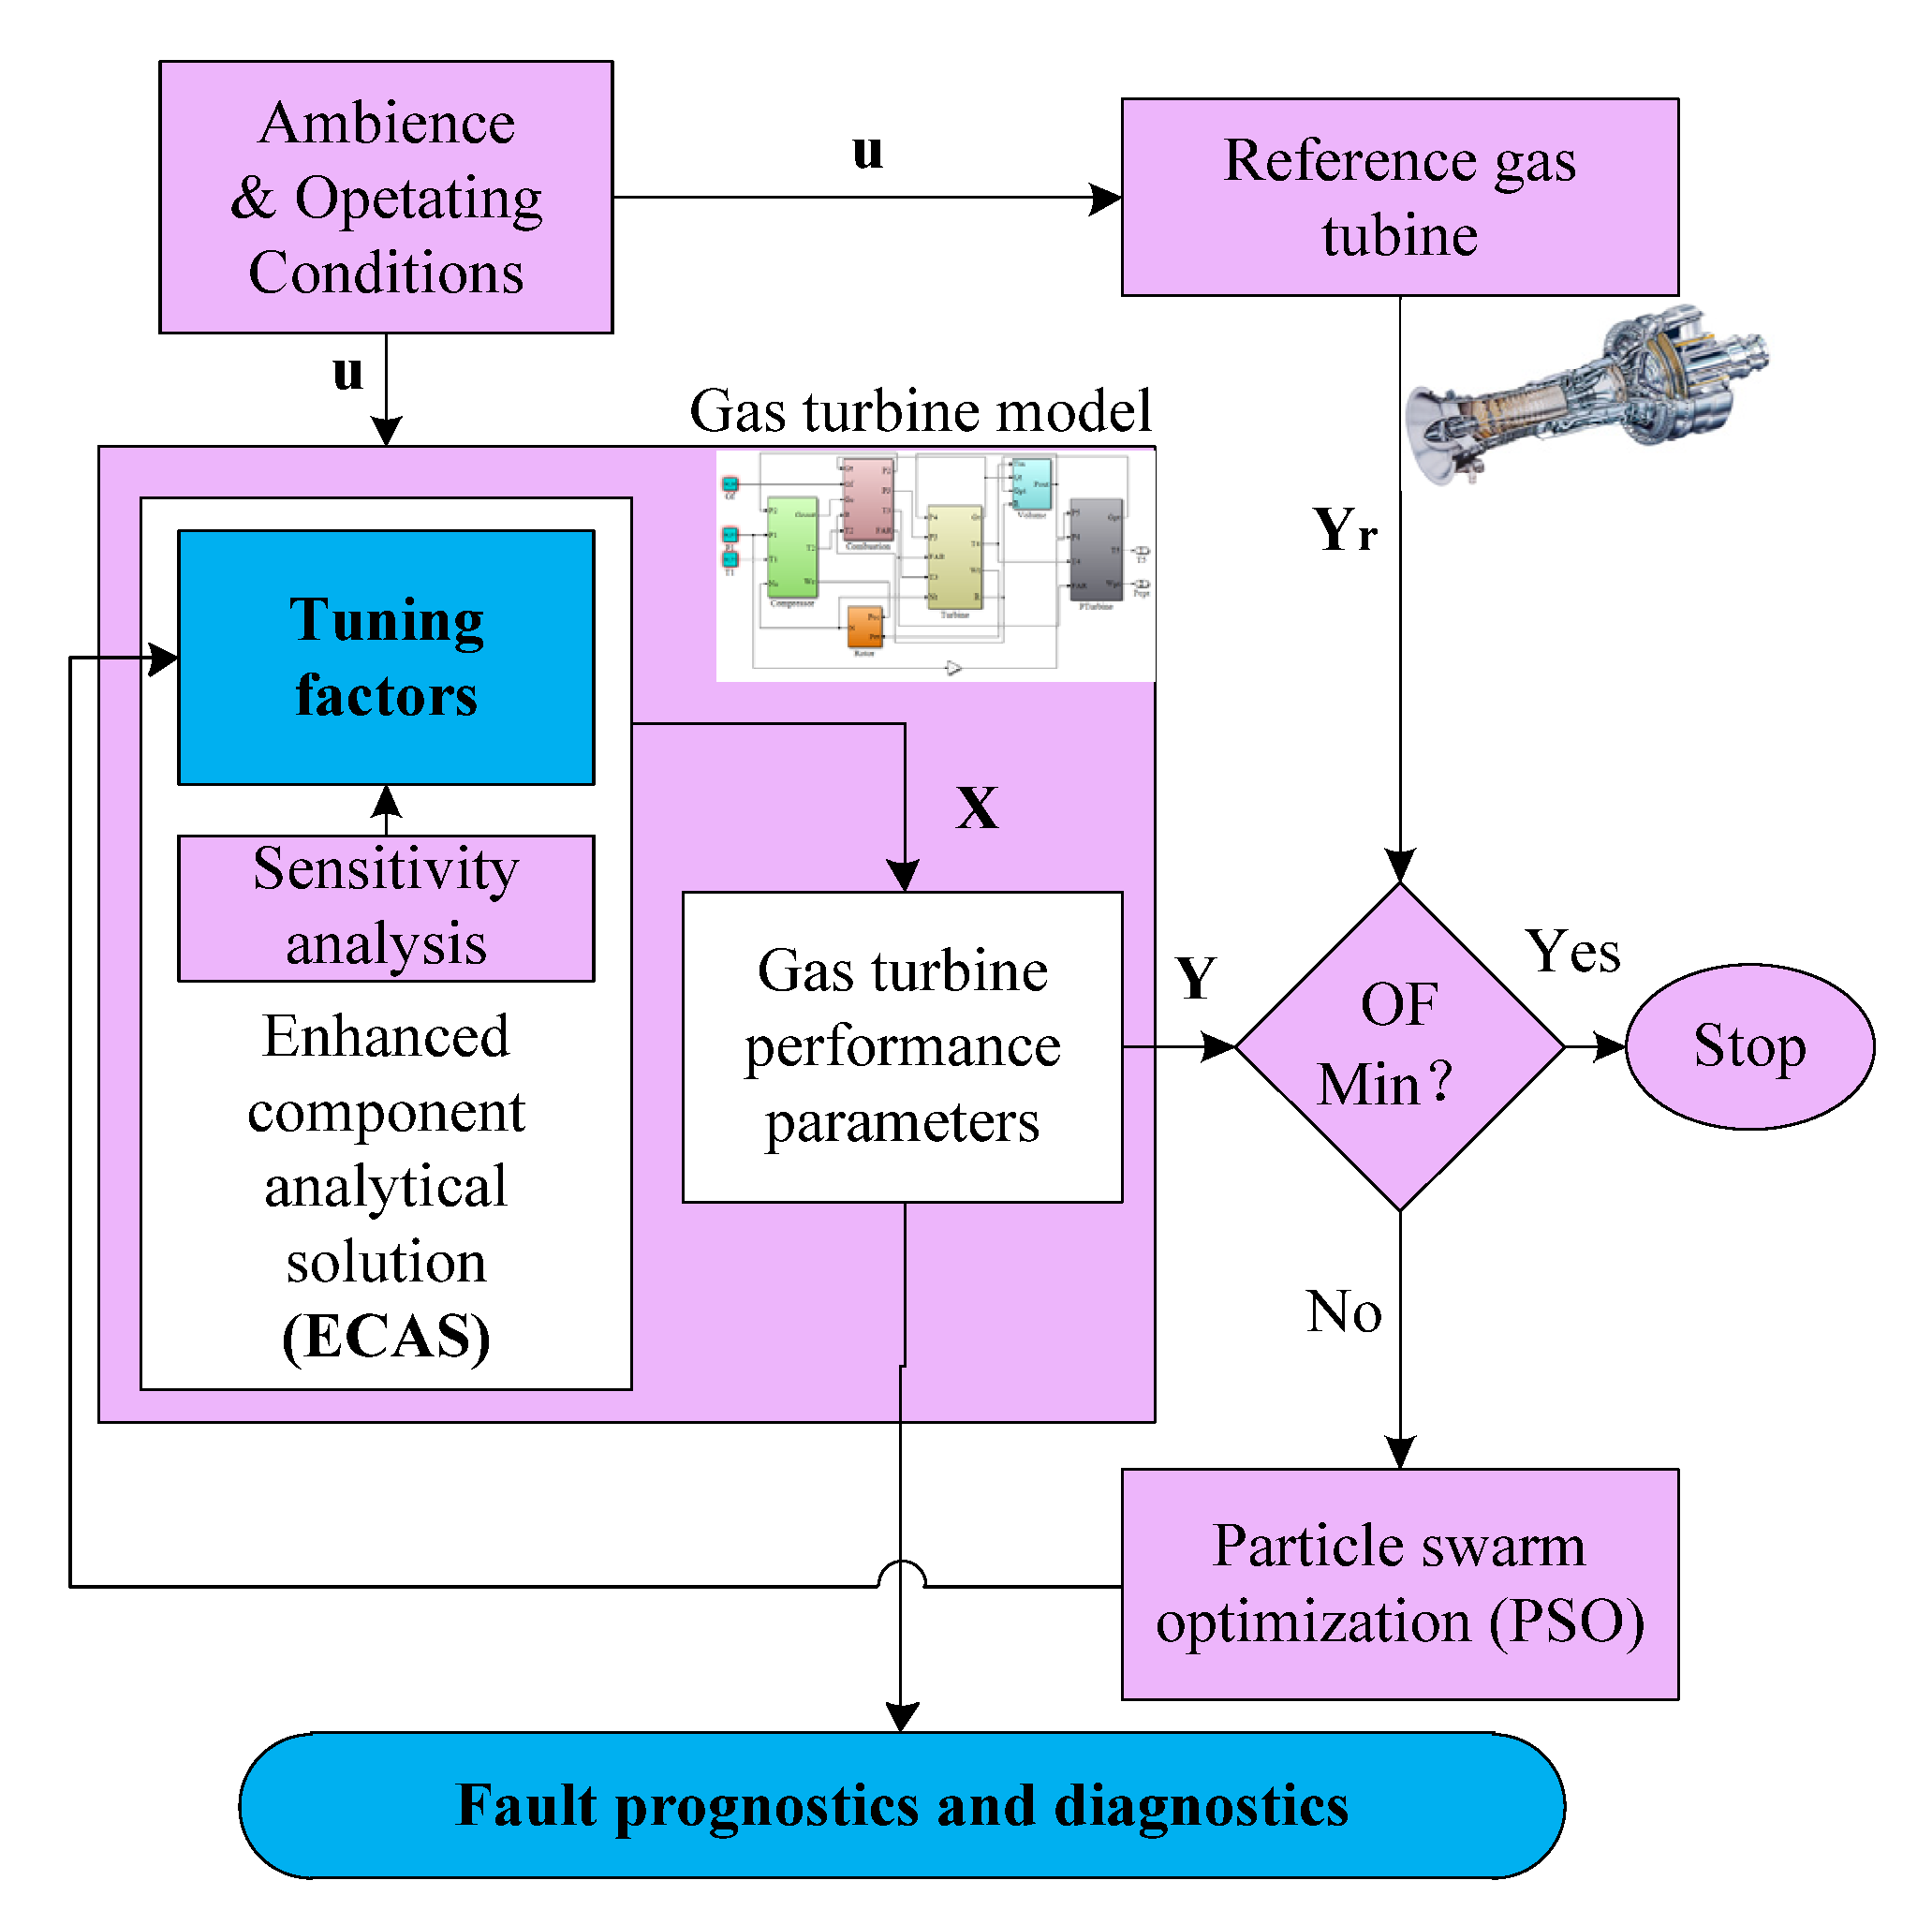
3.4. Adaptation and Diagnostic Procedure
In this paper, an enhanced component analytical solution with particle swarm optimization is proposed for the performance adaptation and diagnostics of the gas turbines. The whole framework of the proposed method can be seen in
Figure 2.
Performance adaptation process is implemented through backward iteration analysis, where a component analytical solution is tuned to ensure the target performance parameters and simulated parameter are consistent at the same ambient condition and handle setting. Generally, the target performance parameter, assuming no interfering noise, is given by:
where
refers to the dependent parameters vector including the measurement parameters, such as the total pressure and the total temperature at different gas path point locations, which is named
. The independent parameters vector
consists of health parameters such as the corrected flow capacity and isentropic efficiency, and the parameter
refers to the ambient parameters and the control parameter, including ambient pressure, temperature, and handle parameters. Based on the chosen performance simulation method, the handle parameter could be the power of power turbine
, turbine outlet temperature
, corrected rotor speed
, or any other parameters.
The measured gas turbine behavior is represented either by the field data of the in-service gas turbine or through the initial gas turbine model. For testing our proposed method, the reference gas turbine is a gas turbine model that uses the initial component analytical solution. In contrast to the proposed enhanced component, analytical solution is employed by the gas turbine model.
The performance adaptation and diagnostics method is depicted in
Figure 2. The independent parameter vector
is tuned to minimize the deviation of the dependent parameter between the actual gas turbine
and the reference gas turbine
. For this study, the difference between the predicted
and the observed
can be evaluated by an objective function (
OF) that is defined as follows:
Subjected to Equations (6), (8), (9), (11), (13) and (15).
Where n refers to the total number of target performance parameters. refers to the relative error of the target performance parameter. The difference refers to the deviation between the simulated parameters and the field measured data , divided by the field measured data . Since the performance adaptation process concerns multiple target performance parameters, the OF was modified to suit this feature.
The
OF is optimized by a particle swarm optimization [
30], which could search the neighborhood of the initial value and converge to an extreme value of the
OF. Unfortunately, multiple mathematical solutions might exist, because the PSO algorithm used here could not always find the global optimal value of
OF. The above limitation could be overcome by initially cycle reference point matching to ensure that the search starting point is near the convergence point, and then move to a certain distance away from the convergence point. We can further address the above limitation by setting the optimization configuration without any restriction on the tuning factors, to enhance the searching space. The last measure for satisfying optimization results is that the convergence of PSO should be implemented before reaching the maximum generation number. With all of the above measures, the global optimal value of tuning factors could be ensured.
It should be emphasized that the proposed method assumes the existence of an initial component analytical solution. There is no similarity or closeness requirement between the initial component analytical solution selected for the gas turbine model and the unknown component analytical solution of the reference gas turbine. This is supported by the fact that the method is capable of reconstructing any shape of the component maps, since the map curves are analytically controlled. The number of the tuning factors utilized has to do only with the fidelity of the sensitivity analysis, and is not related to the number of gas path measurements that are to be matched. The adaptation procedure is now described as follows:
- 1.
Select an initial component analytical solution from the open literature or any other available source.
- 2.
Tune the cycle reference point so that the independent parameters of the gas performance model () match the reference gas turbine () at the design point.
- 3.
Analyze the initial component analytical solution and select appropriate tuning factors for each component map. The coefficients of the component analytical solution are usually chosen as the tuning factors.
- 4.
The sensitivity of the analytical solution coefficients is analyzed to choose the best set of tuning factors.
- 5.
Integrate the enhanced component analytical solution into the gas turbine model.
- 6.
Adapt the tuning factors of the adapted component analytical solution to match all of the measurements of a reference gas turbine. Note that before the adaptation is employed, the simulated results of the gas turbine model might have significant deviations from the measurement values of the reference gas turbine, and in some cases, convergence of the gas turbine model might not be possible before invoking the particle swarm optimization.
- 7.
Based on the above gas turbine model, the diagnostics of the gas turbine could be implemented by calculating the independent parameters of each component.
The final adapted component analytical solution is an enhanced component analytical solution that is capable of generating the same results as the gas path measurements available. The generated component maps are only an approximation to the unknown map, since there are many uncertainties such as measurement noise and humidity that are not accounted for.
4. Case Study Description
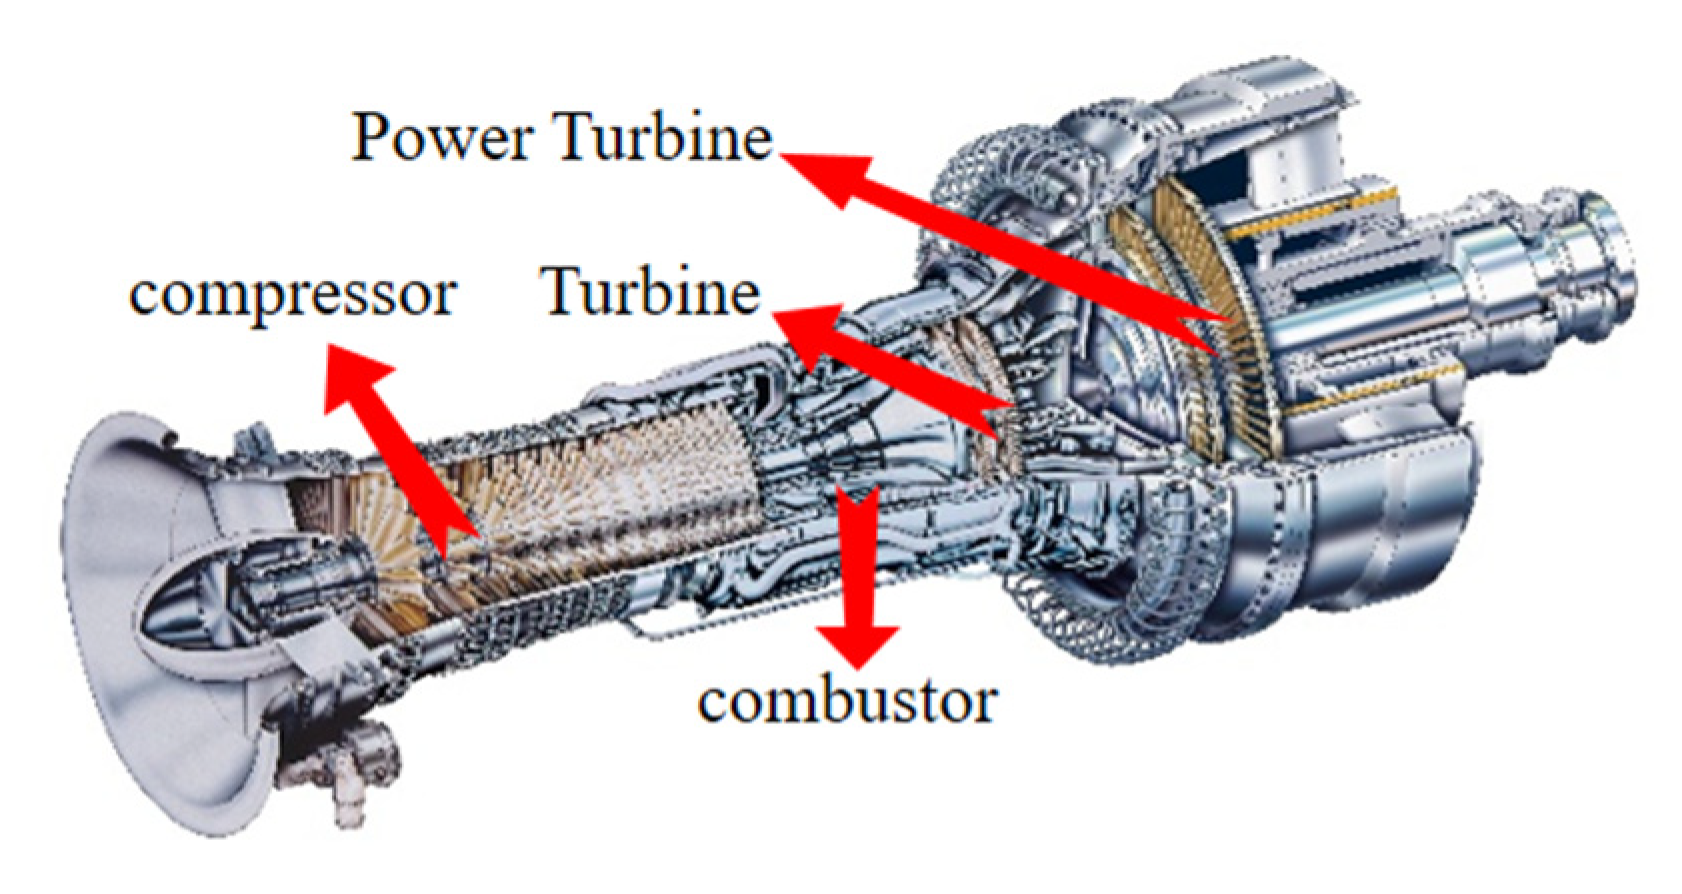
The proposed enhanced component analytical solution is now integrated into the performance model of a split-shaft industrial gas turbine. The performance model consists of compressor, combustor, turbine, and power turbine as shown in
Figure 3, and the component maps are represented by the set of a suitable component analytical solution.
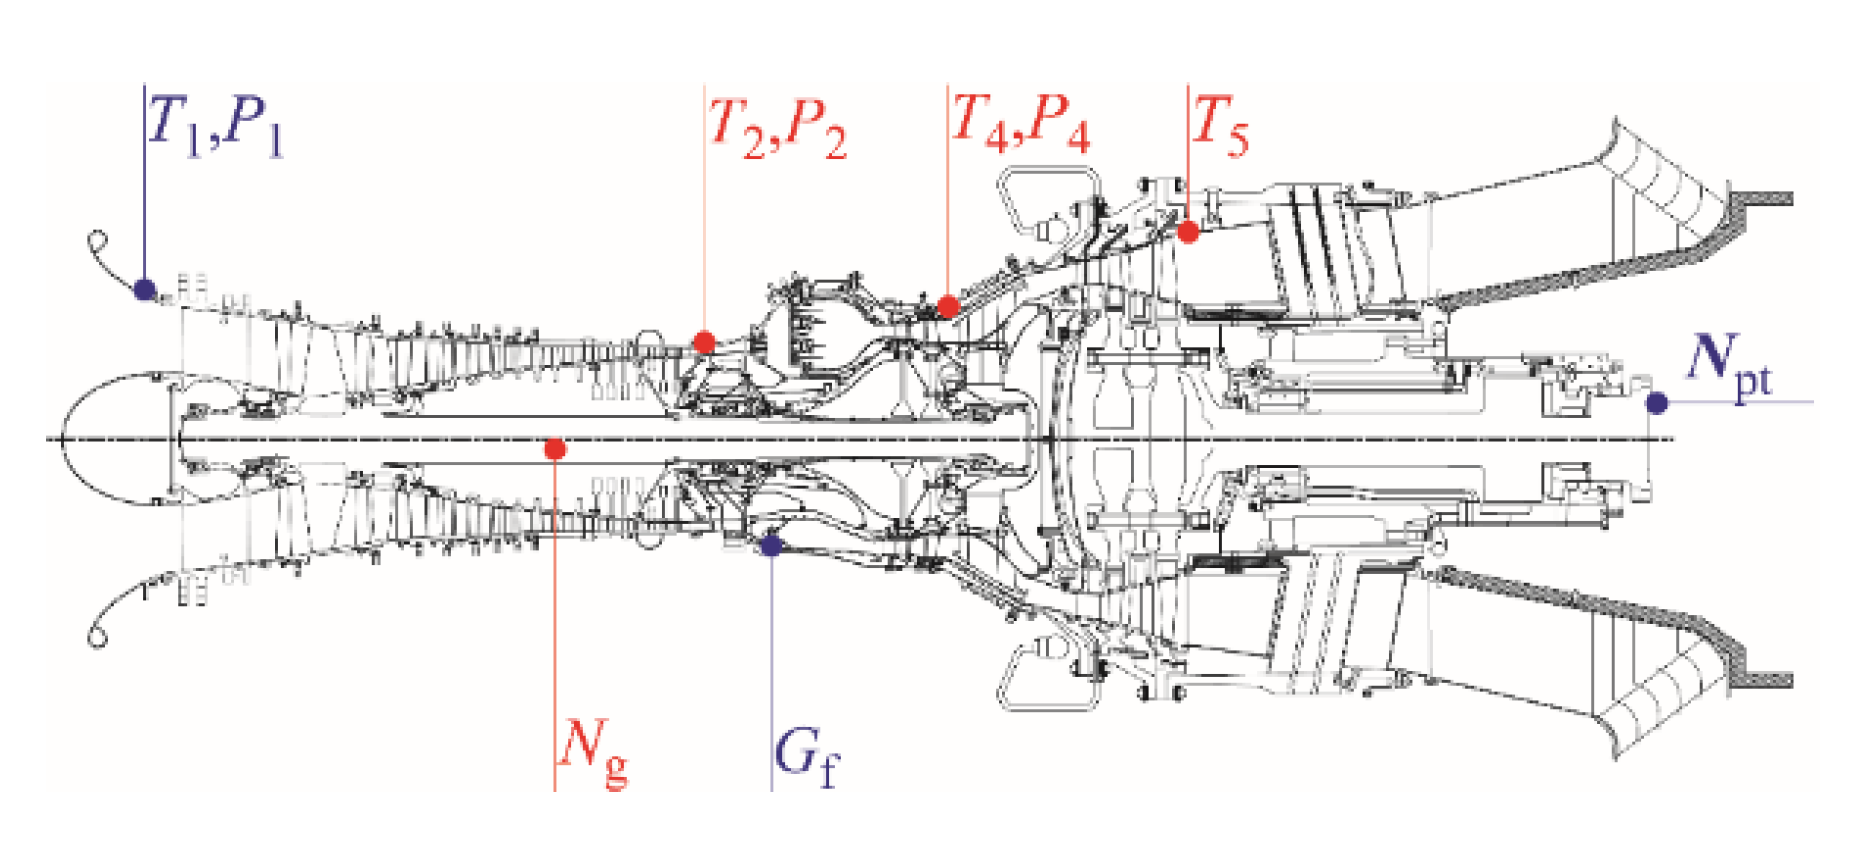
In this paper, the proposed method is validated with the field data, and the field measuring locations of the gas turbine are shown in
Figure 4, where
are selected as the dependent parameters and
are selected as handle parameters.
The configuration parameters of PSO are chosen, where generation is set to 80 and population size is set to 60.
According to the research of Tsoutsanis et al. [
24], mathematically multiple solutions might exist, since the algorithm used here might not always find the global minimum of
OF. This limitation is overcome by initially matching the operating points that are close to the design point of the gas turbine, and then moving further away from the design point. In this manuscript, the selection of the optimization bounds is based on the above principle. Firstly, the initial values of the tuning factors are selected as the center of the optimization boundary, and then move away from the center to a certain distance.
The optimization bounds of tuning factors and initial values of tuning factors are set, where the bounds of
are assumed from
to
, i.e., [0.1, 0.4], the bounds of
are assumed from
to
, i.e., [1.24, 1.26], the bounds of
are assumed from
to
, i.e., [0.4, 0.6], the bounds of
are assumed from
to
, i.e., [1.44, 1.64], the bounds of
are assumed from
to
, i.e., [0.132, 0.332], the bounds of
are assumed from
to
, i.e., [1.51, 1.71], and the initial values are selected from ref. [
25], as shown in
Table 1.
5. Results and Discussion
The proposed approach is tested based on the field measurement data. The simulated results using the ECAS are compared with the map scaling method, and map generation method. The results and discussion mainly include four parts: (1) tuning factors extraction and sensitivity analysis; (2) optimization result and discussion; (3) adaptation case study; (4) fault diagnostic case study.
5.1. Tuning Factors and Sensitivity Analysis
In this paper, there are two types of adaptation parameters being used; the target performance parameters are shown in
Table 2 and the potential tuning factors are shown in
Table 3. The nominal values of the tuning factors may be available in a gas turbine manual or the public literature, but their actual values may be slightly different, even for gas turbines in the same type, due to manufacturing and assembly tolerance and gas turbine health conditions.
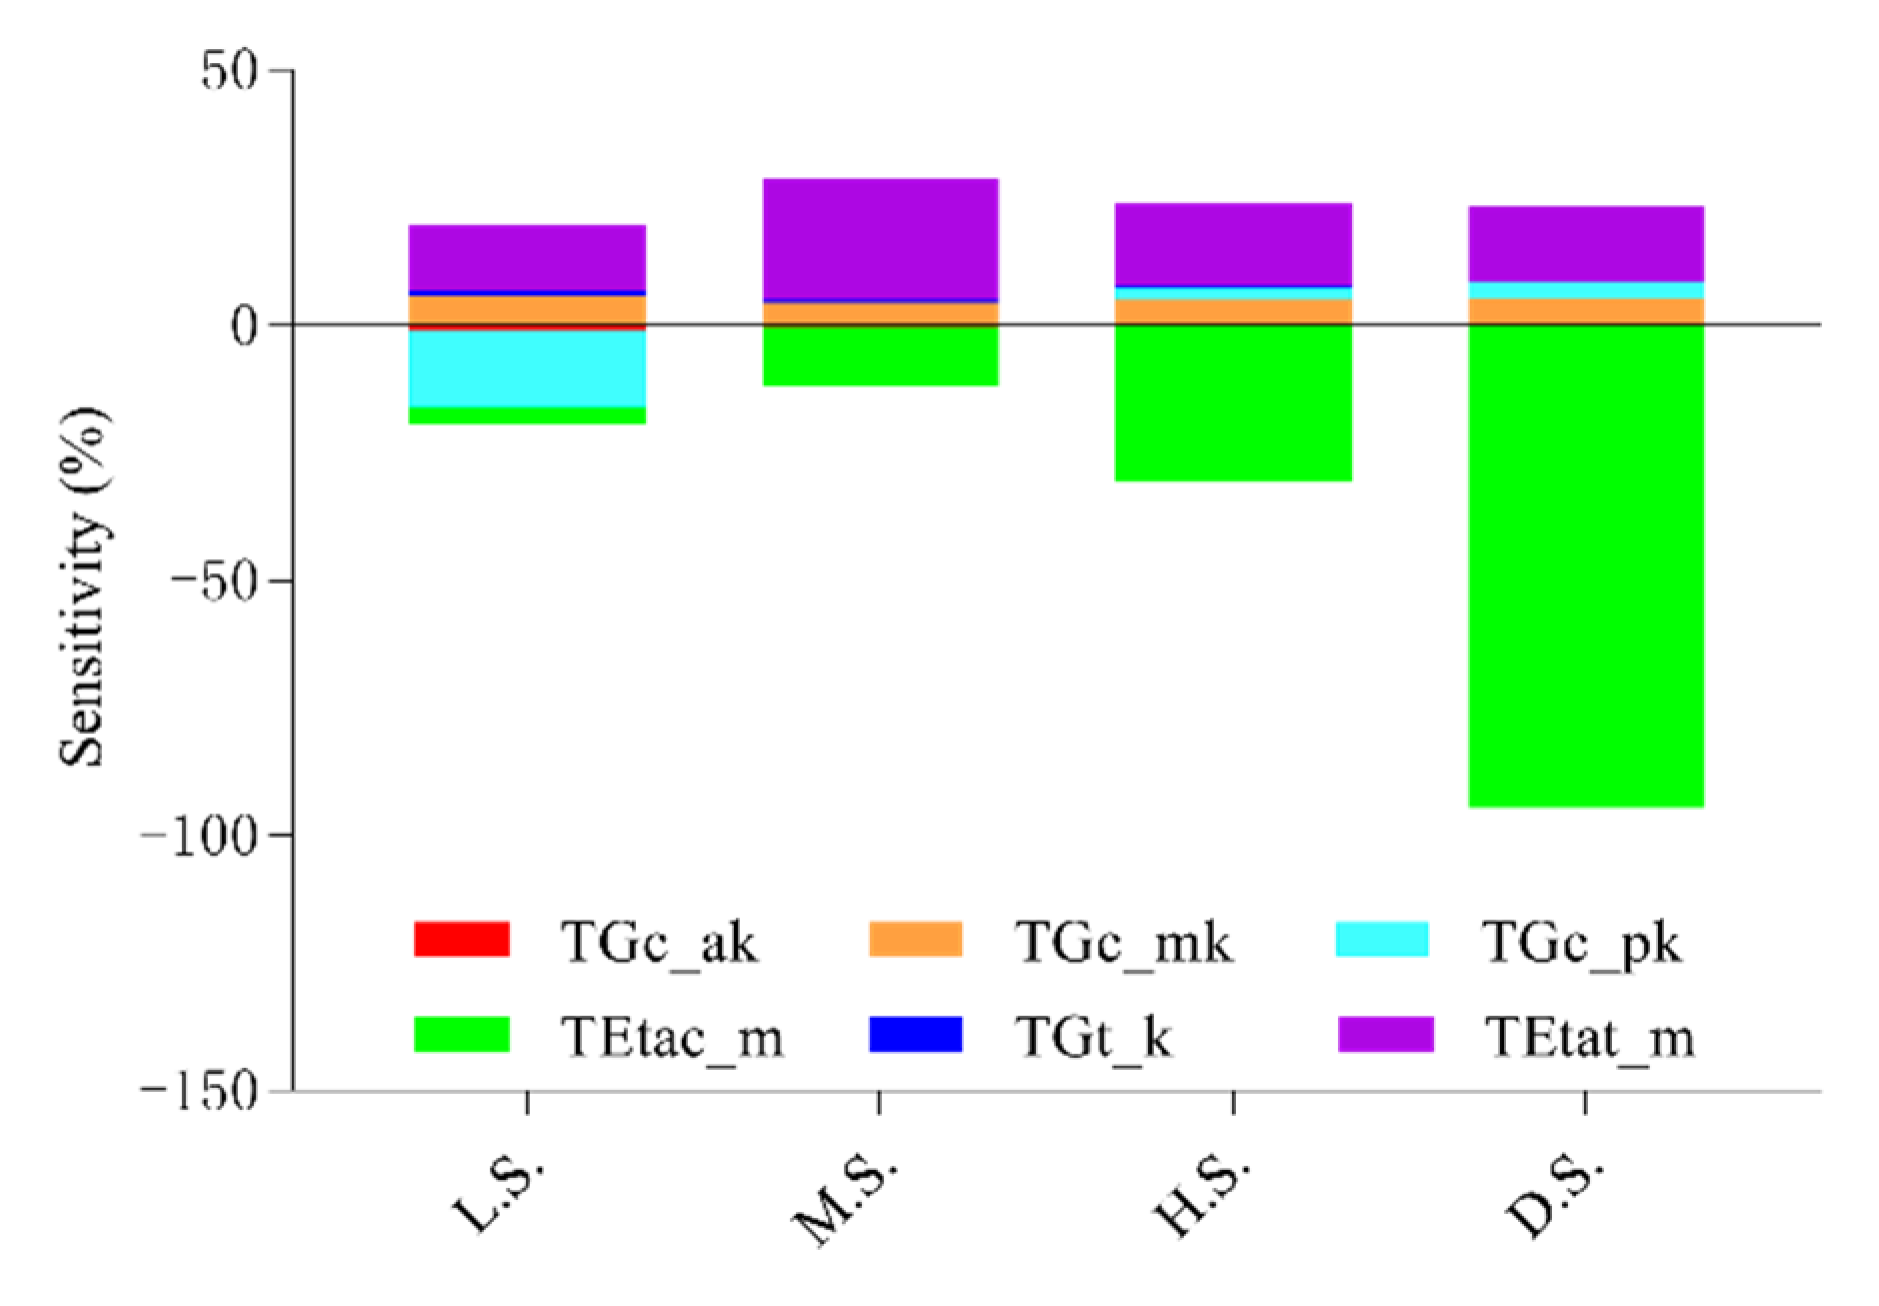
The shape of the component maps are determined by the six tuning factors, and the selection of the appropriate tuning factors is a challenging goal because the tuning factors have a certain physical meaning. To explore the effect of each tuning factor, a sensitivity analysis concerning six tuning factors of the component analytical solution was carried out. The sensitivity analysis considers the overall impact that a 5% drop for each tuning factor had on the corrected flow capacity (
), and isentropic efficiency (
) of the component maps. To examine the trend of the shape changes of the component maps, four speed lines have been chosen. The first speed line is at the lowest speed, which is labeled “L.S.”, the second line is located at the middle of the component maps, noted “M.S.”, the third line at the high speed near the design point is defined as “H.S.”, and the last line at the design point is defined as “D.S.”. Thus, by selecting this representative sample of the component maps, the effect of each tuning factors modification on these speed lines (L.S., M.S., H.S., and D.S.) is shown in
Table 4.
The sensitivity analysis refers to the quantitative influence of updating the factor of the component characteristic diagram on target performance parameters of gas turbines. A stacked bar chart for the effect that each tuning factor has on the average values of the mass flow rate and efficiency of the component maps at specified zones can be seen in
Figure 5. One bar characterizes the effect of tuning factors on the average values of a condition range; the effects of tuning factors on different the mass flow rate and efficiency of component are distinguished by color. It can be seen that the average deviation values of performance parameters respond differently to different tuning factors, and the levels of the response can be significantly different. For example, TEtac_m responds strongly to the average deviation values of performance parameters at D.S., and all tuning factors respond weakly to the average deviation values of performance parameters at L.S. The key point is TGc_ak and TGt_k zero response to the average deviation values of performance parameters. The better selection of the tuning factors should be those that respond more sensitively to the average deviation values of performance parameters.
where
refers to the sensitivity of the tuning factor.
refers to the average value of component characteristic parameters after a 5% drop, which are calculated by
,
refers to the average value of component characteristic parameters before the 5% drop, which are calculated by
.
to refers the condition number of each condition range (L.S., M.S., H.S., and D.S.).
In conclusion, the proposed ECAS method can adapt to the component maps while locking the design point, which can lock the simulation accuracy of design points while tuning non-design points. The weight coefficient of tuning factors is set according to the results of the above sensitivity analysis.
To obtain a complete gas turbine model and enable the performance adaptation process, the initial value of the tuning factors should be given before the optimization. The initial tuning factors selected near the actual value could obtain better convergence results and simplify the selection of bounds, including the upper bounds and lower bounds. Therefore, to obtain a more accurate gas turbine model with the proposed adaptation method, we should manually choose the initial value of tuning factors and ensure the simulated performance parameters are as similar as possible to the field measured data.
5.2. Optimization Result and Discussion
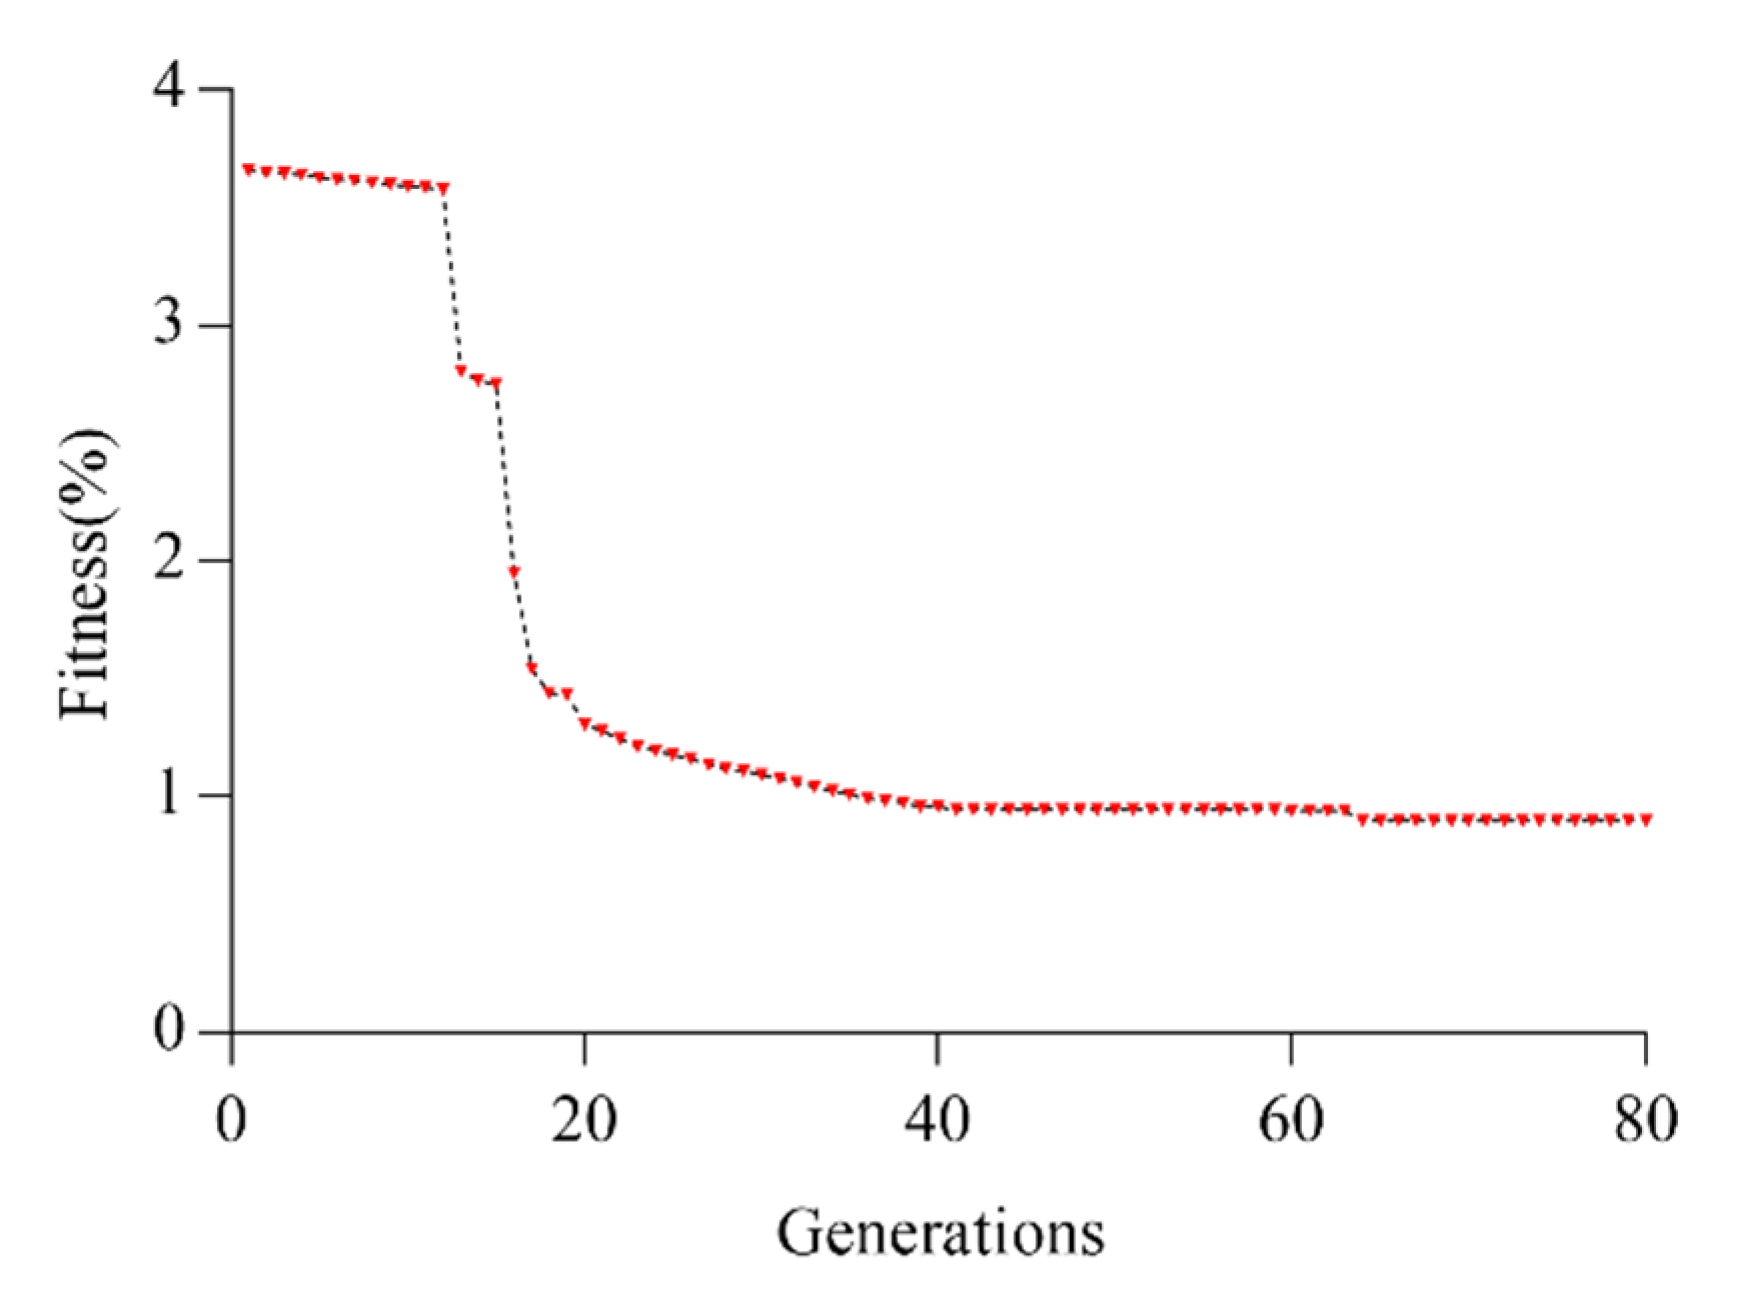
The particle swarm optimization algorithm is used to capture the optimal tuning factors extracted from the component analytical solution. The convergence process of the PSO algorithm is shown in
Figure 6, where the fitness reached the convergence point at the 63rd generation with a minimum fitness value of 0.9%. During the optimization process of the PSO algorithm, the fitness value is continuously reduced, which represents that the PSO algorithm could obviously decrease the simulated errors caused by the tuning factors.
The tuning factors corresponding to the 63rd generation are shown in
Table 5. It can be seen that TEtat_m is obviously tuned from 1.61 to 1.52, and the other tuning factors are adjusted slightly. For this study, a small deviation for tuning factors may lead to obvious simulated error.
5.3. Adaptation Case Study
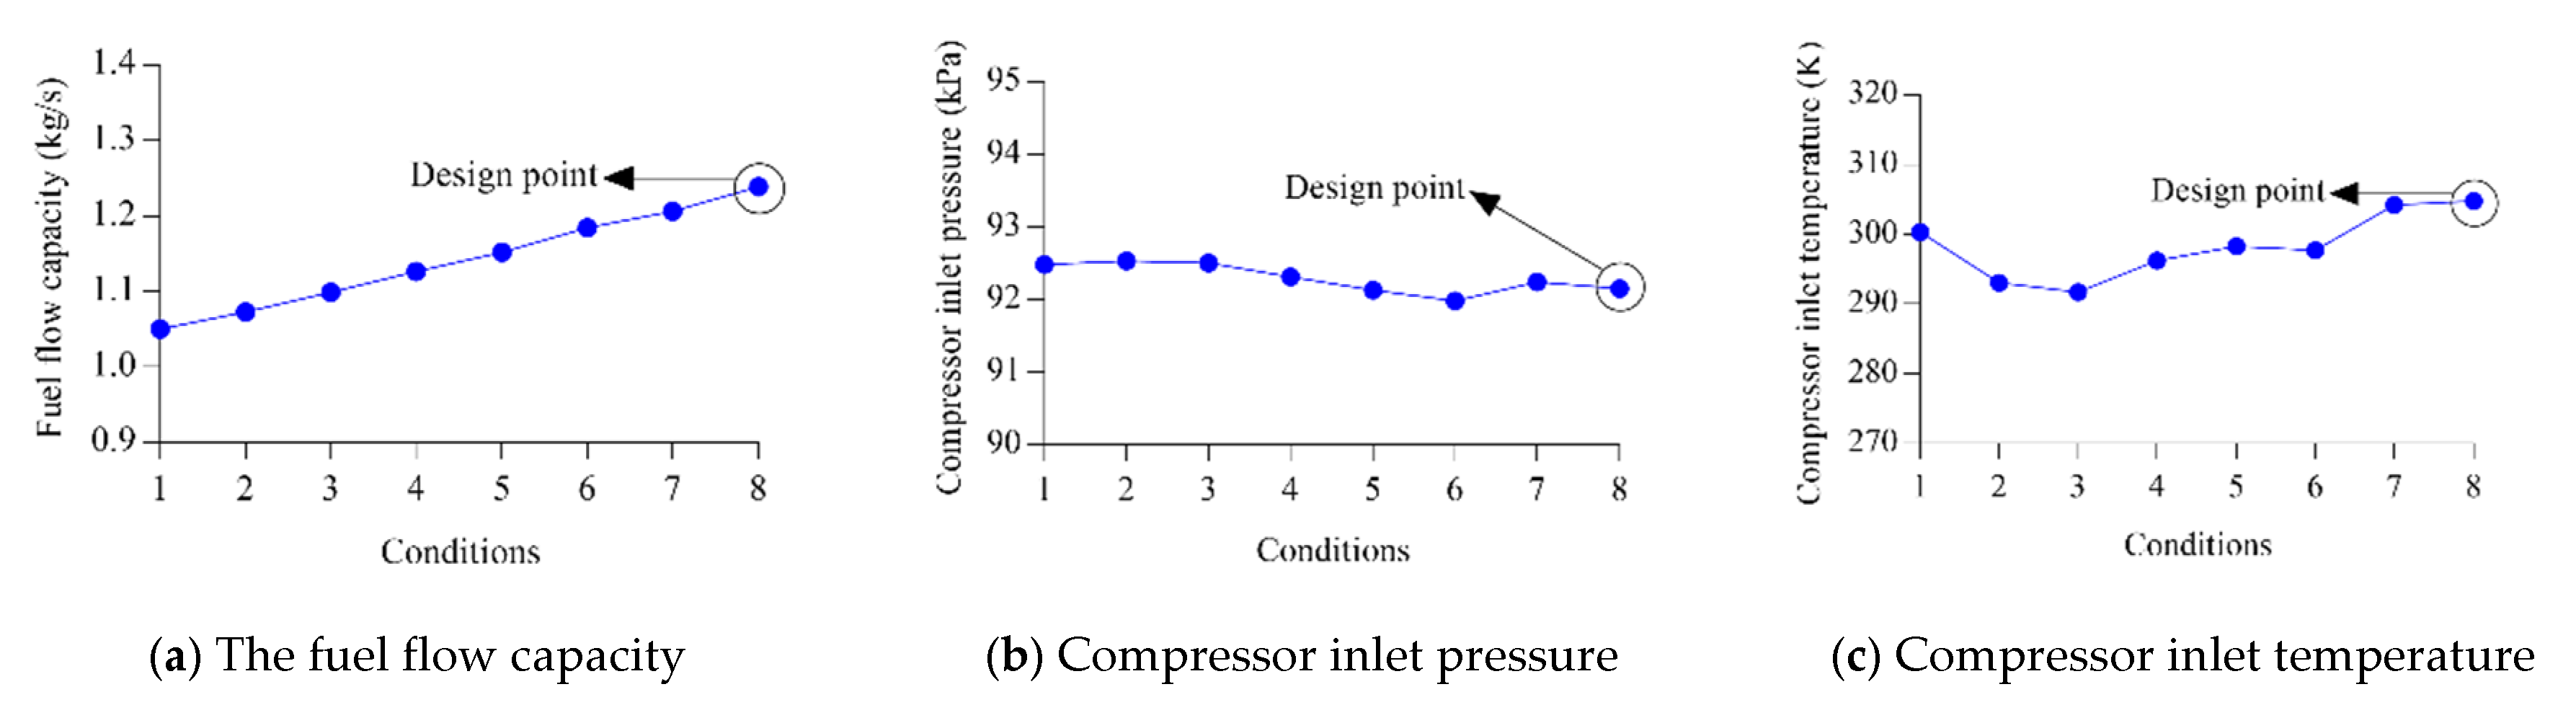
The objective of this section is to evaluate the accuracy of our proposed ECAS method and compare it with the map scaling, and map generation methods. To evaluate the proposed method for a wide range, the field data of the upload process are selected, where the fuel mass flow
, compressor inlet temperature
, and compressor inlet pressure
are taken as input parameters of the gas turbine model, depicted in
Figure 7.
A comparison of map scaling, map generation, and the newly proposed ECAS method has been performed. Three adaptation methods have the same targets and baseline model, which can provide a good insight into the effectiveness of the component map adaptation method. The map scaling method uses the default component maps from the open literature, the map generation method uses elliptic equations to generate appropriate component maps, and the newly proposed adaptation method uses the enhanced component analytical solution.
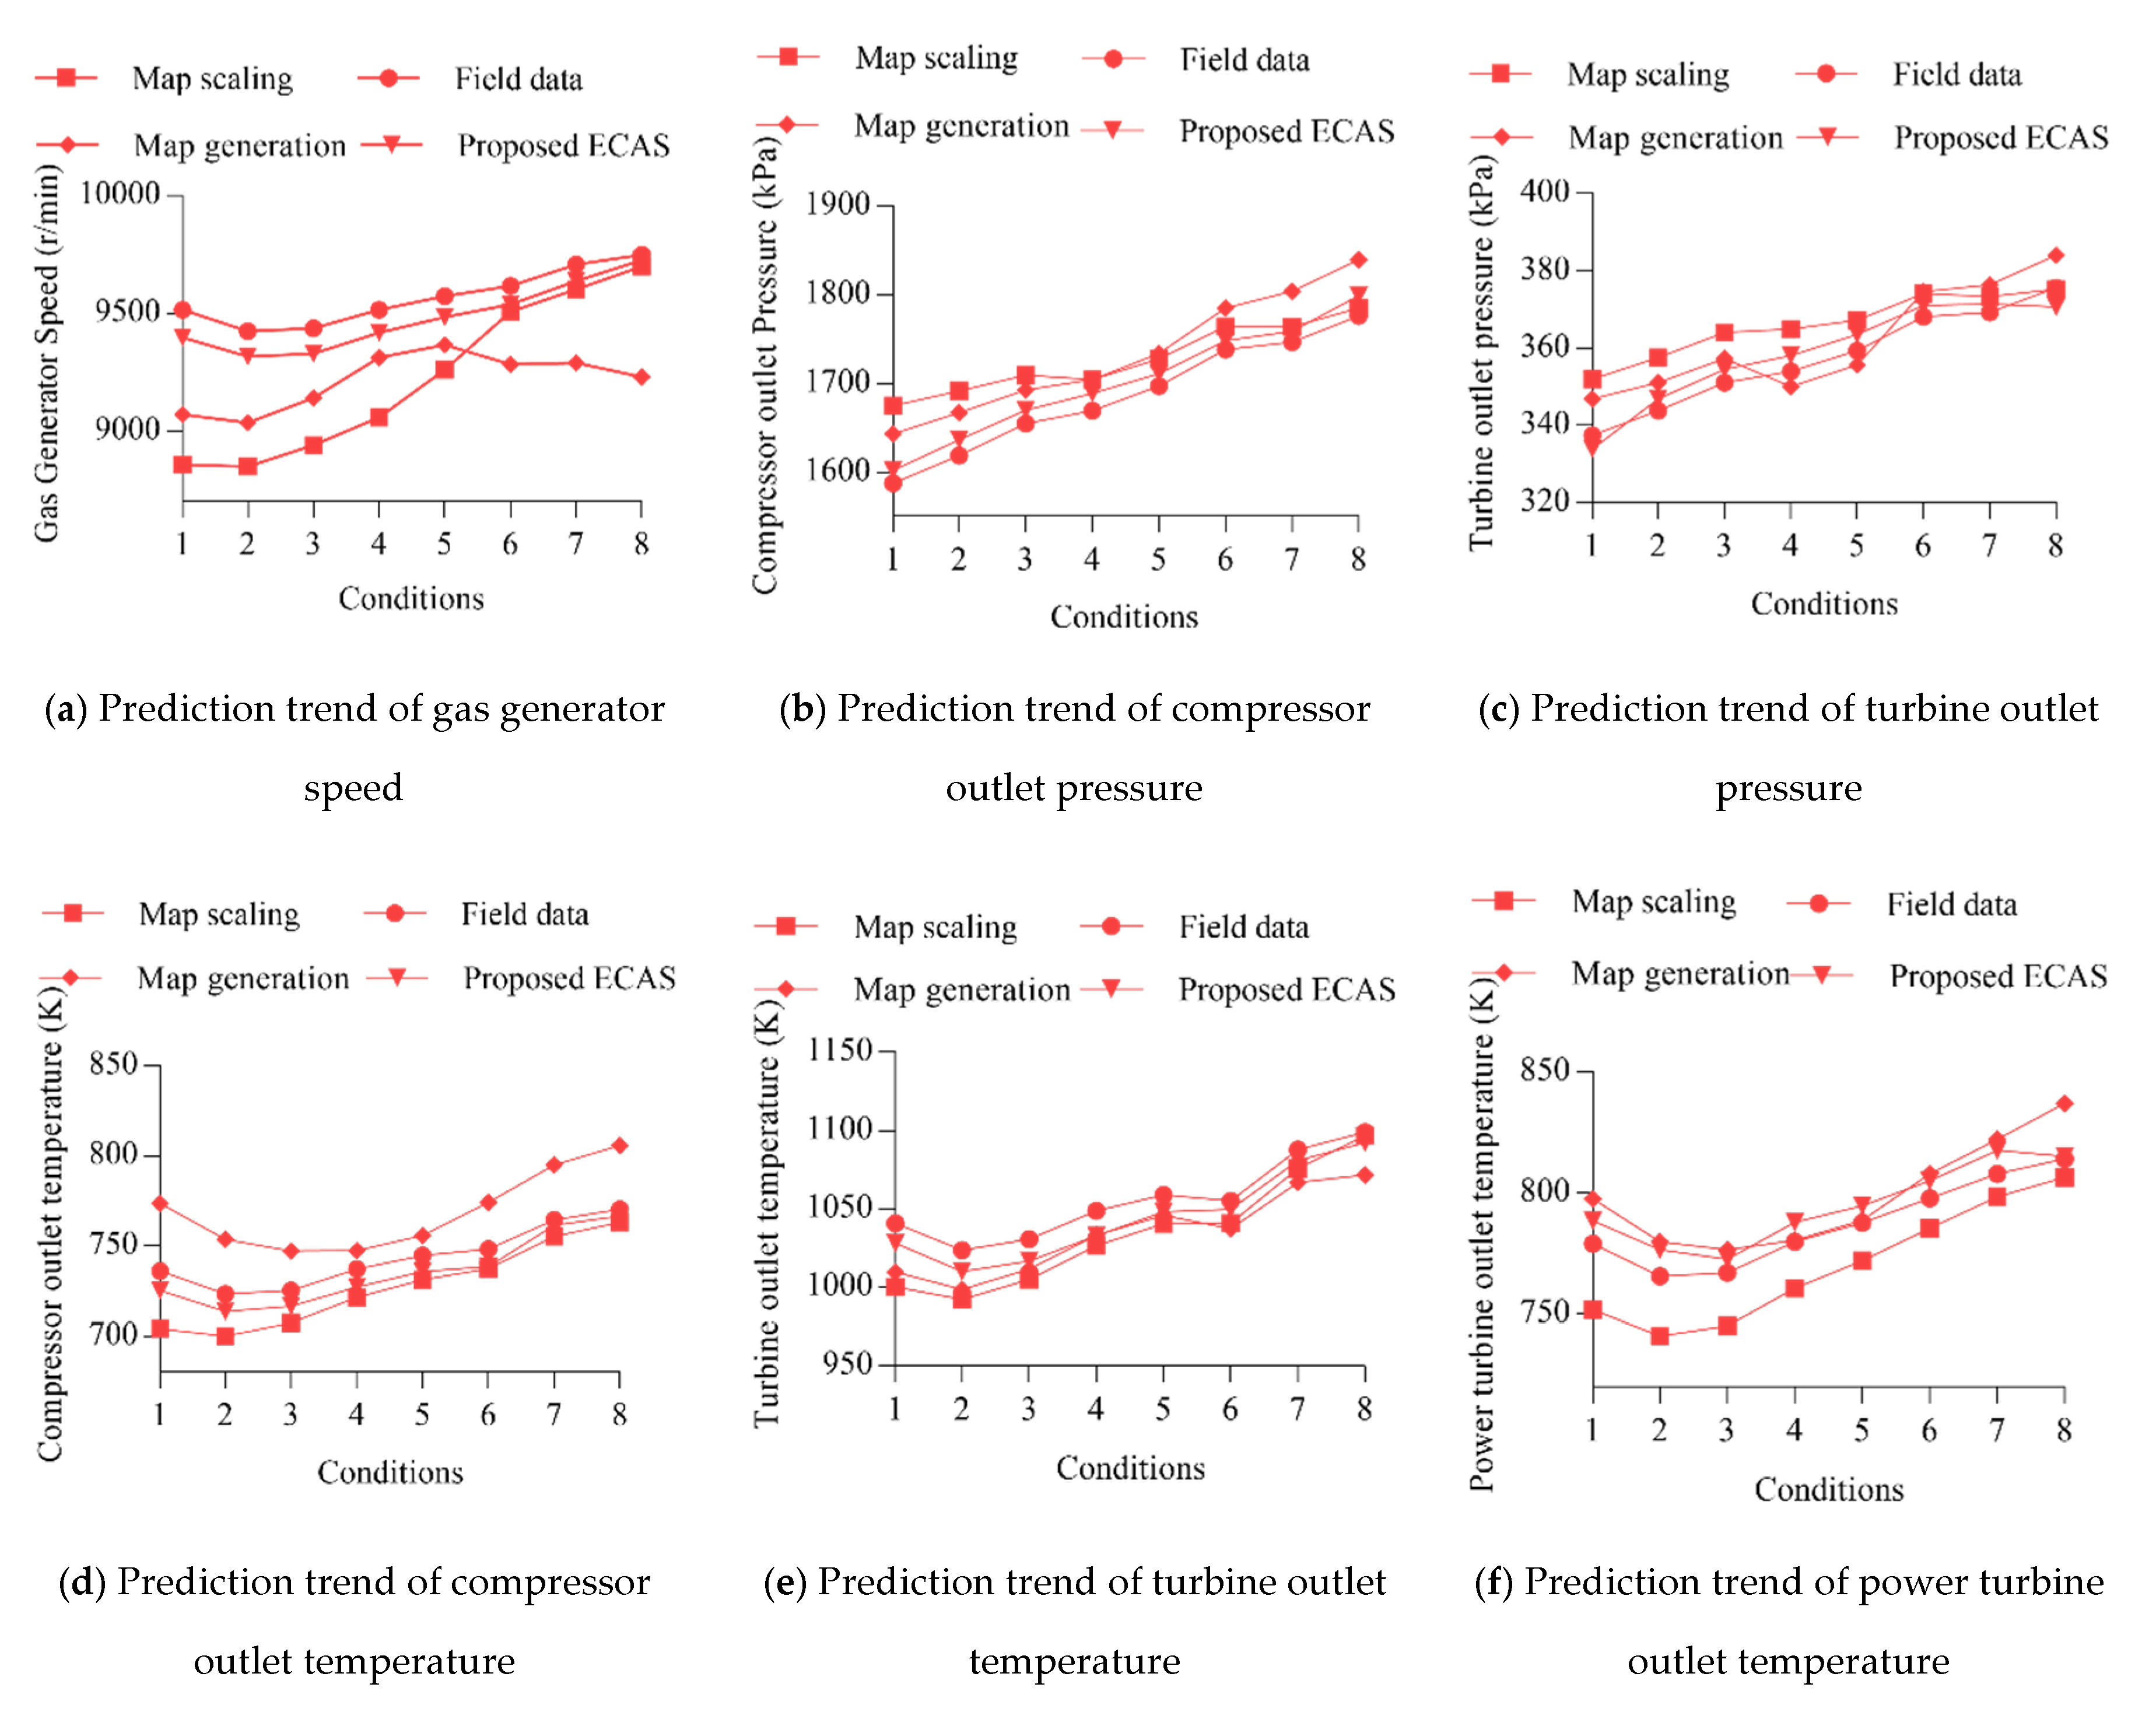
The results for the three adaptation methods can be viewed from the prediction trend chart, as shown in
Figure 8, where the predicted off-design measurable parameters are plotted against the gas turbine field data. It is clear that the proposed adaptation method is superior in terms of trend matching. The prediction trend using the map scaling method match well near the design point, but the prediction error increases when the operating point is far away from the design point. The prediction trend using the map generation method match well with the field data in the middle-speed region, but the prediction error increases when the operating point is running to the low or high-speed region. Whereas, the prediction trend using the ECAS method matches well with the field data in the whole speed region, and the maximum errors for the new adaptation method are observed as expected in the low-speed region.
It is concluded from
Figure 8 that the proposed method is accurate in the whole speed region. The map scaling method has a high accuracy near the design point, but the simulated errors increase when the operating point is far away from the design point. The map generation method has sufficient accuracy in the middle-speed region, but the simulated errors increase in the low or high-speed region.
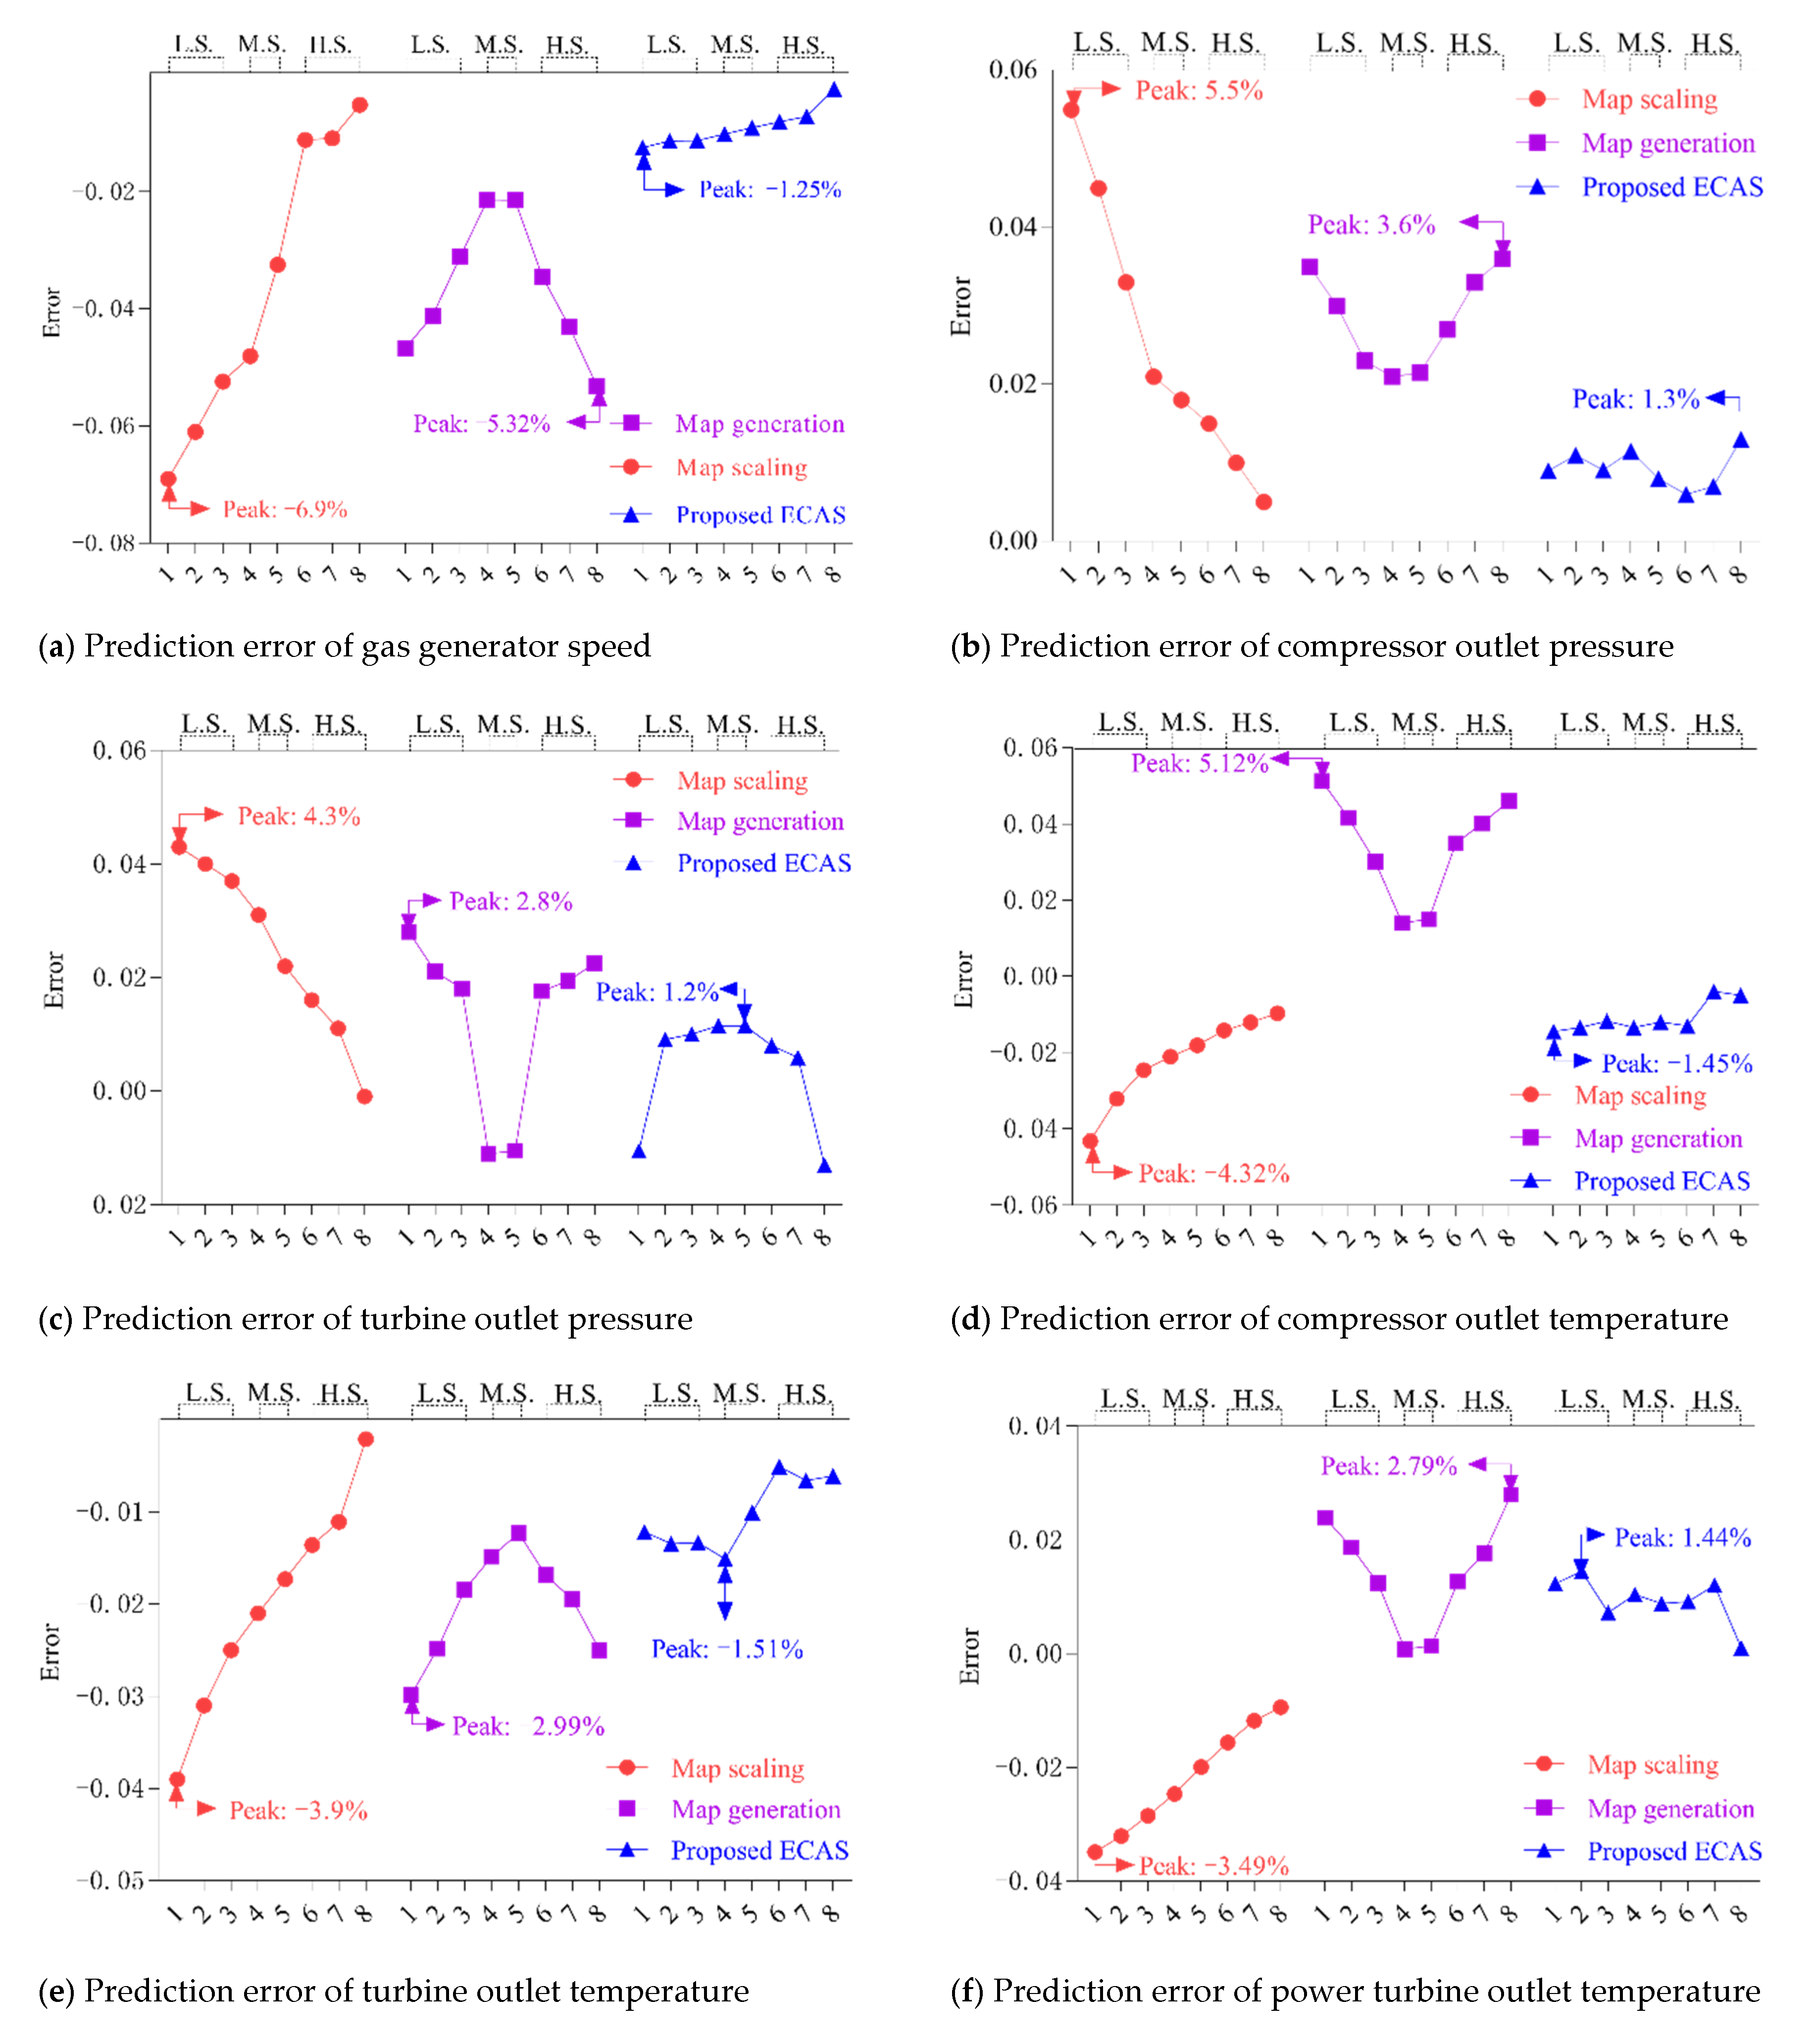
The prediction error for each method is shown in
Figure 9. The prediction error for the map scaling method is increasing when the operating point is far away from the design point. This is due to the assumption of the method that the component maps to be tuned should be very similar to actual component maps. On the other hand, the simulated errors of the map generation method are distributed in a quadratic curve, and the deviations are caused by the specific shape near two edges of the elliptical curve. In addition, the simulated errors of the proposed ECAS method are distributed in a balanced way, and the errors are lower than the earlier adaptation method in the whole speed range.
It can be seen from
Figure 9 that the maximum simulated errors of the map scaling method are in the range of −6.9–4.3%, the map generation method shows a maximum simulated error in the range of −5.32–5.12%, and the newly proposed ECAS method shows a maximum error in the range of −1.51–1.44%, and average simulated error is about 1%. Refs. [
4,
31] pointed out that the average simulated error of target performance parameter is about 1%, which represents the overall reasonable simulation accuracy.
In conclusion, the proposed ECAS method is superior in terms of simulated accuracy, and the proposed method can overcome the limitation of the other adaptation methods.
5.4. Fault Diagnostic Case Study
The objective of this case study is to assess the effects that the above three adaptation methods have on the quality of gas turbine independent parameters that are usually implemented for the maintenance of gas turbines. Generally, gas turbine users estimate the independent parameters of the gas turbine (the mass flow capacity and the isentropic efficiency) using the gas path analysis method. Depending on the severity of independent parameters degradation, the gas turbine has to be shut down and an off-line washing is carried out to recover the performance degradation of the component. The assumptions are as follows:
- (1)
Only the compressor fouling degradation is studied.
- (2)
The operation time period of the gas turbine examined in this case is 1415 days.
- (3)
The proposed diagnostics method is compared with the map scaling method and map generation to validate the method.
- (4)
Assume the isentropic efficiency of compressor drop with a constant velocity of 1% per month.
- (5)
The off-line washing of the compressor is carried out if the predicted drop of the compressor isentropic efficiency reaches 1–2%.
- (6)
The 90–95% drop of the compressor isentropic efficiency could be healed once the off-line washing is performed.
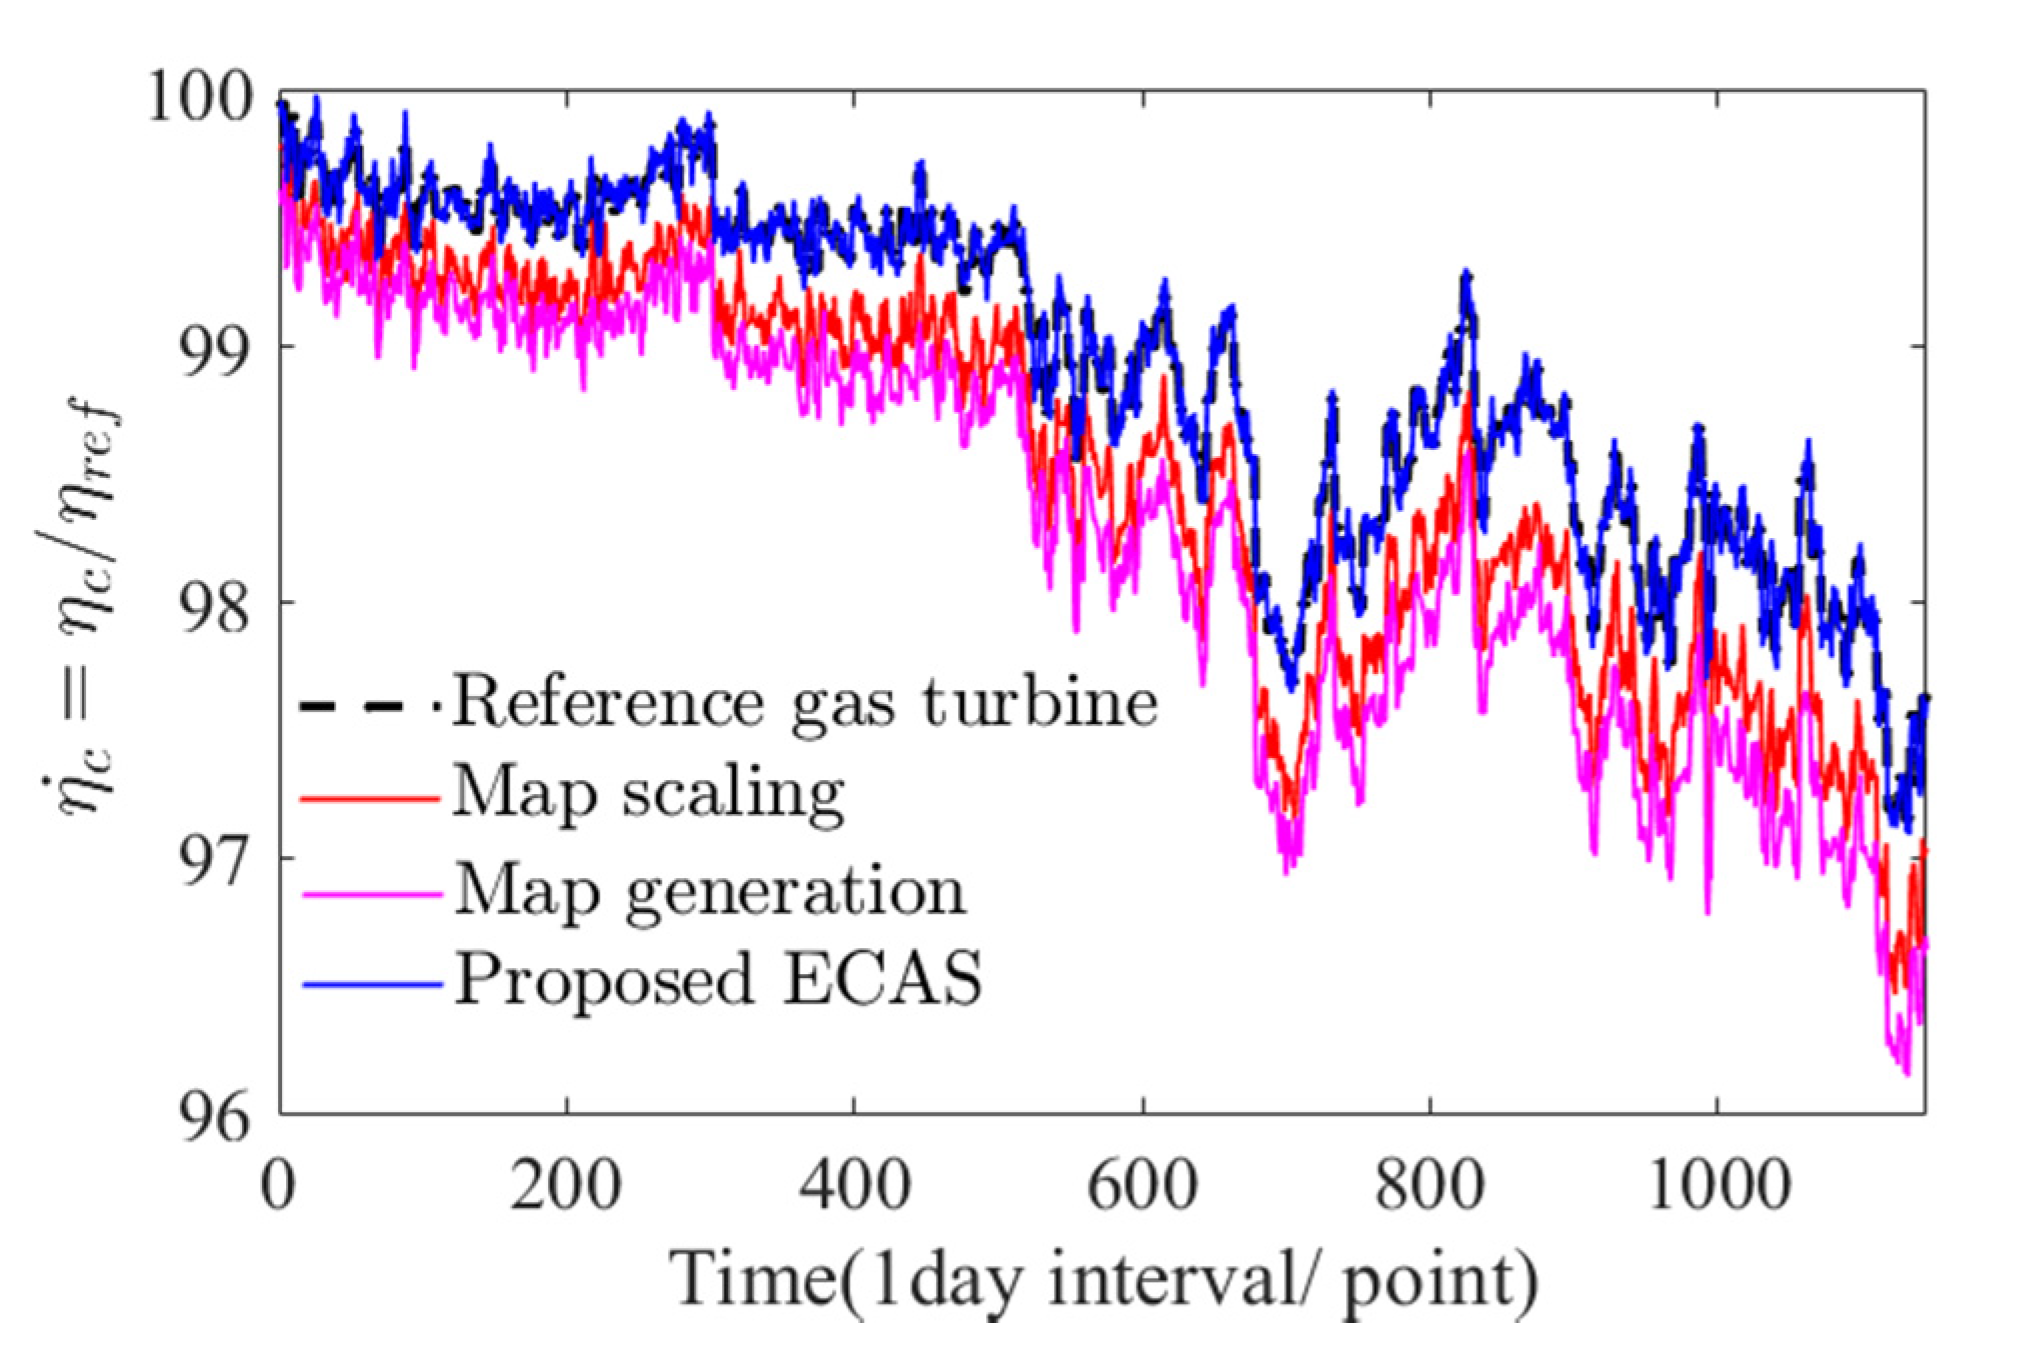
The normalized to design conditions percentage of the compressor efficiency before overhaul as estimated by the above three adaptation methods is shown in
Figure 10, and is compared with the percentage of the compressor efficiency of the reference gas turbine when adopting the maintenance strategy as encapsulated by the above assumptions.
It can be observed that the proposed ECAS method has the highest prediction accuracy in the whole time interval of gas turbine operation, in comparison with the actual compressor efficiency degradation of the reference gas turbine. The prediction accuracy provided by the Map scaling and the Map generation methods gradually decrease with the operation time growing, respectively. Although the prediction accuracy of each adaptation method that is employed in this case is within reasonable levels, their difference increases exponentially when it comes to the maintenance cost of the gas turbine.
6. Conclusions
In this paper, an enhanced component analytical solution (ECAS) method is proposed to capture the specific nonlinear behavior of component maps, which could minimize the residual errors caused by manufacturing tolerance, assembly, and overhaul of the gas turbine. The tuning factors are directly extracted from the component analytical solution. The ECAS method utilizes a sensitivity analysis to set the weight coefficient for the tuning factors reasonably, which can improve the efficiency and accuracy of the adaptive method. The optimal tuning factors are determined by a particle swarm optimization algorithm. When the accurate tuning factors are determined, the simulated errors of the gas turbine will decrease simultaneously at the design point and off-design points. Different from the earlier adaptation method, the newly proposed ECAS method can adapt the component maps while locking the design point, so the simulation accuracy of design points can be locked while off-design points are tuning. The enhanced component analytical solution is applied to the diagnostics of a gas turbine, which shows a better performance than earlier adaptation methods, such as predicting the independent parameters of the component (mass flow rate and efficiency).
The proposed method has been applied to a GE PGT25+ gas turbine. The simulated performance using the ECAS method is compared with simulated performance using the map scaling method and map generation method. The simulated performance based on the map scaling method had a maximum of −6.9% error, and the simulated performance based on the map generation method had a maximum of −5.32% error, while the prediction result based on the ECAS method had a maximum of method, 1.51% error. Compared with the scaling method, this method has higher simulation accuracy at off-design points far from design points. Compared with the map generation method, this method has higher accuracy at off-design points near two edge regions. The proposed ECAS method has a reasonable error for gas turbine prognostics and diagnostics. Theoretically, the proposed method is also suitable for different gas turbines.
There are some aspects that could be enhanced in the future: (1) the tuning factors could be further smoothed to obtain higher simulated accuracy; (2) the weight coefficient derived from the sensitivity coefficient can be further optimized; (3) more advanced filters can be considered to reduce measurement noise.


