Article

Assessing the Impact of Water Efficiency Policies on Qatar’s Electricity and Water Sectors

Division of Sustainable Development, College of Science & Engineering, Hamad Bin Khalifa University, Qatar Foundation, Doha P.O. Box 34110, Qatar
*
Authors to whom correspondence should be addressed.
Energies 2021, 14(14), 4348; https://doi.org/10.3390/en14144348
Submission received: 8 June 2021 / Revised: 11 July 2021 / Accepted: 14 July 2021 / Published: 19 July 2021
(This article belongs to the Section C: Energy Economics and Policy)

Abstract

:
Water and electricity have a unique relationship in the modern world as one requires the other in a complex system of networks to supply the utility to the customers. This energy–water interaction is especially peculiar in the Gulf Cooperation Council, where there are limited water resources, but extremely high use rates. Qatar provides a unique case in terms of extreme water scarcity and excessive water use. To understand the intricate network, this paper establishes an updated and comprehensive qualitative model of the water system in the country with the help of a water balance and system dynamics (causal loop diagram) methodology. Regression estimates are then used to estimate future water and energy consumption in addition to carbon dioxide emissions until the year 2050. Finally, system dynamics (stock and flow diagram) is used to determine the supply impacts of efficiency policies including limiting of groundwater abstraction to only 50 million m3, reduction of water consumption in the household, commercial and industrial sector by 10%, and gradual increase in the share of reverse osmosis (RO)-produced desalinated water to 50% in order to assess the supply volume, electricity consumption and CO2 emissions. The efficient use of water in different sectors of the economy results in a combined saving of 1222 GWh (8.1%) or 594,000 tons CO2. Furthermore, by moving to membrane-based desalination technology energy consumption and carbon dioxide emissions can be reduced by 3672 GWh (24.3%) and 1.8 million tons CO2, respectively. Further results suggest that while replacing groundwater with desalinated water can increase the energy consumption significantly, reuse of treated wastewater has almost the same footprint as groundwater, but can increase the resilience of the system considerably as groundwater abstraction levels are lowered to their renewal rates.

1. Introduction

Water is an essential commodity that is necessary for the continuation of life. It is required for agriculture, industries, households, recreational and environmental activities [1] and is “critical for socio-economic development, energy and food production, healthy ecosystems, and for human survival itself” [2]. Low water quantity and quality often results in decline of human well-being, which may lead to social tensions, disputes and potentially acute conflicts, especially in urban environments where the population density and water demand is extremely high [3]. Water supply and distribution networks (WSDNs) are crucial to our society, transmitting water to meet consumers’ demands [4]. These networks provide drinking and non-drinking water and are used for waste water collection, treatment, disposal and reuse [5]. It is vital to point out that these water systems are interconnected with energy systems, as energy is consumed (usually in the form of electricity) for acquisition, treatment, distribution, end use, wastewater collection and treatment [6], whereas, water is often consumed or utilized in technological processes of harnessing, extracting and generating energy, directly or indirectly [7] during fuel production and electricity generation [8]. This compound interaction between water and energy resources is often known as the energy–water nexus [9].
This energy–water nexus is especially important in countries with low amounts of fresh water resources, as these countries often produce water to meet the demand through the process of desalination. Desalination consumes far more energy compared to fresh water supply and treatment options, as removing salts from saline water is an energy-intensive process [10]. According to the latest statistics, 150 countries use desalination in one form or another, with approximately 21,123 desalination plants having an estimated capacity of 126.5 million m3/day [11]. The need for desalination often arises from socio-economic factors such as population growth, water use intensity, economic growth and from geographic factors such as fresh-water scarcity, low annual precipitation and high evaporation rates. In addition to a yearly water demand, the need for water changes depending on the climate as well as the time of day. The seasonal, weekly and daily demand projections and consumption patterns are affected through changing population dynamics, user preferences, and age distribution [5].
Furthermore, there is usually a difference between the consumption patterns in rural and urban regions. Cities create concentrated water demand with authorities using extensive measures to supply and distribute water from remote resources [1]. Additionally, customers in cities expect water utilities to provide affordable water, noticeable conservation schemes, lowered pipe leakage in the system, reduced carbon emissions for production and delivery, improved freshwater ecosystems and cut down impact on climate change [12]. The concentrated demand along with other needs and desires make these systems complex. Water is distributed at high pressure, which leads to leakage, moreover, the high pressure increases energy consumption in pumps that generate it. This pumping is often considered the major reason for greenhouse gases (GHGs, gases that trap heat in the atmosphere and include carbon dioxide (CO2), methane (CH4), nitrous oxide (N2O) and fluorinated gases [13]) emission in water distribution systems [14]. Further inefficiencies in the system occur because of leakage through equipment such as damaged pipes and valves, theft and meter failure. This means that water lost in the system takes with it embedded emissions generated from energy used for pumping and treating of that water [15]. It must be pointed out that, while clean potable water is the objective of supply side activities, only a small portion of it used for potable purposes [16]. It also worth mentioning that end-use water heating is also a major source of energy usage in colder climates [17].
These issues in the energy–water nexus are even higher in the Middle East and North Africa (MENA, a region that includes approximately 19 countries including Algeria, Egypt, Iran, Iraq, Jordan Palestine, Qatar and Saudi Arabia, etc.), which has the most unsustainable water use in the world, with the region using surface and ground water “far more than is available on renewable basis, where in some countries, more than half of current water withdrawals exceed sustainable limits” [18]. It is also important to view the energy and water infrastructure as connected and co-evolving in the region [8] because of high use of desalinated water [10]. This is especially the case in the Gulf Cooperation Council (GCC, a union among the six states of Bahrain, Kuwait, Qatar, Oman, Saudi Arabia and United Arab Emirates) where even with low water resources, the water footprint remains among the highest in the world [19]. Although the countries water resources are based on small amounts of freshwater, wastewater reuse, and virtual water (through import of agricultural products) [19], the GCC countries’ potable water supply is produced almost entirely through the desalination process. Despite these constraints in addition to the insignificant agriculture potential, one of the key drivers in the overuse and depletion of water is the resources use for agriculture purposes [20]. Because of abundant hydrocarbon resources, thermal technologies are the widely used method for desalination and a power plant is usually tied to the system [21] as excess heat produced from the power plant is used in the desalination process [22]. Given the use of waste heat, an alternative cost allocation results in lower energy costs. In addition to fresh water, the output of the desalination process is concentrated and heated brine which contains saline concentrate and treatment chemicals [23] that affects the marine ecosystem at and near the point of discharge [24,25]. Add to that the burning of fossil fuels to run the desalination process and you get some of the highest GHG emissions to extract and distribute water anywhere in the world. The extreme hot and arid conditions, reliability on fossil fuels, growing population and advancing economies make the GCC region a unique hotbed where multiple factors affect the local water systems in drastic ways.
The need for increasing water supply in addition to the wastewater treatment and the infrastructure required for such, as well as the necessary energy (electricity) requirements, makes it essential for policy makers and stakeholders to adapt to future demands of the water systems through informed studies and models. To study such a phenomenon, we chose Qatar as a case study as it has the highest GDP per capita in the GCC region and the world [26] and provides us with a unique test case of extreme conditions. With the help of our research, we answer the following research questions:
  • What are the future energy–water consumption patterns because of economic and population growth?
  • How is efficiency in water and wastewater systems going to impact the consumption of energy?
  • What options are present to secure reliable and long-term energy and water security in the region?

2. Background and Literature

Modeling and simulation of water systems over time allows us to see the dynamic changes in these systems and empowers stakeholders to make informed decisions to maximize the adaptive capacity of the resource [27]. Because the water and energy systems are connected and coevolving [8], especially in the case of Qatar, it is essential to choose a method that can be used to develop and analyze the impacts between the two systems together, particularly in the light of the region’s seasonal electricity and relatively stable water consumption patterns. A system dynamics model can be used to analyze multi-scenarios and multi-attributes of the water–energy interaction over time [7]. It can be used to put together both physical and socio-economic behavioral facets of a given matter in a holistic, flexible and transparent way [28] and its ability lies in modeling the behavior of a system which has not been developed and estimated before [29]. The process of developing the system dynamics model involves the interrelated activities of articulating the problem, proposing a dynamic hypothesis, building a simulation model, testing that simulation model and finally designing and evaluating different policy measures [30].
The methodology allows for qualitative or conceptual modeling as well as quantitative or numerical modeling [31], and has been extensively used in developing a water systems. Zarghami and Akbariyeh [32] developed a system dynamics (SD) model to study the water system of Tabriz, a city situated in the west of Iran. The author’s incorporated supply and demand resources as well as water management and conservation tools and estimated the impacts of five different scenarios on the water shortage of the city. Sharawat et al. [33] used system dynamics to model sustainable development of water resources using the temporal projections of population growth, for district headquarter city Rohtak in North India. The projections were done from 2016 to 2041 for six population scenarios, to study policies using a mass balance model of the water system in the city. Chen et al. [34] modeled the supply and demand water system of Shanshan Country in northwestern China and focused on the water resource management techniques. The tool integrated the operational management of the water system, sources of water supply and the water demand from different users. The impacts of climate change were considered and several strategies were simulated to test water policies on water sources, irrigation land, irrigation efficiency and water demand. Chang et al. [35] developed a model for the city of Urumqi (an arid area), and investigated the urban water resource security with the help of water supply demand pressure and urban expansion index for the years 2011 to 2030. The authors also evaluated the carrying capacity of the system while considering the effects of climate change, population growth and industrial development for the duration between 2006 and 2030.
Sun et al. [36] constructed a comprehensive national-scale water assessment and management system through system dynamics by developing five subsystems (economy, population, water supply and demand, land resources, and water pollution and management) that affect the sustainable utilization of water resources. Further studies such as that of Alvi et al. [37] developed a hybrid agent-based and system dynamics household model to estimate the water consumption for an urban area. Chhipi et al. [7] developed a system dynamics model as a decision support tool for the urban water system of Penticton, British Columbia, Canada. Duran-Encalada et al. [28] estimated the quantity and quality of water across the US–Mexican transborder communities of the Rio Grande/Rio Bravo Water Basin. Chen and Wei [38] conducted an extensive theoretical literature review on the application of system dynamics for the past 20 years, with the review focusing on research related to flood control, disaster management, water resource security and water environment security. A more recent literature review by [39] assessed the application of system dynamics in the WSDNs. The authors found that the literature addresses the supply side of the network. However, there is a lack of research related to water distribution networks (WDNs).

2.1. Water Policies and Methods to Reduce Energy Consumption

Policies to assist in developing sustainable water systems require a fine balance between addressing social, economic and environmental issues. The right pricing, reliability and accessibility are imperative, as decision makers face problems including water resource scarcity, environmental pollution, high subsidy and high transmission and distribution losses [40]. The supply side practices often involve disrupting the entire systems through development of new projects or requiring extensive changes to the current structures. Demand side policies on the other hand depend on the changes from individual entities (people, households, companies, etc.) through changes in equipment and behavior, as well as pricing and are considered efficiency measures that involve improvements in technology, human conduct and a combination of both [41].
In terms of energy use, wastewater treatment and reuse is much more efficient than desalination [8]. Recycling and reusing lowers the water demand and extends the life of the existing water supply stock [42]. Urban water systems can be improved significantly through water reuse, rainwater harvesting, dual pipe systems, reduced water losses and water conservation policies [43]. One primary solution in addressing water issues is the transition away from centralized water systems towards decentralized and integrated or multifunction systems, with measures involving water reclamation, gray water recycling and rain and storm water harvesting [44]. These systems can work independently or in tandem with the existing water infrastructure [45,46]. The use of water multiple times from higher to lower quality needs, is an important method of water resource management and reuse [33]. For example, lower quality water can be used in toilets, as toilet flushing uses an estimated 20 to 30% of household water consumed [33].
However, reuse and efficiency measures need to be addressed in holistic ways, as some measures may look to be more efficient, but may cause alternate cost such as in the case of drip irrigation, which saves water but can sometimes use more energy as compared to flood irrigation systems [47]. Storage systems can also be used to reduce the strain on the system during peak times and provide the utility at lower pricing. Pumped hydraulic storage continues to be one of the most efficient methods of storing both water supply and energy (electricity) [48].
Water pricing should include economic costs of production and supply. Moreover, water demand reduction can be achieved through incentive-based billing, conservation campaigns and water saving devices [49]. “Techniques used in demand management programmes include: intermittent water supply; water loss reduction (including leak detection and repair); comprehensive metering, changes in water pricing concepts, installation of water saving devices (retrofitting), wastewater reuse, institutional development, and public awareness and educational campaigns” [1].

2.2. Desalination, Wastewater Reuse and Groundwater Studies in the Region

Ibrahim and Shirazi [50] examine the potential transition of the Energy-Water-Environment nexus towards a circular economy for the country of Qatar. The authors discuss that there is no comprehensive policy towards circular economy despite the enormous potential and that constructed wetlands can play a significant role in wastewater treatment and recycled wastewater usage. Similarly, Tahir et al. [51] evaluate vulnerabilities in the water networks and desalination plants for the Middle East region, and highlight the advances made to make the systems more resilient. The authors find that oil spills, harmful algae blooms and plant equipment failure are the most significant vulnerabilities in the region, which are being mitigated through mega reservoirs and research in technologies related to solar desalination and pretreatment techniques. Darwish and Mohtar [52] discuss challenges related to desalination, wastewater reuse and groundwater use for Qatar and recommend a reverse osmosis desalting system to save natural gas usage in the country. The authors also recommend water conservation measures such as the storage of treated wastewater in aquifers for strategic reserves and the use of renewable energy for desalting and wastewater treatment. Ahmad and Al-Ghouti [53] highlight the groundwater management practices that can be used to achieve sustainable groundwater usage in the state of Qatar. The authors recommend that, for aquifers, there is a need for enhancing rainfall infiltration and recharging through treated sewage effluent. Usage of groundwater treatment techniques, efficient irrigation practices and the development of water-use tariff structure is also recommended.
Multiple other studies have also discussed the potential of desalination, wastewater reuse and groundwater for Qatar. Atilhan et al. [22] use a systems-integrated approach to optimize the water desalination and distribution networks. Mannan et al. [54] examine the environmental and human health impacts of multistage flash desalination using life cycle assessment. Jasim et al. [55] discuss the efficacy of wastewater treatment and discuss the reuse of treated sewage effluent and wastewater in supplementing the growing demand on desalinated water. Lambert and Lee [56] present the results of a national survey that study the acceptability of greywater reuse and find that framing of greywater reuse as a cost saving measure can increase its acceptance among both Qatari nationals and expatriates. Alsheyab and Kusch-Brandt [57] examine resources such as nitrogen, phosphorus and sulfide, etc. embodied in wastewater and assess their profitability after recovery. Ahmad et al. [58] perform a hydrogeochemical characterization and quality evaluation of groundwater to assess its usage for domestic and agricultural use.

2.3. Qatar’s Water Statistics (Production and Consumption Patterns)

Qatar’s National Vision 2030 highlights the importance of the needs of current and future generations, by way of economic growth, social improvement and environmental management. The document envisions the need for a balance between development and the environment, including air, land water and biological diversity. It also calls for action to deal with the dwindling water resource, as well as the impact of climate change on water levels in the country [59]. The Qatar National Research Strategy [60] recognizes water security as one of the four grand challenges, and wants to address it through developing, refining and enhancing desalination in addition to waste water re-use capabilities (Table 1).
Qatar’s focus on water security is due to its unique geographic and demographic characteristics, and because it is one of the poorest countries in terms of natural fresh water resources [61]. A small country with an area of only 11,627 sq. km, Qatar is a peninsula that is approximately 185 km in length and 85 km in width. It is surrounded by the Arabian Gulf with a coastline of 550 km and has the only land border with Saudi Arabia that is nearly 60 km long [62,63]. Topographically, the country can be considered a flat land, with land surface elevations varying from 0 m to around 107 m above mean sea level [64]. The primary freshwater resource in Qatar can be found in the form of groundwater, however it exists in limited quantity and is brackish in nature [65] with rainwater being the primary source of recharge [66]. The annual average rainfall is around 82 mm with high temperatures increasing the evaporation rates to an annual average of 2200 mm resulting in insufficient replenishment of the groundwater [52]. This means that the country’s main source of freshwater is its ability to desalinate the seawater, with the first desalination plant in the country being commissioned in 1953 [65]. The energy required for the desalination process in the country is entirely met through natural gas [54] provided by Qatar Petroleum [67]. Energy and water have a unique link in the country as both electric power and desalinated water are produced together in most plants known as cogeneration power desalting plants (CPDP), with simple gas turbine cycle or gas turbines combined with steam turbine to form a gas turbine combined cycle (GTCC) [52]. Although the power generation and water desalination business is deregulated and owned by private entities in the form of IPWPs (independent power and water providers), the country has streamlined its electricity and water distribution network through a government corporation named KAHRAMAA (Qatar General Electricity and Water Corporation) [67].
With its 10 desalination plants, Qatar produced water close to 2.07 million m3/day with a total of 605.7 million m3 desalinated water produced in the year 2017 [67]. Because of access to only Arabian Gulf water and its characteristics of high temperature, salinity, turbidity and presence of marine organisms [68], the main desalination technologies used in the country are multi-stage flash distillation (MSF), multi-effect distillation (MED) and reverse osmosis (RO), with MSF supplying 75% of the total capacity [54]. MSF and MED consume an estimated 20 kWh to produce 1 m3 of water, whereas RO needs around 5 kWh/m3 [52], but the combination of technologies as mentioned above results in energy consumption of between 9 and 15 kWh per distilled m3 of potable water in Qatar [69]. Because of the combined power and water production cycles, the region experiences inefficiencies as the water demand stays stable throughout the year, but the electricity demand fluctuates [70]. Figure 1 shows the breakdown of water use balance with the potentially available resources on top and the use case on the bottom pie chart. A total of 1014.71 million m3/year of water is available throughout the system (in 2016) with around 55% of the resource being supplied through desalination, 25% through groundwater abstraction and 20% through treated sewage effluent [63].
Not only Qatar, but also the region (GCC and MENA) in itself lacks sufficient potable water, with water storage for large urban centers being between only 12 h and 3 days [70]. Some of the excess water that is produced through desalination is conserved in storage systems or is injected in aquifers [22]. Table 2 shows Qatar’s water reserve capacity as of 2017 with total storage operating capacity of 6.69 million m3 which provides a storage of around 2 to 3 days of water use. Furthermore, to address the issue of strategic storage for longer periods, the country is constructing man-made “mega-reservoirs”. Also known as the “water security mega reservoirs project”, the aim of the system is to provide 7 days of potable water storage, with the first phase to provide storage of around 10.46 million m3 for the expected water demand by 2026, and the second stage to provide additional storage for a total of 17.28 million m3, for the expected demand of 2036 [71]. The project is set in 5 strategic locations with 40 concrete reservoirs of dimensions 300 × 150 × 12 m3 set to be built by 2036, with up to 24 being built in the first phase, with each reservoir having a capacity of between 390,900 m3 and 440,970 m3 [71]. Furthermore, a natural form of storage that the country relies on is the groundwater aquifers found beneath the soil. This groundwater is found in 4 main aquifers known as Al Masahabiya, North Qatar, Central Qatar and South Qatar, with a minor fifth aquifer called Doha, found near the capital. All of the facilities above are included in the freshwater transmission network in Qatar, including the functionality of the “mega reservoirs” that are connected through 1440 km of pipeline with the complete distribution network at 8380 km (to reach 10,000 km by end of 2022) [72].
Complete and secure water and sanitation facilities are provided to nearly all citizens [73]. Since 2015, nearly 90% of the buildings have been connected to the sewerage system, with the rest being served by tankers transporting the wastewater to treatment plants and sewage lagoons [74]. There are 24 wastewater treatment plants in the country (2017) with a designed capacity of 827.9 thousand m3/day with the total amount of wastewater collected in the year amounting to 231.47 million m3; 99% or 228.67 million m3 of the wastewater generated was treated [75]. All of the treatment plants are designed for secondary treatment, with 19 of them achieving tertiary level wastewater treatment and the largest four of these 19 able to remove nitrogen and phosphorus. Figure 2 shows the details of the water and sewerage distribution network in the state of Qatar in the form of a water balance flow chart. As can be seen, the two main sources of water are the desalinated water from the Arabian sea and the water withdrawn from aquifers, with a third source of water being the treated sewage effluent from the wastewater treatment plants. The literature indicates that desalinated and groundwater networks are not connected. However, the treated sewage water network is coupled with the aquifers as some of the treated water is deposited to replenish the water levels.
Qatar’s water consumption is divided based on the source of water, as ground water is used for agriculture, desalinated water for portable consumption and treated wastewater for irrigation of crops and landscaping [52]. To date, Qatar’s arable land is estimated at approximately 1.2% [76] with the value added to the GDP of just 0.2% [77], while the percentage of water use for irrigation and livestock is as high as 28.75% [63]. The primary purpose of treated wastewater is landscaping which includes parks and lawns. Treated wastewater is not used for edible agriculture because of social, religious and local marketing views [65]. However, in recent years according to KAHRAMAA, tertiary treated wastewater is being supplied for agriculture in some instances (for fodder crops).
Using Figure 2, Figure 3 and Figure 4, we can see that the main supply to the household and industry sector is desalinated water, with less than 6% and 2% of the total water supplied through groundwater respectively. The water demand of the commercial sector is entirely met through desalination, whereas the government sector (which includes greenspaces in the country) water demand is met through 60% desalination and 40% treated wastewater. The largest consumer of groundwater is agriculture, with around 78% (of 300 million m3) consumption with the rest of the demand being met through treated wastewater. Reports and data mention the total amount of urban wastewater collected, but the division is not made between how much wastewater is produced through household, industry and commercial sectors. Furthermore, the statistical reports mention the losses in the water system only in the desalination distribution network.

3. Methodology

To answer the research questions identified in Section 1, the first stage is to develop a conceptual model of the entire system to understand the linkages and interactions between different components of the water system. This conceptual model is designed with the help of causal loop diagrams. The causal loop diagrams are a qualitative modeling technique that are used as a mind mapping tool to develop the structure of the system. This activity is carried out with the help of Vensim software [78]. In the next stage, the quantitative aspect of the modeling is addressed, which is split into two steps. The first step involves the use of regression equations to estimate future water needs and consumption patterns in the different sectors of the economy. The second step involves the development of the quantitative stock and flow model, which in this study is constructed with the help of Ventity software [79]. The stock and flow model is then validated for the business as usual scenario (of water consumption estimates) with the help of data used for the regression. The next stage involves the implementation of the energy equations in the system, to assess the impact of alternate scenarios on energy consumption. The results from these are then compared, which support the relevant policies suggested in the final stage.
The entire methodology is developed on the current economic, demographic as well as the geographic and climatic conditions based on data extracted from various reports and literature reviewed. It attempts to address the problem across the energy–water nexus in Qatar, that can be transcribed as: “Despite economic and population boom, how can the country achieve long-term sustainability through application of efficiency measures in the energy-water nexus, particularly in the light of the high energy consuming water generation and distribution network”.

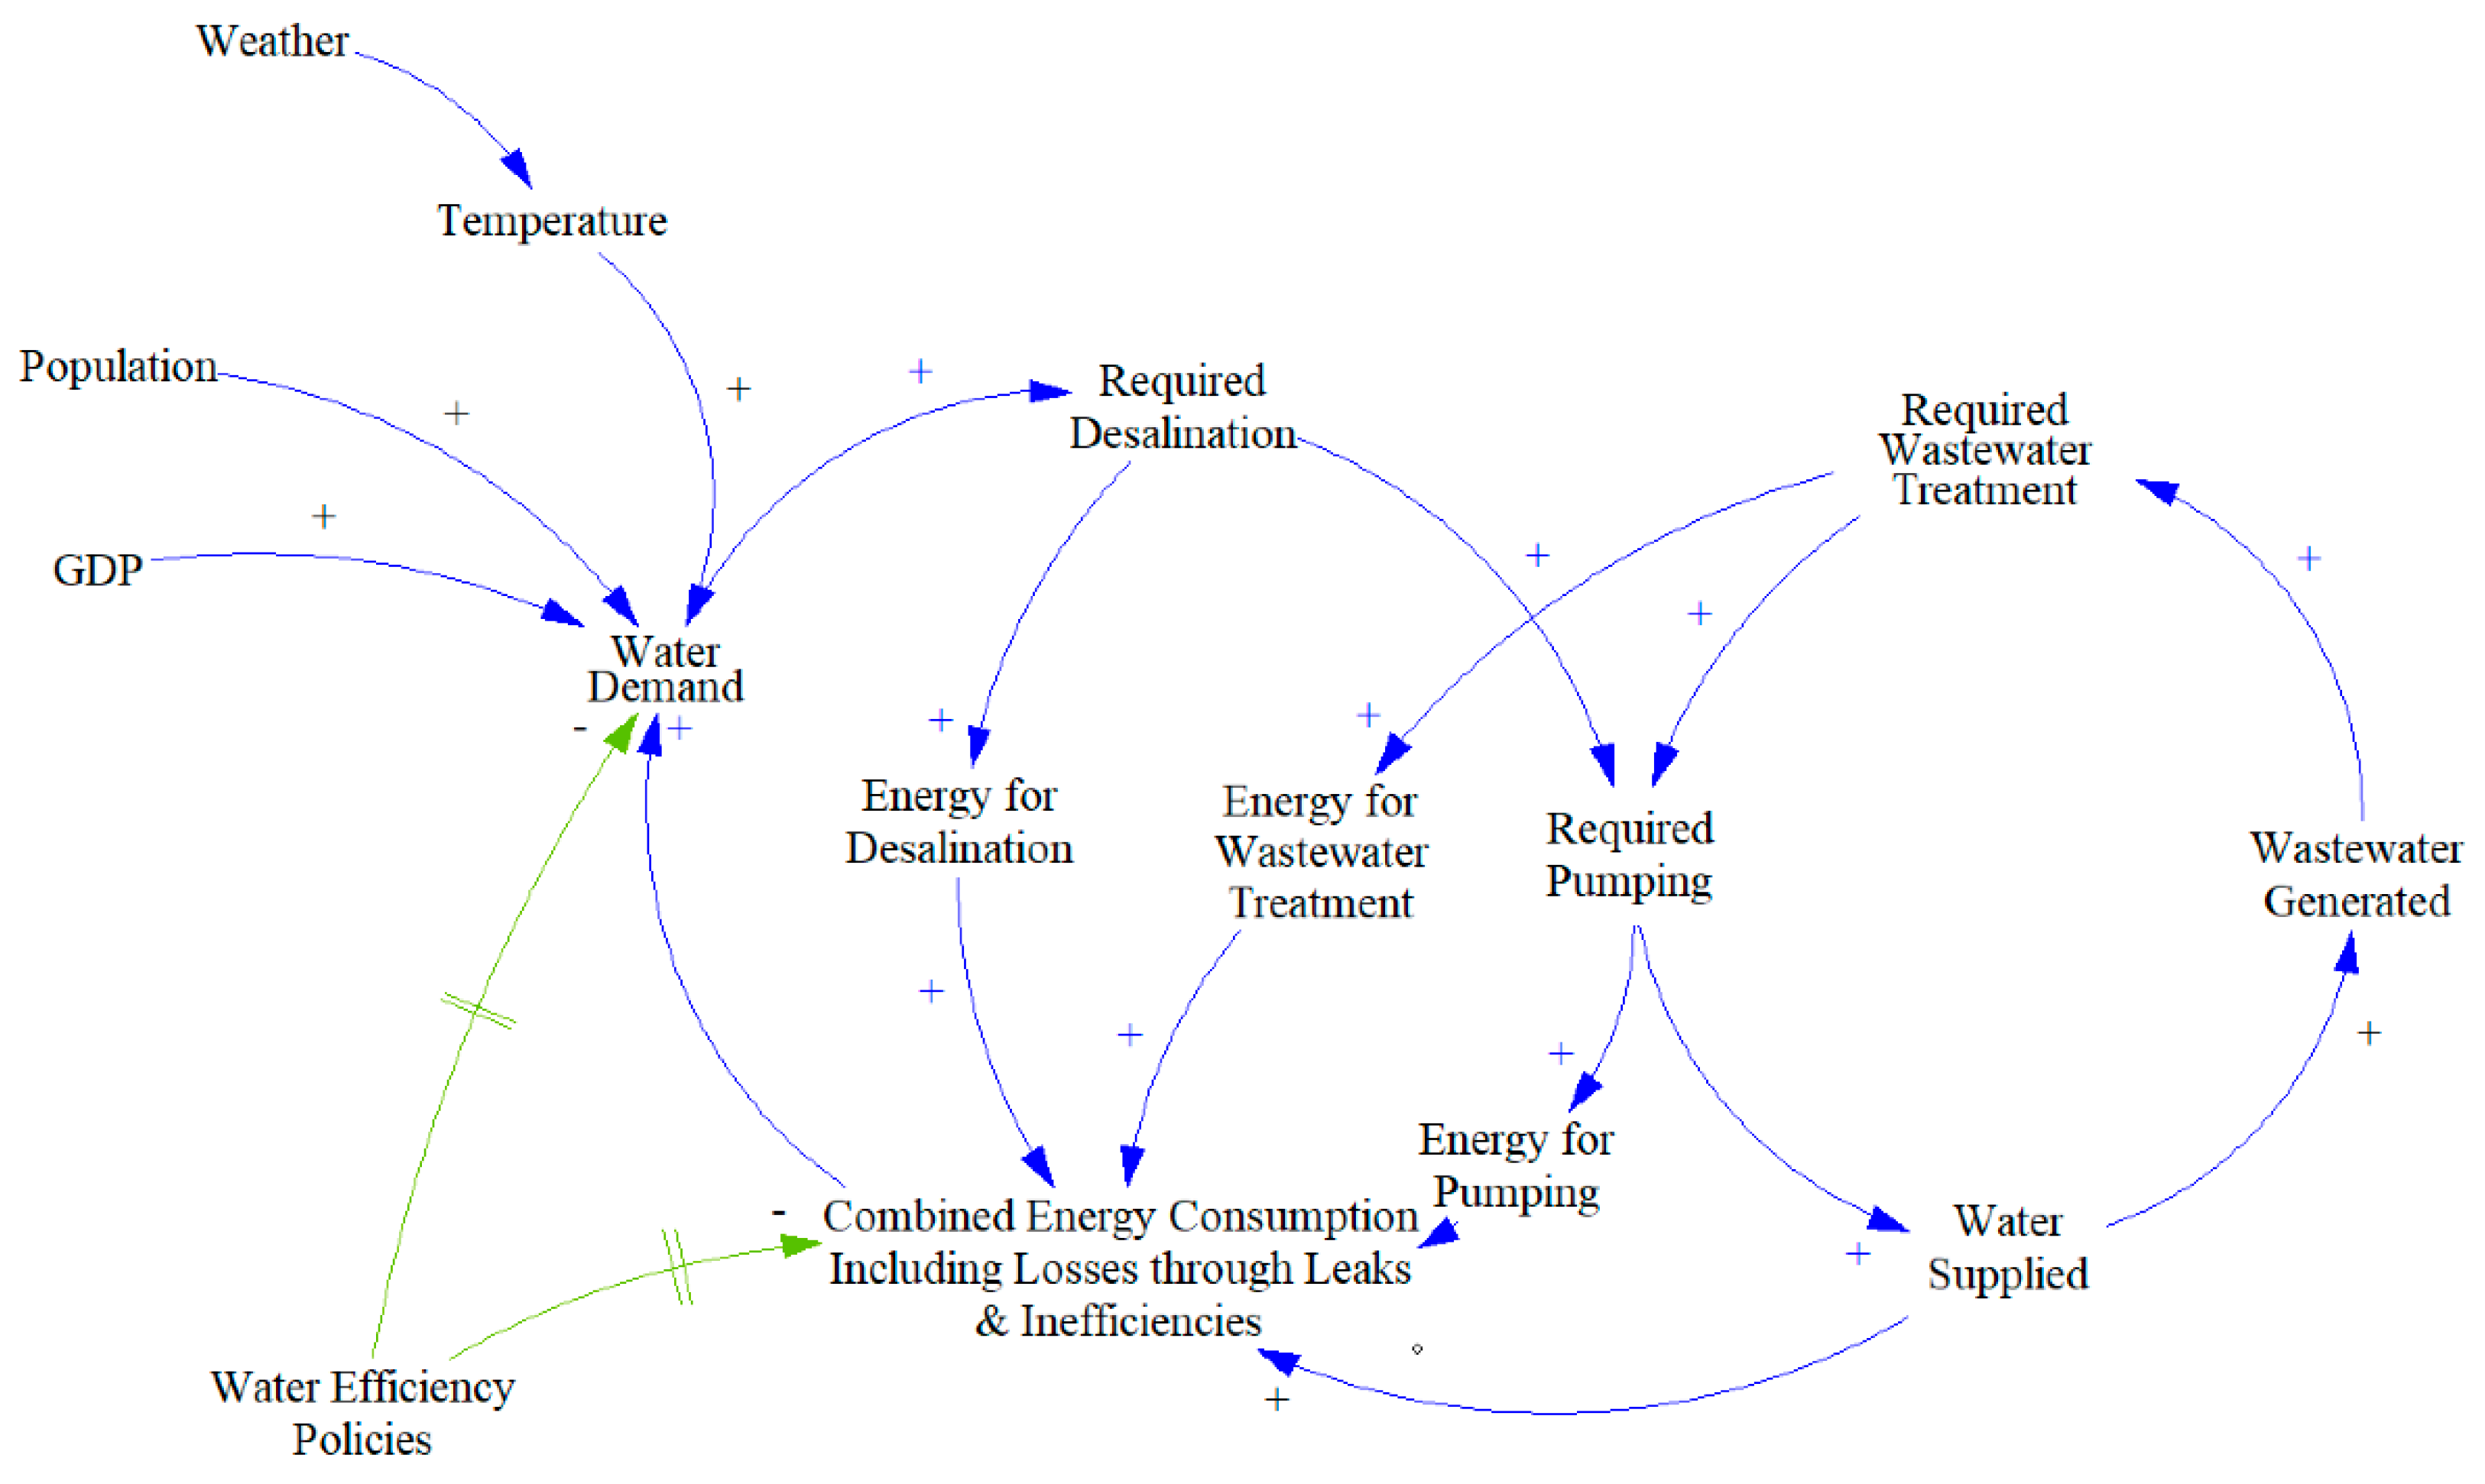
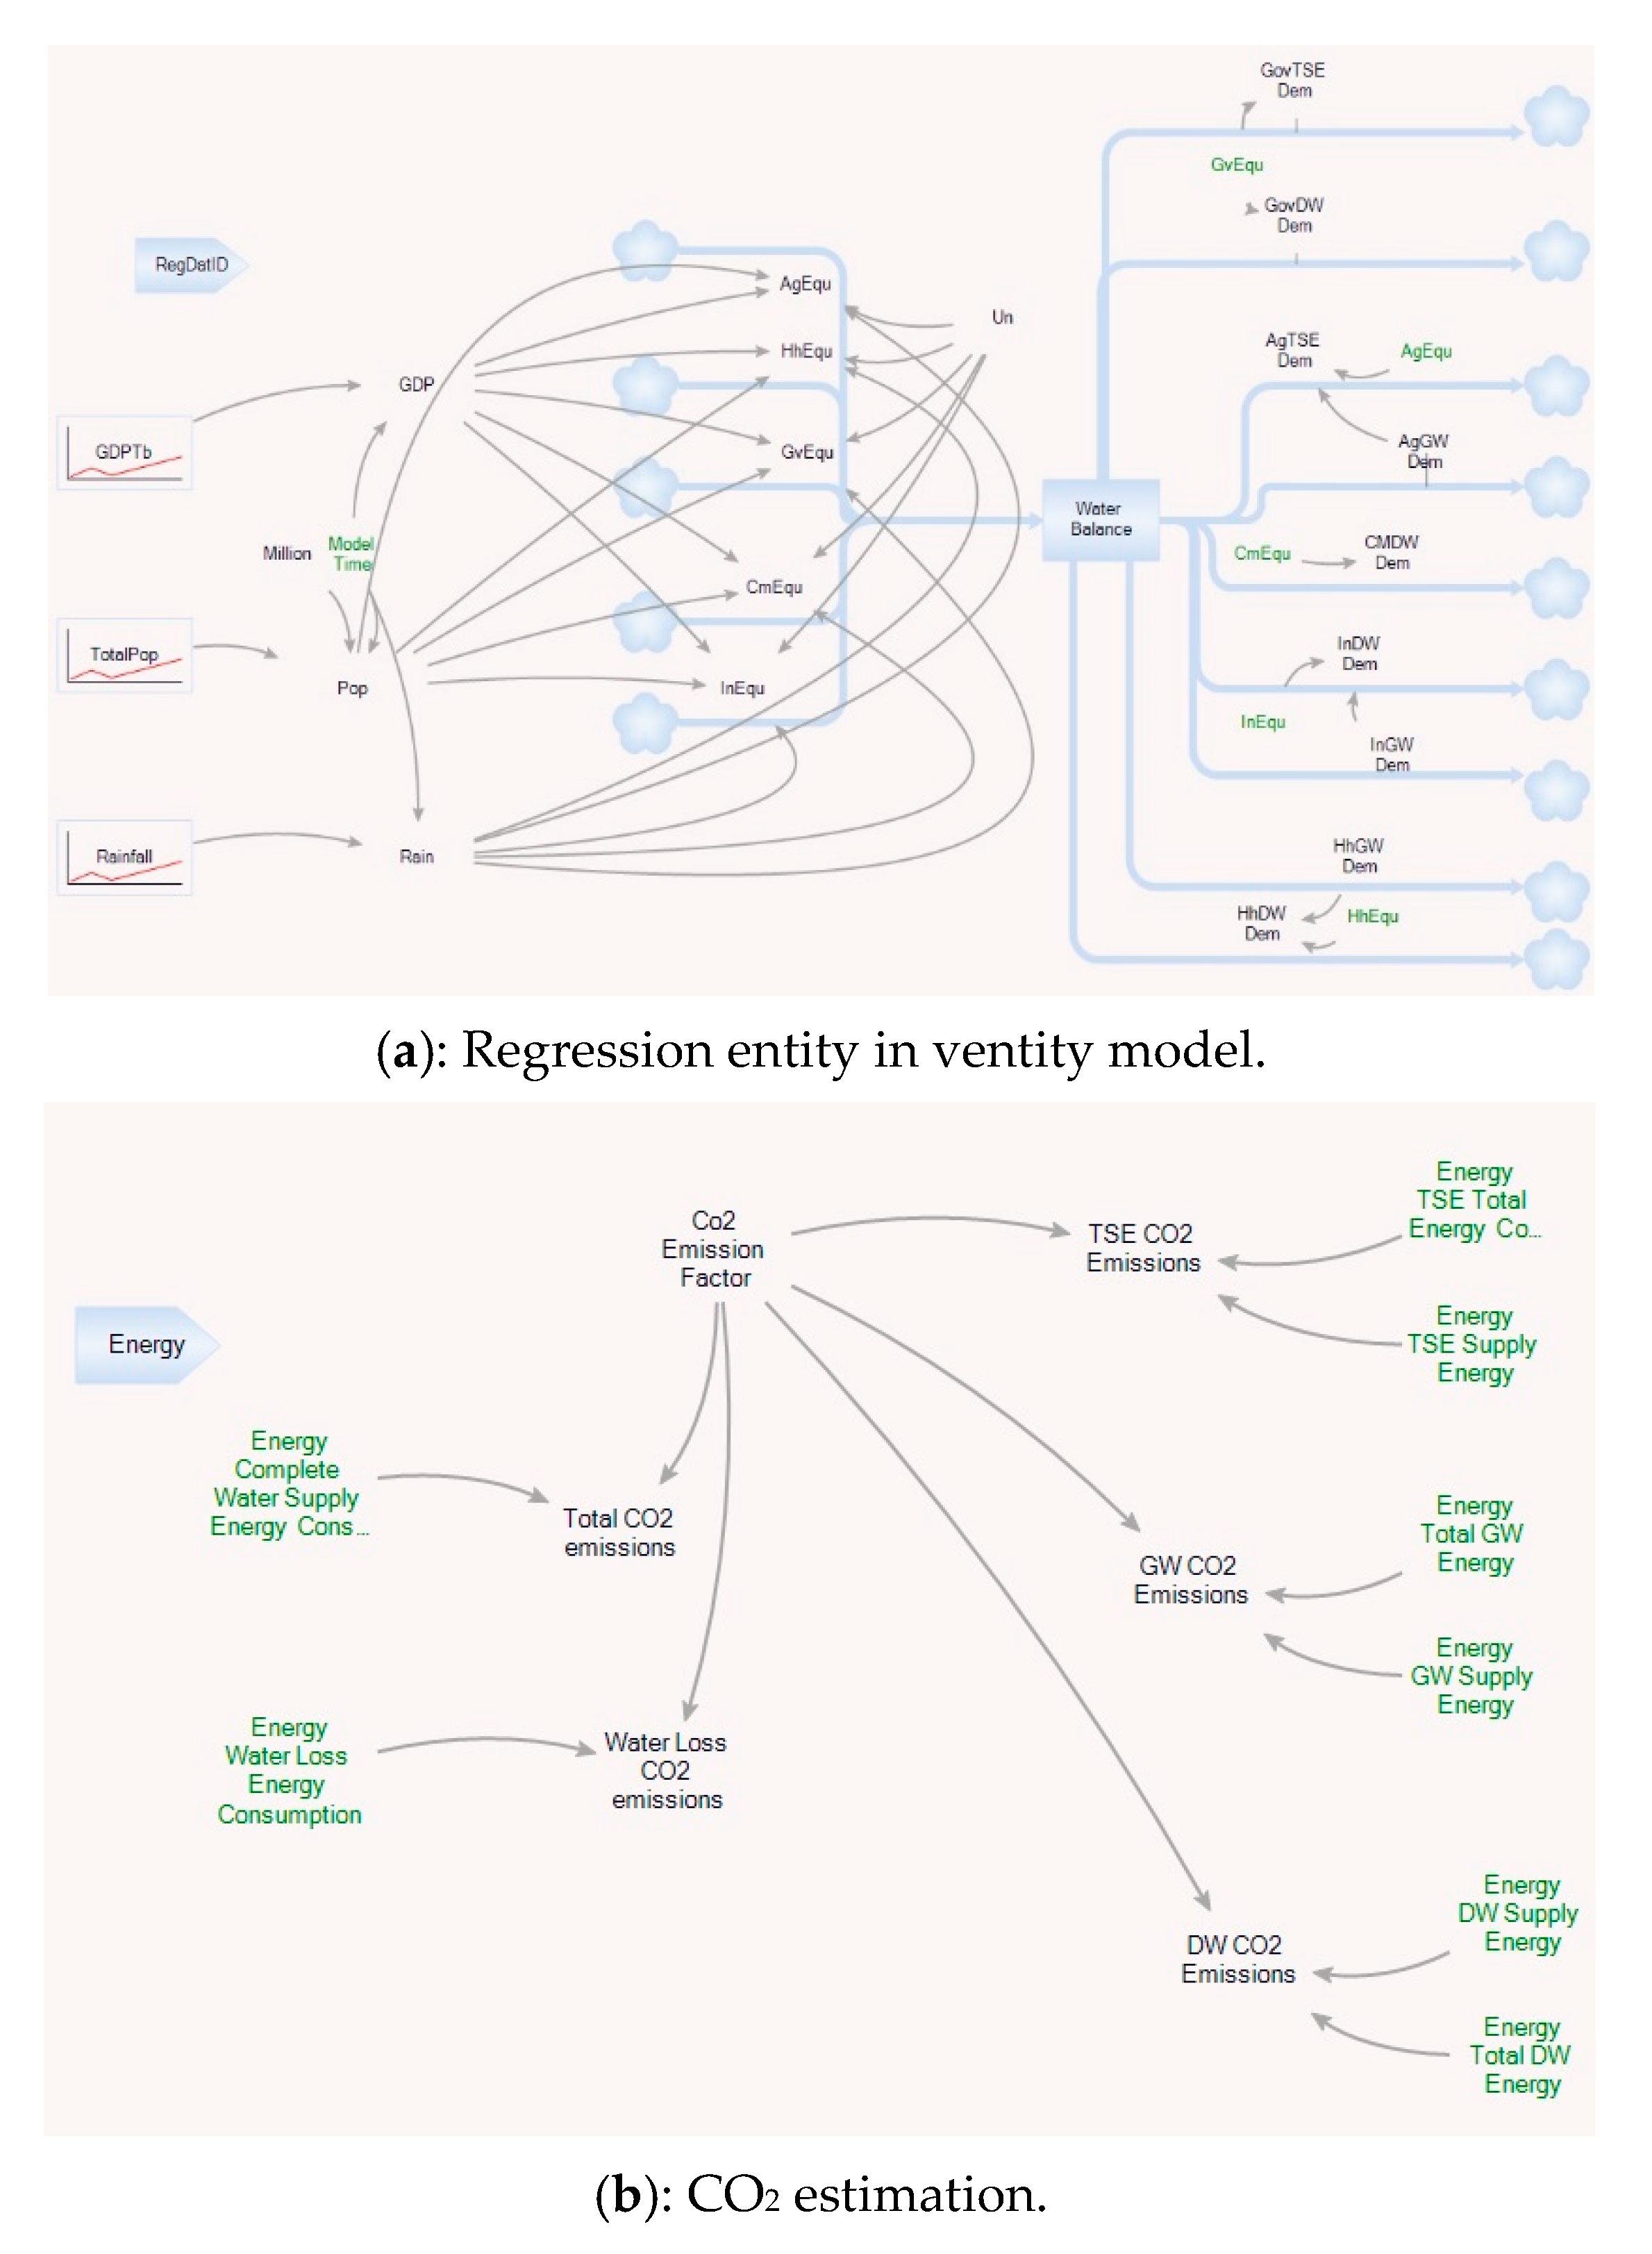
3.1. Causal Loop Diagram

With the help of simplified causal loop diagram (Figure 5) and available data, a system dynamic hypothesis for Qatar’s water system is established. For that it is vital to know that minimum quantity of water will always be a requirement regardless of the price. Despite water demand being highly influenced by price and individual income [40] and given the high per capita income as well as the social and political nature of Qatar, the energy and water network are supply-driven. This means that some of the main policies to address water scarcity in the country are structural options, in which the governments address the problem by developing more infrastructure [80] despite having high economic, ecological and environmental costs [81]. This is especially true for cities, where the water shortage is resolved through capital investments in new treatment and distribution networks [1]. Because water and electricity are both highly subsidized in Qatar, the causal loop diagram does not show a direct feedback relationship in terms of water supply and demand (as can be expected from a purely economic model). Given the circumstances, it can be reasonably assumed that a minimum amount of water is always supplied by KAHRAMAA no matter what the circumstances, as it has the capacity to do so.
Figure 5 shows the mind mapping tool of causal loop diagrams, and presents the simplified interaction between energy and water in Qatar. As mentioned above, the water demand of the customers is met in any case. Accordingly, the country’s water demand is predicted through population, GDP, temperature and rainfall. Increase or decrease in any of these parameters cause an increase or decrease in the water demand in the same direction, hence the positive polarity of all three towards water demand variables. This positive causation can be seen throughout the CLD as more water demand means more desalination, which leads to greater energy use in the desalination process. Water demand directly and indirectly (through desalination) also leads to an increase in energy consumption through the use of pumping, as extra head is needed to supply greater amounts of water throughout the network. An increase in pumping increases the water supply as well as the wastewater generated. The treatment for this wastewater requires energy as well as pumping to move wastewater and treated wastewater to specific sinks or reuse purposes. Because the pressure of the system is high, there are water losses through leakage, along with wasted water because of its inefficient use, and because the water inherently carries with it the energy required to produce and distribute it, the energy burden on the system increases. The country’s water policies as seen through the green lines, reduce the technical inefficiencies and encourage better environmental practices which lead to reduced water demand and lower energy consumption because of subsequent efficient technological and management developments. However, it is to be noted that the green linkage relations in the diagram have a delay mark, which suggest that policies take time to be effective. It also worth mentioning that despite being a supply-driven system, demand side policies are effective in reducing water consumption. Low flow or aerated faucets and low volume flush tanks in toilets can reduce water consumption. Additionally, smart water meters can reduce water usage through higher consumption awareness.
With the help of the water balance flow chart (Figure 2) and the simplified causal loop diagram (Figure 5) a detailed causal loop diagram (Appendix A Figure A1) is developed to guide the work in the stock and flow diagram. Appendix A Figure A1 gives us a detailed look at only the supply and demand workings of the water system (energy excluding). As can be seen in the figure, the dotted lines represent information flows, factors that affect various water variables such as the expected water demand or the total pumping required in the system. The detailed mind map also presents the skewed nature of Qatar’s water system. While there is a lot of feedback in the supply side of the figure, the demand side is more linear in nature, as various factors affect demand because of the underlying constraints of minimal water requirements at any time. Although this water mass balance chart does not include socio-economic factors, its combination with the detailed causal loop diagram eases the establishment of the stock and flow diagram developed in the section below to assess the inherent energy inefficiencies in the water sector of Qatar.

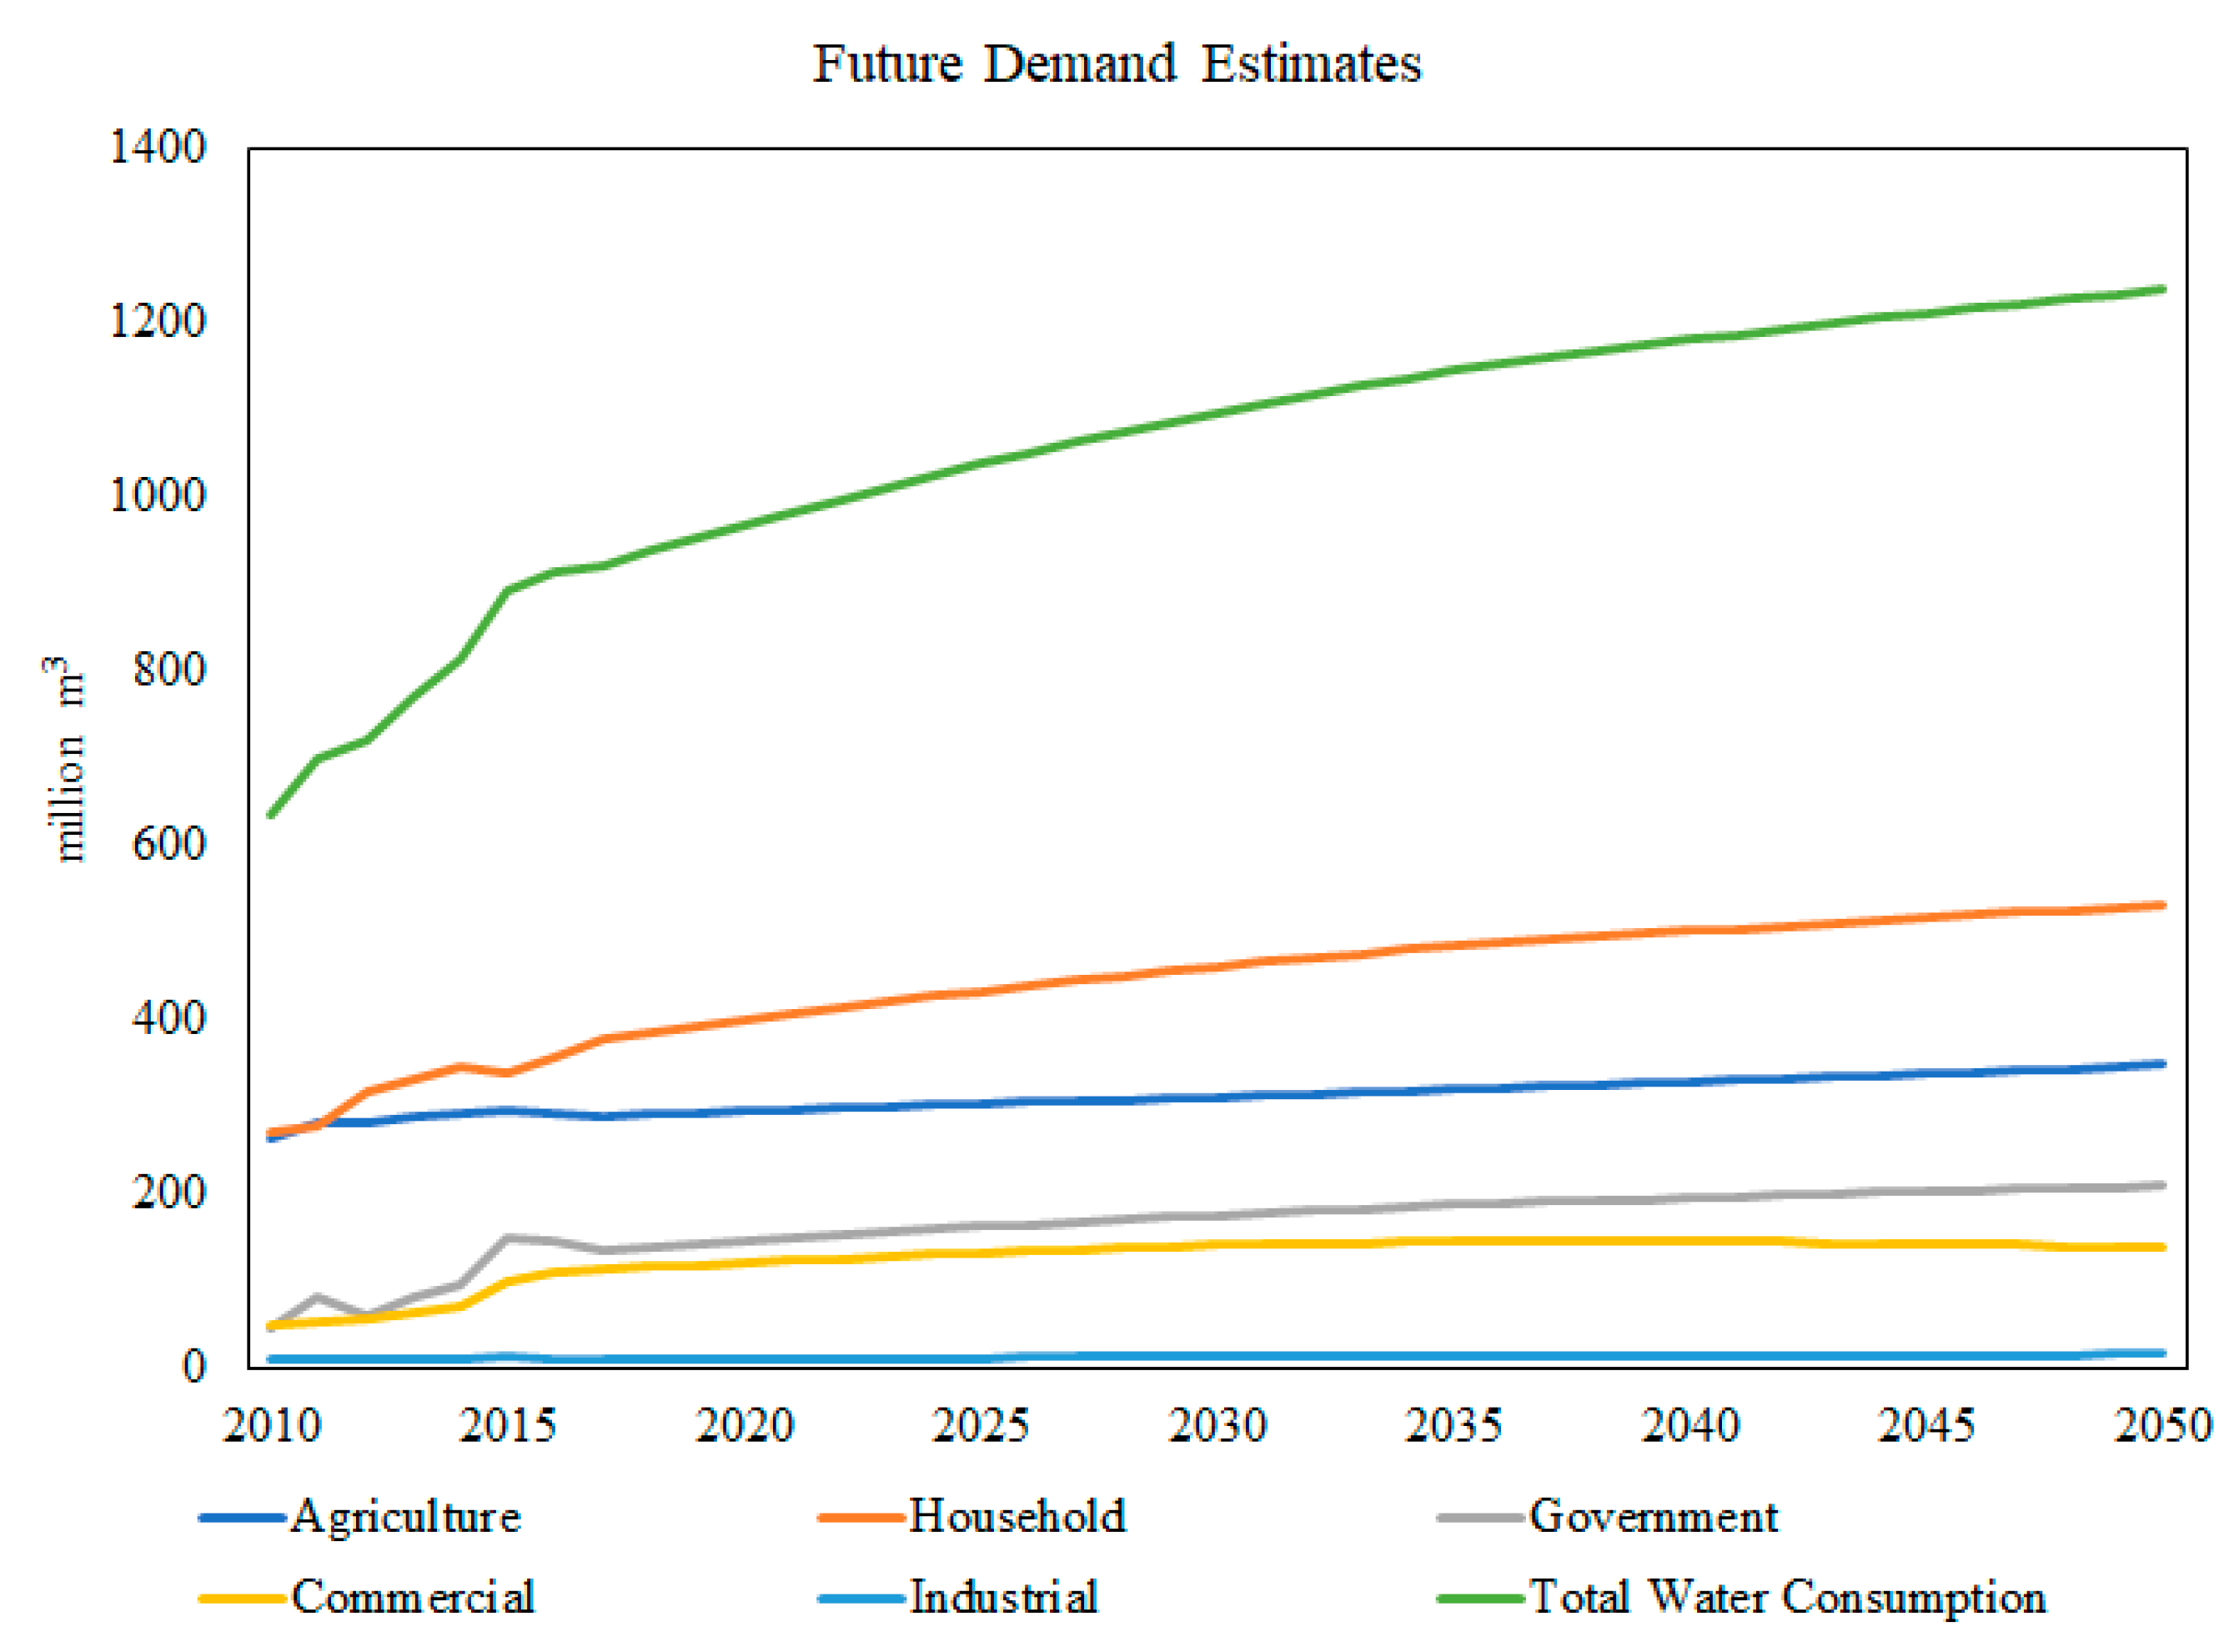
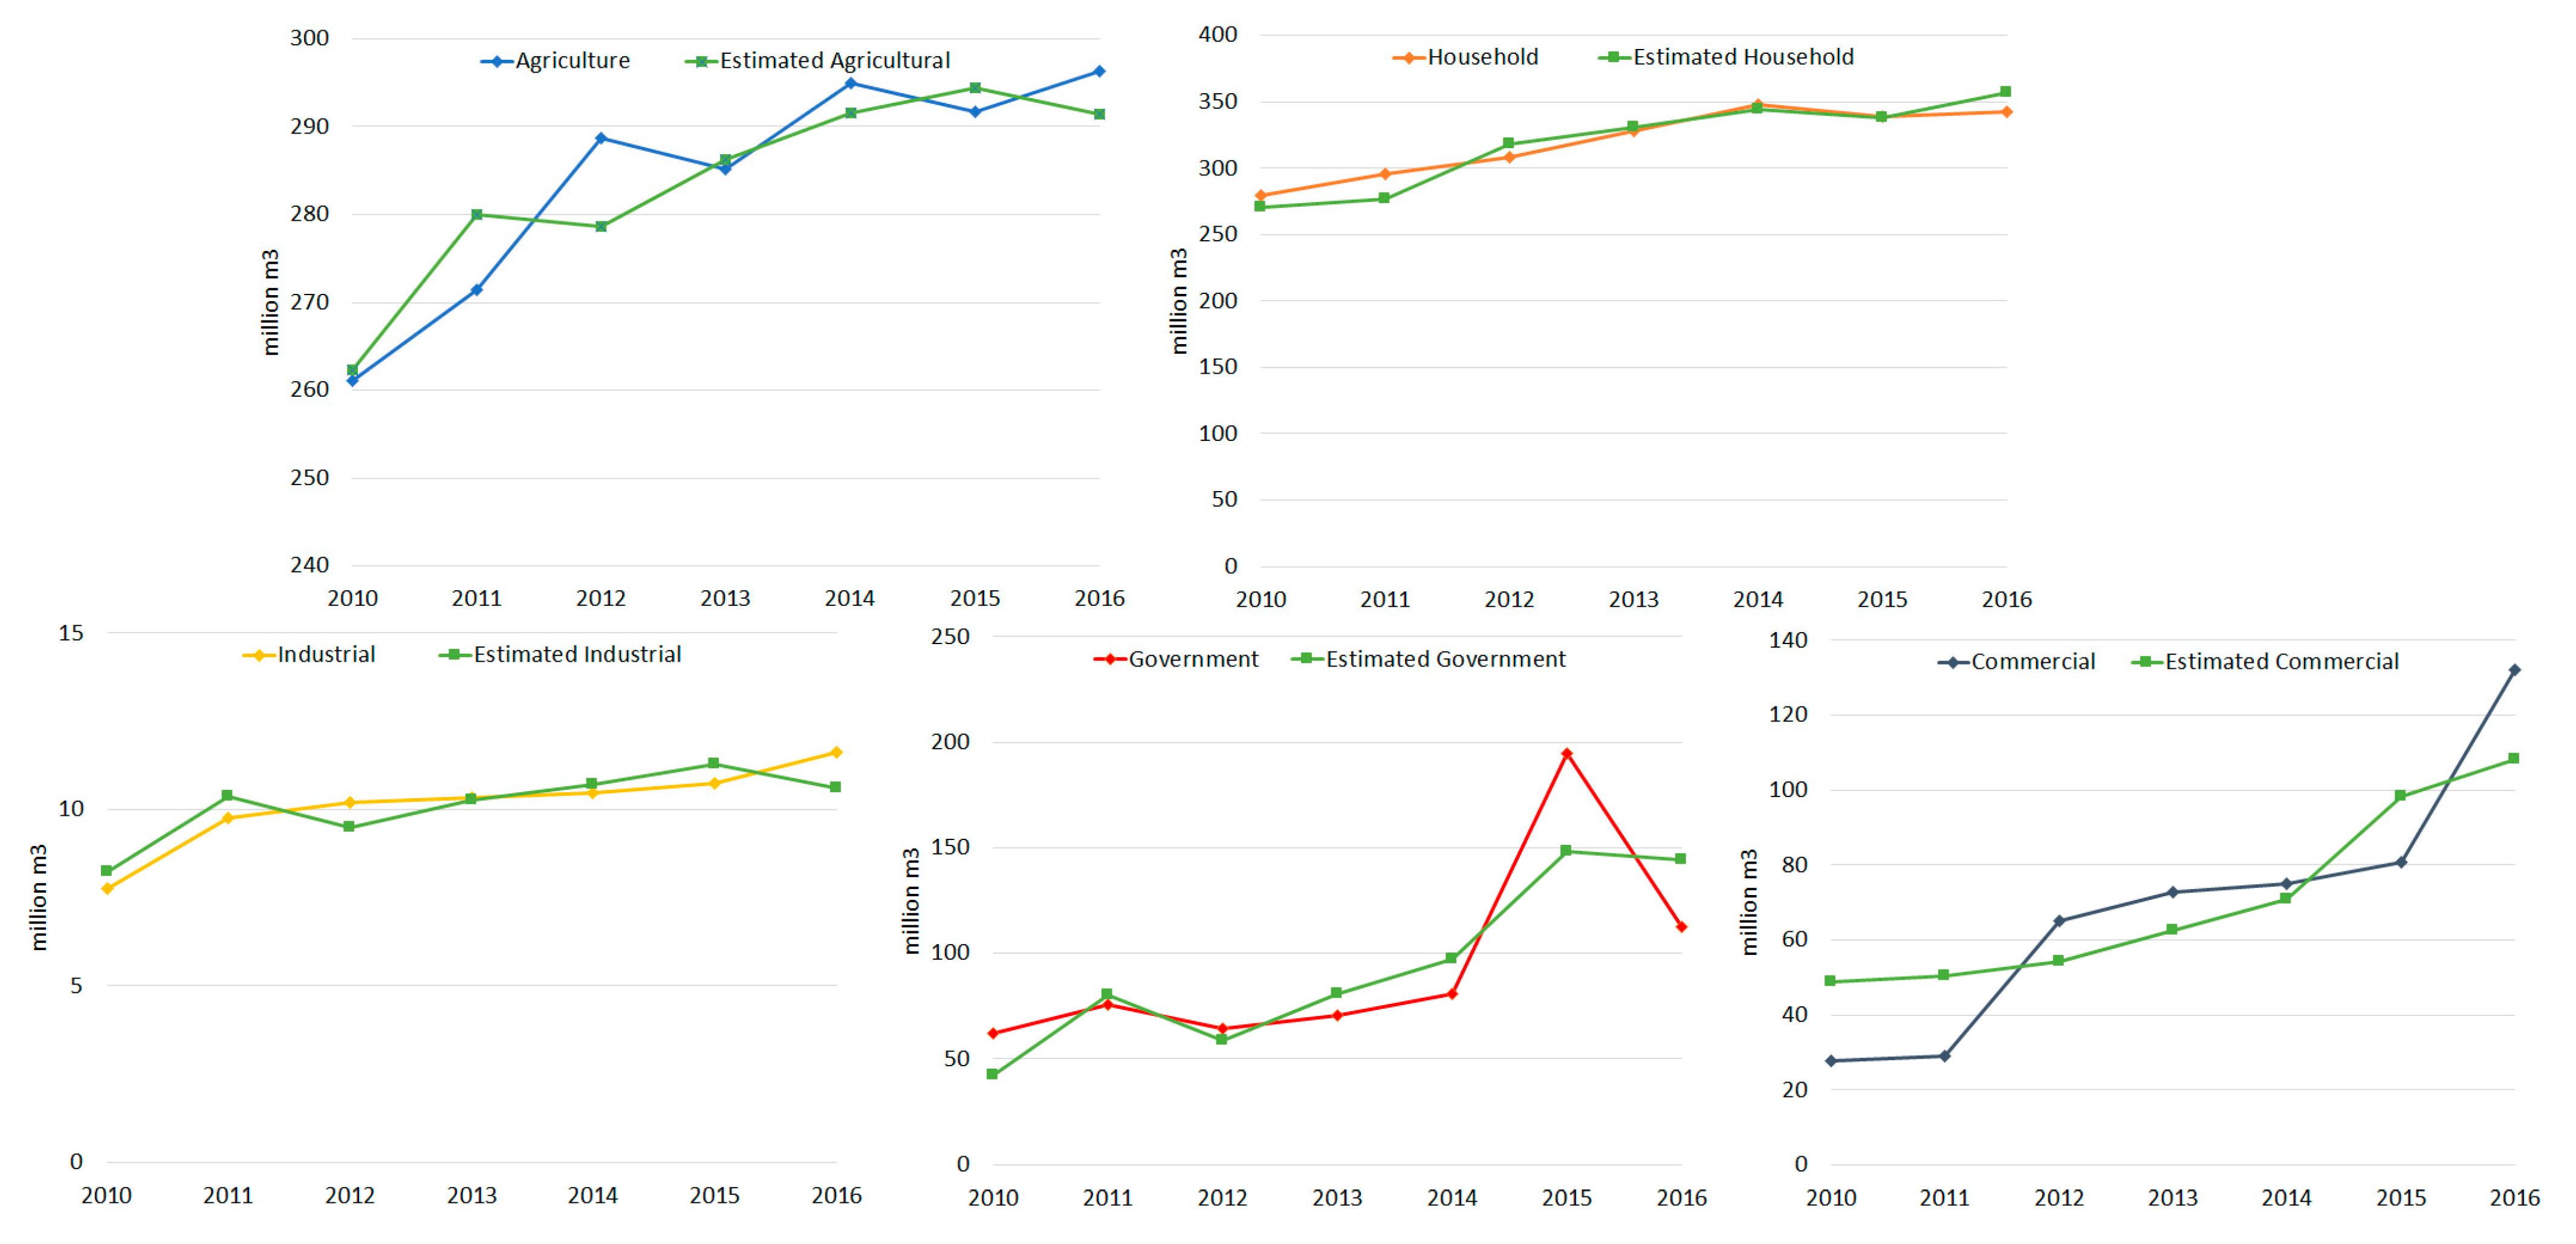
3.2. Water Demand Estimation

With the help of data presented in Appendix A Table A1, the future water demand estimate of Qatar is estimated through the regression equations shown in Table 3. The coefficients of the regression equation are based on running linear regression of water demand in each sector against population data (in millions), GDP data (in billions) and the amount of rainfall (in mm) as shown in Figure A5 in Appendix A. As mentioned in our hypothesis in the causal loop diagram, the water demand for each sector is predicted by population, GDP, temperature and rainfall. However, because the model being developed is going to be used for estimating long-term water demand and policy impacts (and not monthly variation) until the year 2050, and because the water demand variations stay relatively stable throughout the entire year, the temperature variable has been dropped. It is important to note that the purpose of running the regression is the accurate prediction and estimation of water demand, and not the causal relationship between the demand and predictor variables. Furthermore, for future estimation of water and energy demand the following deliberations are considered for the business-as-usual (BAU) case.
  • Qatar has seen its GDP growth rate stabilize between 2 and 5 percent recently, which is likely to stay between 2% and 3% in the near future [82]. Thus, in our estimation we have assumed that Qatar’s GDP growth rate after 2016 is likely to stabilize at 2.5%.
  • The future precipitation estimate after 2016 were kept consistent at 76 mm/year, which is the average of rainfall between 1962–2017 [75].
  • Future population estimates were used from World Bank as applied in Kamal et al. [83,84].
  • Wastewater treatment is at 17.2% for tertiary treated water and 82.8% for tertiary treatment with nitrogen and phosphorus removal.
  • System losses limited to the desalinated water distribution network are consistent at 4%.
  • Desalination technology in Qatar is divided as MSF: 70%, MED: 12.10%, RO: 17.90% which includes the new Umm Al Houl plant that has both RO and MSF technologies [54,85].
  • The total groundwater abstracted is restricted to 250 million m3/year as can be seen in Figure 4 and past historical data as the resource is limited.
  • The energy estimate for treated wastewater (collection and treatment) are only calculated for the amount that is being reused in different sectors and does not cover the entire collection and treatment cost of water that is pumped into aquifers, lagoons or the sea.
The future demand estimates for each sector can be seen in Figure 6. With the help of the regression equations the total water demand is estimated until the year 2050, with Figure 7 showing the whole system validation of the demand estimation between 2010 and 2016, with the maximum deviations occurring at less than 3% in the year 2015. Details of validation for each sector can be seen in Appendix A Figure A2. As can be seen in Appendix A Figure A3, the water balance approach is applied with the help of stock and flow diagrams to estimate the amount and type (desalinated water, groundwater or treated wastewater) of water required in the network. Detailed equations for the stock and flow related to the water balance approach can be seen in Appendix A, Table A2.
Furthermore, with the help of the estimated water supply, the energy consumption as well as the CO2 emission are estimated using the equations in Table 4. The equations in Table 4 are developed taking into account the equivalent electrical energy which enables us to compare different technologies on a similar unit basis (that is kWh m 3 ) . Detailed development and mathematical formulation of how these values are achieved and used for comparison between different technologies can be seen in [73,86]. Because these values are specifically developed for Qatar’s water sector, it is also reasonably straightforward to calculate CO2 consumption by using the CO2 emission factor mentioned in Table 4 as natural gas input energy values are already incorporated in the calculations.
The following what if scenarios to address Qatar’s three pillars of the water security challenges (Table 1) are implemented at the start of 2016 in the model. The Sc1, Sc2 and Sc3 scenarios as described below are established to assess the impact each has on the water and energy consumption as well as the CO2 emissions in Qatar.
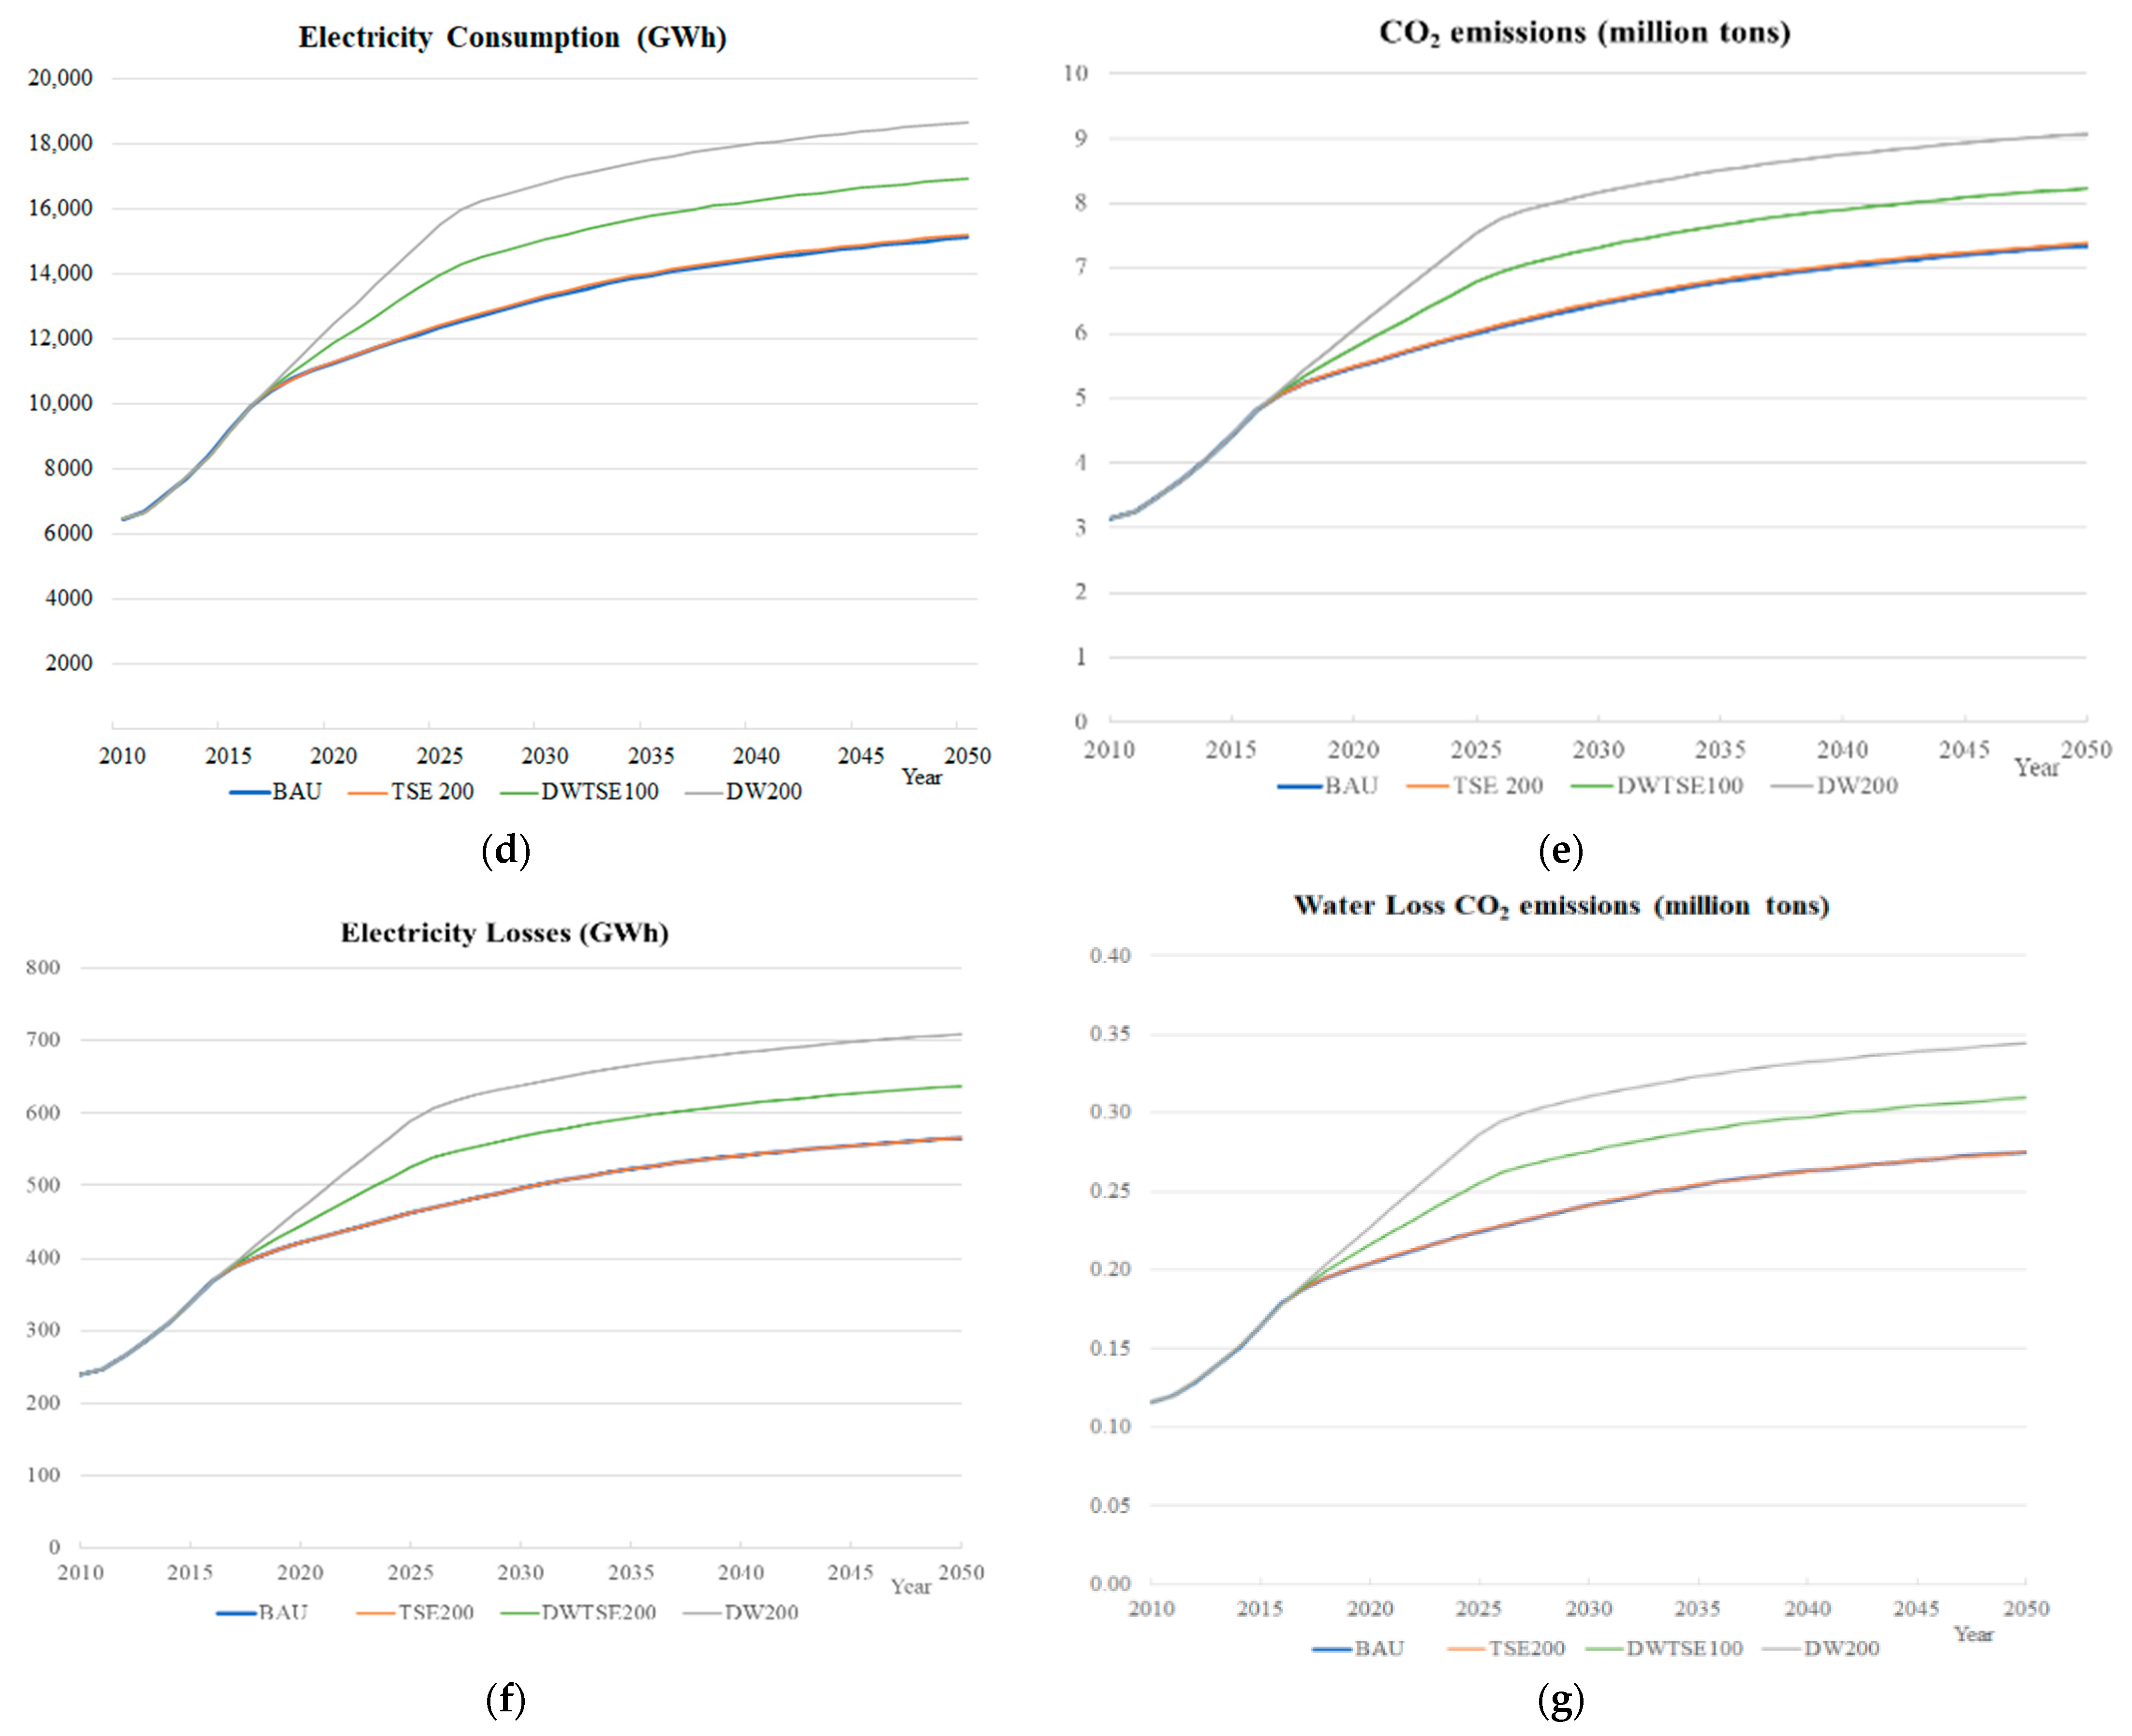
  • Sc1: Water limitation policy implemented which enforces groundwater abstraction to only 50 million m3 maximum by the year 2025. The demand created because of this reduction in groundwater extraction is met through TSE or desalinated water or an equal combination of both. This policy implements the “Groundwater Aquifer Recharge” goal, the objective of which is to elevate the groundwater table to the 1980 levels. TSE-200 is the scenario where the entire supplemental demand is met through treated wastewater. DW200 is the scenario where the substitute water is entirely met through Qatar’s traditional desalinated water and DWTSE100 is the case where the groundwater is substituted equivalently through desalination and treated wastewater.
  • Sc2: Reduction of water consumption by 10% in the household, industry and commercial sector separately and combined by 2050. The policy implements Qatar National Vision 2030’s environmental management and reduced energy consumption.
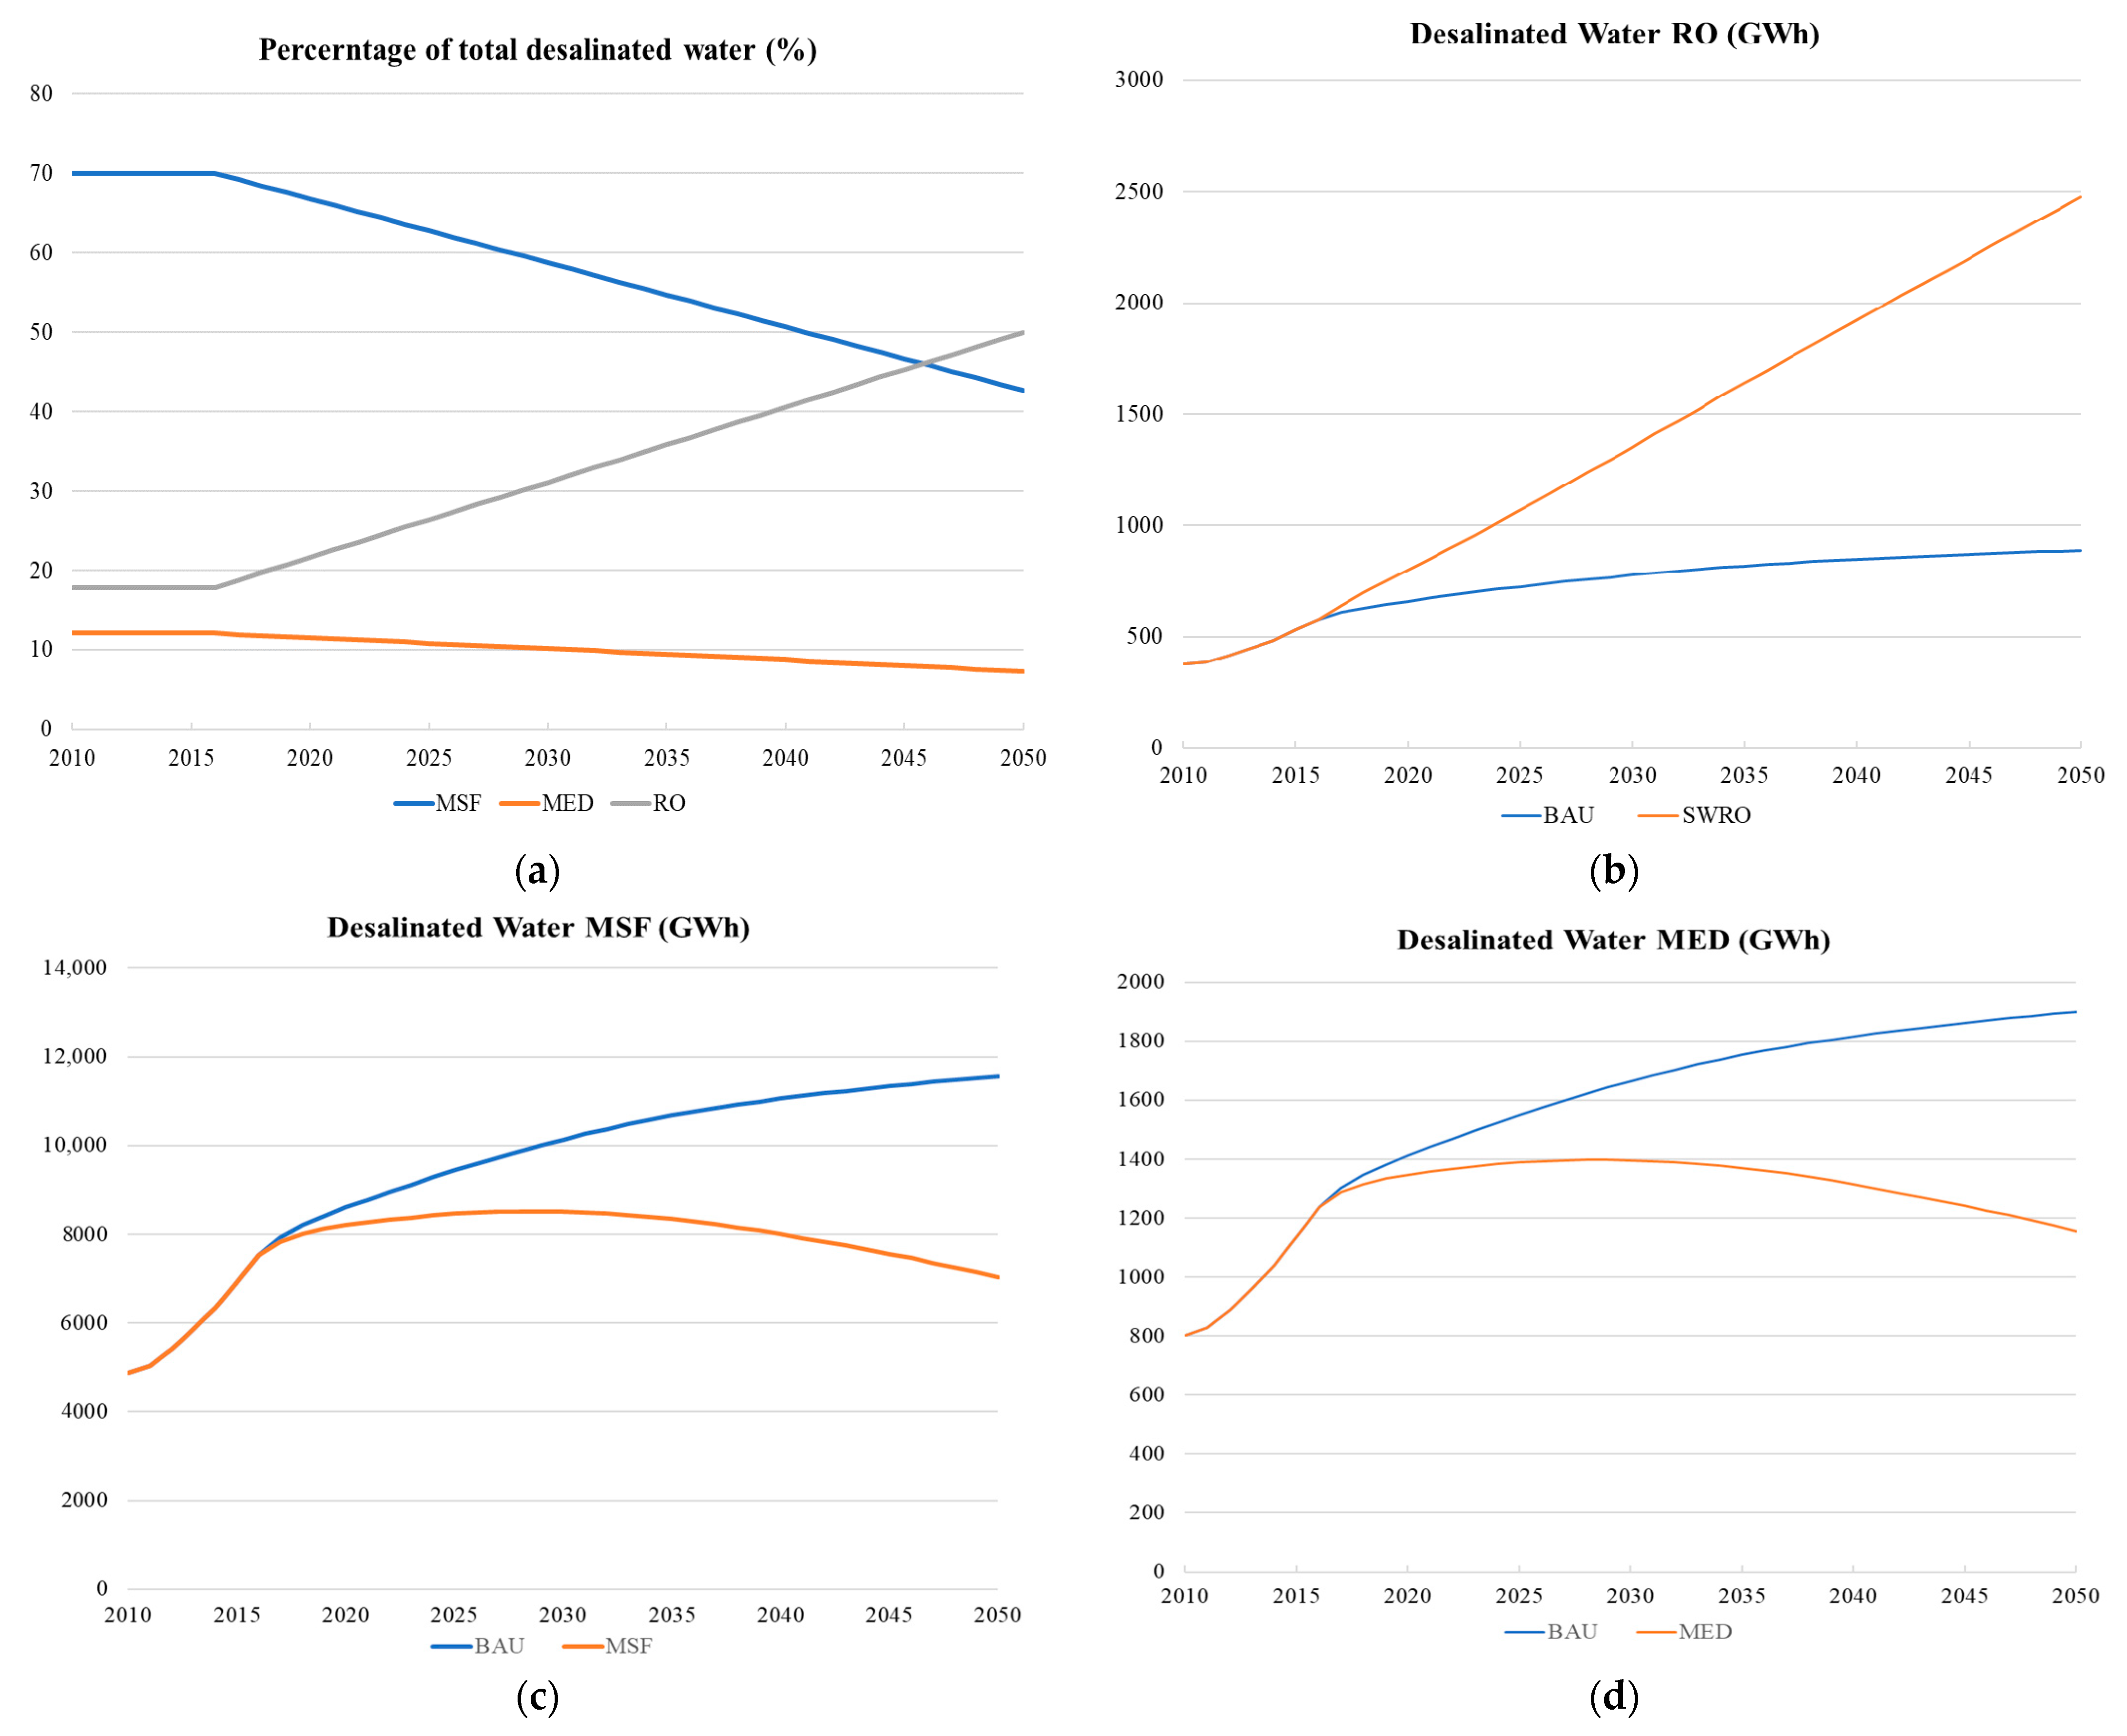
  • Sc3: Gradual increase in share of RO-produced desalinated water to 50% of total desalinated water by 2050. This policy implements the objective of reducing desalination energy consumption, through alternate technologies such as RO.

4. Results and Discussion

The scenarios above were implemented gradually after 2016, as this is the case in water and electricity networks as efficiency measures are taken step-by-step. Figure 8a–c show the implementation of moving away from groundwater use (policy Sc1), with a decrease in groundwater volume to 50 million m3 and the resulting increase in treated wastewater and desalination use. In the TSE-200 case groundwater is supplanted by treated wastewater; in DW200 groundwater is replaced with desalinated water and in the DWTSE100 case, groundwater is equally replaced with treated and desalinated water. In the TSE-200 case, the total treated wastewater required more than doubles (Figure 8b), but the total energy consumption and CO2 emissions rise by only 73.686 GWh (or 0.49%) and 36,000 tons respectively by 2050 (Figure 8d,e). This is considerably less than the DW-200 and DWTSE100 case where energy consumption increased by 3545.4 GWh (or 23.4%) and 1.72 million tons CO2, and 1809.5 GWh (or 11.9%) and 880,000 tons CO2, respectively. Furthermore, the increase in desalinated water meant that there was an increase in the losses during the distribution of the extra water which resulted in electricity lost to the water system accompanied by the resulting CO2 emissions.
The Sc2 policy scenario implements the reduction of water consumption by 10% in household (H10 scenario), commercial (C10 scenario) and industrial sector (I10) individually (Figure 9a) and then combined (ICH10 scenario). HBAU is the business-as-usual household consumption, where H10 represents the reduced consumption; CBAU is the commercial business-as-usual scenario, where C10 is the reduced consumption; similarly, IBAU is the industrial business-as-usual scenario and I10 is the savings; and finally, ICH10 represents the combined savings for all sectors. As can be seen in Figure 9a, there is a high reduction in the water use in terms of volume in the household sector because of its extra consumption. The results show a saving of up to 53 million m3 of water in the year 2050 in the household sector, with 13.7 and 1.47 million m3 saved in the commercial and industrial sectors, respectively. The lower savings in the industrial sector only leads to a reduction of energy use by 26 GWh (13,000 tons CO2) compared with the 948 GWh (461,000 tons CO2) savings in the household sector. As expected, the highest savings comes when all efficiency measures (of 10%) are implemented in the three sectors (Figure 9b,c), with a combined saving of 1222 GWh (594,000 tons CO2).
The Sc3 policy scenario implements the desalination strategies of the water security grand challenge, with a move away from thermal-driven desalination technologies towards membrane-type technologies, which includes the RO. Figure 10a shows the move in terms of percentage of total desalinated water distributed depending on the type of technology being used, with RO technology reaching 50% of total volume by the year 2050, with MSF reducing to 42.6% (in 2050) from 70% (in 2016) and MED reducing from 12.1% (in 2016) to 7.4% (in 2050). The increase in RO desalinated water results in an increase in the total energy consumed for the technology by 1590 GWh of electricity (Figure 10b), but the energy is subsequently reduced by 4520.5 GWh in the MSF (Figure 10c) process and 742 GWh in the MED process (Figure 10d). This change in desalination policy leads to a reduction of 3672 GWh (1.8 million tons CO2) of energy.
The three policy scenarios implemented above provide a unique insight into the working of the water supply system in the state of Qatar. Policy scenarios Sc1 and Sc3 do not require a change in the volume consumption of the system. However, there is a change in terms of how that volume of water is generated. In the case of scenario 1 where groundwater was replaced with treated or desalinated water, even the most efficient policy resulted in a slight increase in the energy consumption compared to the baseline scenario. However, this policy indirectly increases the resiliency of the country as the groundwater extraction levels are lowered to the renewal rates, instead of being five times higher (in the BAU case). The Sc3 scenario, which altered the type and percentage of water generated through the desalination process, was the most efficient in terms of energy and emissions savings, even compared to the Sc2 scenario where there is a reduction in water consumption volume by more than 68 million m3 of water.

Policy Suggestions

The geographic, climatic and demographic uniqueness of the region entails the use of desalination technology as a main source of potable water. Nonetheless, the governments can take steps to encourage sustainable and balanced use of the precious resources. With the help of our qualitative and quantitative model, several policy suggestions are recommended and are as follows:
  • To increase resiliency of the groundwater aquifers in Qatar, treated wastewater can be used. Because the underlying energy used in wastewater treatment is natural gas (through electricity produced from natural gas), total energy consumption and CO2 emissions rise by only 0.5% compared to BAU scenario in which groundwater is abstracted without restrictions.
  • Move towards membrane technology as the type of desalination can reduce the energy burden by almost 3672 GWh.
  • The increase in water-use efficiency of household, commercial and industrial sector and the consequent reduction in energy use and CO2 emissions mean that information and education campaigns are vital.
  • The water loss through the water system went from very high to a low of 4%. However, careful consideration must be taken to further decrease the water losses, as the money injected into reducing losses are likely to have diminishing returns.
  • Further improvements can be achieved through more efficient energy management, reduction of consumption, reduction of water losses, optimization of transportation and optimization of the entire water treatment process.

5. Conclusions and Future Work

An updated and comprehensive water system framework is developed with the help of flow chart and causal loop diagrams to give a holistic view and a qualitative assessment of the water system in the state of Qatar. Using population, GDP and rainfall data regression equations are developed to estimate the future water consumption of agriculture, industry, government, household and commercial sectors in the country till the year 2050. This estimation led to approximating the future water supply in the system. Additionally, stock and flow diagrams are utilized to assess the quantitative nature of the water system and its impacts on energy (electricity) consumption and CO2 emissions. Three different water policy measures which include, limiting of groundwater abstraction to only 50 million m3, reduction of water consumption in household, commercial and industrial sector by 10%, and gradual increase in share of RO produced desalinated water to 50% are applied to the system. While the results show a decrease in overall energy consumption or increase in the resiliency of the system, several limitations prevented an even greater detailed evaluation of the water system, including the TSE network. The limitations of the research are as follows:
  • Because of data constraint a complete water balance model is difficult to establish. For example, the data do not show how much wastewater is generated from each sector of the economy or what type of treated wastewater (tertiary or tertiary with N and P removal) is reused in which sector. Furthermore, while the demand estimate using regression equation is accurate for the available data, long-term prediction may change (this has been somewhat resolved by running a sensitivity analysis shown in Figure A3 in Appendix A).
  • As seen in the regression equations some of the variable coefficients are opposite to what we would have expected, such as the negative GDP. One reason for this is the relatively high multicollinearity in the dataset (Table A3), but it is important to note that the correlations are positive. Another likely cause of the erratic behavior is an omitted variable. However, due to the limited availability of data as well as the high validity of our system dynamics model, we argue that the regression equations are representative of a good prediction model.
  • The energy consumption estimated is limited to the water that is being used. Energy consumed during collection and treatment of wastewater that is injected into aquifers, sea and lagoons is not incorporated in the total estimated consumption because of unavailable data.
  • The energy costs of the techniques discussed are static over time.
  • The system dynamic methodology does not incorporate the detailed engineering and energy design of various desalination technologies being used. Furthermore, statistical techniques have been used to compensate for the lack of dynamic interaction between components of the water system, such as the increase in water capacity of underwater aquifers because of rain and sea-water intrusion as well as the impact of water leakage throughout the system.
Future work can be done on establishing the complete water balance of the network including the intricacies of the TSE. Furthermore, instead of using estimated population metrics from the World Bank, a detailed population system dynamic model can be established. Additional sub-models can be added to determine the number of facilities and infrastructure required, to strengthen the resiliency of the water and energy network in the country. In addition to all of these measures, the work and methodology is designed to be incorporated with the previous work undertaken in Kamal et al. (2019) and Kamal et al. (2020) which discuss the efficiency potential in the building and transportation sector. A more intricate, elaborate and interactive energy model will be developed to understand the complexities of the energy sector, which will enable us to understand the trade-offs and synergies between different sectors of the economy.

Author Contributions

Conceptualization, A.K., S.G.A.-G. and M.K.; methodology, A.K.; software, A.K.; validation, A.K.; formal analysis, A.K.; investigation, A.K., S.G.A.-G. and M.K.; resources, A.K. and M.K.; data curation, A.K.; writing—original draft preparation, A.K.; writing—review and editing, S.G.A.-G. and M.K.; visualization, A.K.; supervision, S.G.A.-G. and M.K.; project administration, S.G.A.-G. and M.K.; funding acquisition, S.G.A.-G. All authors have read and agreed to the published version of the manuscript.

Funding

This research was supported by a scholarship from Hamad Bin Khalifa University (HBKU) a member of Qatar Foundation (QF). Any opinions, findings, and conclusions or recommendations expressed in this material are those of the author(s) and do not necessarily reflect the views of the HBKU or QF.

Institutional Review Board Statement

Not applicable.

Informed Consent Statement

Not applicable.

Data Availability Statement

Most of the data used in this study is present in the tables and figures of this paper. Additional data is available on requestion from the corresponding authors.

Conflicts of Interest

The authors declare no conflict of interest.

Appendix A

Table A1. Data used in regression. Reproduced from [63,74,75,88,89], Planning and Statistics Authority: 2017, 2018, 2019, World Bank 2018, IMF 2019.
YearAgriculture (Million m3)Household (Million m3)Government (Million m3)Commercial (Million m3)Industry (Million m3)Population (Million)GDP
(Billion USD)
Average Rainfall (mm)
2006257.69141.118.3924.68.31.01038260.8821484.9
2007254.05153.1626.2324.89.61.18963379.7120984.9
2008248.15189.2938.7726.28.781.389342115.270142.9
2009248.89256.5745.0730.97.361.5907897.7983568.6
2010261.16279.3962.3327.97.761.779676125.122333.1
2011271.45295.5675.6829.19.761.952054167.775370.5
2012288.76308.6864.4265.210.22.109568186.833523.9
2013285.23327.9270.5772.710.322.250473198.727841.6
2014294.92347.5980.8574.9710.482.374419206.224752.4
2015291.7338.91194.7680.6510.752.481539161.7398115.4
2016296.29342.05112.55132.2511.622.569804151.7321101.1
Table A2. Stock and flow diagram equations (the Desalinated Water (DW), Treated Sewage Effluent (TSE) and Ground Water (GW) volume are flows represented as stocks to ease the calculations related to energy estimation. (Yr is a constant 1 with units of 1/year.).
ElementElement TypeExpressionUnits
Complete Water Supply Energy ConsumptionAuxiliaryTotal DIS En Cons + Total DW Energy + Total GW Energy + TSE Total Energy ConsGWh
DISTRIBUTION Energy FactorAuxiliary0.44GWh/M m3
DW Supply EnergyAuxiliaryDISTRIBUTION Energy Factor × DW VolumeGWh
DWMED Energy FactorAuxiliary19GWh/M m3
DWMSF Energy FactorAuxiliary20GWh/M m3
DWSWRO Energy FactorAuxiliary6GWh/M m3
GW Energy FactorAuxiliary0.36GWh/M m3
GW Supply EnergyAuxiliaryDISTRIBUTION Energy Factor × GW VolumeGWh
MED En ConsAuxiliaryDW Volume × MED Percentage × DWMED Energy FactorGWh
MED PercentageAuxiliary0.121Dmnl
MSF En ConsAuxiliaryDW Volume × MSF Percentage × DWMSF Energy FactorGWh
MSF PercentageAuxiliary0.70Dmnl
SWRO En ConsAuxiliaryDW Volume × SWRO Percentage × DWSWRO Energy FactorGWh
SWRO PercentageAuxiliary0.179Dmnl
Ter Energy ConsAuxiliaryTSE Volume × Ter Percentage × Ter Energy FactorGWh
Ter Energy FactorAuxiliary0.44GWh/M m3
Ter PercentageAuxiliary0.172Dmnl
TerNP Energy ConsAuxiliaryTSE Volume × TerNP Energy Factor × TerNP PercentageGWh
TerNP Energy FactorAuxiliary0.74GWh/M m3
TerNP PercentageAuxiliary0.828Dmnl
Total DIS En ConsAuxiliaryWater Supplied × DISTRIBUTION Energy FactorGWh
Total DW EnergyAuxiliaryMSF En Cons + MED En Cons + SWRO En ConsGWh
Total GW EnergyAuxiliaryGW Volume × GW Energy FactorGWh
TSE Supply EnergyAuxiliaryDISTRIBUTION Energy Factor × TSE VolumeGWh
TSE Total Energy ConsAuxiliaryTer Energy Cons + TerNP Energy Cons + WWC EnergyGWh
Water DemandAuxiliaryGW Dem + TSE Dem + DW DemM m3/Year
Water Loss Energy ConsumptionAuxiliary(Water Loss Volume × DISTRIBUTION Energy Factor) + (Water Loss Volume × DWMSF Energy Factor × MSF Percentage) + (Water Loss Volume × DWMED Energy Factor × MED Percentage) + (Water Loss Volume × DWSWRO Energy Factor × SWRO Percentage)GWh
Water Loss PercentageAuxiliary0.04Dmnl
Water SuppliedAuxiliaryGW Volume + TSE Volume+DW VolumeM m3
WWC EnergyAuxiliaryTSE Volume × WWC FactorGWh
WWC FactorAuxiliary0.04GWh/M m3
DW VolumeStock349.014M m3
DW DemFlowRegData. CMDW Dem + RegData. InDW Dem + RegData. HhDW Dem + RegData. GovDW DemM m3/Year
GWDWFlow0.40 × GW Volume × YrM m3/Year
Water LossFlow(Water Loss Percentage × DW Dem) + (Water Loss Percentage × GWDW)M m3/Year
DW SupplyFlowDW Volume × YrM m3/Year
GW VolumeStock50.02M m3
GW DemFlowRegData. InGW Dem + RegData.AgGW Dem + RegData. HhGW DemM m3/Year
GW SupplyFlow0.2 × GW Volume × YrM m3/Year
GWDWFlow0.40 × GW Volume × YrM m3/Year
GWTSEFlow0.40 × GW Volume × YrM m3/Year
TSE VolumeStock47.649M m3
GWTSEFlow0.40 × GW Volume × YrM m3/Year
TSE DemFlowRegData. GovTSE Dem + RegData. AgTSE DemM m3/Year
TSE SupplyFlowTSE Volume × YrM m3/Year
Water Loss VolumeStock13.424M m3
Exp Wat LossFlowWater LossM m3/Year
Ac Water LossFlowWater Loss Volume × YrM m3/Year
Sum DW VolumeAggregateSumM m3
Sum GW VolumeAggregateSumM m3
GDPAuxiliaryGDPTb (Model. Time)Dmnl
MillionAuxiliary1,000,000Million
PopAuxiliaryTotalPop (Model. Time)/MillionDmnl
RainAuxiliaryRainfall (Model. Time)Dmnl
AgEquFlow(203.3090 + 15.7276 × Pop + 0.2049 × GDP + 0.1646 × Rain) × UnM m3/Year
CmEquFlow(−55.89256 + 81.96694 × Pop − 0.34341 × GDP + 0.05626 × Rain) × UnM m3/Year
GvEquFlow(−103.39541 + 73.59845 × Pop − 0.04746 × GDP + 0.66357 × Rain) × UnM m3/year
HhEquFlow(30.57771 + 147.53605 × Pop − 0.07729 × GDP − 0.40296 × Rain) × UnM m3/Year
InEquFlow(4.63937 − 0.32591 × Pop + 0.02608 × GDP + 0.02805 × Rain) × UnM m3/Year
AgGW DemFlow230M m3/Year
AgTSE DemFlowAgEqu-AgGW DemM m3/Year
CMDW DemFlowCmEquM m3/Year
GovDW DemFlowGvEqu × 0.65M m3/Year
GovTSE DemFlowGvEqu × 0.35M m3/Year
HhDW DemFlowHhEqu-HhGW DemM m3/Year
HhGW DemFlow19.84M m3/Year
InDW DemFlowInEqu-InGW DemM m3/Year
InGW DemFlow0.18M m3/Year
Final TimeAuxiliary40Year
Initial TimeAuxiliary0Year
Time StepAuxiliary1Year
Co2 Emission FactorAuxiliary486/1,000,000MtCO2/GWh
DW CO2 EmissionsAuxiliary(Energy. DW Supply Energy + Energy. Total DW Energy) × Co2 Emission FactorMtCO2
GW CO2 EmissionsAuxiliary(Energy. Total GW Energy + Energy. GW Supply Energy) × Co2 Emission FactorMtCO2
Total CO2 emissionsAuxiliaryEnergy. Complete Water Supply Energy Consumption*Co2 Emission FactorMtCO2
TSE CO2 EmissionsAuxiliary(Energy. TSE Total Energy Cons + Energy. TSE Supply Energy) × Co2 Emission FactorMtCO2
Water Loss CO2 emissionsAuxiliaryEnergy. Water Loss Energy Consumption × Co2 Emission FactorMtCO2
Table A3. Correlation coefficients table.
VariablesAgricultureHouseholdGovernmentCommercialIndustryPopulationGDPRainfall
Agriculture1.000.840.700.860.860.910.820.13
Household0.841.000.720.730.600.970.88−0.05
Government0.700.721.000.660.620.800.520.48
Commercial0.860.730.661.000.830.850.590.30
Industry0.860.600.620.831.000.750.660.31
Population0.910.970.800.850.751.000.860.08
GDP0.820.880.520.590.660.861.00−0.31
Rainfall0.13−0.050.480.300.310.08−0.311.00
Figure A1. Complex CLD of Qatar’s water system.
Energies 14 04348 g0a1
Figure A2. Estimated water use validation for each sector.
Energies 14 04348 g0a2
Figure A3. Stock and flow diagram. (a) Regression entity in Ventity model. (b) CO2 estimation Ventity model. (c) Central entity model in estimating water flows and energy consumption in Ventity model.
Energies 14 04348 g0a3aEnergies 14 04348 g0a3b
Figure A4. Sensitivity analysis of 100,000-run univariate uniformly distributed analysis (a) Varying water loss percentage (2% to 10%) and (b) GDP varying between 100 billion to 400 billion dollars. (GWh electricity consumption).
Energies 14 04348 g0a4
Figure A5. Visualization of independent variables.
Energies 14 04348 g0a5

References

  1. Vairavamoorthy, K.; Gorantiwar, S.D.; Pathirana, A. Managing Urban Water Supplies in Developing Countries–Climate Change and Water Scarcity Scenarios. Phys. Chem. Earth Parts A/B/C 2008, 33, 330–339. [Google Scholar] [CrossRef]
  2. United Nations Global Issues-Water. Available online: https://www.un.org/en/sections/issues-depth/water/ (accessed on 23 February 2020).
  3. Wiek, A.; Larson, K.L. Water, People, and Sustainability—a Systems Framework for Analyzing and Assessing Water Governance Regimes. Water Resour. Manag. 2012, 26, 3153–3171. [Google Scholar] [CrossRef]
  4. Zarghami, S.A.; Gunawan, I.; Schultmann, F. Integrating Entropy Theory and Cospanning Tree Technique for Redundancy Analysis of Water Distribution Networks. Reliab. Eng. Syst. Saf. 2018, 176, 102–112. [Google Scholar] [CrossRef]
  5. De Oliveira, R.P.; Matos, J.S.; Monteiro, A.J. Managing the Urban Water Cycle in a Changing Environment. Water Util. J. 2015, 9, 3–12. [Google Scholar]
  6. Stokes, J.; Horvath, A. Life-Cycle Assessment of Urban Water Provision: Tool and Case Study in California. J. Infrastruct. Syst. 2011, 17, 15–24. [Google Scholar] [CrossRef]
  7. Chhipi-Shrestha, G.; Hewage, K.; Sadiq, R. Water–Energy–Carbon Nexus Modeling for Urban Water Systems: System Dynamics Approach. J. Water Resour. Plan. Manag. 2017, 143, 04017016. [Google Scholar] [CrossRef]
  8. Siddiqi, A.; Anadon, L.D. The Water–Energy Nexus in Middle East and North Africa. Energy Policy 2011, 39, 4529–4540. [Google Scholar] [CrossRef]
  9. Khalkhali, M.; Westphal, K.; Mo, W. The Water-Energy Nexus at Water Supply and Its Implications on the Integrated Water and Energy Management. Sci. Total Environ. 2018, 636, 1257–1267. [Google Scholar] [CrossRef]
  10. Li, Z.; Siddiqi, A.; Anadon, L.D.; Narayanamurti, V. Towards Sustainability in Water-Energy Nexus: Ocean Energy for Seawater Desalination. Renew. Sustain. Energy Rev. 2018, 82, 3833–3847. [Google Scholar] [CrossRef] [Green Version]
  11. IDA; GWI. IDA Water Security Handbook; 2019–2020. 2020. Available online: https://idadesal.org/e-library/ida-water-security-handbook/ (accessed on 10 June 2021).
  12. Richter, B.D.; Blount, M.E.; Bottorff, C.; Brooks, H.E.; Demmerle, A.; Gardner, B.L.; Herrmann, H.; Kremer, M.; Kuehn, T.J.; Kulow, E. Assessing the Sustainability of Urban Water Supply Systems. J. Am. Water Work. Assoc. 2018, 110, 40–47. [Google Scholar] [CrossRef] [Green Version]
  13. US EPA. Overview of Greenhouse Gases. Available online: https://www.epa.gov/ghgemissions/overview-greenhouse-gases (accessed on 24 June 2021).
  14. Hendrickson, T.P.; Horvath, A. A Perspective on Cost-Effectiveness of Greenhouse Gas Reduction Solutions in Water Distribution Systems. Environ. Res. Lett. 2014, 9, 024017. [Google Scholar] [CrossRef]
  15. Smith, K.; Liu, S.; Chang, T. Contribution of Urban Water Supply to Greenhouse Gas Emissions in China. J. Ind. Ecol. 2016, 20, 792–802. [Google Scholar] [CrossRef]
  16. Marlow, D.R.; Moglia, M.; Cook, S.; Beale, D.J. Towards Sustainable Urban Water Management: A Critical Reassessment. Water Res. 2013, 47, 7150–7161. [Google Scholar] [CrossRef]
  17. Nair, S.; Hashim, H.; Hannon, L.; Clifford, E. End Use Level Water and Energy Interactions: A Large Non-Residential Building Case Study. Water 2018, 10, 810. [Google Scholar] [CrossRef] [Green Version]
  18. Group, W.B. Beyond Scarcity: Water Security in the Middle East and North Africa; World Bank: Washington, DC, USA, 2018. [Google Scholar]
  19. Saif, O.; Mezher, T.; Arafat, H.A. Water Security in the GCC Countries: Challenges and Opportunities. J. Environ. Stud. Sci. 2014, 4, 329–346. [Google Scholar] [CrossRef]
  20. Al-Saidi, M.; Saliba, S. Water, Energy and Food Supply Security in the Gulf Cooperation Council (GCC) Countries—A Risk Perspective. Water 2019, 11, 455. [Google Scholar] [CrossRef] [Green Version]
  21. Raouf, M.A. Water Issues in the Gulf: Time for Action; Middle East Institute, ETH Zurich: Zürich, Switzerland, 2009. [Google Scholar]
  22. Atilhan, S.; Mahfouz, A.B.; Batchelor, B.; Linke, P.; Abdel-Wahab, A.; Nápoles-Rivera, F.; Jiménez-Gutiérrez, A.; El-Halwagi, M.M. A Systems-Integration Approach to the Optimization of Macroscopic Water Desalination and Distribution Networks: A General Framework Applied to Qatar’s Water Resources. Clean Technol. Environ. Policy 2012, 14, 161–171. [Google Scholar] [CrossRef]
  23. Von Medeazza, G.M. “Direct” and Socially-Induced Environmental Impacts of Desalination. Desalination 2005, 185, 57–70. [Google Scholar] [CrossRef]
  24. Dawoud, M.A. Environmental Impacts of Seawater Desalination: Arabian Gulf Case Study. Int. J. Environ. Sustain. 2012, 1, 22–37. [Google Scholar] [CrossRef]
  25. Missimer, T.M.; Maliva, R.G. Environmental Issues in Seawater Reverse Osmosis Desalination: Intakes and Outfalls. Desalination 2018, 434, 198–215. [Google Scholar] [CrossRef]
  26. IMF. World Economic Outlook (October 2019)—GDP per Capita, Current Prices. Available online: https://www.imf.org/external/datamapper/PPPPC@WEO/SAU/QAT/KWT/ARE/BHR (accessed on 27 February 2020).
  27. Winz, I.; Brierley, G.; Trowsdale, S. The Use of System Dynamics Simulation in Water Resources Management. Water Resour. Manag. 2009, 23, 1301–1323. [Google Scholar] [CrossRef]
  28. Duran-Encalada, J.A.; Paucar-Caceres, A.; Bandala, E.R.; Wright, G.H. The Impact of Global Climate Change on Water Quantity and Quality: A System Dynamics Approach to the US–Mexican Transborder Region. Eur. J. Oper. Res. 2017, 256, 567–581. [Google Scholar] [CrossRef] [Green Version]
  29. Sterman, J. Business Dynamics: Systems Thinking and Modeling for a Complex World; McGraw-Hill: New York, NY, USA, 2000; Available online: https://www.researchgate.net/publication/44827001_Business_Dynamics_System_Thinking_and_Modeling_for_a_Complex_World (accessed on 10 June 2021).
  30. Duggan, J. An introduction to system dynamics. In System Dynamics Modeling with R; Springer: Berlin/Heidelberg, Germany, 2016; pp. 1–24. Available online: https://www.researchgate.net/publication/303972873_An_Introduction_to_System_Dynamics (accessed on 12 June 2021).
  31. Dolado, J.J. Qualitative Simulation and System Dynamics. Syst. Dyn. Rev. 1992, 8, 55–81. [Google Scholar] [CrossRef]
  32. Zarghami, M.; Akbariyeh, S. System Dynamics Modeling for Complex Urban Water Systems: Application to the City of Tabriz, Iran. Resour. Conserv. Recycl. 2012, 60, 99–106. [Google Scholar] [CrossRef]
  33. Sharawat, I.; Dahiya, R.; Dahiya, R.P.; Sreekrishnan, T.R.; Kumari, S. Policy Options for Managing the Water Resources in Rapidly Expanding Cities: A System Dynamics Approach. Sustain. Water Resour. Manag. 2019, 5, 1201–1215. [Google Scholar] [CrossRef]
  34. Chen, C.; Ahmad, S.; Kalra, A.; Xu, Z. A Dynamic Model for Exploring Water-Resource Management Scenarios in an Inland Arid Area: Shanshan County, Northwestern China. J. Mt. Sci. 2017, 14, 1039–1057. [Google Scholar] [CrossRef]
  35. Chang, Y.-T.; Liu, H.-L.; Bao, A.-M.; Chen, X.; Wang, L. Evaluation of Urban Water Resource Security under Urban Expansion Using a System Dynamics Model. Water Sci. Technol. Water Supply 2015, 15, 1259–1274. [Google Scholar] [CrossRef]
  36. Sun, Y.; Liu, N.; Shang, J.; Zhang, J. Sustainable Utilization of Water Resources in China: A System Dynamics Model. J. Clean. Prod. 2017, 142, 613–625. [Google Scholar] [CrossRef]
  37. Alvi, M.S.Q.; Mahmood, I.; Javed, F.; Malik, A.W.; Sarjoughian, H. Dynamic Behavioural Modeling, Simulation and Analysis of Household Water Consumption in an Urban Area: A Hybrid Approach. In Proceedings of the 2018 Winter Simulation Conference (WSC), Gothenburg, Sweden, 9 December 2018; pp. 2411–2422. [Google Scholar]
  38. Chen, Z.; Wei, S. Application of System Dynamics to Water Security Research. Water Resour. Manag. 2014, 28, 287–300. [Google Scholar] [CrossRef]
  39. Zarghami, S.A.; Gunawan, I.; Schultmann, F. System Dynamics Modelling Process in Water Sector: A Review of Research Literature. Syst. Res. Behav. Sci. 2018, 35, 776–790. [Google Scholar] [CrossRef]
  40. Raj, K. Sustainable Urban Habitats and Urban Water Supply: Accounting for Unaccounted for Water in Bangalore City, India. Curr. Urban Stud. 2013, 1, 156. [Google Scholar] [CrossRef] [Green Version]
  41. Topi, C.; Esposto, E.; Govigli, V.M. The Economics of Green Transition Strategies for Cities: Can Low Carbon, Energy Efficient Development Approaches Be Adapted to Demand Side Urban Water Efficiency? Environ. Sci. Policy 2016, 58, 74–82. [Google Scholar] [CrossRef]
  42. WWAP. The United Nations World Water Development Report 2017. Wastewater: The Untapped Resource; UNESCO: Paris, France, 2017. [Google Scholar]
  43. Lafforgue, M.; Lenouvel, V. Closing the Urban Water Loop: Lessons from Singapore and Windhoek. Environ. Sci. Water Res. Technol. 2015, 1, 622–631. [Google Scholar] [CrossRef]
  44. Leigh, N.G.; Lee, H. Sustainable and Resilient Urban Water Systems: The Role of Decentralization and Planning. Sustainability 2019, 11, 918. [Google Scholar] [CrossRef] [Green Version]
  45. Sapkota, M.; Arora, M.; Malano, H.; Moglia, M.; Sharma, A.; George, B.; Pamminger, F. An Overview of Hybrid Water Supply Systems in the Context of Urban Water Management: Challenges and Opportunities. Water 2015, 7, 153–174. [Google Scholar] [CrossRef] [Green Version]
  46. Younos, T. Paradigm Shift: Holistic Approach for Water Management in Urban Environments. Front. Earth Sci. 2011, 5, 421–427. [Google Scholar] [CrossRef]
  47. Cohen, R.; Nelson, B.; Wolff, G. Energy down the Drain: The Hidden Costs of California’s Water Supply; Natural Resources Defense Council, Pacific Institute: Oakland, CA, USA, 2004. [Google Scholar]
  48. Kumar, G.; Karney, B.W. Electricity Usage in Water Distribution Networks. In Proceedings of the 2007 IEEE Canada Electrical Power Conference, Montreal, QC, Canada, 25–26 October 2007; pp. 97–102. [Google Scholar]
  49. Tortajada, C.; Joshi, Y.K.; Biswas, A.K. The Singapore Water Story: Sustainable Development in an Urban City State; Routledge: London, UK, 2013; ISBN 1-135-12590-2. [Google Scholar]
  50. Ibrahim, A.-J. Energy-Water-Environment Nexus and the Transition Towards a Circular Economy: The Case of Qatar. 16. Available online: https://link.springer.com/article/10.1007/s43615-021-00037-w (accessed on 12 June 2021).
  51. Tahir, F.; Baloch, A.A.; Ali, H. Resilience of Desalination Plants for Sustainable Water Supply in Middle East. In Sustainability Perspectives: Science, Policy and Practice; Springer: Berlin/Heidelberg, Germany, 2020; pp. 303–329. [Google Scholar]
  52. Darwish, M.A.; Mohtar, R. Qatar Water Challenges. Desalin. Water Treat. 2013, 51, 75–86. [Google Scholar] [CrossRef]
  53. Ahmad, A.Y.; Al-Ghouti, M.A. Approaches to Achieve Sustainable Use and Management of Groundwater Resources in Qatar: A Review. Groundw. Sustain. Dev. 2020, 11, 100367. [Google Scholar] [CrossRef]
  54. Mannan, M.; Alhaj, M.; Mabrouk, A.N.; Al-Ghamdi, S.G. Examining the Life-Cycle Environmental Impacts of Desalination: A Case Study in the State of Qatar. Desalination 2019, 452, 238–246. [Google Scholar] [CrossRef]
  55. Jasim, S.Y.; Saththasivam, J.; Loganathan, K.; Ogunbiyi, O.O.; Sarp, S. Reuse of Treated Sewage Effluent (TSE) in Qatar. J. Water Process Eng. 2016, 11, 174–182. [Google Scholar] [CrossRef]
  56. Lambert, L.A.; Lee, J. Nudging Greywater Acceptability in a Muslim Country: Comparisons of Different Greywater Reuse Framings in Qatar. Environ. Sci. Policy 2018, 89, 93–99. [Google Scholar] [CrossRef]
  57. Alsheyab, M.A.T.; Kusch-Brandt, S. Potential Recovery Assessment of the Embodied Resources in Qatar’s Wastewater. Sustainability 2018, 10, 3055. [Google Scholar] [CrossRef] [Green Version]
  58. Ahmad, A.Y.; Al-Ghouti, M.A.; Khraisheh, M.; Zouari, N. Hydrogeochemical Characterization and Quality Evaluation of Groundwater Suitability for Domestic and Agricultural Uses in the State of Qatar. Groundw. Sustain. Dev. 2020, 11, 100467. [Google Scholar] [CrossRef]
  59. Qatar, G. Qatar National Vision 2030. Doha Gen. Secr. Dev. 2008. Available online: https://www.gco.gov.qa/en/about-qatar/national-vision2030/ (accessed on 15 June 2021).
  60. QNRS. Qatar National Research Strategy 2014. 2014. Available online: https://www.qnrf.org/en-us/About-Us/QNRS (accessed on 17 June 2021).
  61. Darwish, M.A.; Abdulrahim, H.K.; Mohieldeen, Y. Qatar and GCC Water Security. Desalin. Water Treat. 2015, 55, 2302–2325. [Google Scholar] [CrossRef]
  62. PSA. Qatar in Figures; Planning and Statistics Authority: Doha, Qatar, 2019.
  63. PSA. Water Statistics in the State of Qatar 2015; Planning and Statistics Authority: Doha, Qatar, 2017.
  64. Baalousha, H.M. Development of a Groundwater Flow Model for the Highly Parameterized Qatar Aquifers. Model. Earth Syst. Environ. 2016, 2, 67. [Google Scholar] [CrossRef] [Green Version]
  65. Shomar, B.; Darwish, M.; Rowell, C. What Does Integrated Water Resources Management from Local to Global Perspective Mean? Qatar as a Case Study, the Very Rich Country with No Water. Water Resour. Manag. 2014, 28, 2781–2791. [Google Scholar] [CrossRef]
  66. FAO. FAO’s Information System on Water and Agriculture-Qatar. Available online: http://www.fao.org/nr/water/aquastat/countries_regions/QAT/ (accessed on 15 October 2019).
  67. KAHRAMAA. KAHRAMAA Statistics Report 2017; 2017; p. 73. Available online: https://www.psa.gov.qa/en/statistics/Statistical%20Releases/Environmental/Water/2017/Water-Statistics-2017-EN.pdf (accessed on 10 June 2021).
  68. Mezher, T.; Fath, H.; Abbas, Z.; Khaled, A. Techno-Economic Assessment and Environmental Impacts of Desalination Technologies. Desalination 2011, 266, 263–273. [Google Scholar] [CrossRef]
  69. QGBC. Reclamation and Reuse Infrastructure. Available online: https://qatargbc.org/education/articles/a0003 (accessed on 16 March 2020).
  70. Ghaffour, N.; Missimer, T.M.; Amy, G.L. Combined Desalination, Water Reuse, and Aquifer Storage and Recovery to Meet Water Supply Demands in the GCC/MENA Region. Desalin. Water Treat. 2013, 51, 38–43. [Google Scholar] [CrossRef]
  71. KAHRAMAA. KAHRAMAA—Water Security Mega Reservoirs Project. Available online: http://www.watermegareservoirs.qa/ (accessed on 16 March 2020).
  72. KAHRAMAA. Qatar General Electricity & Water Corporation. Available online: https://www.km.com.qa/AboutUs/Pages/WaterSector.aspx (accessed on 7 March 2020).
  73. Darwish, M.A.; Abdulrahim, H.; Mohammed, S.; Mohtar, R. The Role of Energy to Solve Water Scarcity in Qatar. Desalin. Water Treat. 2016, 57, 18639–18667. [Google Scholar] [CrossRef]
  74. PSA. Water Statistics in the State of Qatar 2017; Planning and Statistics Authority: Doha, Qatar, 2018.
  75. PSA. Environment Statistics Report in the State of Qatar 2017; Planning and Statistics Authority: Doha, Qatar, 2019.
  76. World Bank. Arable Land (% of Land Area)—Qatar|Data. Available online: https://data.worldbank.org/indicator/AG.LND.ARBL.ZS?locations=QA (accessed on 1 March 2020).
  77. World Bank. Agriculture, Forestry, and Fishing, Value Added (% of GDP)—Qatar|Data. Available online: https://data.worldbank.org/indicator/NV.AGR.TOTL.ZS?locations=QA (accessed on 1 March 2020).
  78. Ventana Systems, Inc. Vensim PLE; Ventana Systems, Inc.: Harvard, MA, USA, 2010. [Google Scholar]
  79. Ventana Systems, Inc. Ventity—Simulation Software for Complex Systems; Ventana Systems, Inc.: Harvard, MA, USA, 2018. [Google Scholar]
  80. Gleick, P.H. Water in Crisis: Paths to Sustainable Water Use. Ecol. Appl. 1998, 8, 571–579. [Google Scholar] [CrossRef]
  81. Xiao-jun, W.; Jian-yun, Z.; Shahid, S.; ElMahdi, A.; Rui-min, H.; Zhen-xin, B.; Ali, M. Water Resources Management Strategy for Adaptation to Droughts in China. Mitig. Adapt. Strateg. Glob. Chang. 2012, 17, 923–937. [Google Scholar] [CrossRef] [Green Version]
  82. IMF. World Economic Outlook (October 2019)—Real GDP Growth. Available online: https://www.imf.org/external/datamapper/NGDP_RPCH@WEO/QAT (accessed on 13 March 2020).
  83. Kamal, A.; Al-Ghamdi, S.G.; Koç, M. Modeling and Understanding the Impacts of Efficiency Measures on Fleet Fuel Consumption in Vehicle Importing Countries: A Case Study of Qatar. J. Clean. Prod. 2020, 120619. [Google Scholar] [CrossRef]
  84. Kamal, A.; Al-Ghamdi, S.G.; Koç, M. Role of Energy Efficiency Policies on Energy Consumption and CO2 Emissions for Building Stock in Qatar. J. Clean. Prod. 2019, 235, 1409–1424. [Google Scholar] [CrossRef]
  85. QEWC Kahramaa, Umm Al Houl Power in Deal to Boost Water Desalination Capacity|Qatar Electricity & Water Co. Available online: https://www.qewc.com/qewc/en/kahramaa-umm-al-houl-power-in-deal-to-boost-water-desalination-capacity/ (accessed on 21 March 2020).
  86. Alhaj, M.; Mabrouk, A.; Al-Ghamdi, S.G. Energy Efficient Multi-Effect Distillation Powered by a Solar Linear Fresnel Collector. Energy Convers. Manag. 2018, 171, 576–586. [Google Scholar] [CrossRef]
  87. IEA. CO2 Emissions from Fuel Combustion: 2017; IEA: Paris, France, 2017. [Google Scholar]
  88. World Bank Population, Total|Data. Available online: https://data.worldbank.org/indicator/SP.POP.TOTL?locations=QA (accessed on 7 October 2018).
  89. IMF. World Economic Outlook (October 2019)—GDP, Current Prices. Available online: https://www.imf.org/external/datamapper/NGDPD@WEO/QAT (accessed on 13 March 2020).
Figure 1. Water use balance pie charts (total water available = 1014.71 million m3/year: year 2016) Reproduced from [63], Planning and Statistics Authority: Doha, Qatar, 2017.
Energies 14 04348 g001
Figure 2. Conceptual water balance flow chart of Qatar.
Energies 14 04348 g002
Figure 3. Detailed water consumption of different sectors of the economy. (a) Household water use (millions m3). (b) Industrial water use (millions m3). (c) Commercial sector water use (millions m3). (d) Agricultural water use (millions m3).
Energies 14 04348 g003
Figure 4. The source of water and percentage of total water used in the economy. (a). Total water use by type (millions m3). (b) Percentage water used by sector (%).
Energies 14 04348 g004
Figure 5. Simplified causal loop diagram of energy–water interaction in Qatar.
Energies 14 04348 g005
Figure 6. Future demand estimates of each sector.
Energies 14 04348 g006
Figure 7. Validation of estimates using regression equations.
Energies 14 04348 g007
Figure 8. Results of SC1 scenario which limits groundwater abstraction to only 50 million m3. (a) Ground water volume (m3) (b) TSE reused (m3). (c) Desalinated water volume (m3). (d) Electricity consumption (GWh). (e) CO2 emissions (million tons). (f) Electricity losses (GWh). (g) Water loss CO2 emissions (million tons).
Energies 14 04348 g008aEnergies 14 04348 g008b
Figure 9. Results of Sc2 policy which reduces water consumption in each sector by 10%. (a) Water demand (million m3). (b) Electricity consumption (GWh). (c) CO2 emissions (million tons).
Energies 14 04348 g009
Figure 10. Results of Sc3 policy that assesses gradual increase in share of reverse osmosis (RO) produced desalinated water to 50%. (a) Percentage of total desalinated water (%) (b) Desalinated water RO (GWh). (c) Desalinated water MSF (GWh). (d) Desalinated Water MED (GWh). (e) Total electricity consumption (GWh). (f) Total CO2 emitted (million tons).
Energies 14 04348 g010aEnergies 14 04348 g010b
Table 1. Three pillars to Water Security Grand Challenge. Reproduced from [60], Qatar Foundation: 2014.
Desalination and Water TreatmentWater Quality and ReuseGroundwater Aquifer Recharge
Objective: Reduce desalination energy consumption and cost by 40%Objective: Increase water quality and reuse by 30%Objective: Elevate groundwater table to 1980 levels
Strategies
  • High performance Hybrid Systems
  • Reverse/Forward Osmosis
  • Solar Thermal Desalination
  • New membrane materials
  • Quality of Raw Water
  • Optimized Treatment Processes
  • Assured Quality for different users
  • Computational Subsurface Modeling
  • Soil characterization & water/contaminant interaction
  • Groundwater assessment
Table 2. Qatar’s water storage capacity. Reproduced from [67], KAHRAMAA: 2017.
Water Storage TypeNo. of StorageTotal Installed Capacity (m3)Operating Capacity (m3)Percentage of Total Storage (Operating)
ReservoirsIndependent Water and Power Plant (IWPP) Reservoirs102,283,1822,283,18234.12%
KAHRAMAA Reservoirs284,390,9094,390,90965.62%
Ground Tanks725,80012,1640.18%
Elevated Tanks829869000.01%
Water Towers1527,63645000.07%
Table 3. Regression equations developed to estimate future water consumption.
SectorEquationAdjust R2F-Statistic, p-Value (α < 0.05)
Agriculture A g = 203.3090 + 15.7276 P o p + 0.2049 G D P + 0.1646 R n f 0.790813.6, 0.002632
Household H h = 30.57771 + 147.53605 P o p 0.07729 G D P 0.40296 R n f 0.950765.22, 1.759 × 10⁻⁵
Government G v = 103.39541 + 73.59845 P o p 0.4746 G D P + 0.663756 R n f 0.72829.932, 0.006451
Commercial C m = 55.89256 + 81.96694 P o p 0.34341 G D P + 0.05626 R n f 0.70779.071, 0.008269
Industry I n = 4.63937 0.32591 P o p + 0.02608 G D P + 0.02805 R n f 0.60266.054, 0.0234
Table 4. Energy consumption equations [73,86,87].
EquationDescription
GW EP = GW Ab   m 3 0.36   kWh / m 3
  • GWEP: Electric power to abstract water from ground (kWh).
  • GWAb: Amount of groundwater abstracted
DW EP = ( DW MSF   m 3 20 kWh m 3 +   DW MED   m 3 19 kWh m 3 +   DW SWRO   m 3 6 kWh m 3 )
  • DWEP: Total electric power consumed in desalination process (kWh)
  • DWMSF: Amount of desalinated water through Multi-Stage Flash (MSF) technology
  • DWMED: Amount of desalinated water through Multi-Effect Distillation (MED) technology
  • DWSWRO: Amount of desalinated water through Seawater Reverse Osmosis (SWRO) technology
WW EP = WW Ter   m 3 0.44 kWh m 3 + WW TerNP   m 3 0.74   kWh / m 3
  • WWEP: Total electric power consumed in treatment of wastewater (kWh)
  • WWTer: Amount of wastewater used through tertiary treatment
  • WWTerNP: Amount of wastewater used through tertiary treatment with Nitrogen and Phosphorus removal
WWC EP = WW Col   m 3 0.04 kWh m 3
  • WWCEP: Electric power consumed for the amount of wastewater collected that is eventually reused
  • WWCCol: Amount of wastewater collected
DIS EP = ( TDW +   TGW + TTSE )   m 3 0.44   kWh / m 3
  • DISEP: Electric power consumed in water distribution including losses
  • TDW: Total desalinated water supplied including losses
  • TGW: Total groundwater abstracted
  • TTSE: Total wastewater reused in the system after treatment
Emission factor for estimating CO2 produced from natural gas used in electricity generation: 486 gCO2/kWh
Publisher’s Note: MDPI stays neutral with regard to jurisdictional claims in published maps and institutional affiliations.

