Article

Underground Gas Storage Process Optimisation with Respect to Reservoir Parameters and Production Equipment

1
Faculty of Mining, Geology and Petroleum Engineering, University of Zagreb, 10000 Zagreb, Croatia
2
Podzemno skladište plina d.o.o., Veslačka 2-4, 10000 Zagreb, Croatia
*
Author to whom correspondence should be addressed.
Energies 2021, 14(14), 4324; https://doi.org/10.3390/en14144324
Submission received: 15 June 2021 / Revised: 7 July 2021 / Accepted: 16 July 2021 / Published: 18 July 2021

Abstract

:
The storage of natural gas in geological structures such as depleted fields, aquifers and salt caverns plays an important role in a gas supply system as it balances the fluctuation of gas demand and price. Hydraulic loss due to fluid flow through gas storage production equipment and an interfering effect from nonequal productivity index of storage wells may have an important influence on gas storage performance. An integrated mathematical model is developed based on underground gas storage facility production data. Using this model, the hydraulic loss is determined. A real test case that consists of a gas storage reservoir linked to the surface facility is analysed. The mathematical model uses an experimentally determined pressure drop coefficient in chokes. The base case scenario created using real gas storage facility data enables the achievement of a good history match with the given parameters of the gas storage reservoir. Using the history match simulation case as an initial scenario (a base case), two different scenarios are created to determine the injection and withdrawal performance of the gas storage field. The results indicate that the pressure drop in chokes, when fully open as a constraints in an underground gas storage facility, has a significant impact on gas storage operations and deliverability.

1. Introduction

Underground gas storage facilities (UGS) represent an important segment of gas infrastructure. Their primary function is to ensure a reliable and efficient supply of natural gas to private and public consumers. The storage of natural gas is a critical component of the natural gas supply chain that must be optimised to balance the gas supply and demand [1]. Natural gas is stored within underground geological formations (reservoirs), and in most cases, a former producing field is used and transformed into a storage facility [2,3,4,5]. In some cases, storage facilities have been developed in aquifers that did not previously hold gas [6] or salt caverns [7]. Withdrawal and injection capacity are important technical features of every gas storage facility, and they are a function of reservoir pressure, physical properties of the geological formation and the number of wells. Maximum gas injection capacity is usually sustainable throughout the whole storage cycle, but maximum withdrawal storage capacity is only sustainable to a certain point of reservoir pressure, which is continuously reduced by gas depletion. Since the UGS facility is likely to work intensively during the winter months, it is desirable that the UGS maximum withdrawal capacity is sustainable at lower values of reservoir pressure. This is important because UGS contributes to the safety of gas supply in winter periods during peak consumption loads. In this paper, we present findings from a study conducted to evaluate the impact of technological factors affecting the performance of the UGS storage facility and the sustainability of gas withdrawal capacity. This is generally related to hydraulic losses that occur during the flow of gas through production equipment. The influence of hydraulic losses is mainly emphasised with a high gas velocity that occurs at low reservoir pressure at the end of the gas withdrawal cycle. Parts of production equipment that have been examined and tested are wellhead chokes and production strings. The mentioned problems and their impact on underground gas storage facility performance have not been studied in a systematic way until now. In order to examine this issue, a full-scale mathematical model of a gas storage facility was developed, which enables the continuous monitoring of physical parameters during flow simulation from the reservoir to processing parts of the facility. Mathematical models are a powerful and heuristic tool for investigating complex systems. Once a model has been developed, it incorporates a large bulk of data and knowledge, and it can be used to make predictions regarding how a system (UGS facility) would respond under various conditions. With a model, it was possible to examine the impact of the production equipment’s internal diameter on the sustainability of maximum gas storage capacity. Discharge coefficient values for wellhead and reduction station chokes at 100% opening were determined experimentally, and the obtained values are incorporated into the mathematical model.

2. Literature Review

Earlier research regarding the development of mathematical models of underground gas storage applied individual models of the production system. Process optimisation using a single model is based on the parameter’s analysis of a single production process (i.e., gas flow through reservoir rock). Alternatively, the interdependence between the reservoir, the surface pipeline network, and the process facility is observed simultaneously with an Integrated UGS production (mathematical) model. The integrated model helps to determine some specific problems that are undetectable using stand-alone model simulation (e.g., a flow-assurance problem during CO2 injection [8]). Khodri et al. (1997) also used the same methodology to model gas storage reservoirs and address the problems of improving the peak flow rate, maximising the performance and deliverability and decision on drilling new wells [9]. Brown et al. (1999) used a homogeneous volumetric tank model to solve various storage problems, such as determining the minimum withdrawal time (or the peak withdrawal rate), and determining the minimum injection time at peak injection rate [10]. McVay and Spivey (2001) used a reservoir simulation model to examine a practical range of compression horsepower, the number of wells and amount of cushion gas and determined the combination that minimises the objective function, defined as the initial development cost [11]. These studies did not take into account the overall integration of the gas storage system components. Kuncir et al. (2003) used a tank model with a single-phase gas flow coupled with a surface flow system to evaluate the development and expansion options for a gas storage reservoir. They developed an optimisation code to evaluate different horsepower and well count configurations to meet a demand schedule [12]. Bagci and Ozturk (2007) provided a simulation study using both 3-D full-field black oil reservoir models to evaluate and demonstrate the feasibility of creating UGS in a depleted gas field. Their effort was to fit the wellhead pressure, average reservoir pressure and cumulative production generated by the numerical model with actual field data gathered from 1998 to 2002 [13]. Moradi (2009) simulated the effect of natural gas injection and production on variations in gas relative permeability and condensate saturation within near and far away areas of the wellbore by using the commercial simulator Eclipse 300. It has been found that the injection of a higher volume of gas in the first injection plan could prevent condensate from forming near the wellbore area [14]. Sun et al. (2017) provided a geomechanical simulation method for assessing the risk of caprock integrity failure and fault leakage of large UGS in a produced gas field during long-term operations. The large produced gas field located in China was converted to a UGS facility in 2013. In this study, the authors built a static regional-scale 3D geomechanical model through the integrated analysis of geologic, seismic, well drilling, logging and experimental rock data and established a plan for the design of UGS in complex, faulted, depleted gas field [15].
The objective of this work is to propose an integrated mathematical model as a solution and investigation tool for specific UGS facility problems.

3. Problem Statement

During gas flow through process equipment, friction losses are a function of the system geometry, fluid properties and flow rate. Their influence on gas storage operations is particularly emphasised at low reservoir pressure (usually at the end of the gas withdrawal cycle) due to high gas velocity in pipelines. The parts of the production equipment where most of the total friction loss occurs are the wellhead and the reduction station chokes. The reason for their application in UGS is the control of fluid flow from the reservoir by reducing its pressure. Flow through the chokes could be critical or subcritical depending on the gas velocity through the choke. The “critical flow” occurs when the fluid velocity at restriction (choke) is equal to the velocity of sound in that medium. When the velocity is less than the velocity of sound, it is supercritical flow. The basic difference between critical and subcritical flows is how the flow rate through the restriction is affected by a pressure drop across the restriction. During “subcritical flow”, the flow rate is related to the pressure drop across the restriction. At “critical flow”, the gas rate is only related to the upstream pressure [16]. At the beginning of the gas storage withdrawal cycle, typically, critical flow occurs at chokes during high-pressure differential between the reservoir pressure and the gas transport pressure. As reservoir pressure declines, critical flow leans towards subcritical flow. Eventually, with a further decrease in reservoir pressure, chokes no longer have a function in regulation and become an unnecessary flow restriction that has an influence on gas storage physical characteristics even in a fully open state. This paper presents a method to investigate the impact of major production equipment hydraulic losses (chokes and production string diameter) on gas storage operation and performance.

4. Methodology and Experiments

Within this paper, an integrated mathematical model of the UGS facility was applied. With a model, it is possible to simulate gas flow from porous rock through a production string and surface equipment in real-time. A model consists of several single mathematical models (a reservoir model, a well model, a choke model, and a surface process model) integrated into one unit. Using a model, by varying certain parameters within technically acceptable limits, it is possible to examine the effect of hydraulic losses on gas storage withdrawal capacity duration. Field experiments were also carried out to investigate pressure drop in chokes assuming isothermal, compressible and one-dimensional gas flow. A particular focus was placed on the discharge coefficient (Cd) number determination at a fully open cross-section area of the choke valve. The experiments were performed for various gas inlet pressures and temperatures, and the obtained Cd value was integrated into the mathematical model.

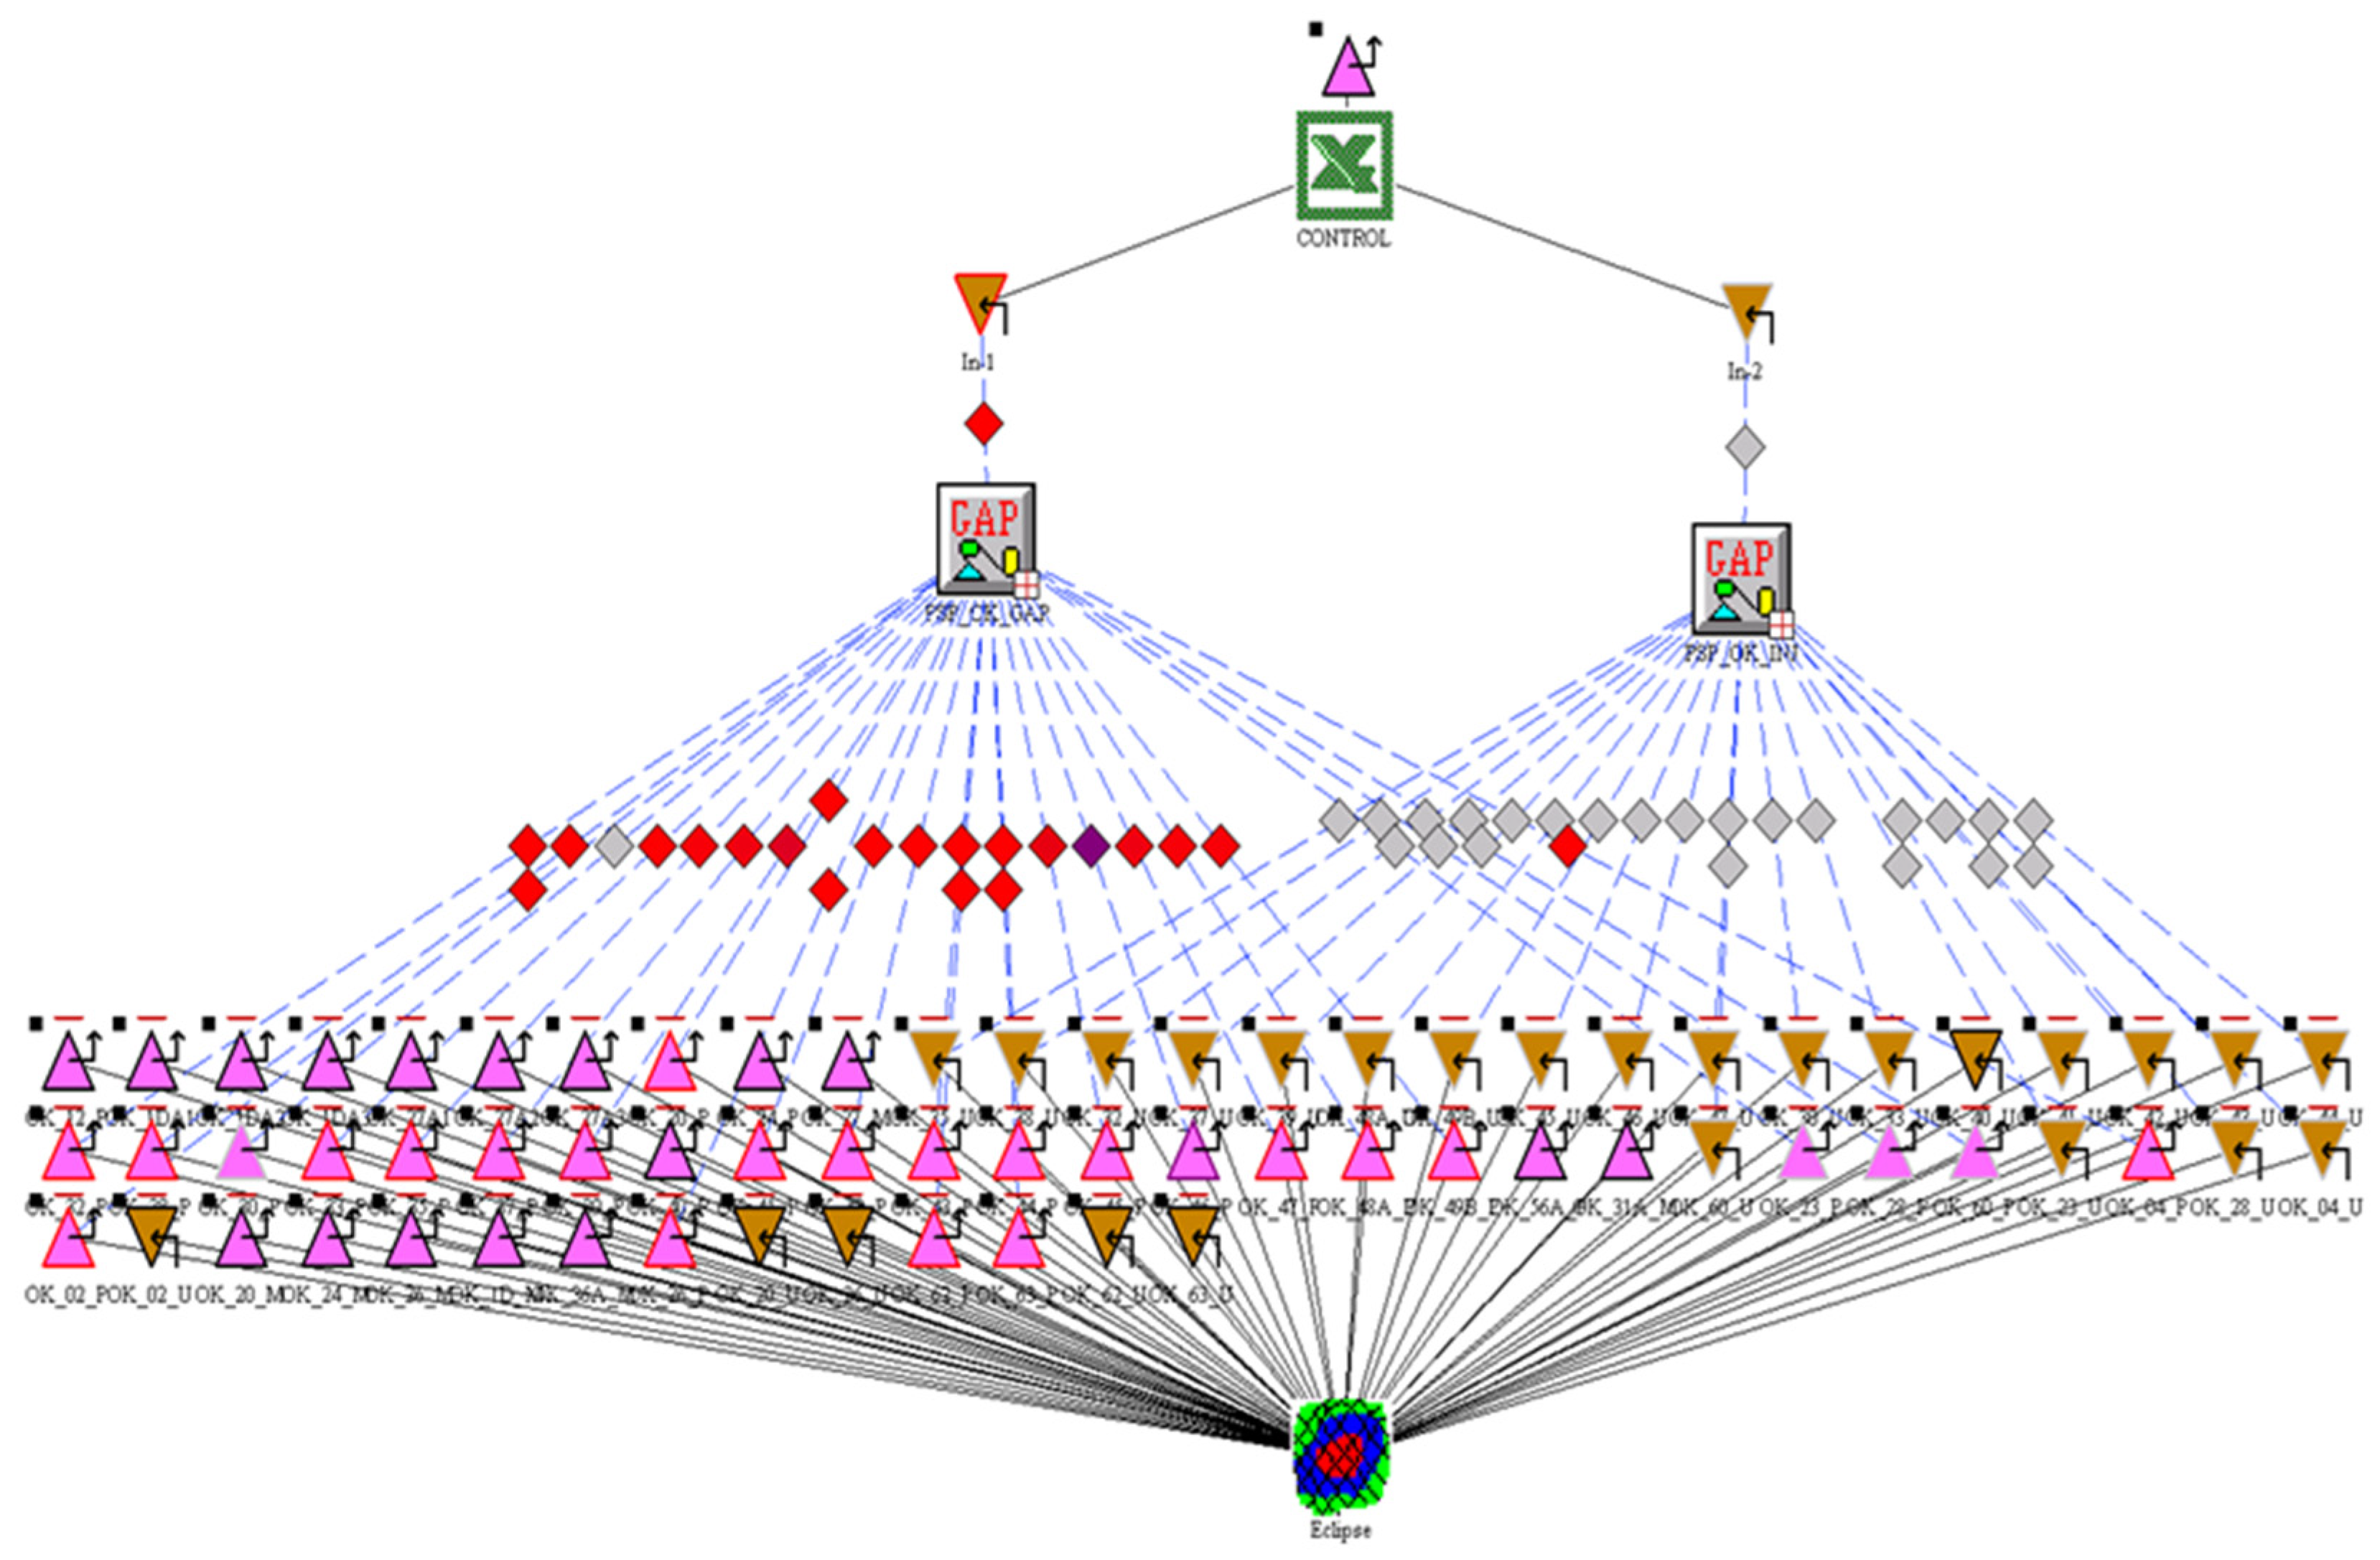
4.1. Mathematical Model of Underground Gas Storage

A mathematical model of the UGS facility was built and validated based on field and reservoir data from the Croatia UGS facility, collected during production and the injection storage working cycle. Once a model has been validated, it is ready to be used both as a predictive and as a surveillance tool that can honour a variety of system constraints and contract scenarios. Data uncertainty is tested through sensitivity analysis. The mentioned UGS facility in Croatia was developed with 23 working wells and has working storage volume of 553 × 106 m3 [17]. The model consists of several interconnected separate models that mathematically describe fluid flow of multiple production segments. A reservoir model was built with Eclipse software. IPM software was used to model fluid flow in wells and process pipelines; interconnection and integration of individual models was archived using IPM RESOLVE program (see Figure 1).
The model’s adjustment to the measurement results are as follows [17]:
  • A reservoir 3D model in Eclipse is calibrated on production history data and injection/withdrawal cycles.
  • A storage well model is calibrated with data obtained from modified isochronal tests performed on gas storage wells during injection and withdrawal cycles.
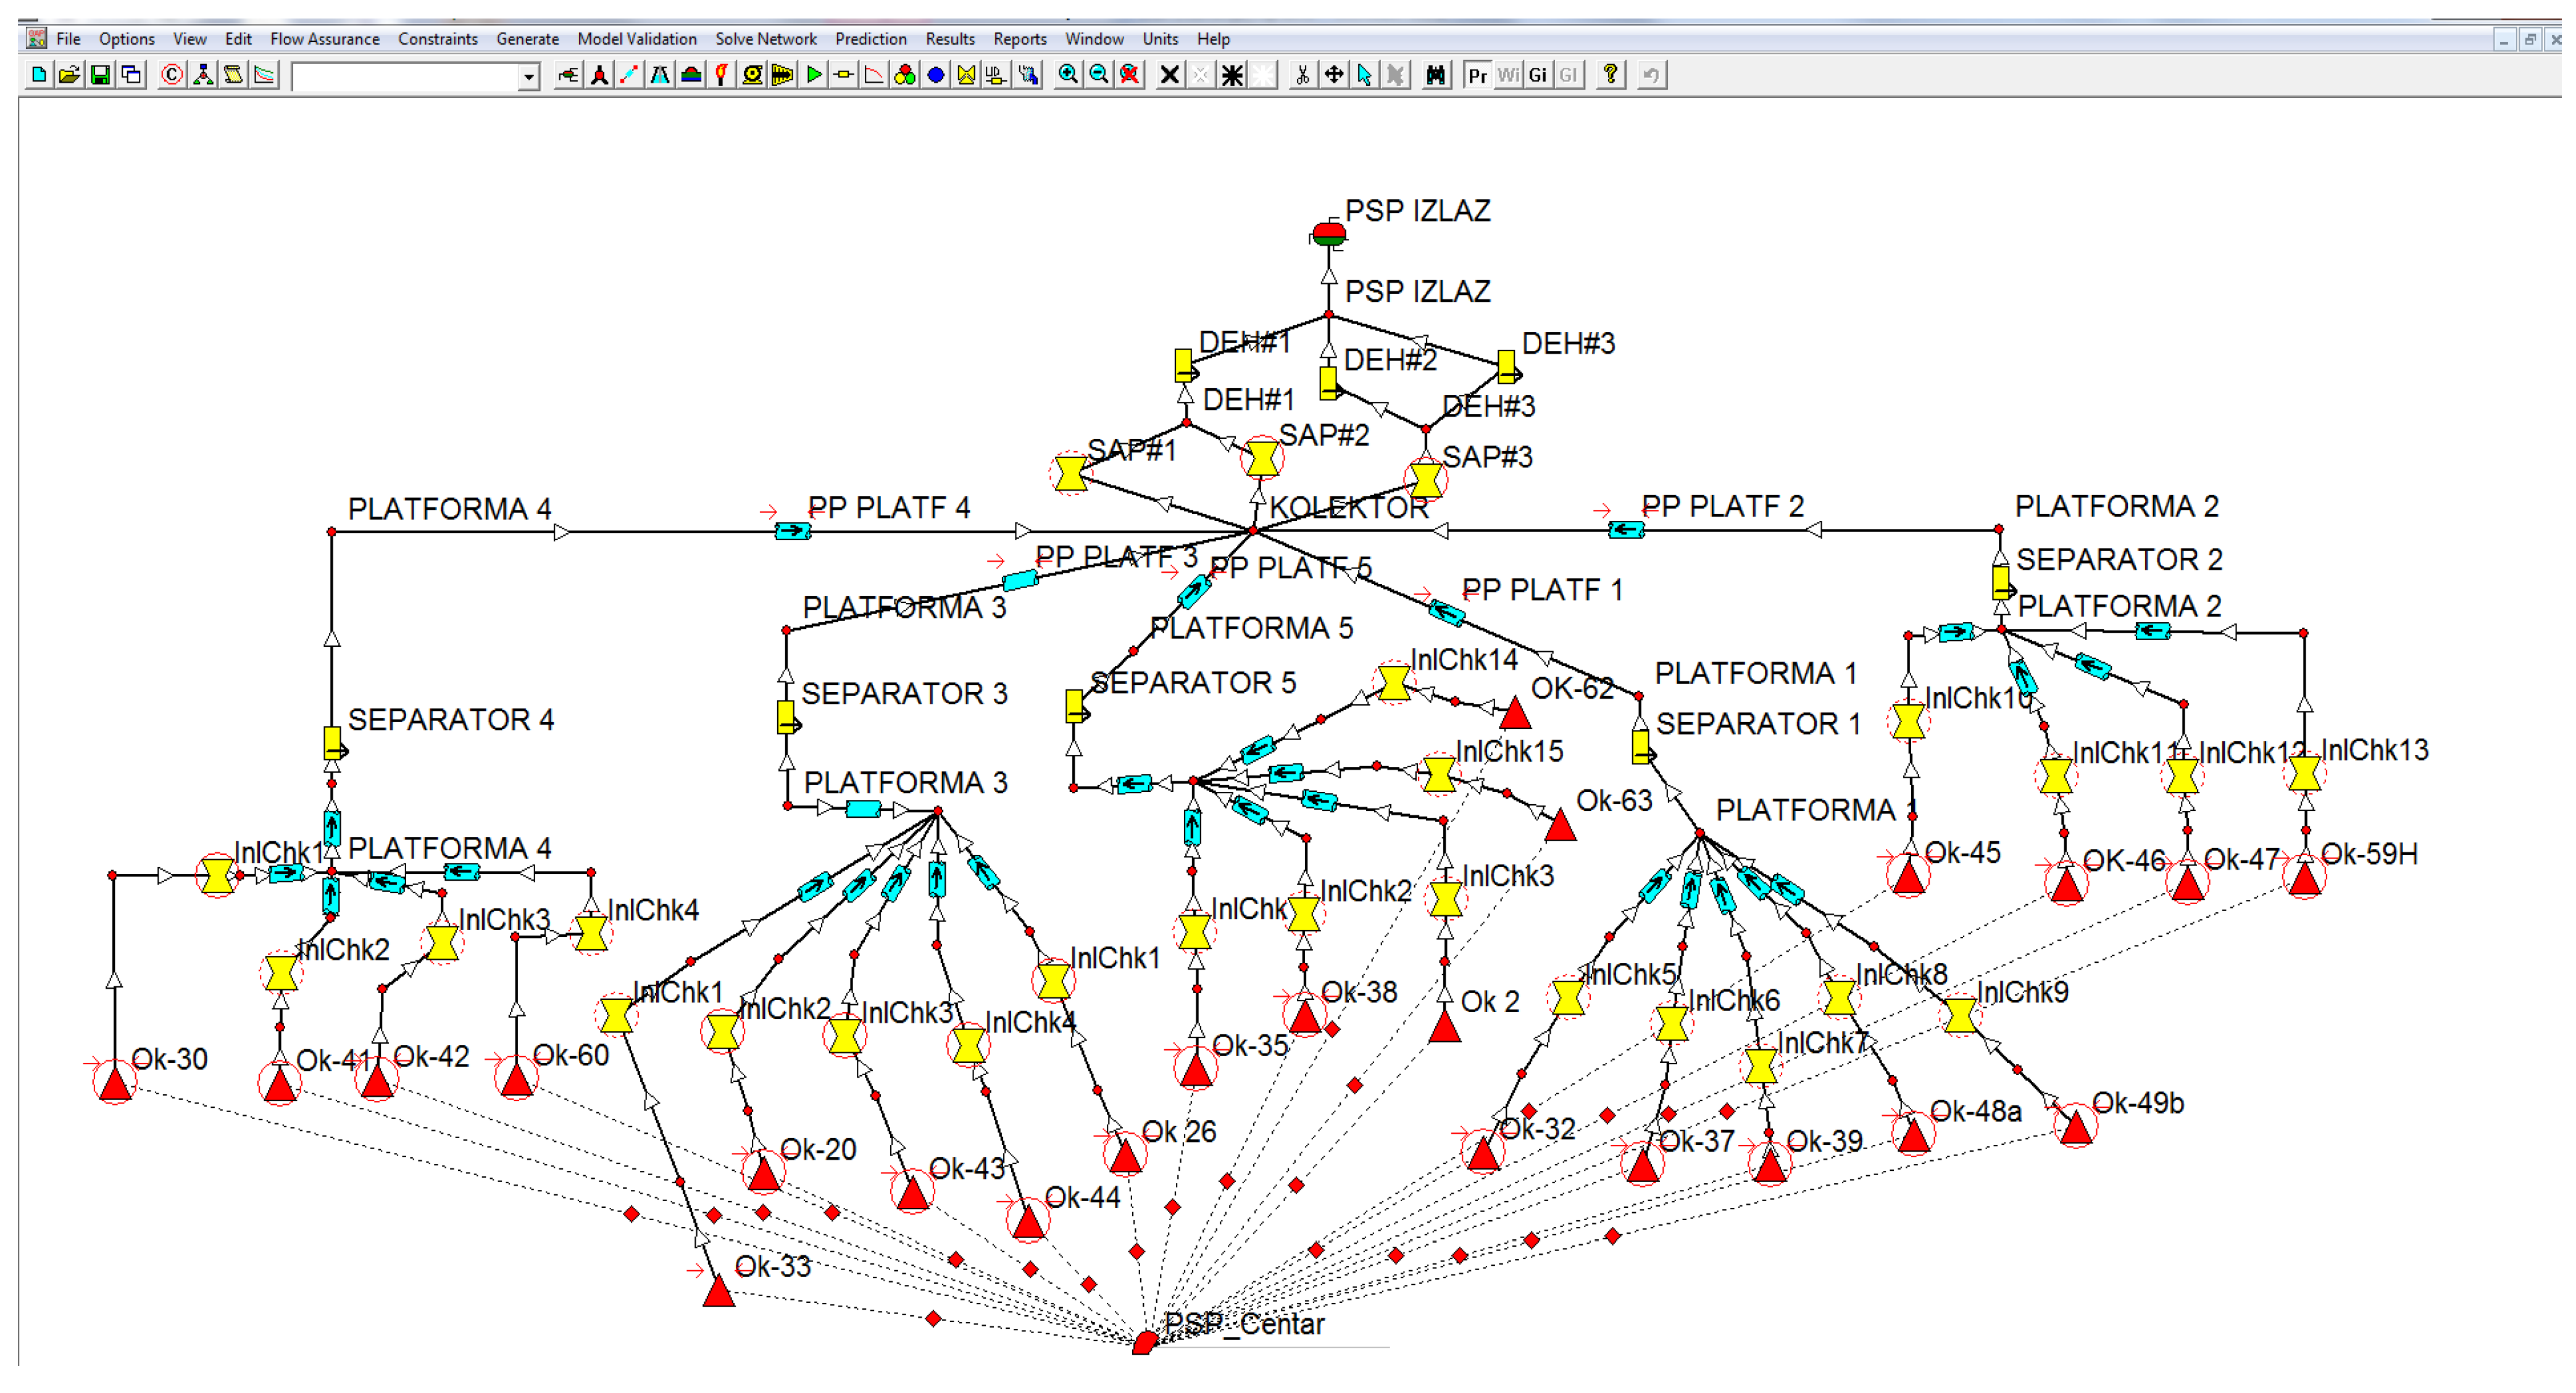
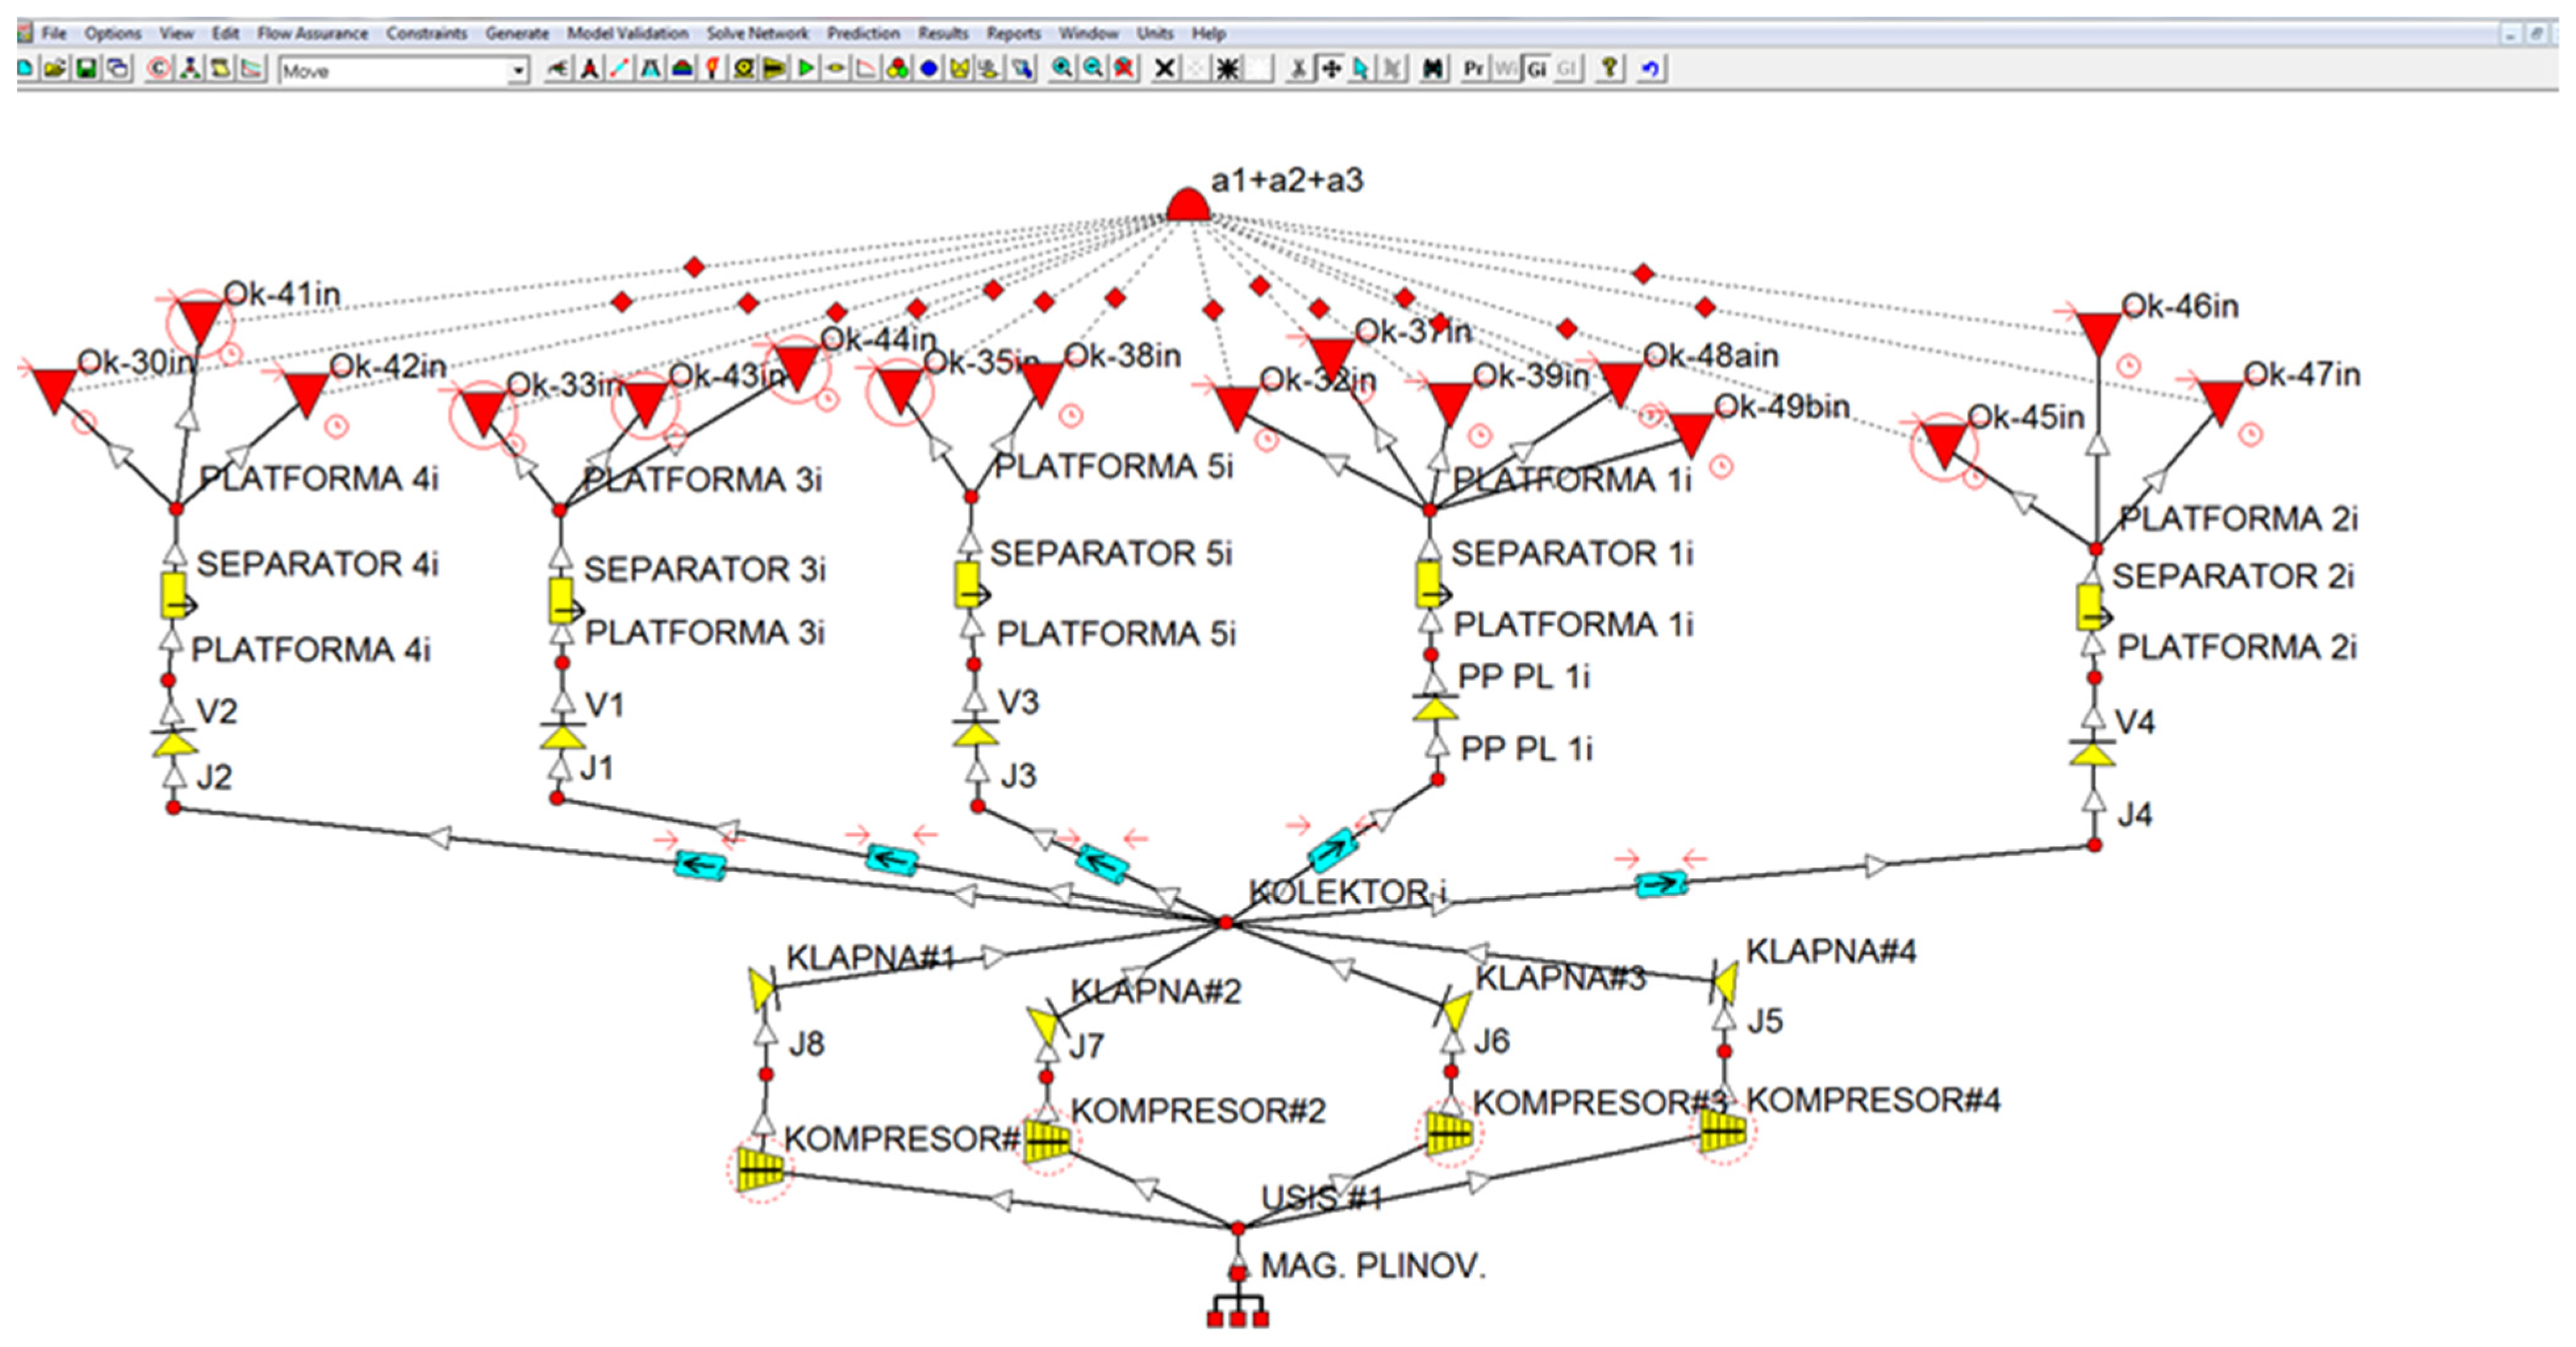
  • A model of the surface gathering system is matched on real dynamic production data (pressure and temperature drops through pipes and restrictions).
Using this model, it is possible to monitor a pressure drop from well perforations to the main gathering system gas separator as the last node of the storage system. With this level of integration, it is possible to monitor the influence of any flow restriction on gas storage operation simultaneously.
Input settings and restrictions applied within the RESOLVE model are as follows:
-
Maximum injection gas rate = 3,840,000 m3/d;
-
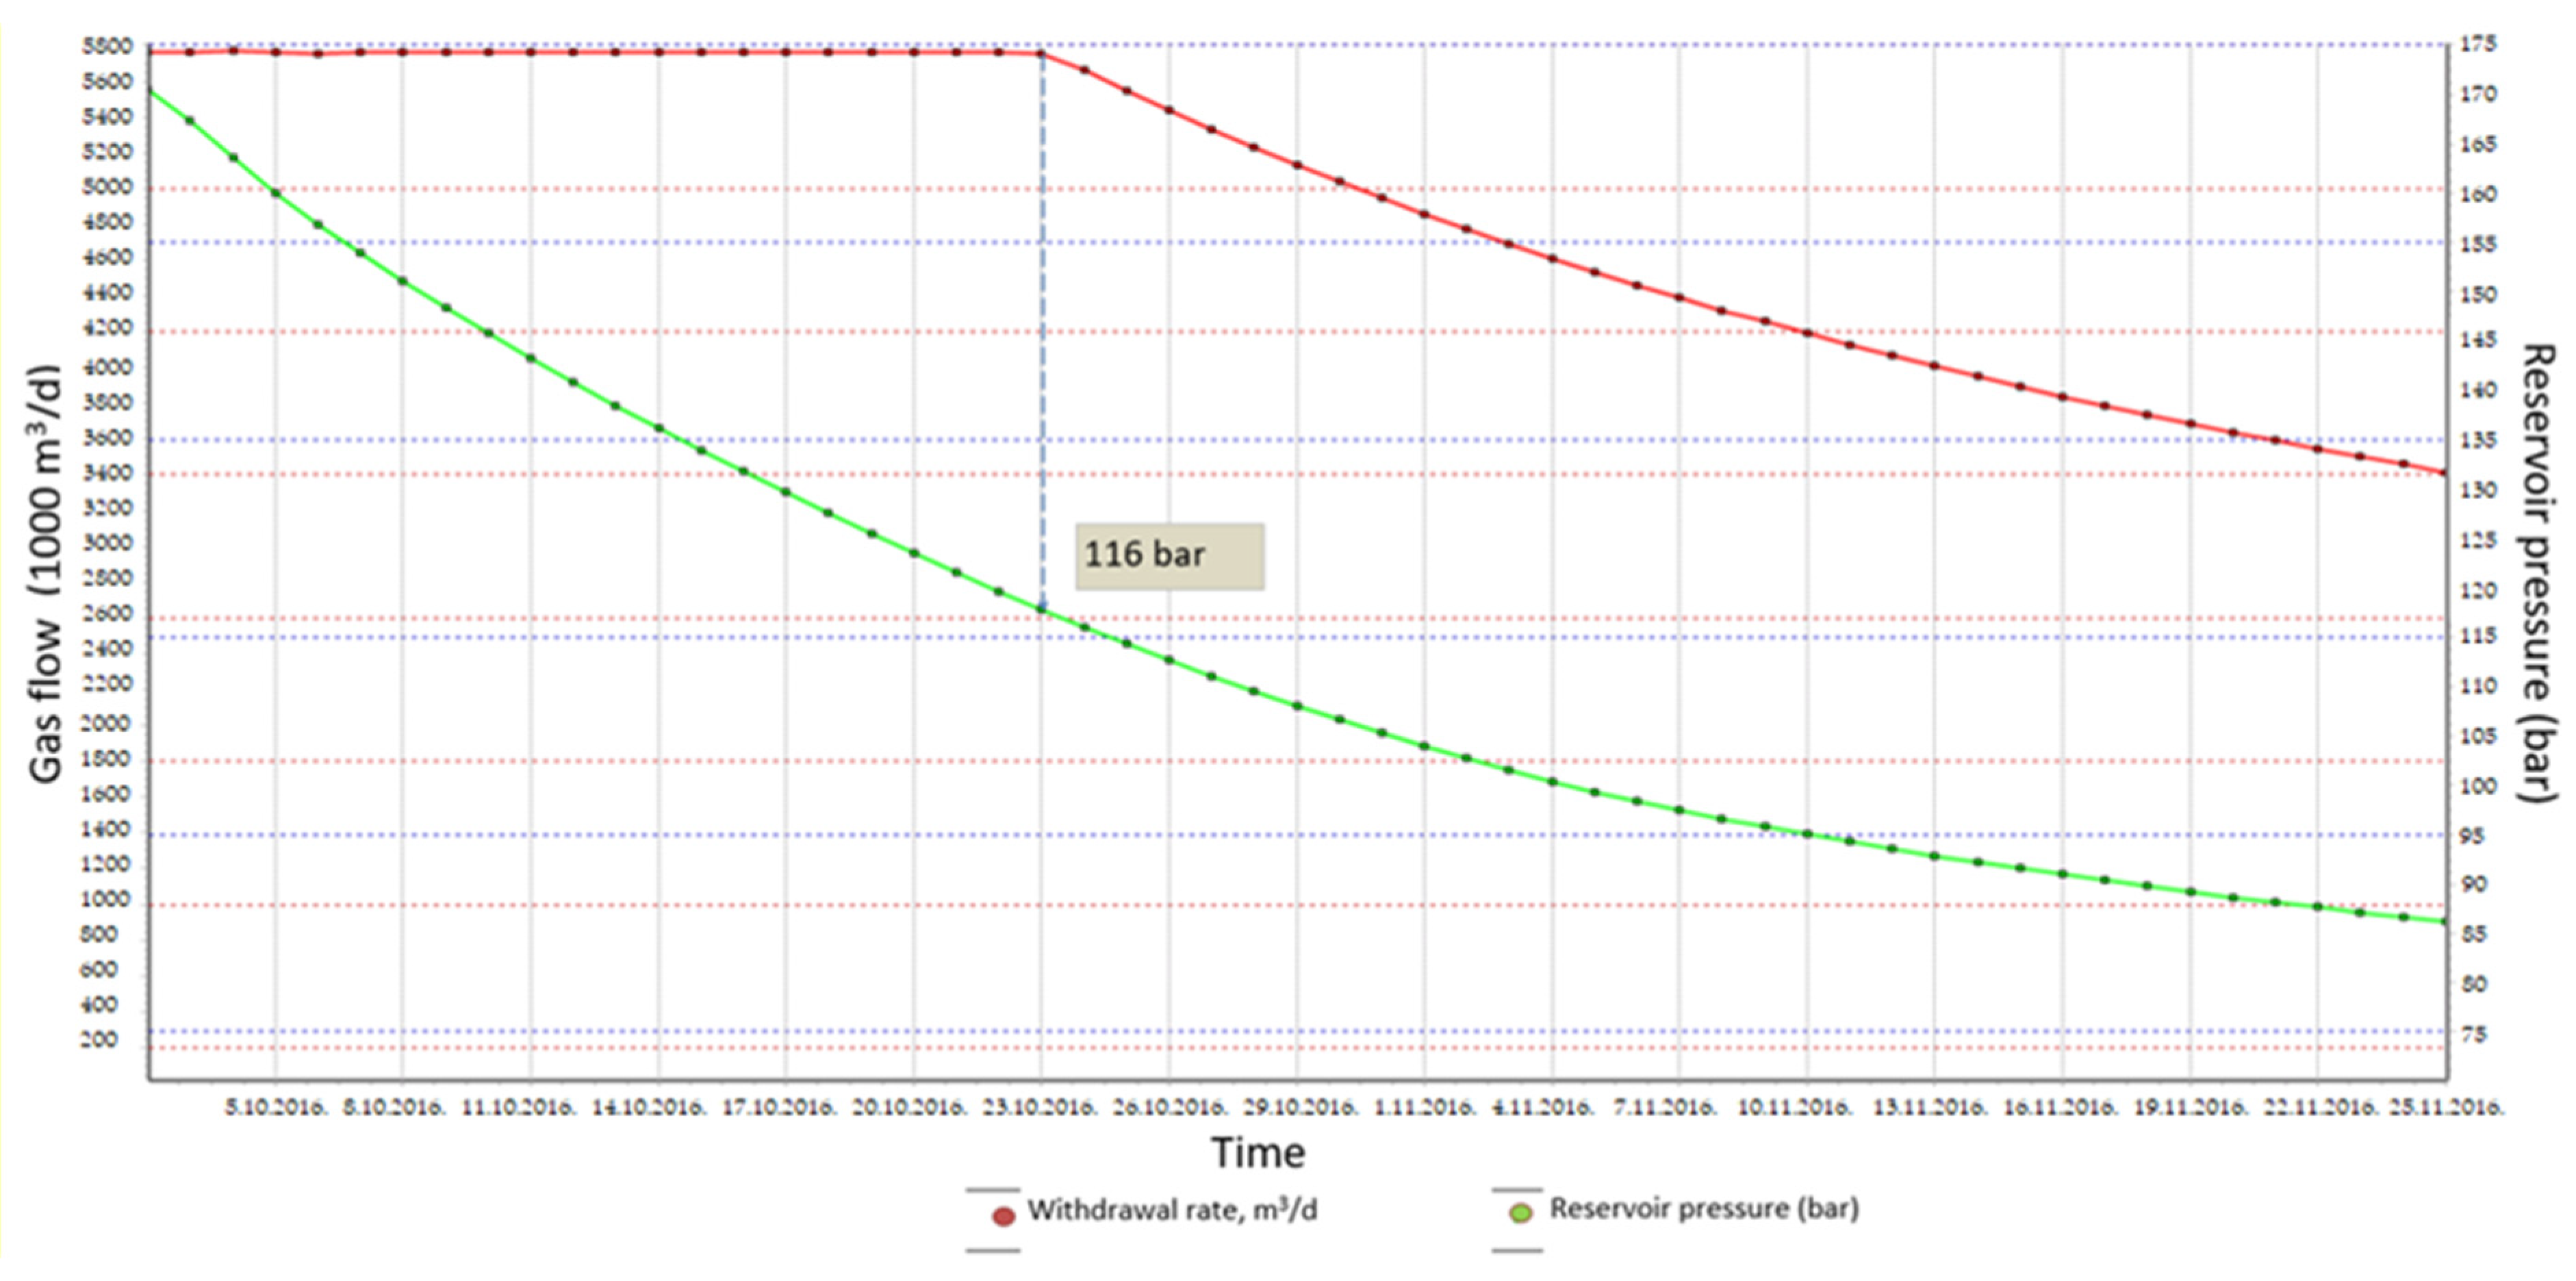
Maximum withdrawal gas rate = 5,760,000 m3/d;
-
Minimum reservoir pressure = 80 bar;
-
Maximum reservoir pressure = 196 bar;
-
Minimum wellhead pressure = 55 bar;
-
Maximum downhole pressure = 212 bar;
-
Injection cycle starts at the beginning of April and ends at the beginning of October;
-
Withdrawal cycle starts at the beginning of October and ends at the beginning of April.
The flow-line network (surface model) connecting storage wells to the first-stage gas separator is represented by the steady-state thermodynamic model, where input data vary with time because they are determined by the reservoir model. In this model, GAP is used to calculate pressure loss in the pipeline. The pressure drop is solved through back-calculation using the Weymouth equation [18]. Surface-pipeline model assumes the following assumptions:
-
Steady-state horizontal flow;
-
Kinetic component of pressure gradient is negligible;
-
Heat transfer to the ground is assumed to be at steady state and the same material is assumed for all pipes;
-
The outlet pressure and temperature are calculated based on incremental energy and mass balances.
Figure 2 and Figure 3 show a surface model built in GAP software, both for gas withdrawal and the injection process. Chokes (SAP#1, SAP#2 and SAP#3) are present only in the withdrawal process model. In Table 1, pipeline data are indicated in more detail.

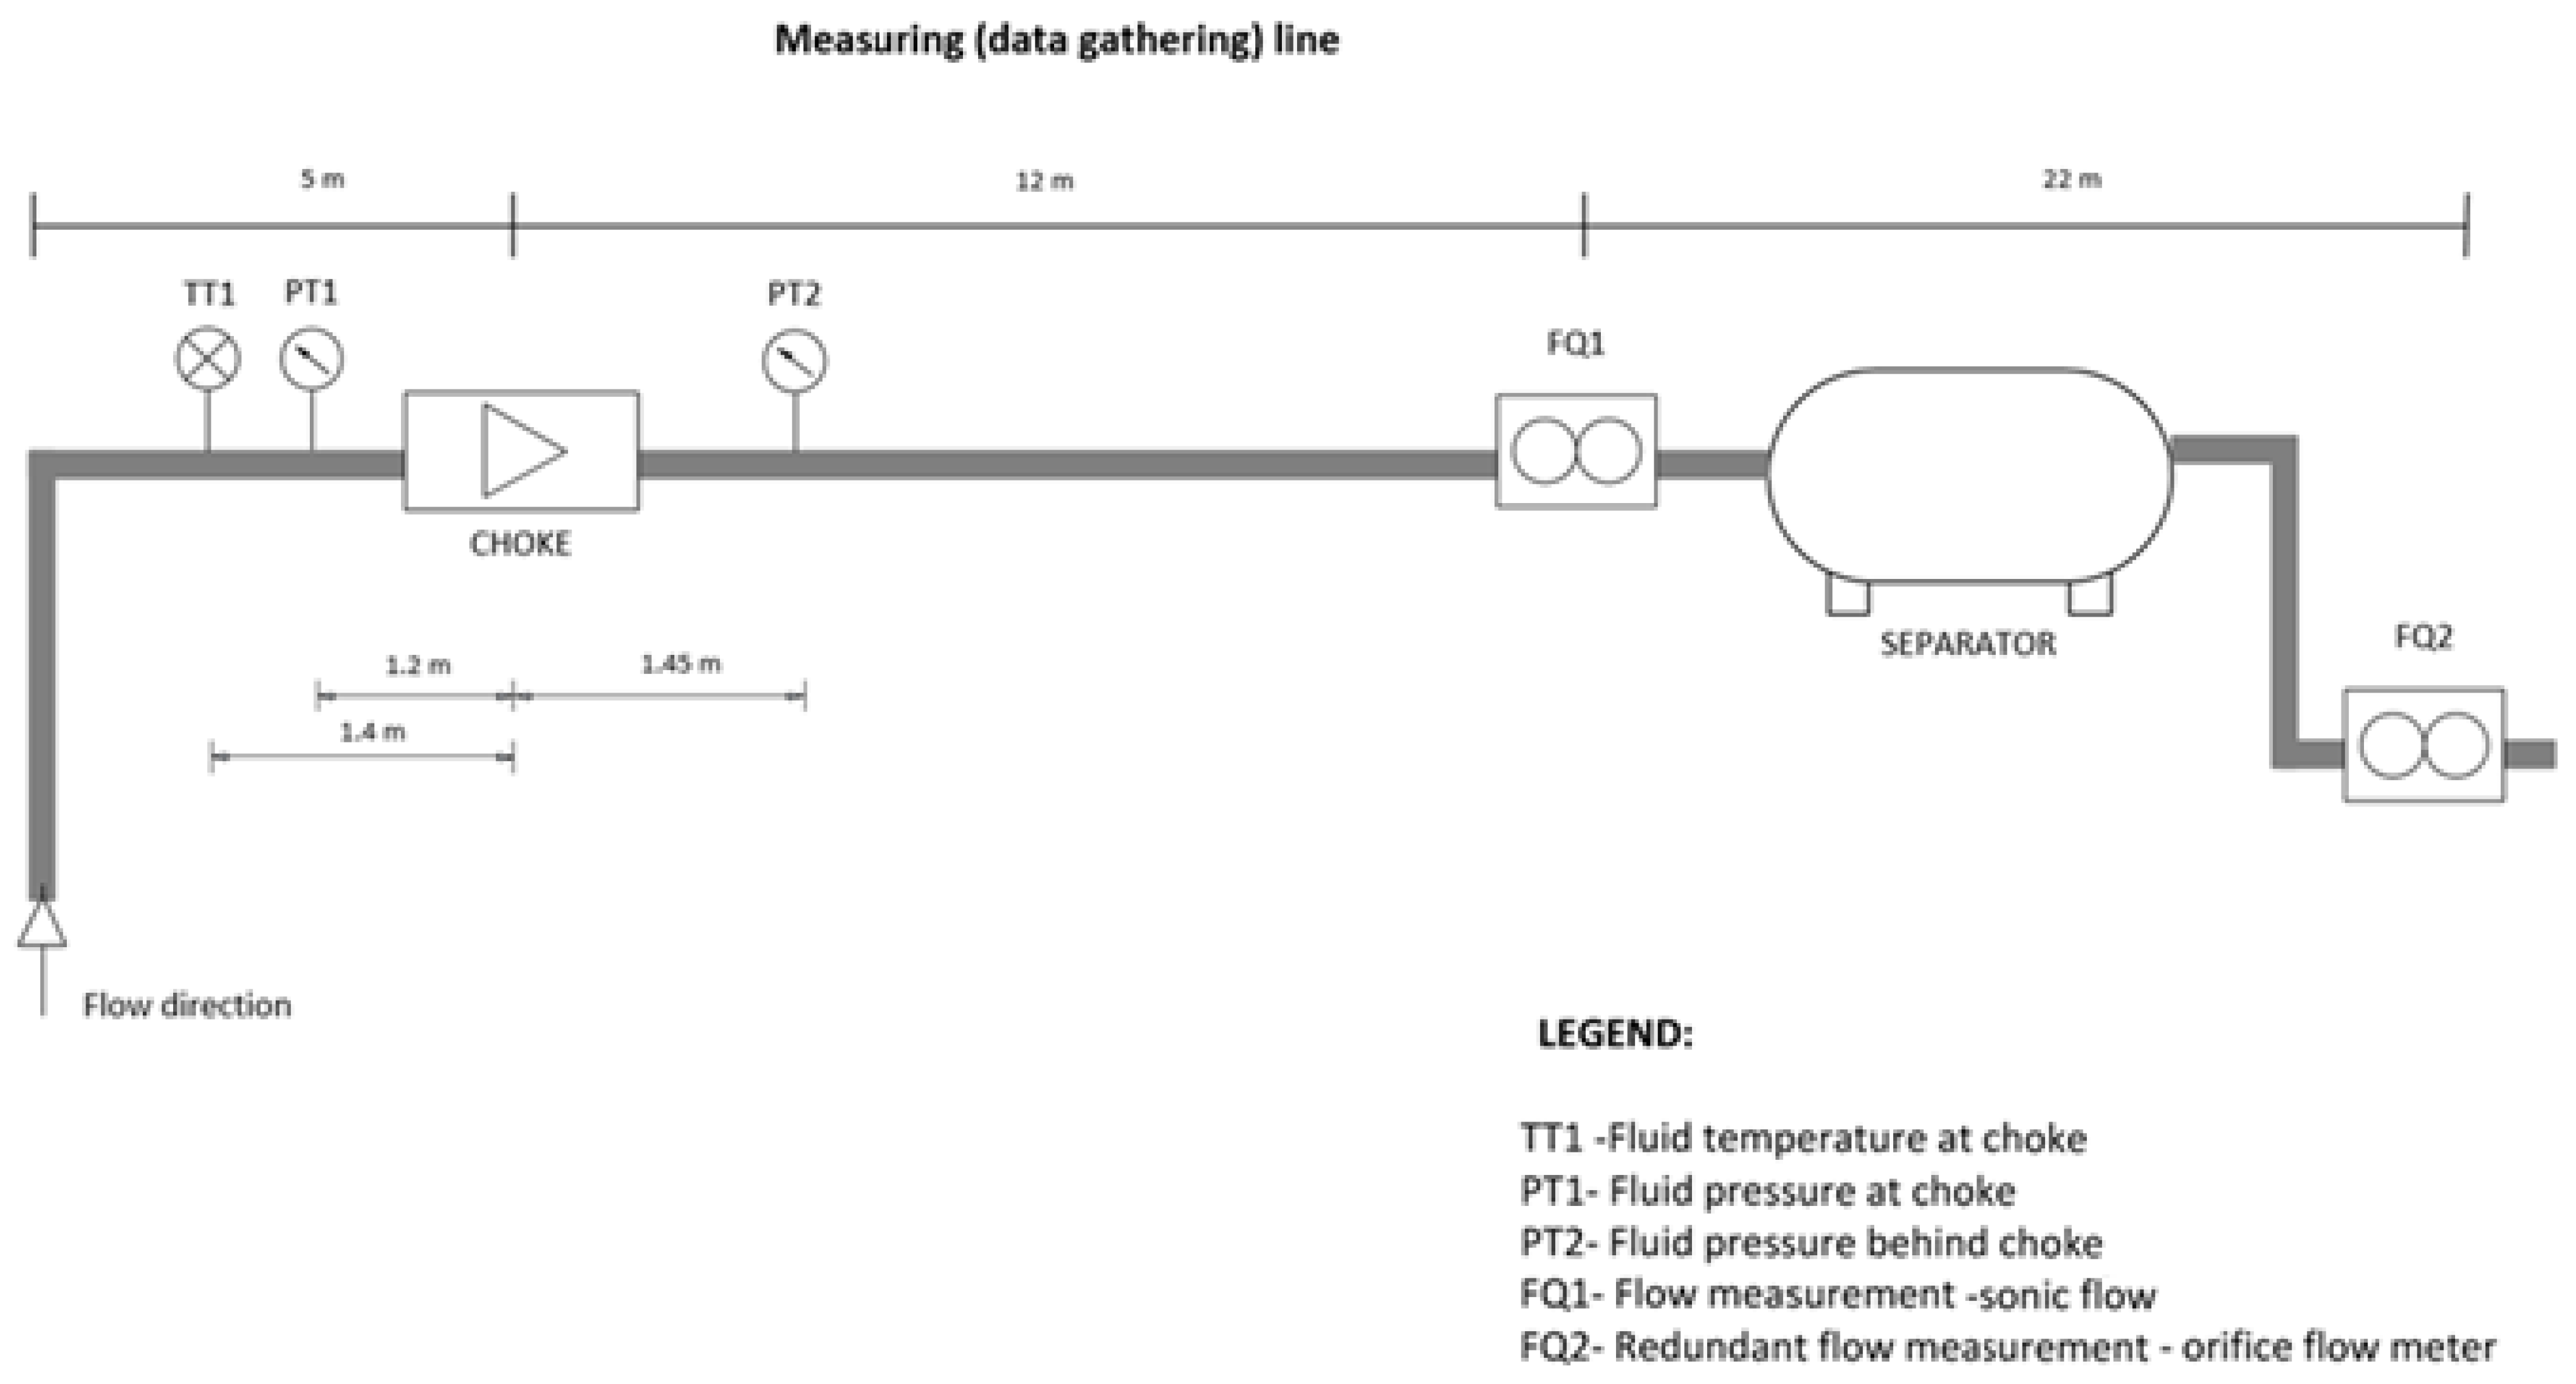
4.2. Experimental Determination of Choke Discharge Coefficient

Discharge coefficient was determined analytically using measured data of pressure drop across fully opened chokes during gas flow. In order to eliminate any background noise that could cause data error, measured data were acquired after flow stabilisation (see Figure 4). Gas volume flow was measured in position after the choke with two flow measuring devices (ultrasonic meter and orifice) according to Figure 4. The accuracy of the measurement was around ±0.5%. Measurement data incorporate a full range of dynamic pressures and volume flows that may occur during the gas storage operation.
The discharge coefficient for wellhead and process chokes is calculated using Equation (1) and the measurement results of the pressure drop across chokes during the gas storage withdrawal cycle [17].
q = π d 2 p 1 T s c 4 p s c 2 C d 2 κ κ 1 R γ g M a Z 1 T 1       [ ( p 2 p 1 ) 2 κ ( p 2 p 1 ) κ 1 κ ]                          
where:
  • Cd = discharge coefficient;
  • Z = compressibility factor;
  • T1 = gas temperature before nozzle, K;
  • Ma = molar mass of air, 28.966 × 10⁻³ kg/mol;
  • R = general gas constant, 8.3145 J K−1 mol−1;
  • γg = relative gas density;
  • Tsc = standard temperature, K;
  • psc = standard pressure, Pa;
  • D = diameter of the nozzle opening, m;
  • κ = adiabatic exponent, defined by the specific heat ratio cp/cv;
  • p1 = gas pressure before nozzle, Pa;
  • p2 = gas pressure after nozzle, Pa.
Specific heat values (cp, cv) for natural gas and z factor at referent PT conditions are calculated using Peng and Robinson equation of state (EOS).

4.3. Model Simulation Scenarios

The influence of restriction diameters on gas storage parameters was investigated with two scenarios whose simulation results were compared with the basic scenario (matched on real gas storage data). The base case scenario was designed on the basis of gas storage production/injection data from all existing wells. Twenty-two wells are working wells (producer/injection), and two of them are water injectors. The base case scenario will be run until 2022 and used for comparison with all other cases. The purpose of the base case model simulation scenario is to simulate the actual flow parameters of the UGS facility. To prove the hypothesis, within the mathematical model, two test scenarios were created. The scenarios’ results were then analysed and compared with the base case scenario. The optimisation of the injector/producers rates, wellhead chokes, process chokes and production string diameters are the main issues that have been investigated. Maximum permissible reservoir pressure drawdown on all storage wells of 3 MPa was implemented within all the simulation scenarios. In all the scenarios, the end part of the withdrawal simulation model is input–output separator with a fixed pressure of 4 MPa. Additionally, in the injection cycle model, the input/output gas water separator represents the starting point of the model as compressor fixed suction pressure. The two other production scenarios analyse the impact of production equipment sizing on UGS working capabilities. Production equipment diameters for the applied scenarios are shown in Table 2. In all simulation scenarios, production equipment diameters for other wells not mentioned in Table 2 have the same tubing diameter. This also applies to the diameter of the wellhead and the process chokes. All these scenarios will be run until 2022.
Case 1
In scenario 1 (model), the production string (tubing) internal diameter of the selected wells (Table 2) was set to 0.1016 m. All other gas storage wells have a “base case” internal tubing diameters set to 0.076 m. The wellhead and process reduction station chokes diameters were set to 0.0254 m and 0.054 m. This was completed to investigate the impact of a tubing’s internal diameter on gas storage withdrawal capabilities.
Case 2
In scenario 2, the production string (tubing) internal diameter for all gas storage wells was set to 0.076 m. The diameter of the wellhead and the process reduction station chokes were set to 0.05 m and 0.072 m. This was completed to investigate the impact of a choke’s internal diameter on gas storage withdrawal capabilities.

5. Data Presentation and Analysis of Results

There are two sets of results shown in this chapter. First are the results related to the discharge coefficient calculation (when chokes are fully opened). Those results are obtained during pressure drop measurement across a choke. Second are the simulation scenarios’ results, and they are shown later in this paper.

5.1. Discharge Coefficient Calculation and Results

Combining measurement data and Equation (1), the discharge coefficient for UGS chokes was calculated (Table 3). After obtaining the universal value of Cd, further calculation of the pressure drop on chokes was performed in order to select proper Choke ID for the case 2 model scenario. Pressure drop calculation with the obtained Cd value for different choke diameters is shown later in the text.
The average value of discharge coefficient for wellhead and process chokes was 0.76, and that value was implemented in the simulation model.

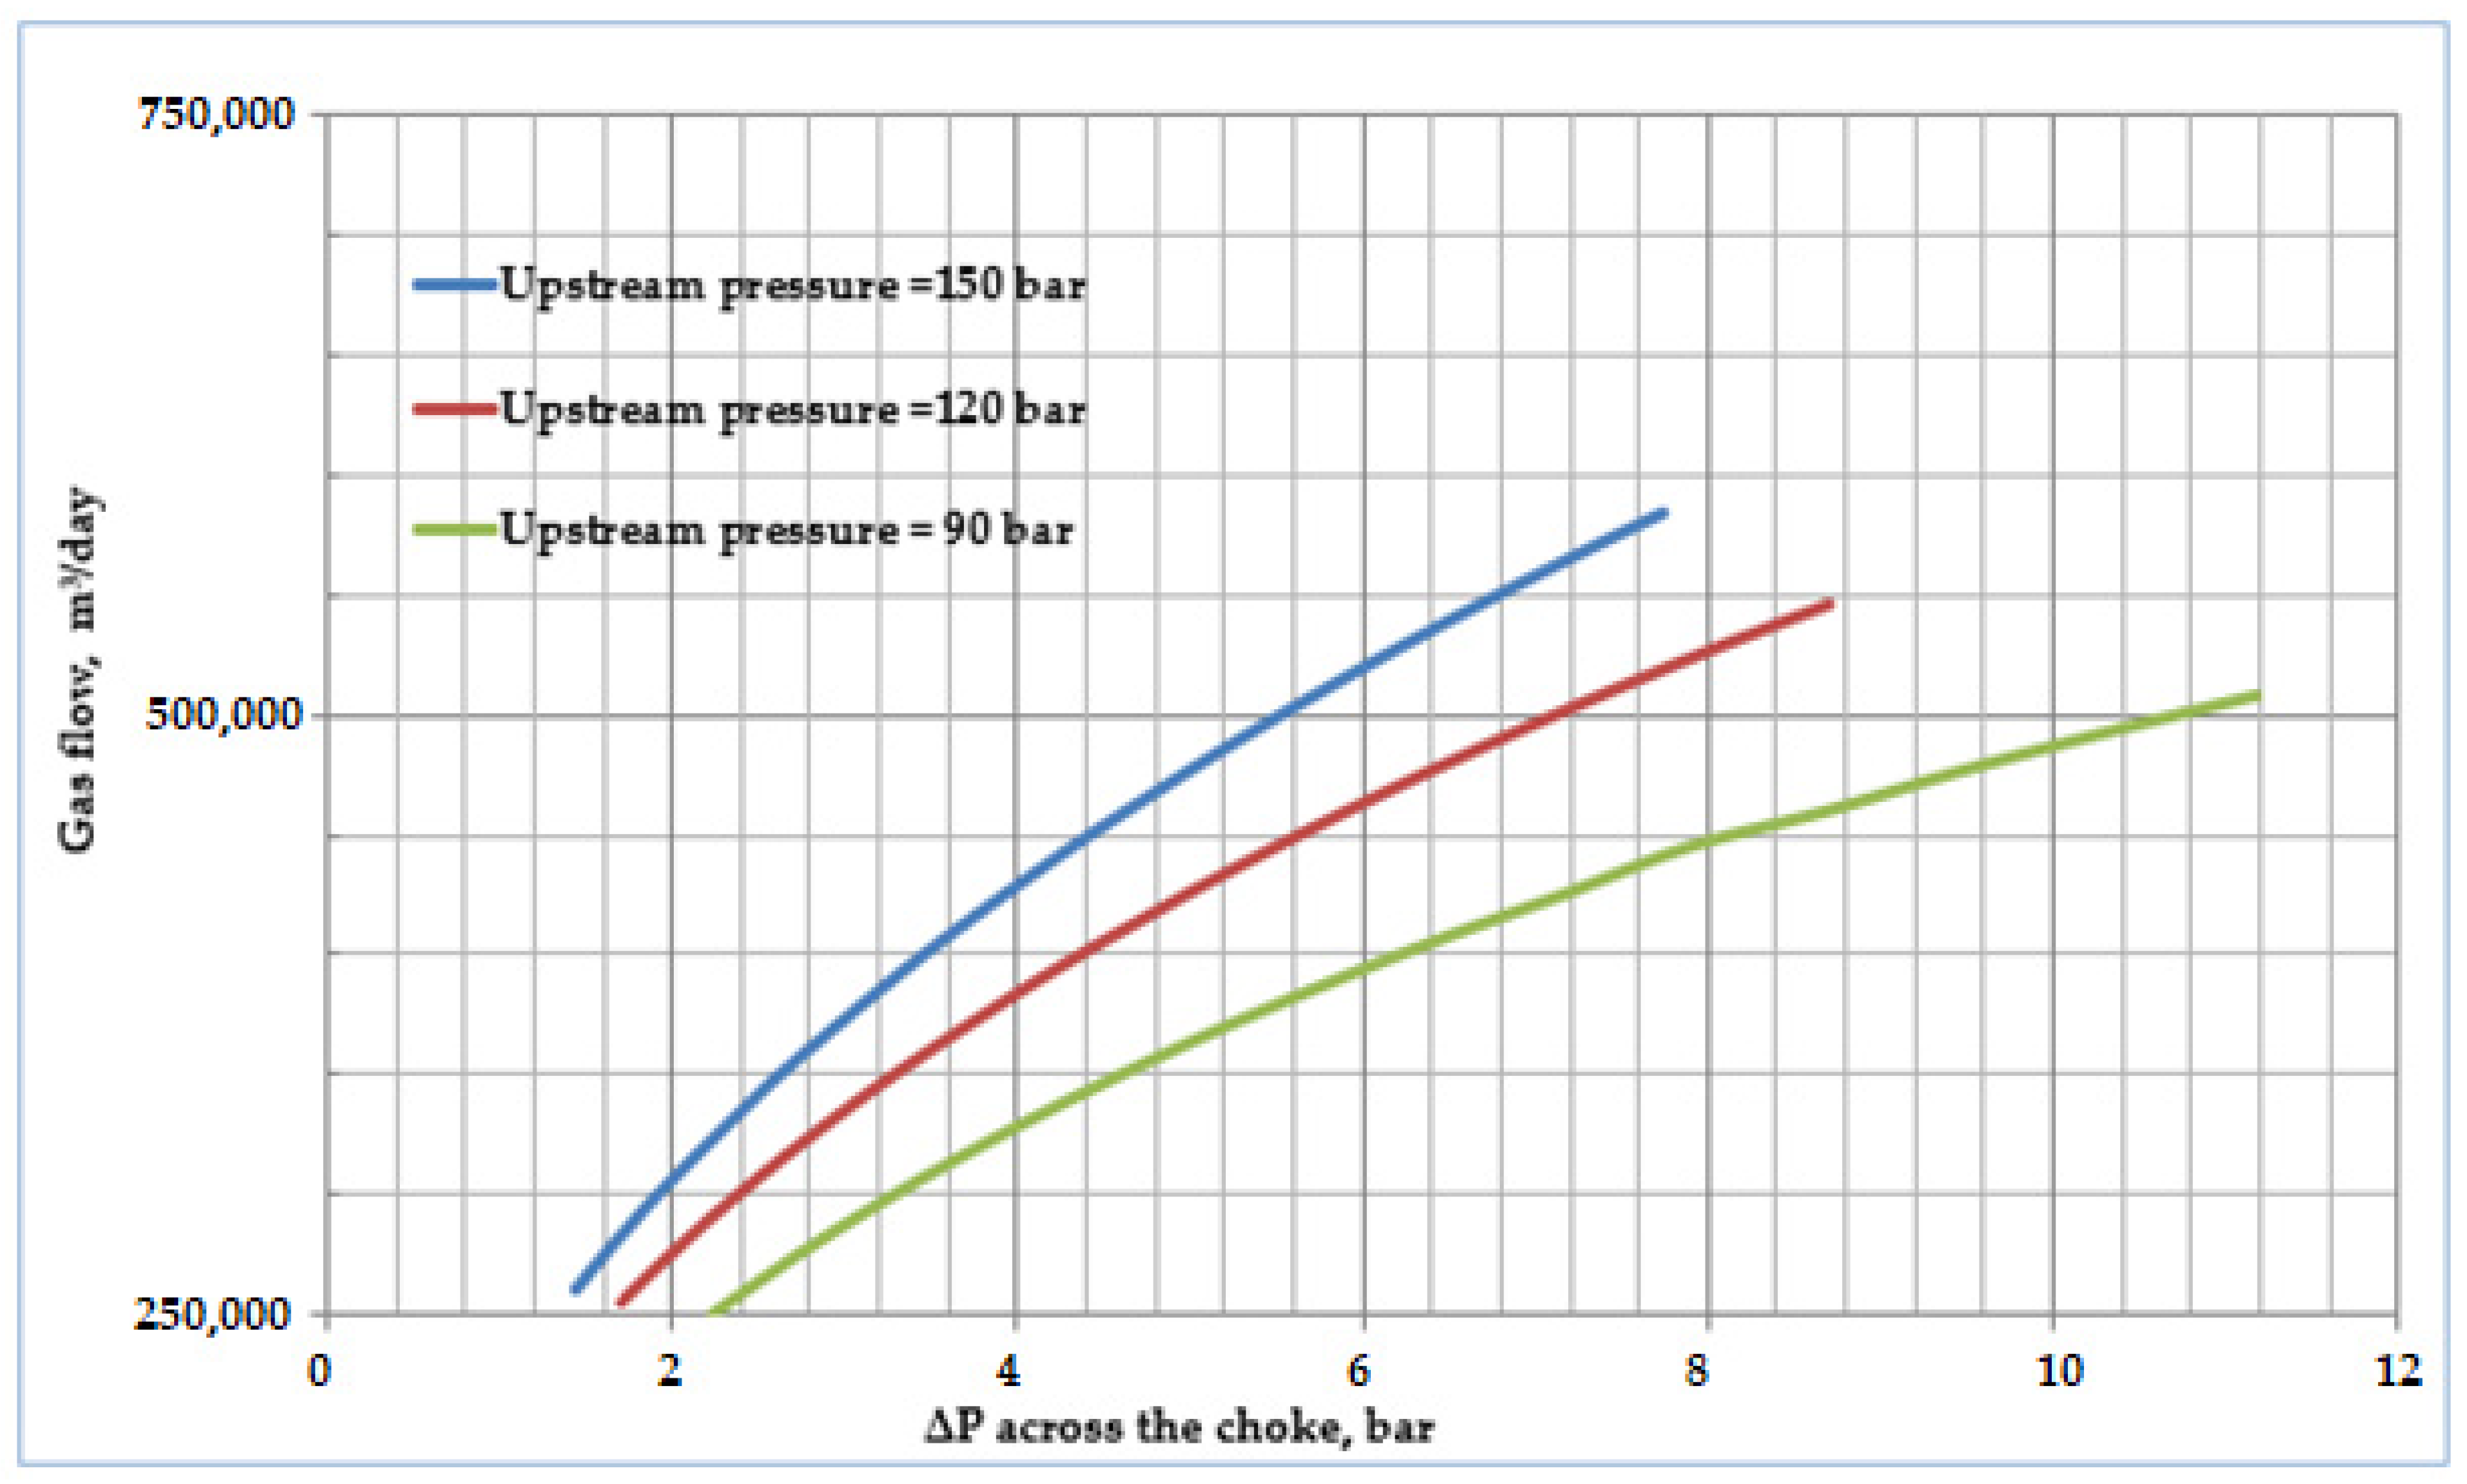
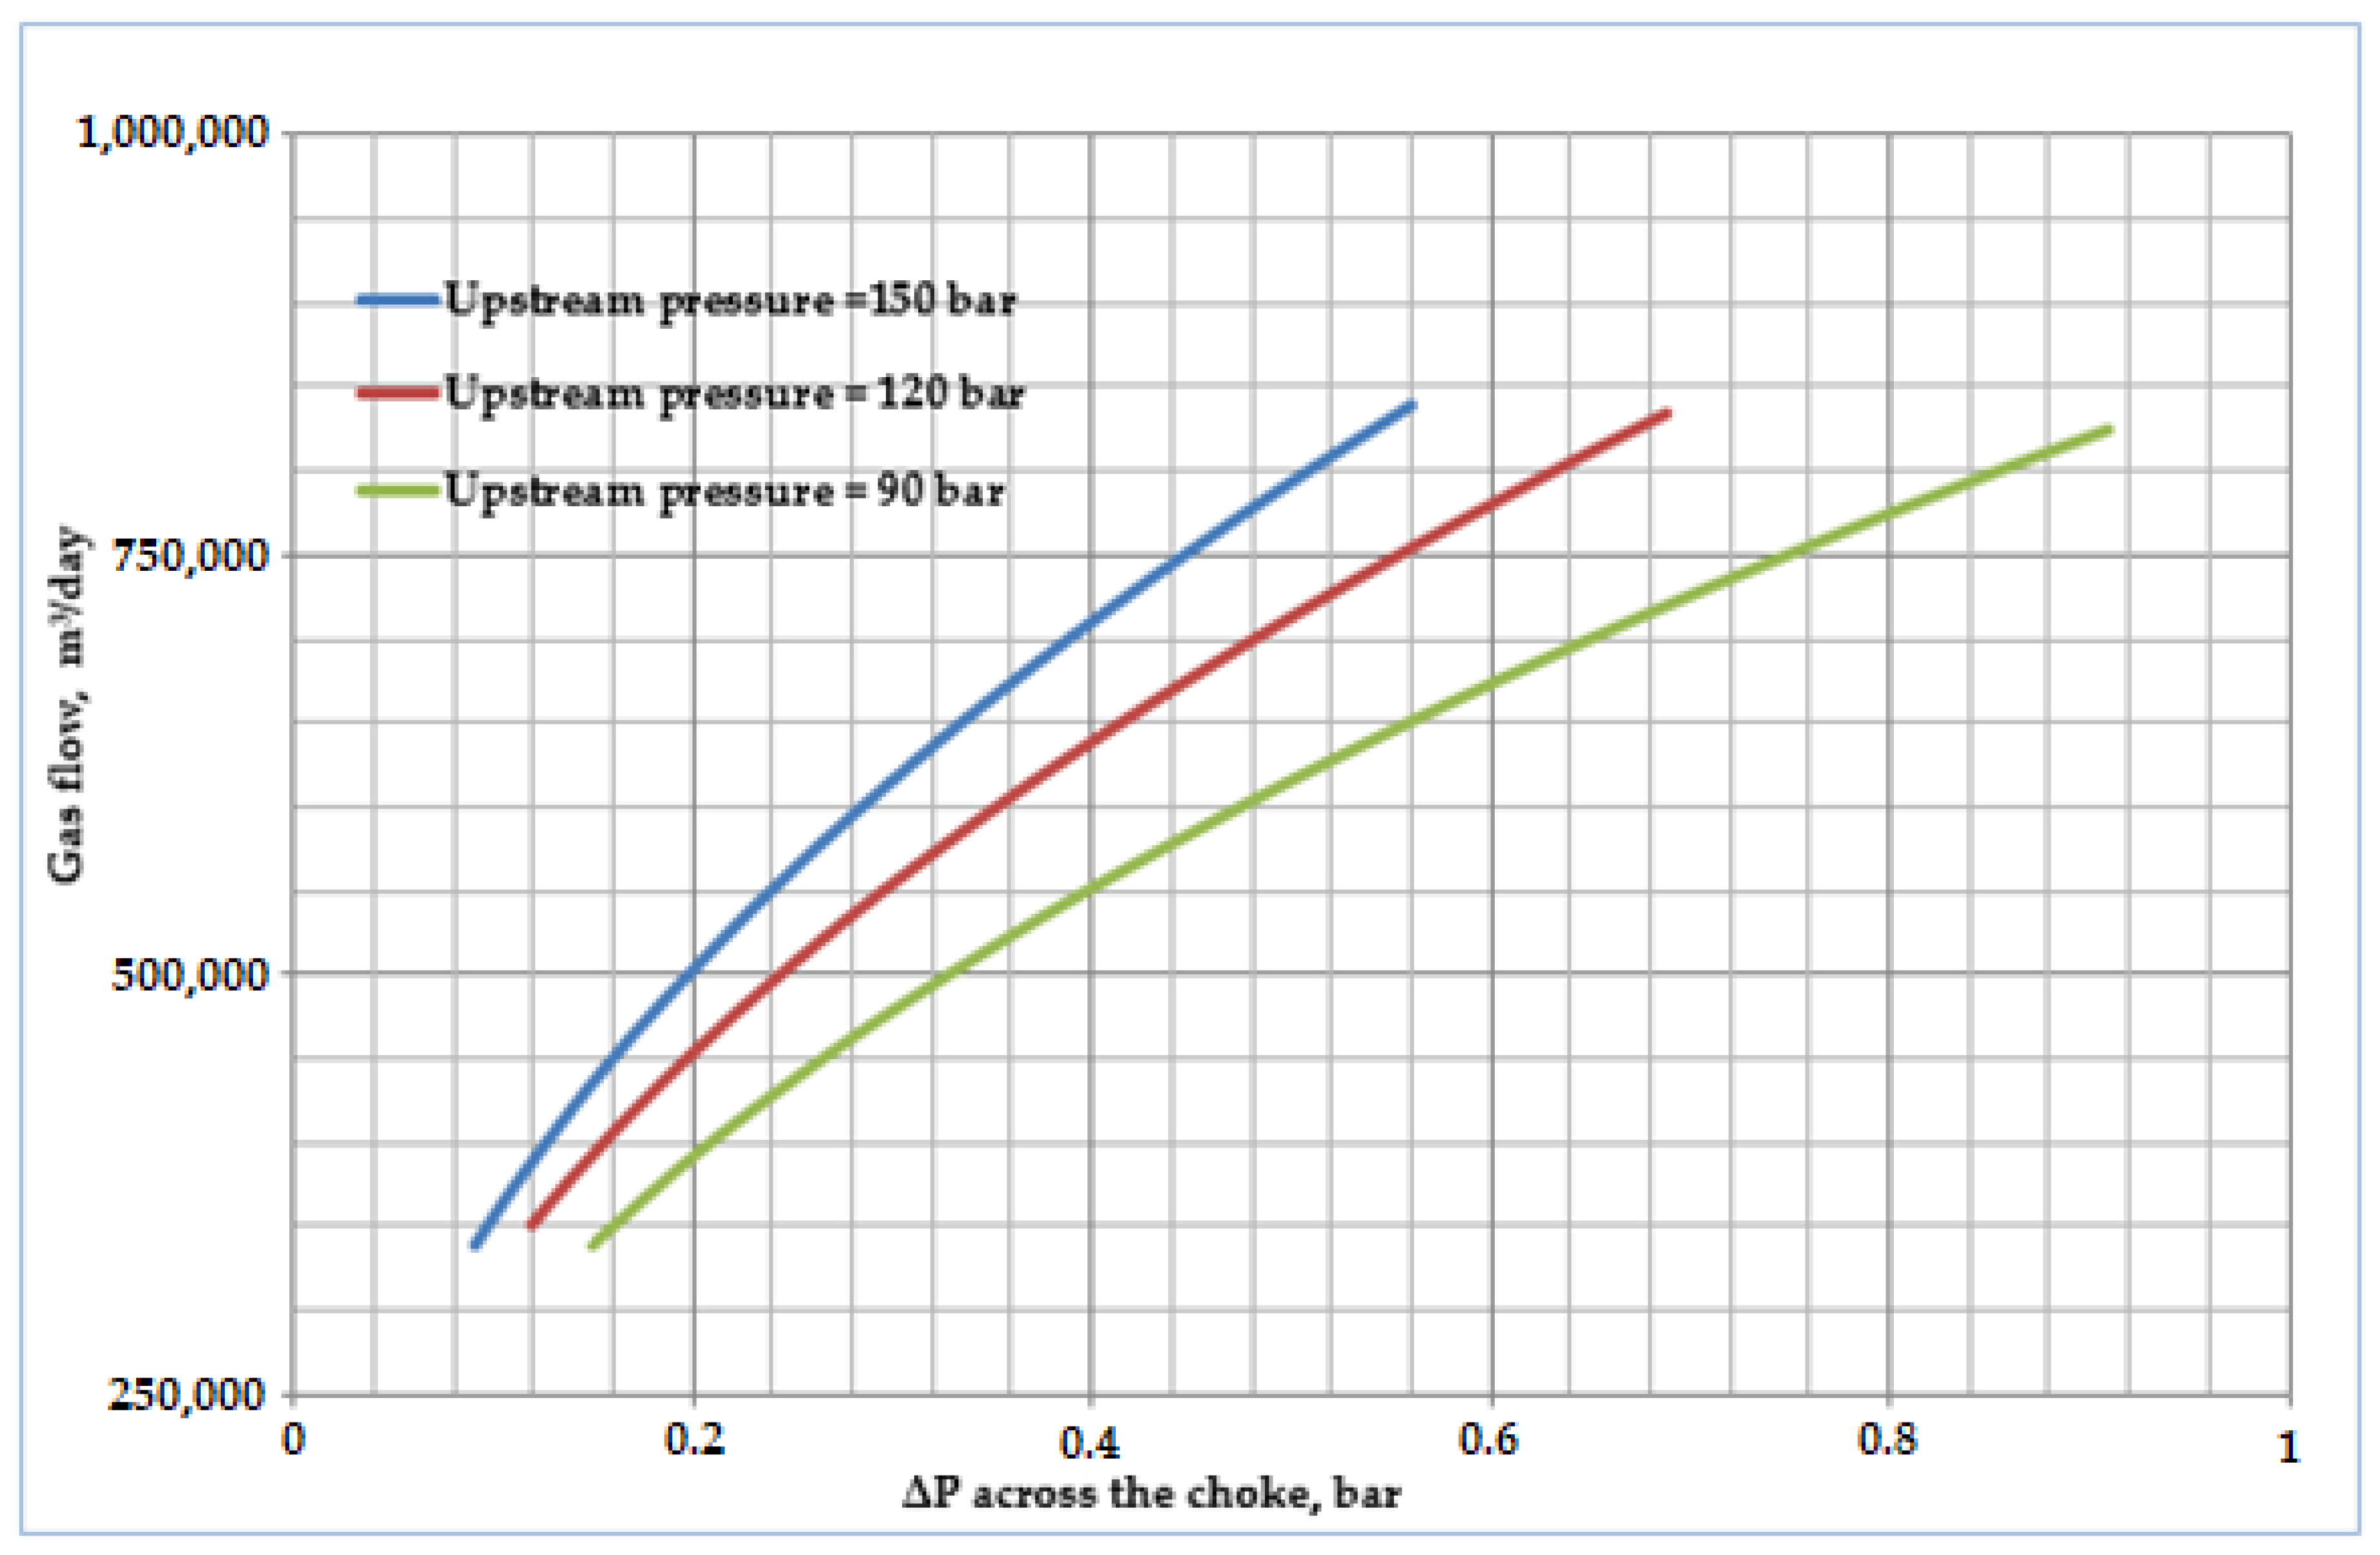
5.2. Influence of Choke Diameter on Head Loss

Using Equation (1) for gas flow through the choke and the obtained average discharge coefficient value of 0.76, the dependence of volume gas flow entering the choke and ΔP across restriction was calculated for various inlet pressures. The results are shown in Table 4, Table 5, Table 6, Table 7, Table 8 and Table 9 and Figure 5 and Figure 6.

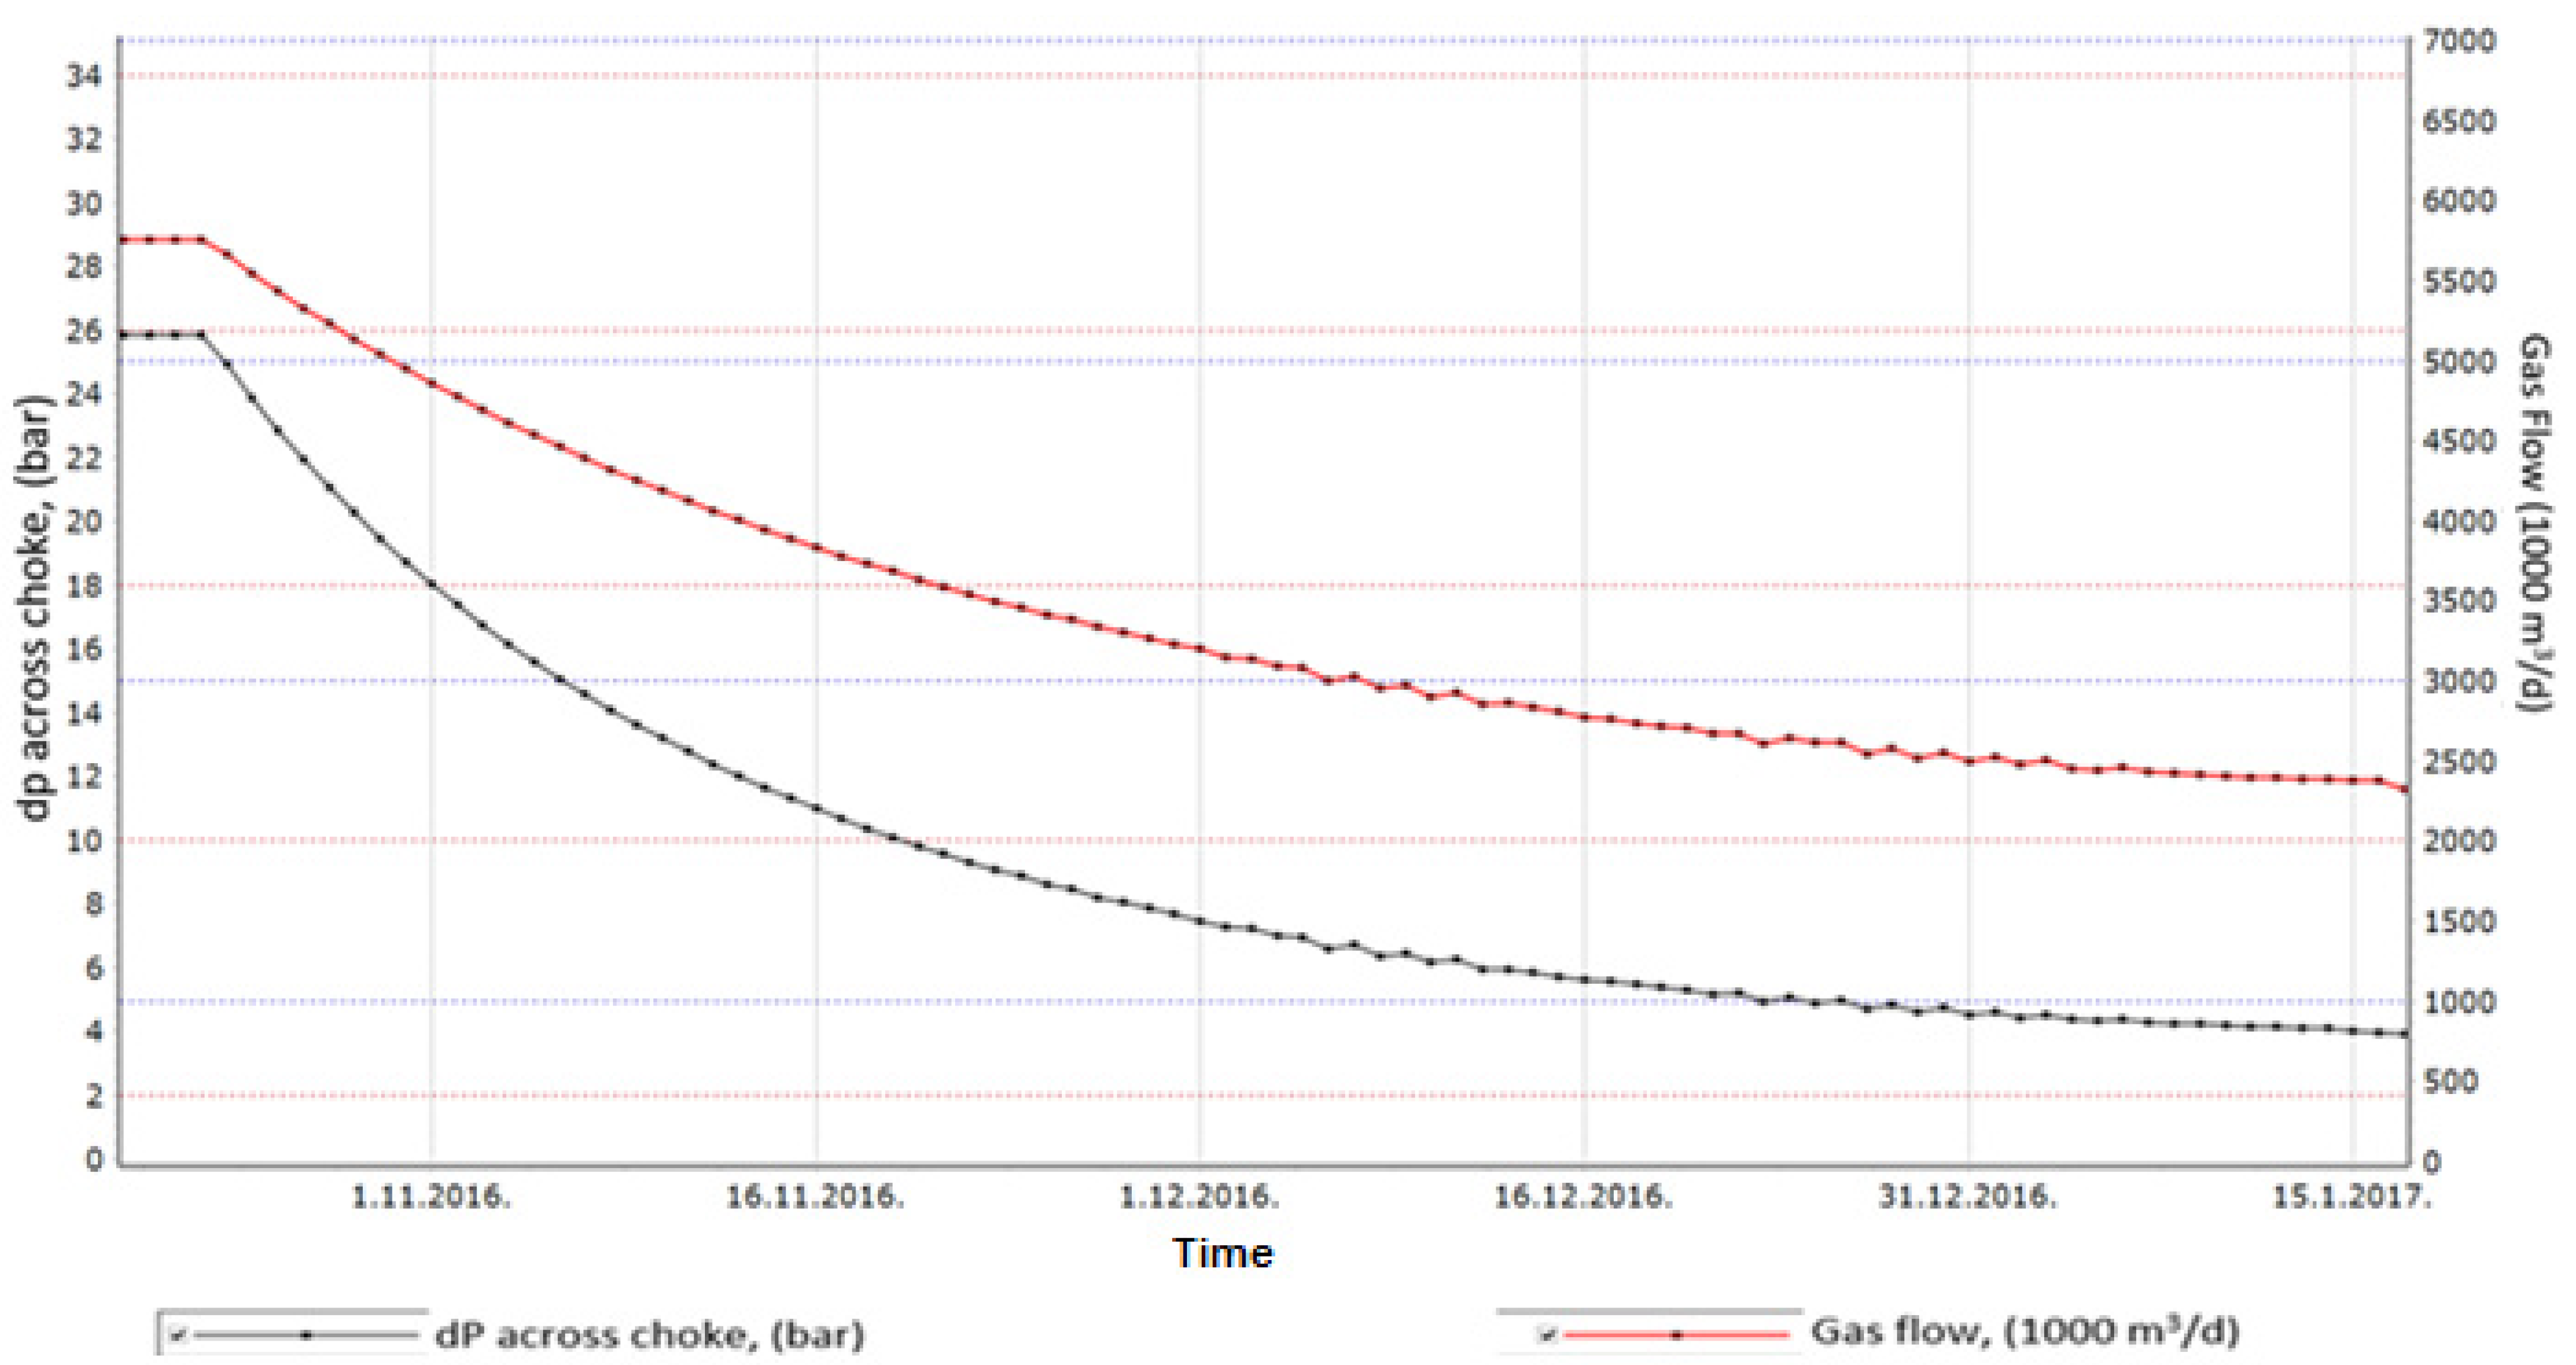
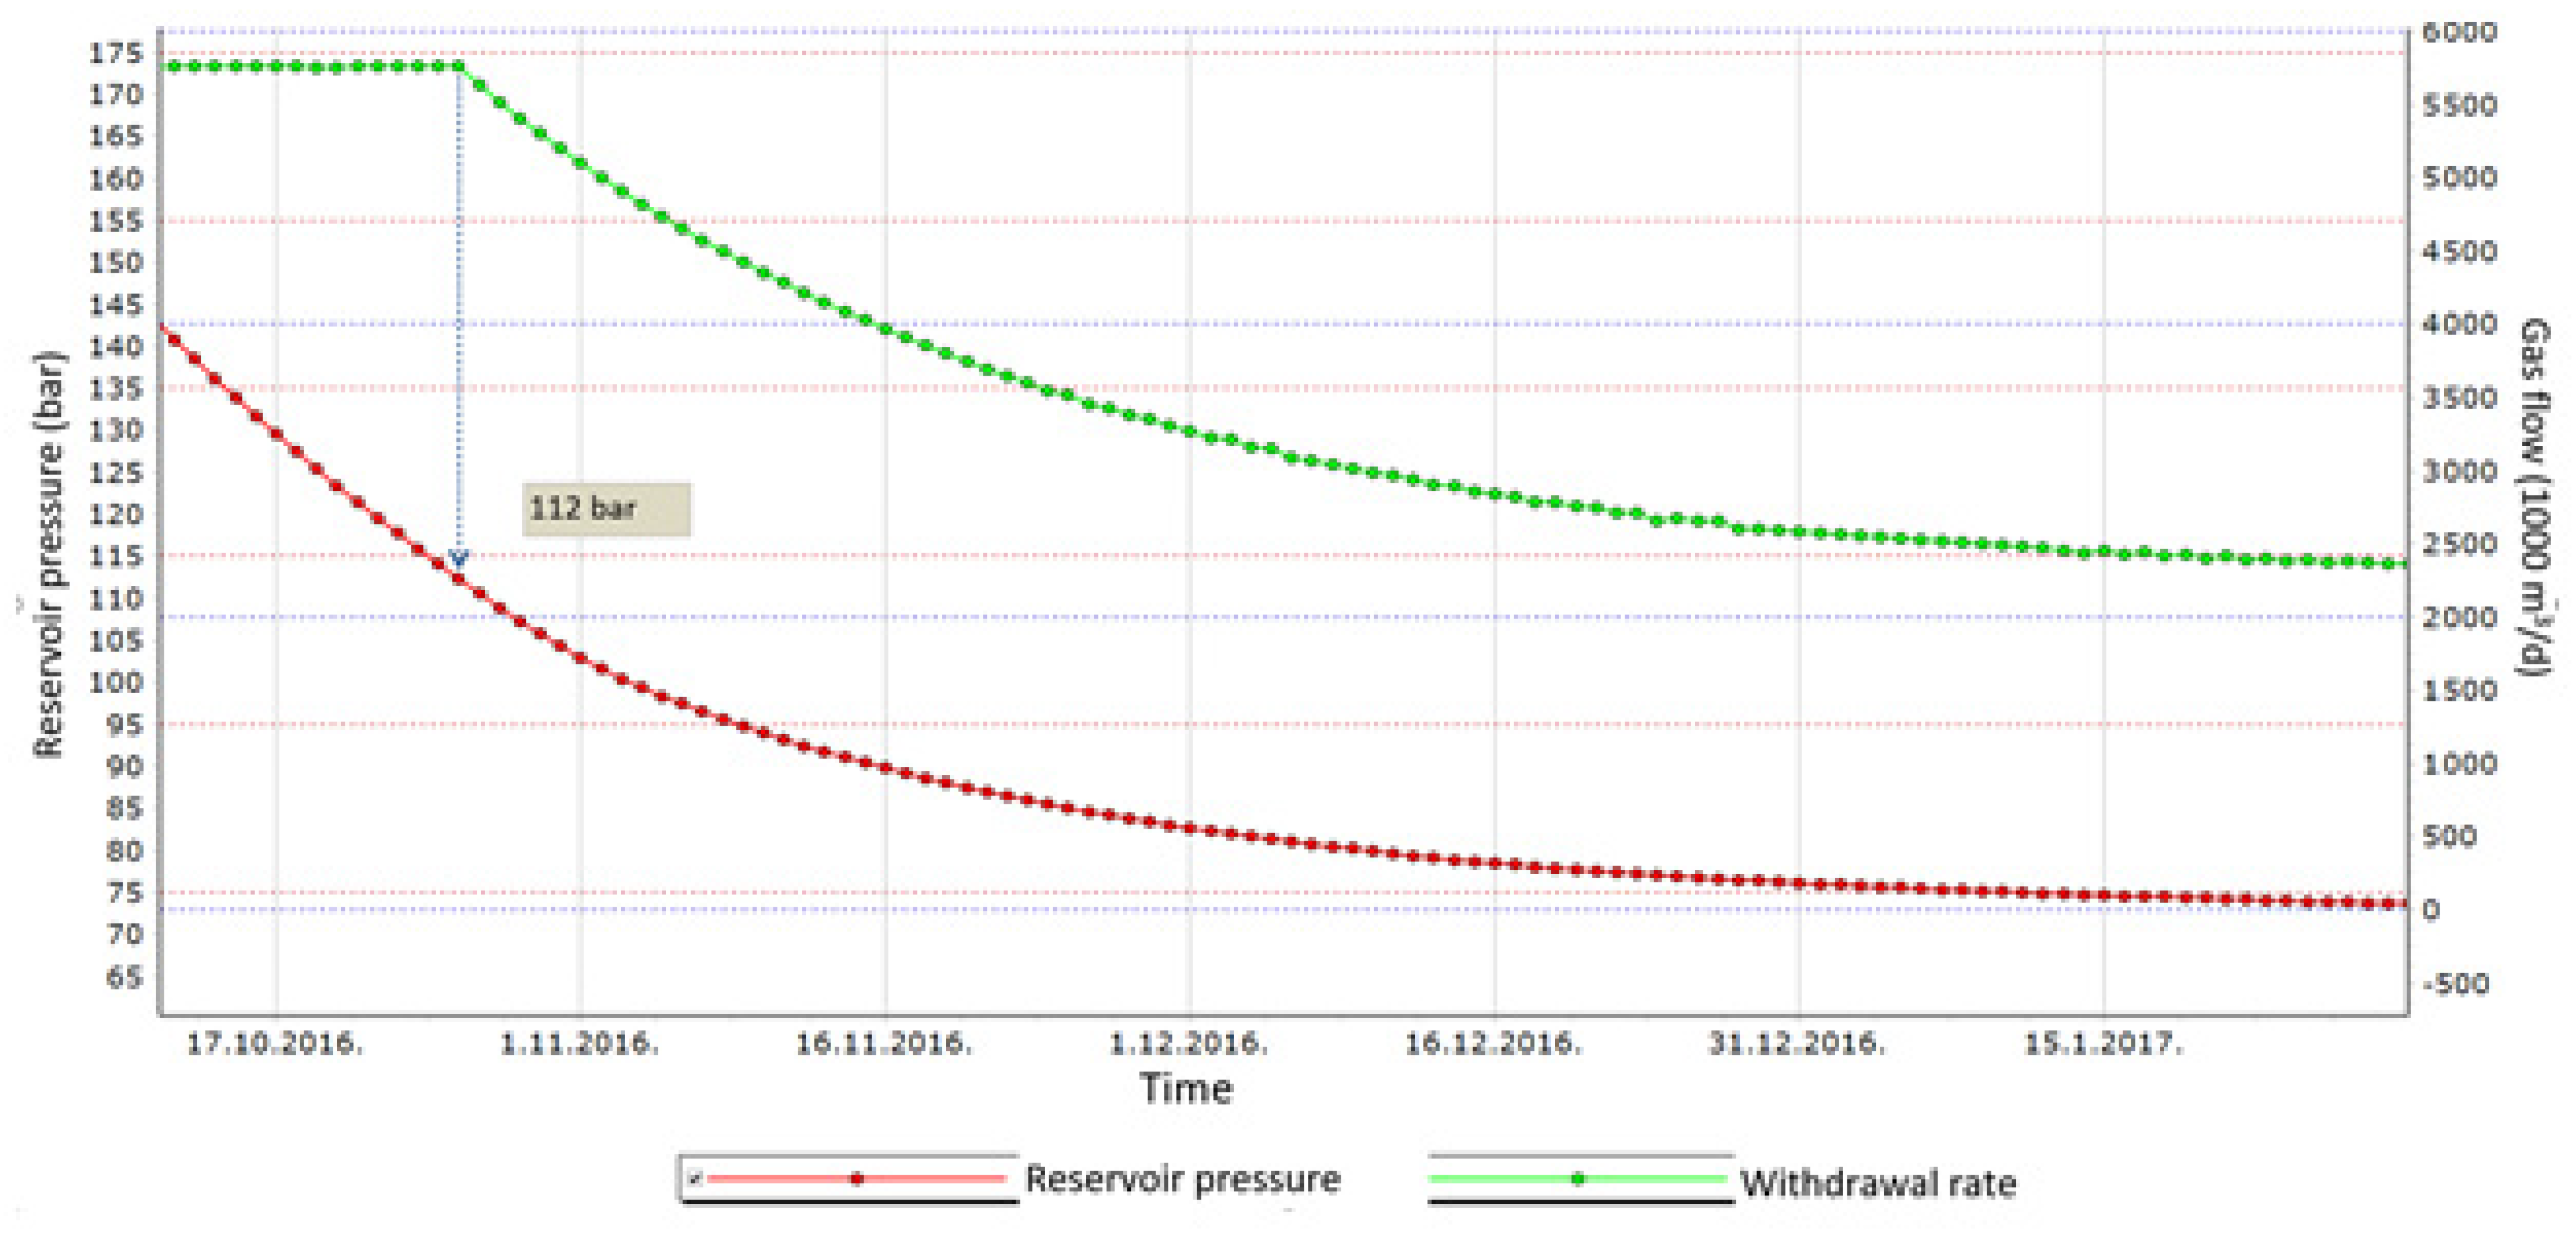
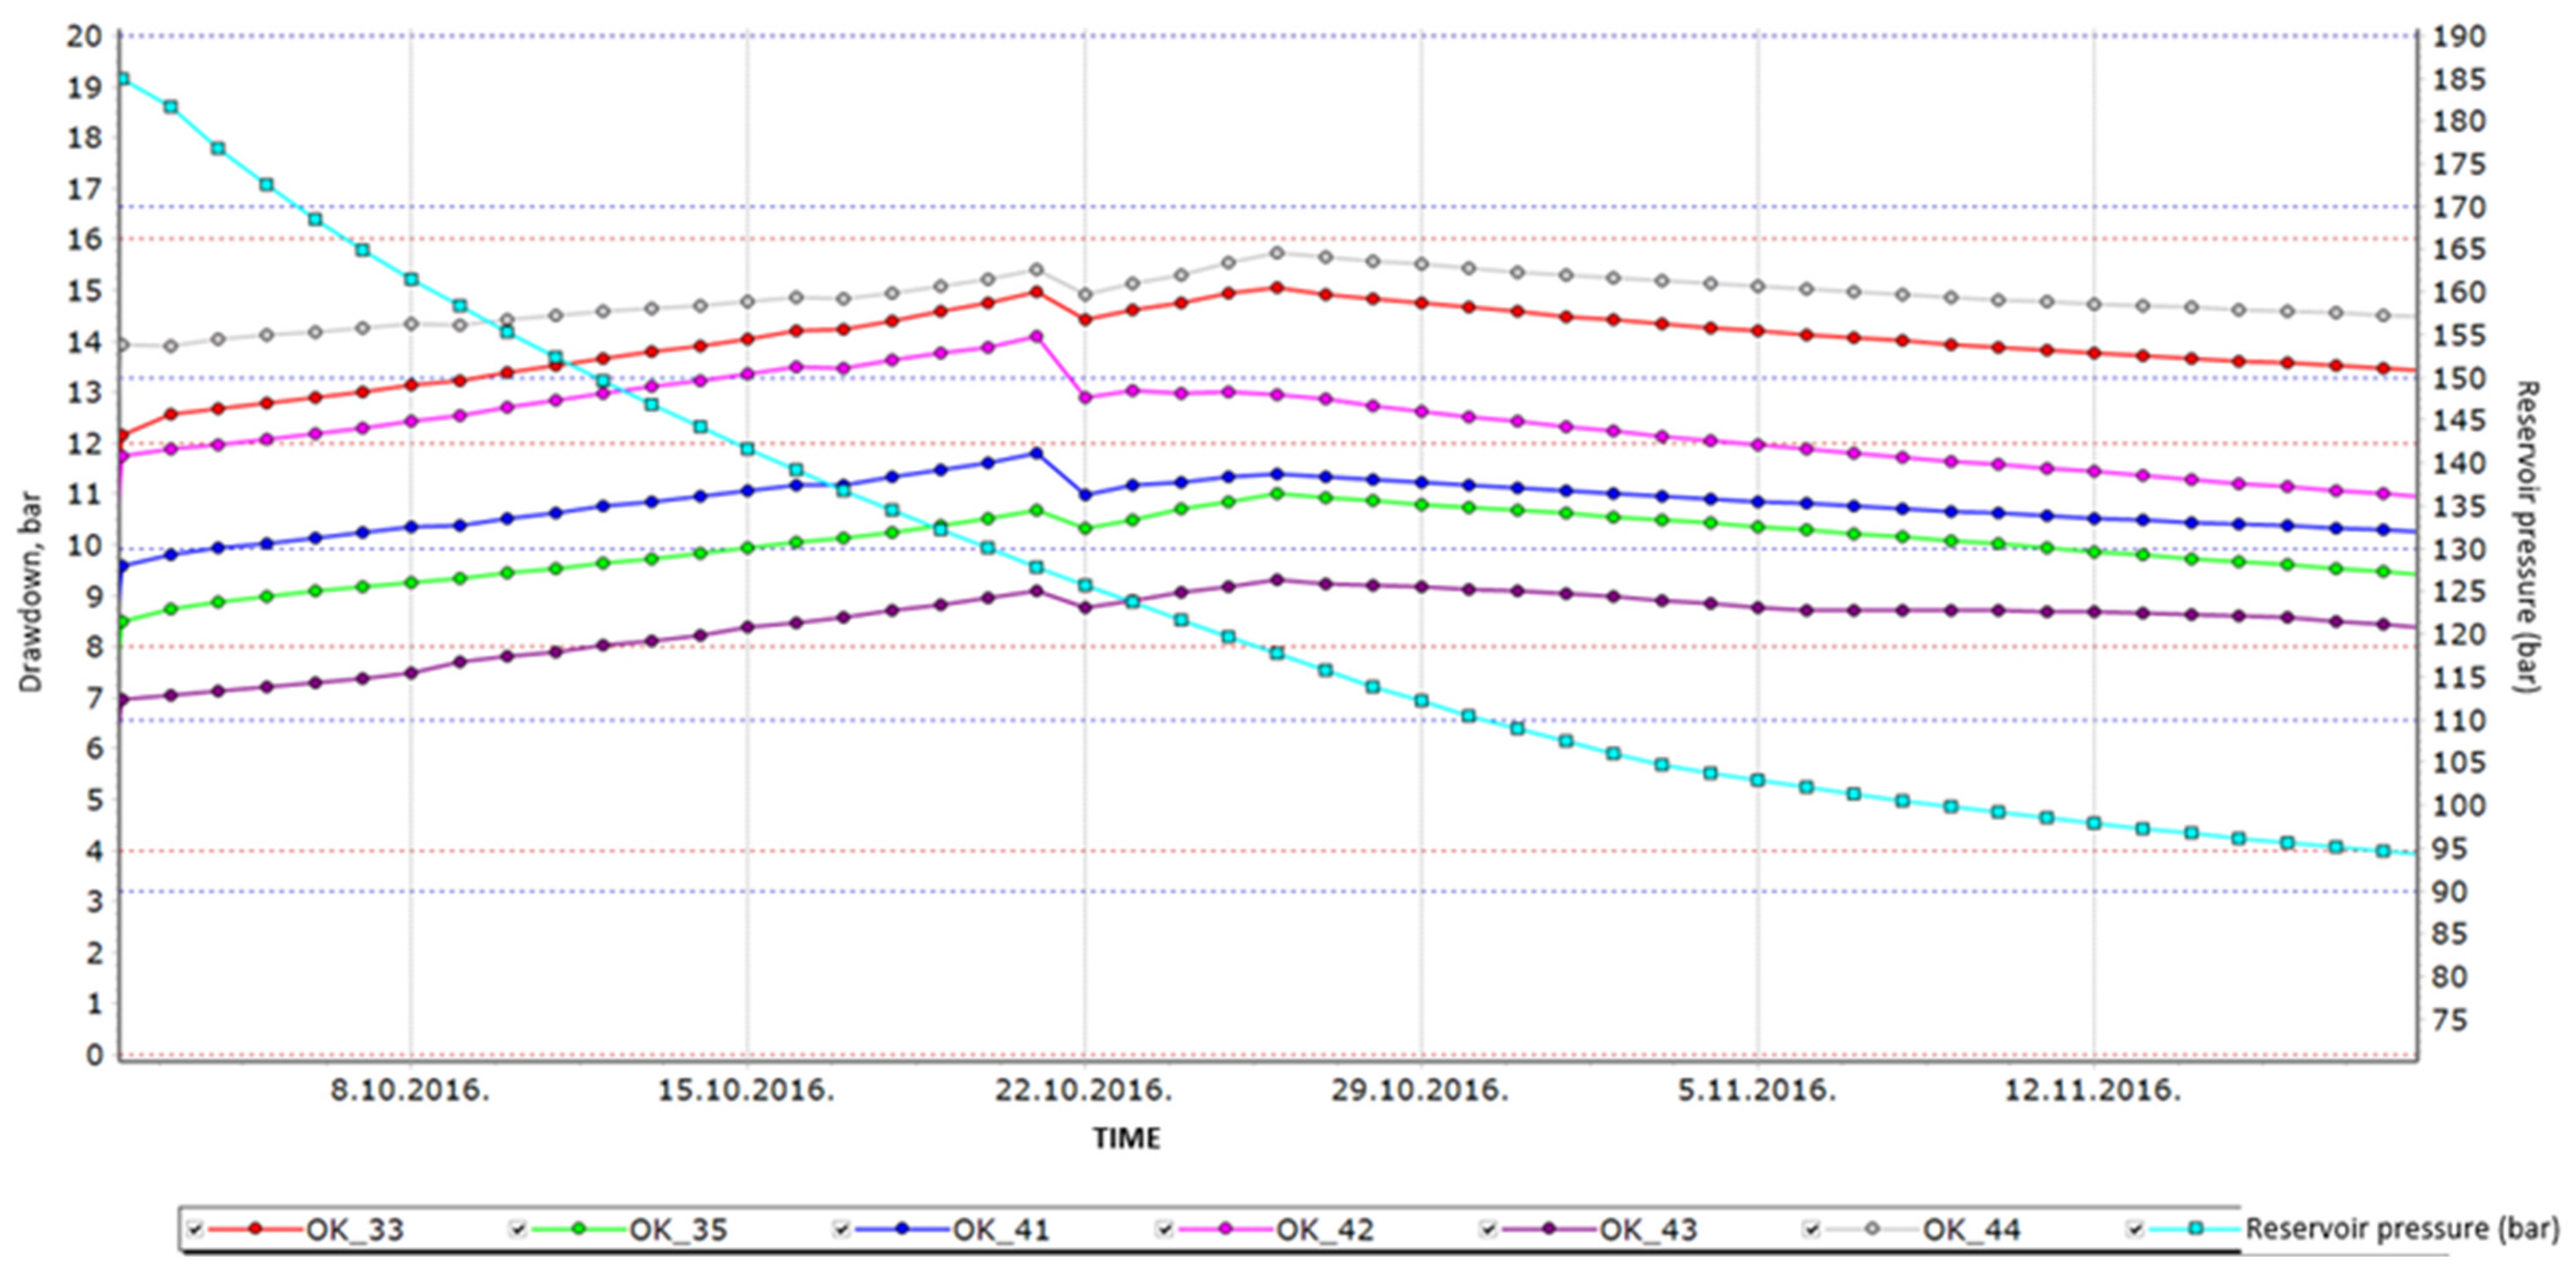
5.3. Model Simulation Run Results

Figure 5 and Figure 6 show the interdependence of hydraulic loss and gas flow for a single set of input data. How these losses affect the performance of the gas storage facility could only be determined with an integrated dynamic (mathematical) model. For that purpose, the mentioned scenarios were selected, and the specific model results are presented in this chapter. Gas storage withdrawal capacity strongly depends on reservoir parameters, and the number of working wells and facility construction. At some point during the production cycle, as the reservoir pressure is constantly decreasing, the designed maximum gas rate is no longer attainable. The scenario results show the dependency of maximum withdrawal storage capacity on reservoir pressure for every case scenario. The evident change in the reservoir pressure value at which it is still possible to operate the storage with maximum withdrawal capacity is a direct indicator of changes made in scenarios 1 and 2 (in relation to the baseline scenario). Other relevant data that indirectly affect the withdrawal capacity are also shown in the figures below (pressure drop across chokes trends, drawdown trends, etc.).
Simulation results (pressure dependence vs. withdrawal capacity, other related data) for the base case scenario are shown in Figure 7, Figure 8 and Figure 9. Corresponding simulation results for Scenario 1 are shown in Figure 10 and Figure 11 and for Scenario 2 in Figure 12, Figure 13, Figure 14 and Figure 15.
In the base case scenario, the sustainability of the maximum withdrawal capacity decreases with a value of reservoir pressure below 116 bar. This value matches the real gas storage performance data.
For the settings of scenario 1, the maximum withdrawal capacity is sustainable at a lower reservoir pressure (regarding the base case scenario) at 112 bar. This is a direct indicator of changes introduced in Scenario 1, and their influence on storage withdrawal capacity performance.
For production wells that were subject to a change in tubing diameter (Scenario 1), the difference between the formation pressure and the bottom hole hydrostatic pressure (Drawdown) is shown. Due to the lower hydraulic losses occurring on the production string (comparing with the base case scenario shown in Figure 8), a higher average drawdown per well was achieved during the withdrawal storage cycle.
Due to the demand for accuracy in the calculation of the pressure drop across the choke, determination of the discharge coefficient (Cd) for a specific wellhead and process chokes (with a circular cross-section) was necessary. By incorporating these values in a mathematical (simulation) model, it was possible to investigate the influence of hydraulic losses at chokes on gas storage technical capabilities.
Scenario 2 simulation results are shown in Figure 12, Figure 13, Figure 14 and Figure 15. The minimum reservoir pressure value at which maximum withdrawal capacity is possible is given in Figure 12. Figure 13 shows the working wells’ drawdown during a simulation run.
It should be emphasised that a longer sustainability of UGS withdrawal capacity was achieved with a low-pressure drop through the chokes, as seen in Figure 14 and Figure 15.
For the settings of scenario 2, the maximum withdrawal capacity is sustainable at lower reservoir pressure (regarding the base case scenario and Scenario 1) at 102 bar. From this, it can be concluded that scenario 2 has the most impact on gas storage withdrawal capacity performance, and hydraulic losses occurring on restriction (chokes) are not negligible.
For production wells that were subject to a change in wellhead choke diameter (Scenario 2), the difference between the formation pressure and the bottom hole hydrostatic pressure (drawdown) is shown in Figure 13. Due to the lower hydraulic losses occurring on wellhead and facility chokes (Figure 14 and Figure 15), a higher average drawdown per well was achieved during the withdrawal storage cycle.
In Figure 14, the pressure drop values across the wellhead chokes are presented for Scenario 2 chokes during the withdrawal cycle. The pressure drop values are negligible, and thus have a direct influence on the wells’ productivity performance.
Figure 15 shows pressure drop values on the reduction station nozzles during the gas storage withdrawal cycle. This pressure drop affects drawdown on all gas storage wells during the production cycle. Pressure drop is negligible, which has a direct influence on the well’s productivity performance. A lover pressure drop on the nozzles increases the gas storage deliverability pattern due to lower hydraulic losses.

6. Discussion

The conducted experimental research combined with mathematical modelling confirmed the impact of hydraulic losses on gas storage capacity sustainability. It has been shown that hydraulic resistance through the underground gas storage chokes in the state of their complete openness significantly affects the gas withdrawal capacity. This is particularly evident at low reservoir pressure during the end of the withdrawal cycle. The investigation results may influence the choice of technical production equipment in underground gas storage as this problem has not yet been systematically investigated.
An additional contribution of this research represents the experimentally determined value of the discharge coefficient for wellhead and process chokes with a circular cross-section area. The established value of Cd for subcritical flow completes the existing results of the two-phase fluid flow research. This paper provides the methodology for an integrated mathematical model of UGS development with real data obtained from an underground gas storage facility in Croatia. The presented concept with the necessary modifications could be applied to all types of underground gas storage.

7. Conclusions

Based on the conducted research, the following can be concluded:
  • For the subcritical flow of natural gas through the wellhead chokes (type Needle and Seat choke valve), the average value for the discharge coefficient of 0.76 was determined. The obtained coefficient was applied in the mathematical model for pressure-drop calculation on UGS chokes. With a developed mathematical model of the UGS facility, the impact of hydraulic losses (head loss) on withdrawal capacity was observed.
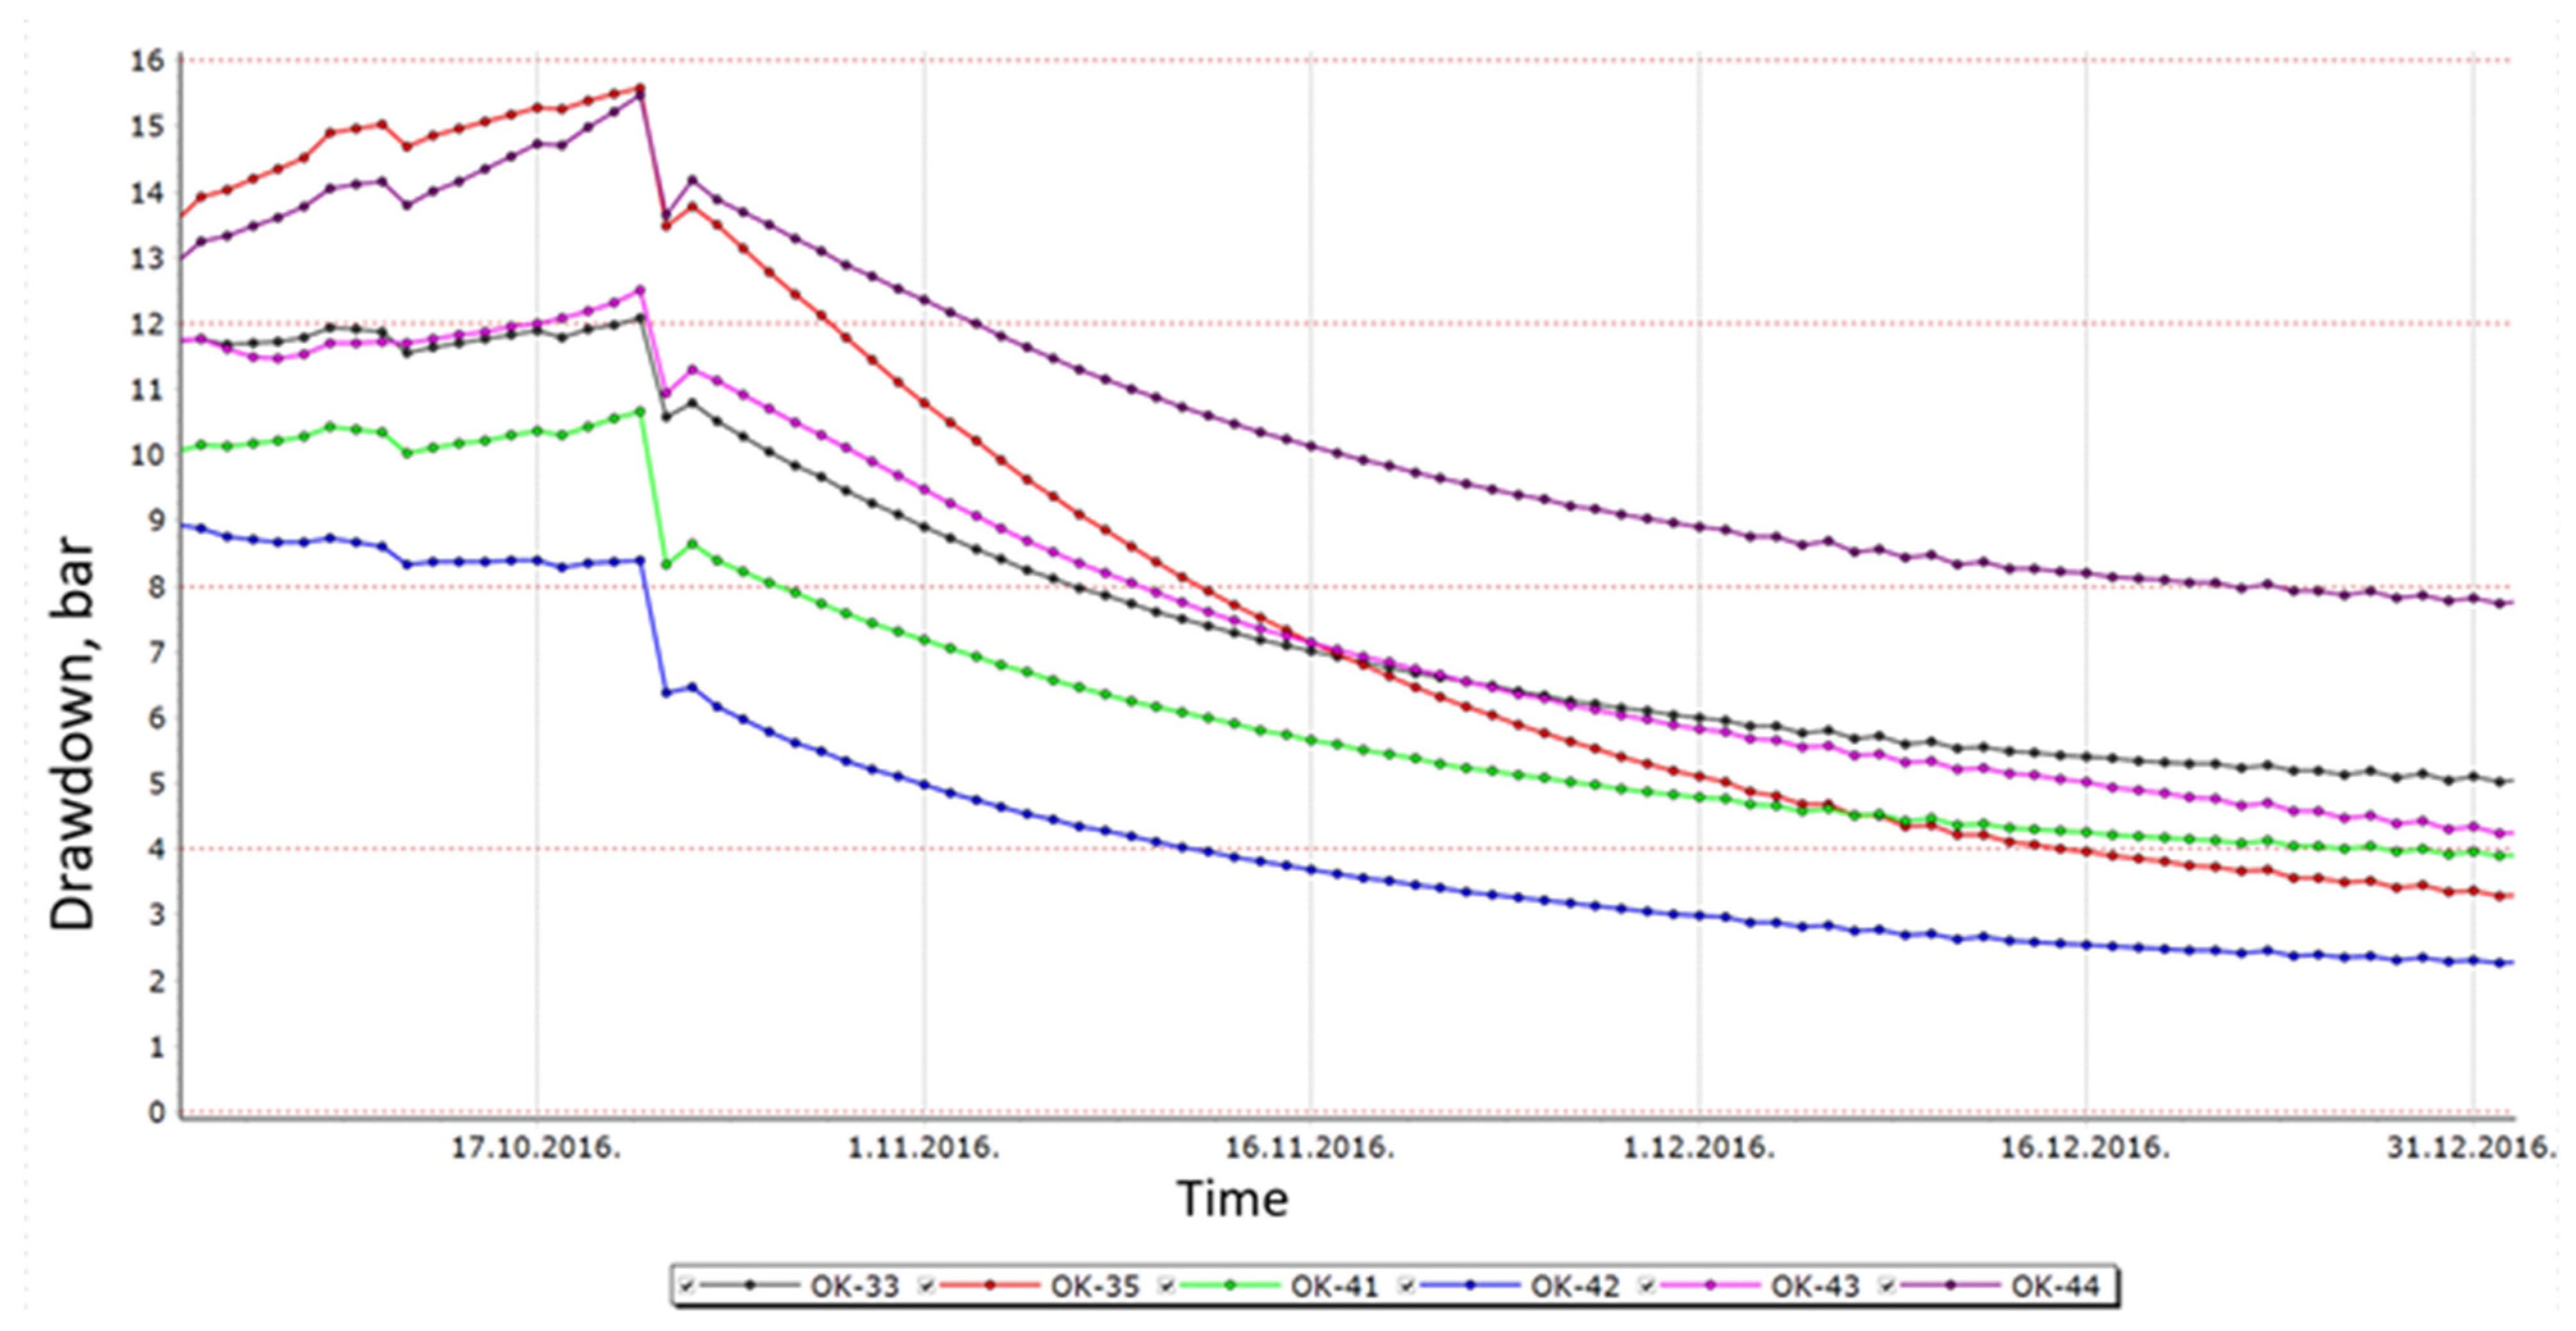
  • Larger string diameter results in lower friction between gas particles and the tubing (pipe) wall, enabling higher reservoir pressure drawdown on well perforation level and gas withdrawal capacity extension by 10% related to the initial state (base case model).
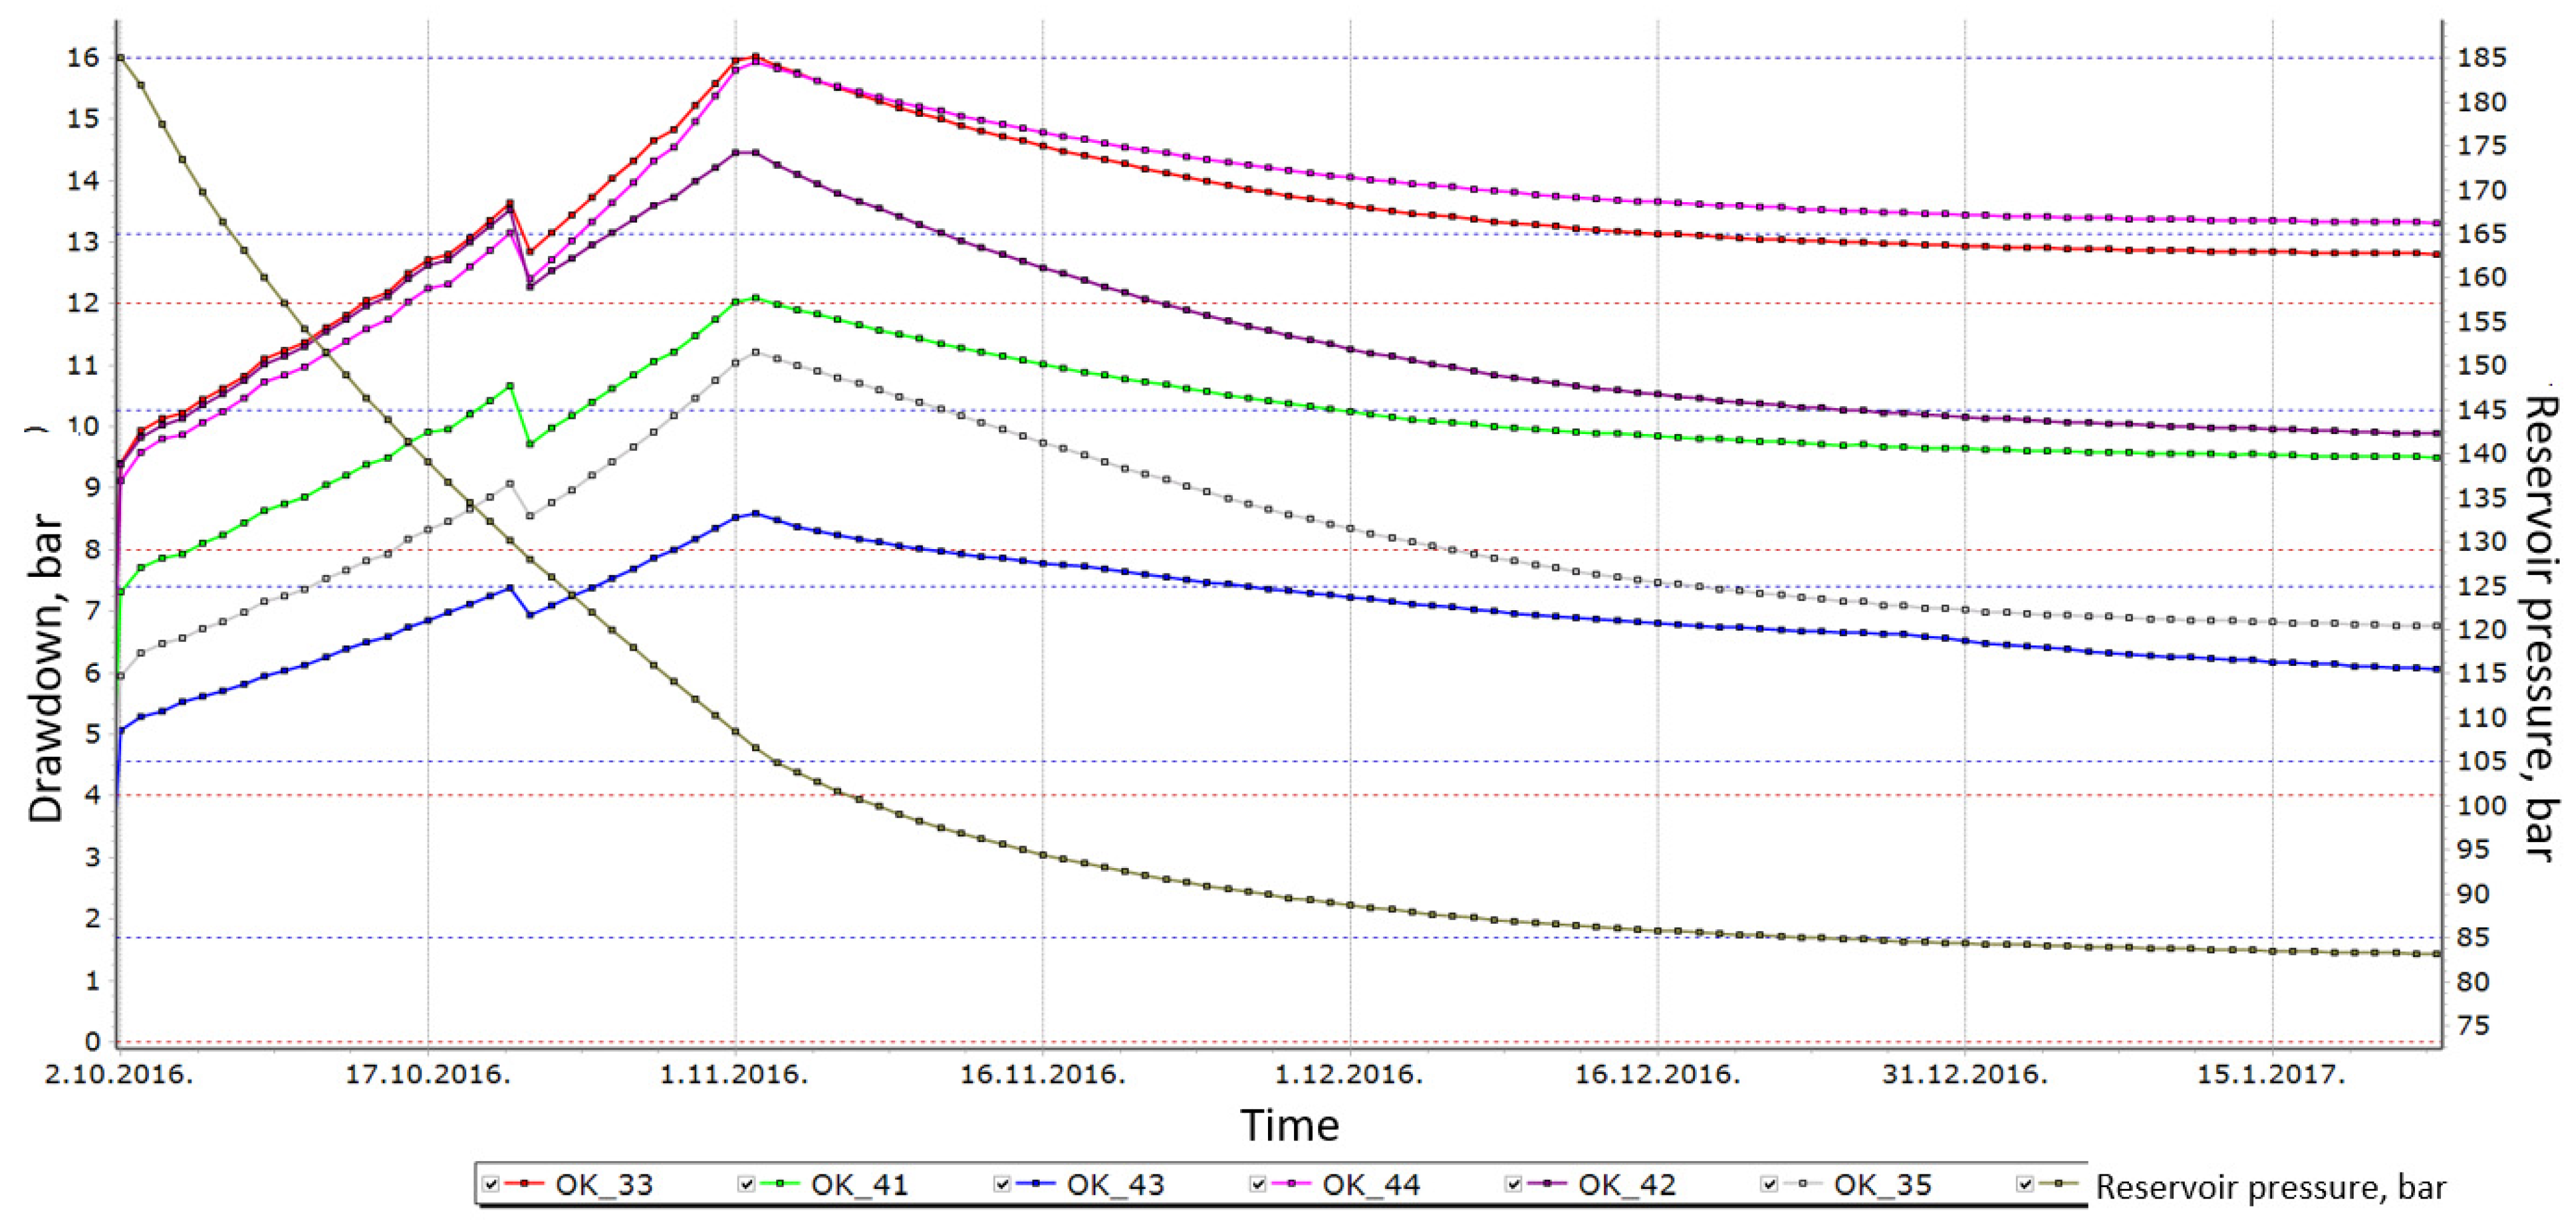
  • Hydraulic losses in the chokes during the sub-critical flow of gas in the stage of full choke openness also significantly affect the UGS withdrawal capacity. This is particularly evident at low reservoir pressure due to an increase in gas flow velocity through production equipment. The implementation of a double sized choke diameter (regarding the base case scenario) increases the gas withdrawal capacity extension by 18% for a specific case scenario (Scenario 2).
  • For the first time, a dynamic mathematical model was used to valorise the impact of hydraulic losses of production equipment on its working capabilities. Without the use of an integrated mathematical model, it would not be possible to systematically examine the above except by directly changing the equipment and measuring, which is an unprofitable and inappropriate procedure.

Author Contributions

V.B.—creation of the idea for the paper, writing of the discussion and conclusion section; I.Z.—creation of the idea for the paper, software modelling and writing methodology section; P.M. and I.M.—preparation of the comprehensive literature overview, introduction section and tables. All authors have read and agreed to the published version of the manuscript.

Funding

This research received no external funding.

Data Availability Statement

Data are available in a publicly accessible repository.

Conflicts of Interest

The authors declare no conflict of interest.

References

  1. Agate, G.; Colucci, F.; Guandalini, R.; Moia, F.; Pagotto, R.; Crosta, G.B. A Numerical Modeling Approach to Investigate the Safety Aspects of the Gas Storage in a Deep Geological Reservoir. In Proceedings of the Offshore Mediterranean Conference and Exhibition, Ravenna, Italy, 29–31 March 2017. [Google Scholar]
  2. Huo, H.; Li, J.; Li, Z.; Zhang, X.; He, S.; Xu, J.; Dou, P. The Feasibility Analysis of an Underground Natural Gas Storage Using a Depleted Offshore Gasfield. In Proceedings of the International Petroleum Technology Conference, Kuala Lumpur, Malaysia, 23 March–1 April 2021. [Google Scholar] [CrossRef]
  3. Saradva, H.; Jain, S.; Sarssam, M.; Al Hamadi, M.; Robert, M. Integrated Field Development Planning for Enhanced Condensate Recovery ECR and Gas Storage in Mature Gas Condensate Fields. In Proceedings of the Abu Dhabi International Petroleum Exhibition & Conference, Abu Dhabi, United Arab Emirates, 12–15 November 2018. [Google Scholar] [CrossRef]
  4. Mgbaja, U.M.; Enwere, N. Reservoir Characterization, Simulation & Estimation of Storage Capacity of depleted Reservoirs in Niger Delta for Underground Natural Gas Storage. In Proceedings of the SPE Nigeria Annual International Conference and Exhibition, Lagos, Nigeria, 31 July–2 August 2017. [Google Scholar] [CrossRef]
  5. Song, X.; Peng, C.; Li, G.; Wen, K. A Probabilistic Model to Evaluate the Operation Reliability of the Underground System in Underground Gas Storage Transformed from Depleted Gas Reservoir. In Proceedings of the International Petroleum Technology Conference, Bangkok, Thailand, 14–16 November 2016. [Google Scholar] [CrossRef]
  6. Mu, L.; Liao, X.; Yu, Q.; Hao, L.; Zhang, J.; Zhao, J.; Wu, J. Study on Operation Strategy of Aquifer Underground Gas Storage Using CO2 as Cushion Gas. In Proceedings of the Carbon Management Technology Conference, Houston, TX, USA, 15–18 July 2019. [Google Scholar] [CrossRef]
  7. Jin, F.; Xi, W.; Chen, C.; Shunyuan, Z.; Bingshan, L. Technical and Risk Evaluation of Underground Gas Storage Construction in Salt Caverns and Its Feasibility in South America. In Proceedings of the SPE Latin America and Caribbean Petroleum Engineering Conference, Buenos Aires, Argentina, 18–19 May 2017. [Google Scholar] [CrossRef]
  8. Galić., H.; Cawley, S.; Bishop, S.; Todman, S.; Gas, F. CO2 Injection into Depleted Gas Reservoirs. In Proceedings of the SPE Offshore Europe Oil & Gas Conference, Aberdeen, UK, 8–11 September 2009. [Google Scholar] [CrossRef]
  9. Khodri, D.; Lehuen, L.P.; Labaune, B.; Nabil, R. Modeling of reservoir to surface network coupling: A case study of gas storage management. In Proceedings of the SPE Annual Technical Conference and Exhibition, San Antonio, TX, USA, 5–8 October 1997. [Google Scholar] [CrossRef]
  10. Brown, K.G.; Sawyer, W.K. Practical Methods to Improve Storage Operations—A Case Study. In Proceedings of the SPE Eastern Regional Conference and Exhibition, Charleston, SC, USA, 20–22 October 1999. [Google Scholar] [CrossRef]
  11. McVay, D.A.; Spivey, J. Optimizing Gas-Storage Reservoir Performance. SPE Reserv. Eval. Eng. 2001. 4, 173–178. [CrossRef]
  12. Kuncir, M.; Chang, J.; Mansdorfer, J.; Dougherty, E. Analysis and Optimal Design of Gas Storage Reservoirs. In Proceedings of the SPE Eastern Regional/AAPG Eastern Section Joint Meeting, Pittsburgh, PA, USA, 6–10 September 2003. [Google Scholar] [CrossRef]
  13. Bagci, A.S.; Ozturk, B. Performance analysis of horizontal wells for underground gas storage in depleted gas fields. In Proceedings of the Eastern Regional Meeting, Lexington, KY, USA, 17–19 October 2007. [Google Scholar] [CrossRef]
  14. Moradi, B. Study of gas injection effects on rock and fluid of a gas condensate reservoir during underground gas storage process. In Proceedings of the Latin American and Caribbean Petroleum Engineering Conference, Cartagena de Indias, Colombia, 31 May–3 June 2009. [Google Scholar] [CrossRef]
  15. Sun, J.; Wang, J.; Zheng, D.; Xu, H.; Li, C.; Zhao, K.; Zhong, R. Regional scale 3D geomechanical modeling for evaluating caprock integrity and fault leakage potential during underground gas storage operations in a produced field. In Proceedings of the SPE Reservoir Characterisation and Simulation Conference and Exhibition, Abu Dhabi, United Arab Emirates, 8–10 May 2017. [Google Scholar] [CrossRef]
  16. Kelkar, M. Natural Gas Production Engineering; PennWell: Tulsa, OK, USA, 2008; p. 571. [Google Scholar]
  17. Zelenika, I.; The Underground Gas Storage Volume Modelling with Respect to Reservoir Parameters and Production Equipment (In Croatian: Modeliranje radnog obujma podzemnog skladišta plina u funkciji ležišnih parametara i proizvodne opreme). Ph.D. Thesis, University of Zagreb, Faculty of Mining, Geology and Petroleum Engineering, Zagreb, Croatia, 17 May 2017. Available online: https://repozitorij.rgn.unizg.hr/islandora/object/rgn%3A628/datastream/PDF/view (accessed on 17 May 2021).
  18. Weymouth, T.R. Problems in natural gas engineering. Trans. Am. Soc. Mech. Eng. 1912, 34, 185–231. [Google Scholar]
Figure 1. Model integration in RESOLVE program.
Energies 14 04324 g001
Figure 2. GAP program interface in withdrawal cycle.
Energies 14 04324 g002
Figure 3. GAP program interface in injection cycle.
Energies 14 04324 g003
Figure 4. Flow line section.
Energies 14 04324 g004
Figure 5. Pressure vs. gas flow for choke ID = 0.0254 m.
Energies 14 04324 g005
Figure 6. Pressure vs. gas flow for choke ID = 0.0508 m.
Energies 14 04324 g006
Figure 7. Reservoir pressure and withdrawal capacity dependence—base case scenario.
Energies 14 04324 g007
Figure 8. Well drawdown during withdrawal cycle—base case scenario.
Energies 14 04324 g008
Figure 9. Head loss on reduction station chokes—base case scenario.
Energies 14 04324 g009
Figure 10. Reservoir pressure and withdrawal capacity dependence—scenario 1.
Energies 14 04324 g010
Figure 11. Wells drawdown during withdrawal cycle—scenario 1.
Energies 14 04324 g011
Figure 12. Reservoir pressure and withdrawal capacity dependence—scenario 2.
Energies 14 04324 g012
Figure 13. Wells drawdown during withdrawal cycle—scenario 2.
Energies 14 04324 g013
Figure 14. Head loss on wellhead chokes—scenario 2.
Energies 14 04324 g014
Figure 15. Head loss on reduction station chokes—scenario 2.
Energies 14 04324 g015
Table 1. Gathering system data.
PipelineLength (m)Relative Roughness (m)Pipe ID (m)Pipe OD (m)
Platforma 1 to CP20501.524·× 10−50.13970.1524
Platforma 2 to CP16401.524 × 10−50.13970.1524
Platforma 3 to CP3601.524 × 10−50.13970.1524
Platforma 4 to CP15001.524 × 10−50.13970.1524
Platforma 5 to CP7501.524 × 10−50.13970.1524
Platforma 6 to CP6401.524 × 10−50.13970.1524
CP—central gas station, Platforma—UGS well site
Pipeline pressure drop correlationWeymouth (1912)
Table 2. Production equipment diameters for the applied scenarios.
WellCaseChoke ID, (m)Choke ID at Reduction Station, (m)Tubing ID, (m)
OK-33 Base case0.02540.0540.076
Case 10.02540.0540.1016
Case 20.05080.0720.076
OK-35 Base case0.02540.0540.076
Case 10.02540.0540.1016
Case 20.05080.0720.076
OK-41 Base case0.02540.0540.076
Case 10.02540.0540.1016
Case 20.05080.0720.076
OK-42 Base case0.02540.0540.076
Case 10.02540.0540.1016
Case 20.05080.0720.076
OK-43 Base case0.02540.0540.076
Case 10.02540.0540.1016
Case 20.05080.0720.076
OK-44 Base case0.02540.0540.076
Case 10.02540.0540.1016
Case 20.05080.0720.076
All other UGS wells Base case0.02540.0540.076
Case 10.02540.0540.1016
Case 20.05080.0720.076
Table 3. Discharge coefficient calculation results based on measurement data.
WellData PointUpstream Pressure (Choke) P1 (MPa)Downstream Pressure (Choke) P2 (MPa)Gas Temperature (Upstream) T1 (K)Measured Gas Flow Q (m3/h)Choke ID (m)Cp (KJ/kg/K)Cv (KJ/kg/K)Specific Heat Ratio κZ-FactorCd
OK-41I11.811.68328.1587390.02542.951.841.60.9060.74
II10.810.73327.1563830.02542.91.841.570.9090.766
III7.487.17328.1510,6690.02542.71.841.460.9280.747
IV7.87.66325.1575360.02542.731.831.490.9230.764
V11.2210.97334.1511,9430.02542.91.841.570.9170.765
OK-33I11.8811.58332.1513,5190.02542.941.841.590.9130.765
II10.510.21332.1512,4160.02542.861.871.520.9170.757
III7.56.63334.1516,5120.02542.691.861.430.9340.744
IV7.67.21334.1511,8110.02542.71.841.460.9340.745
V11.4811335.1516,4300.02542.911.831.590.9180.764
OK-35I11.5511.51325.1550420.02542.951.881.560.9030.771
II10.2110.17326.1547030.02542.871.861.540.910.769
III6.866.63331.1587800.02542.661.881.410.9360.756
IV7.177.06331.1563150.02542.681.861.440.9330.763
V10.7310.57331.1594570.02542.881.841.560.9150.767
OK-44I11.6611.55331.1582360.02542.931.841.590.9120.769
II10.3210.23329.1570150.02542.861.871.530.9140.768
III6.946.63334.1510,0940.02542.661.881.410.9380.756
IV7.287.09332.1582740.02542.691.861.450.9340.761
V11.1210.94332.1510,1890.02542.91.851.570.9150.766
OK-45I10.7210.58331.1588560.02542.881.851.560.9150.767
II98.74332.1510,8120.02542.781.881.480.9240.76
III8.58.28331.1596930.02542.751.851.490.9250.761
IV6.35.97330.1599070.02542.631.861.410.9390.754
V7.16.95327.1566080.02542.681.851.450.930.763
Table 4. Calculation results for choke size ID = 0.0254 m and upstream pressure of 15 MPa.
Upstream Pressure P1 (MPa)Downstream Pressure P2 (MPa)ΔP (MPa)Gas Temperature T1 (K)Measured Gas Flow Q (m3/d)
1514.2260.774333.15583,960
1514.2650.735333.15570,423
1514.3240.676333.15549,023
1514.3810.619333.15527,187
1514.4350.565333.15505,315
1514.4870.513333.15483,008
1514.5520.448333.15453,131
1514.5840.416333.15437,479
1514.6290.371333.15414,251
1514.6710.329333.15391,067
1514.7250.275333.15358,680
1514.750.25333.15342,484
1514.7980.202333.15308,724
1514.8310.169333.15282,935
1514.8560.144333.15261,549
Table 5. Calculation results for choke size ID = 0.0254 m and upstream pressure of 12 MPa.
Upstream Pressure P1 (MPa)Downstream Pressure P2 (MPa)ΔP (MPa)Gas Temperature T1 (K)Measured Gas Flow Q (m3/d)
1211.1300.870335.15545,171
1211.1900.810335.15528,523
1211.2500.750335.15510,958
1211.3030.697335.15494,603
1211.3510.649335.15479,041
1211.3900.610335.15465,817
1211.4400.560335.15448,029
1211.4970.503335.15426,458
1211.5510.449335.15404,563
1211.6020.398335.15382,357
1211.6660.334335.15351,948
1211.7110.289335.15328,476
1211.7530.247335.15304,618
1211.7910.209335.15280,991
1211.8280.172335.15255,315
Table 6. Calculation results for choke size ID = 0.0254 m and upstream pressure of 9 MPa.
Upstream Pressure P1 (MPa)Downstream Pressure P2 (MPa)ΔP (MPa)Gas Temperature T1 (K)Measured Gas Flow Q (m3/d)
97.8821.118335.15508,542
97.9671.033335.15493,508
98.0560.944335.15476,436
98.1310.869335.15460,232
98.2100.790335.15445,509
98.2790.721335.15426,525
98.3470.653335.15408,840
98.4080.592335.15391,770
98.4640.536335.15374,956
98.5120.488335.15359,545
98.5700.430335.15339,509
98.6270.373335.15318,043
98.6800.320335.15296,152
98.7300.270335.15273,397
98.7760.224335.15250,163
Table 7. Calculation results for choke size ID = 0.0508 m and upstream pressure of 15 MPa.
Upstream Pressure P1 (MPa)Downstream Pressure P2 (MPa)ΔP (MPa)Gas Temperature T1 (K)Measured Gas Flow Q (m3/d)
1514.9440.056335.15839,714
1514.9490.051335.15801,766
1514.9530.047335.15769,993
1514.9570.043335.15736,726
1514.9610.039335.15701,965
1514.9650.035335.15665,242
1514.9680.032335.15636,280
1514.9720.028335.15595,367
1514.9750.025335.15562,728
1514.9780.022335.15527,944
1514.9820.018335.15477,777
1514.9840.016335.15450,666
1514.9860.014335.15421,552
1514.9890.011335.15373,687
1514.9910.009335.15338,143
Table 8. Calculation results for choke size ID = 0.0508 m and upstream pressure of 12 MPa.
Upstream Pressure P1 (MPa)Downstream Pressure P2 (MPa)ΔP (MPa)Gas Temperature T1 (K)Measured Gas Flow Q (m3/d)
1211.9310.069335.15833,937
1211.9360.064335.15804,256
1211.9420.058335.15766,108
1211.9470.053335.15732,841
1211.9520.048335.15697,781
1211.9570.043335.15662,330
1211.9610.039335.15627,240
1211.9650.035335.15596,746
1211.9690.031335.15558,284
1211.9730.027335.15524,726
1211.9770.023335.15484,496
1211.9800.020335.15451,963
1211.9830.017335.15416,837
1211.9860.014335.15378,401
1211.9880.012335.15350,475
Table 9. Calculation results for choke size ID = 0.0508 m and upstream pressure of 9 MPa.
Upstream Pressure P1 (MPa)Downstream Pressure P2 (MPa)ΔP (MPa)Gas Temperature T1 (K)Measured Gas Flow Q (m3/d)
98.9090.091335.15824,425
98.9150.085335.15797,583
98.9220.078335.15764,913
98.9290.071335.15730,550
98.9360.064335.15694,395
98.9420.058335.15661,717
98.9480.052335.15627,163
98.9530.047335.15596,669
98.9590.041335.15557,824
98.9640.036335.15523,117
98.9700.030335.15478,013
98.9740.026335.15445,244
98.9780.022335.15409,882
98.9810.019335.15381,122
98.9850.015335.15338,869
Publisher’s Note: MDPI stays neutral with regard to jurisdictional claims in published maps and institutional affiliations.

