Underground Gas Storage Process Optimisation with Respect to Reservoir Parameters and Production Equipment
Abstract
:1. Introduction
2. Literature Review
3. Problem Statement
4. Methodology and Experiments
4.1. Mathematical Model of Underground Gas Storage
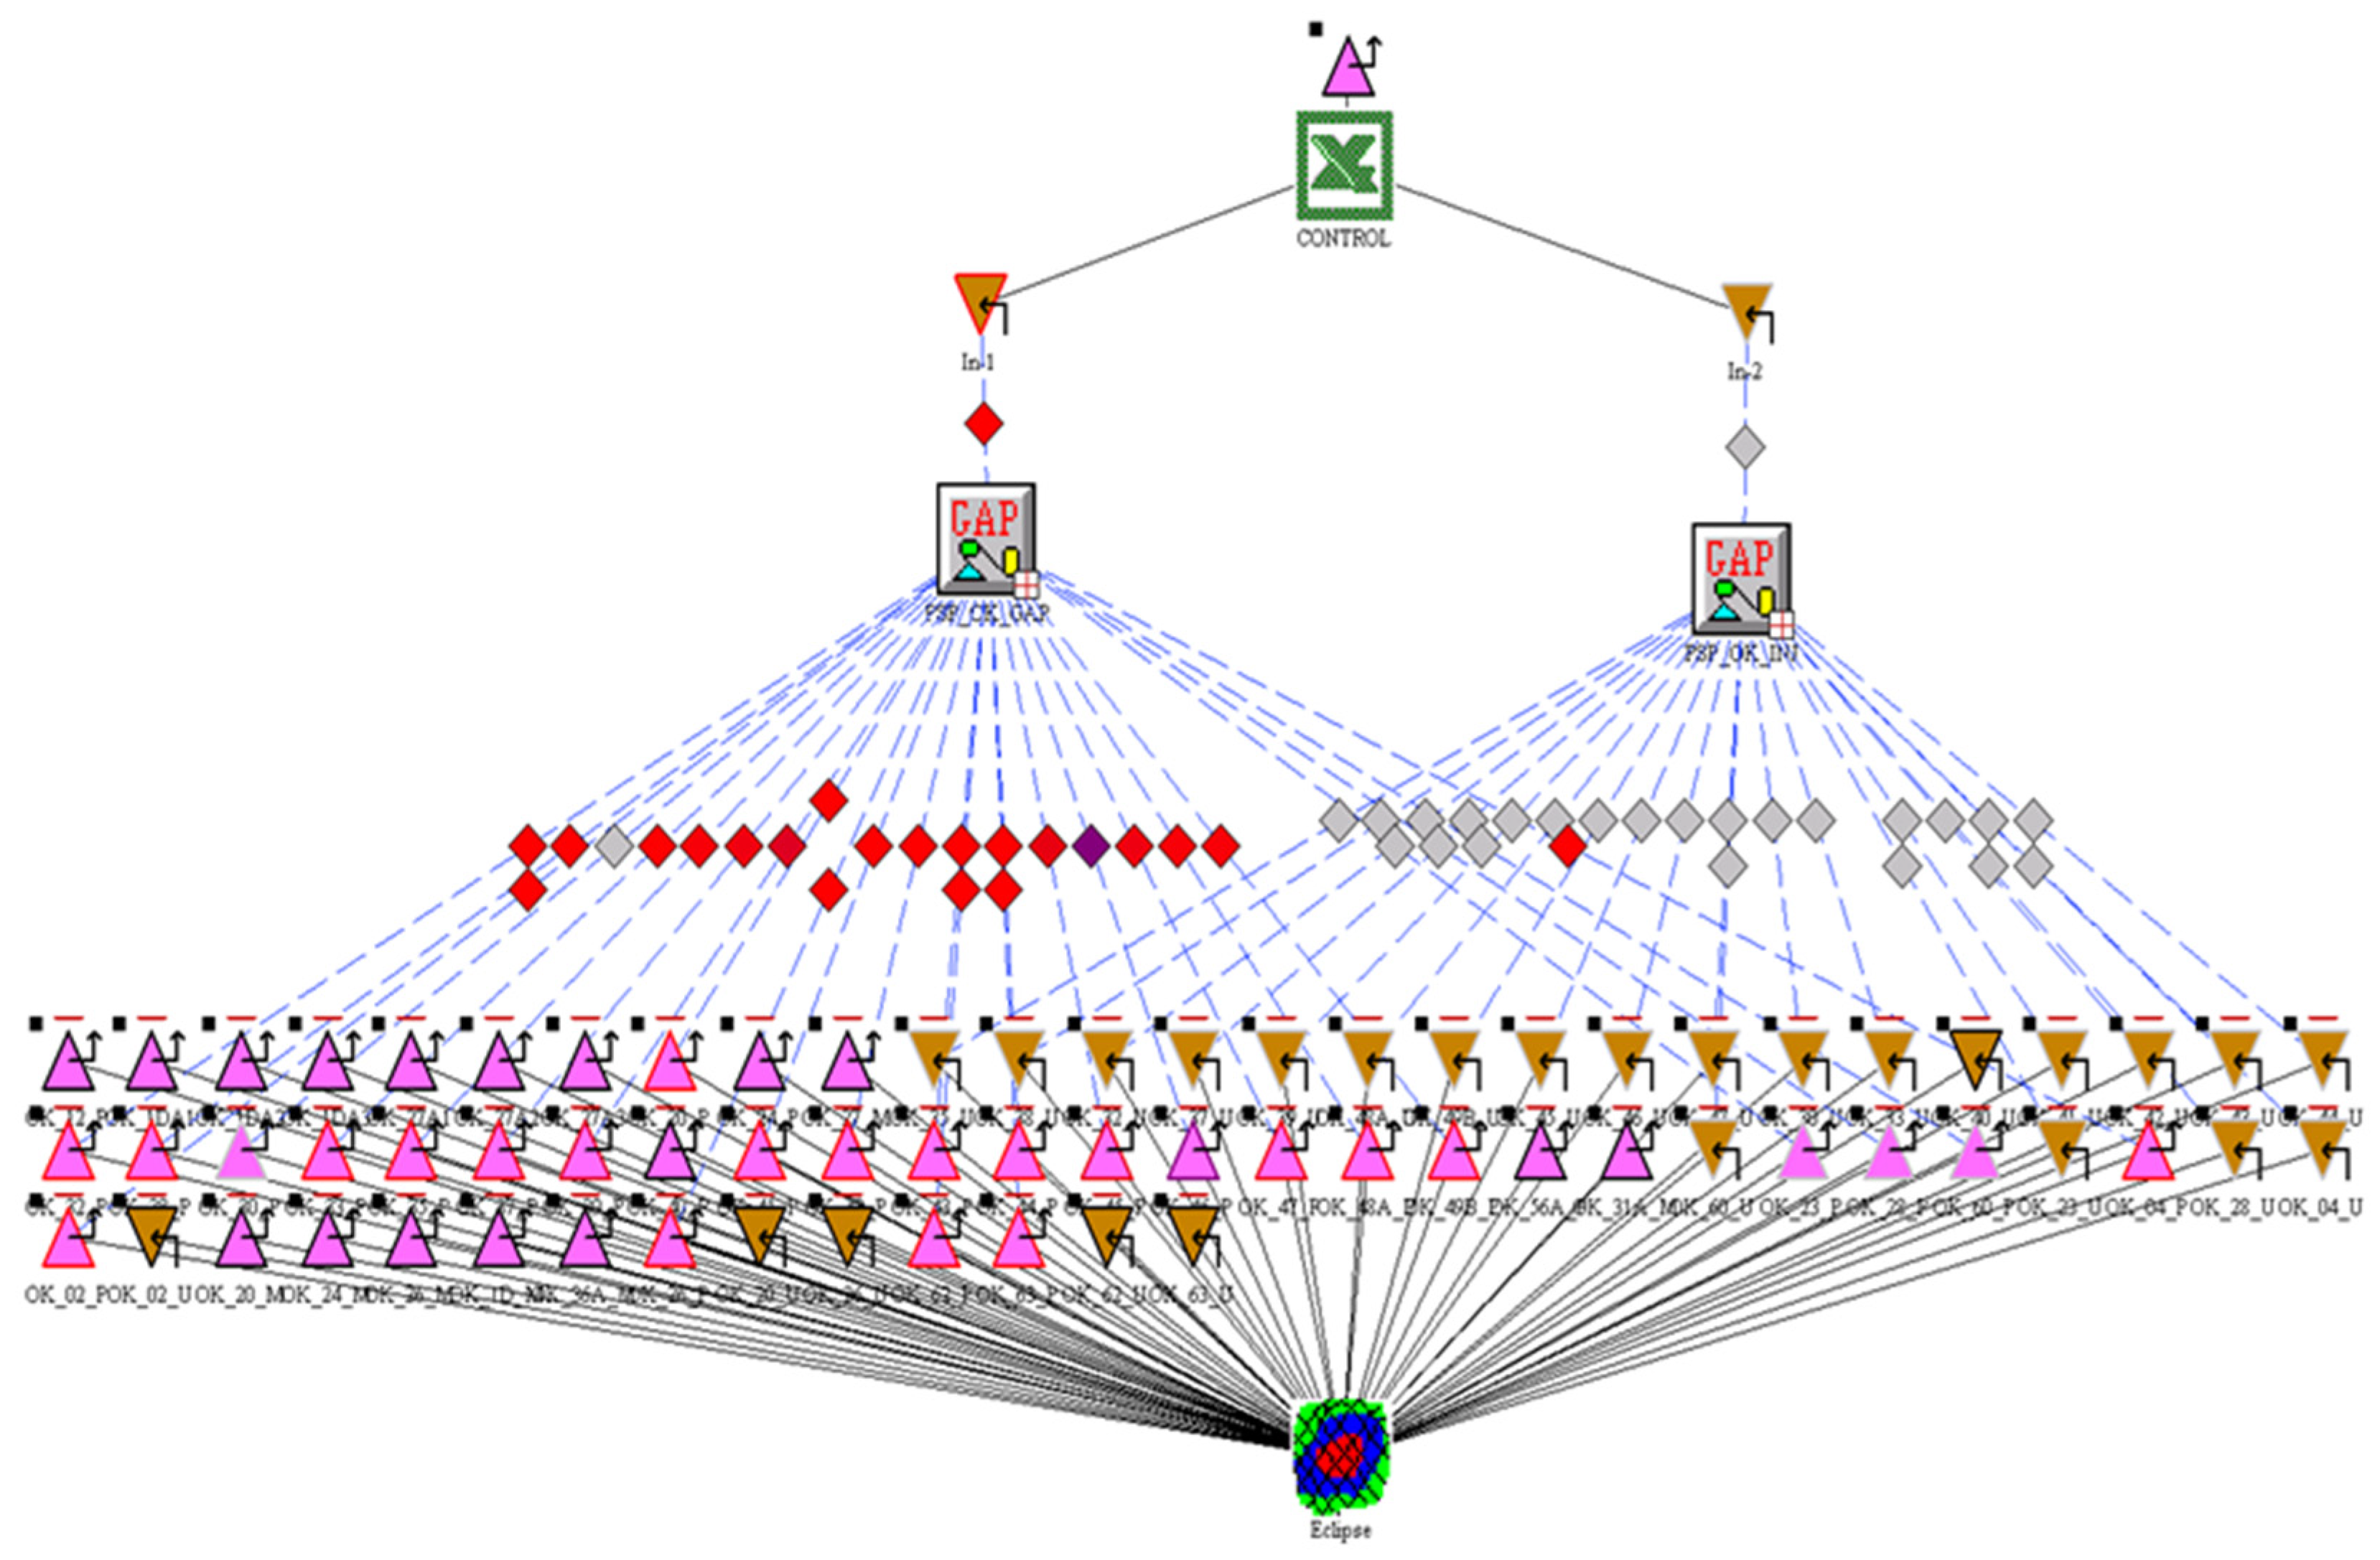
- A reservoir 3D model in Eclipse is calibrated on production history data and injection/withdrawal cycles.
- A storage well model is calibrated with data obtained from modified isochronal tests performed on gas storage wells during injection and withdrawal cycles.
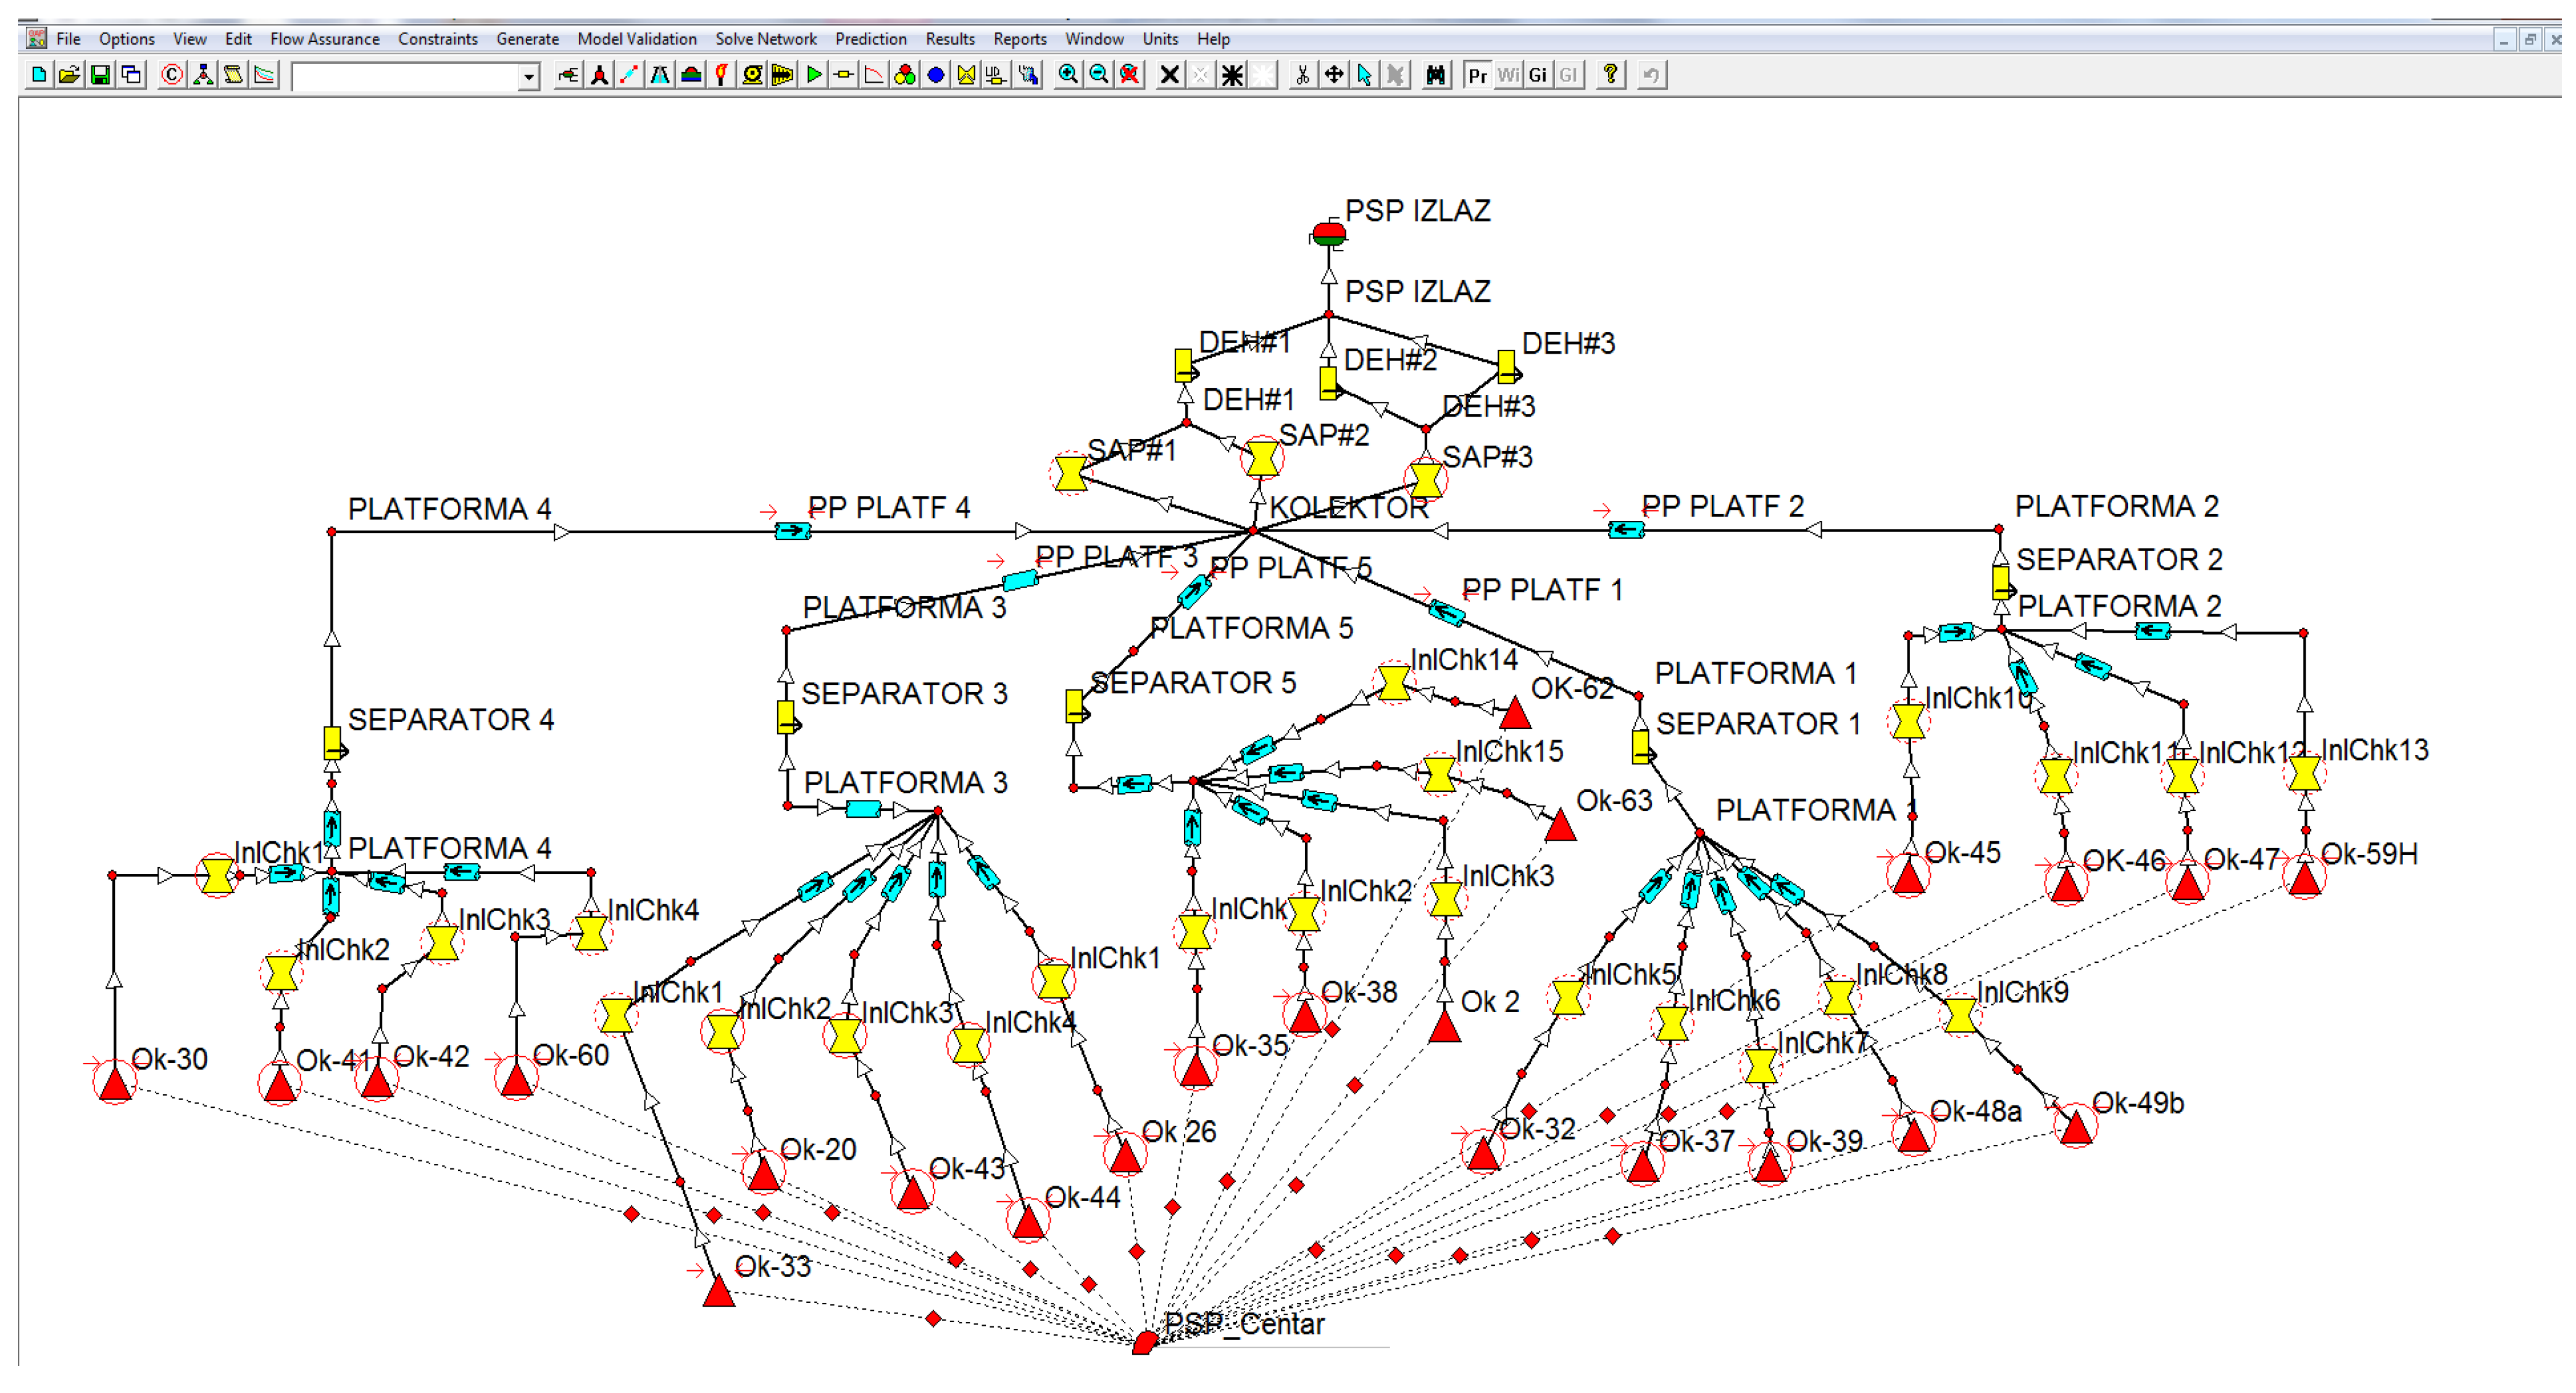
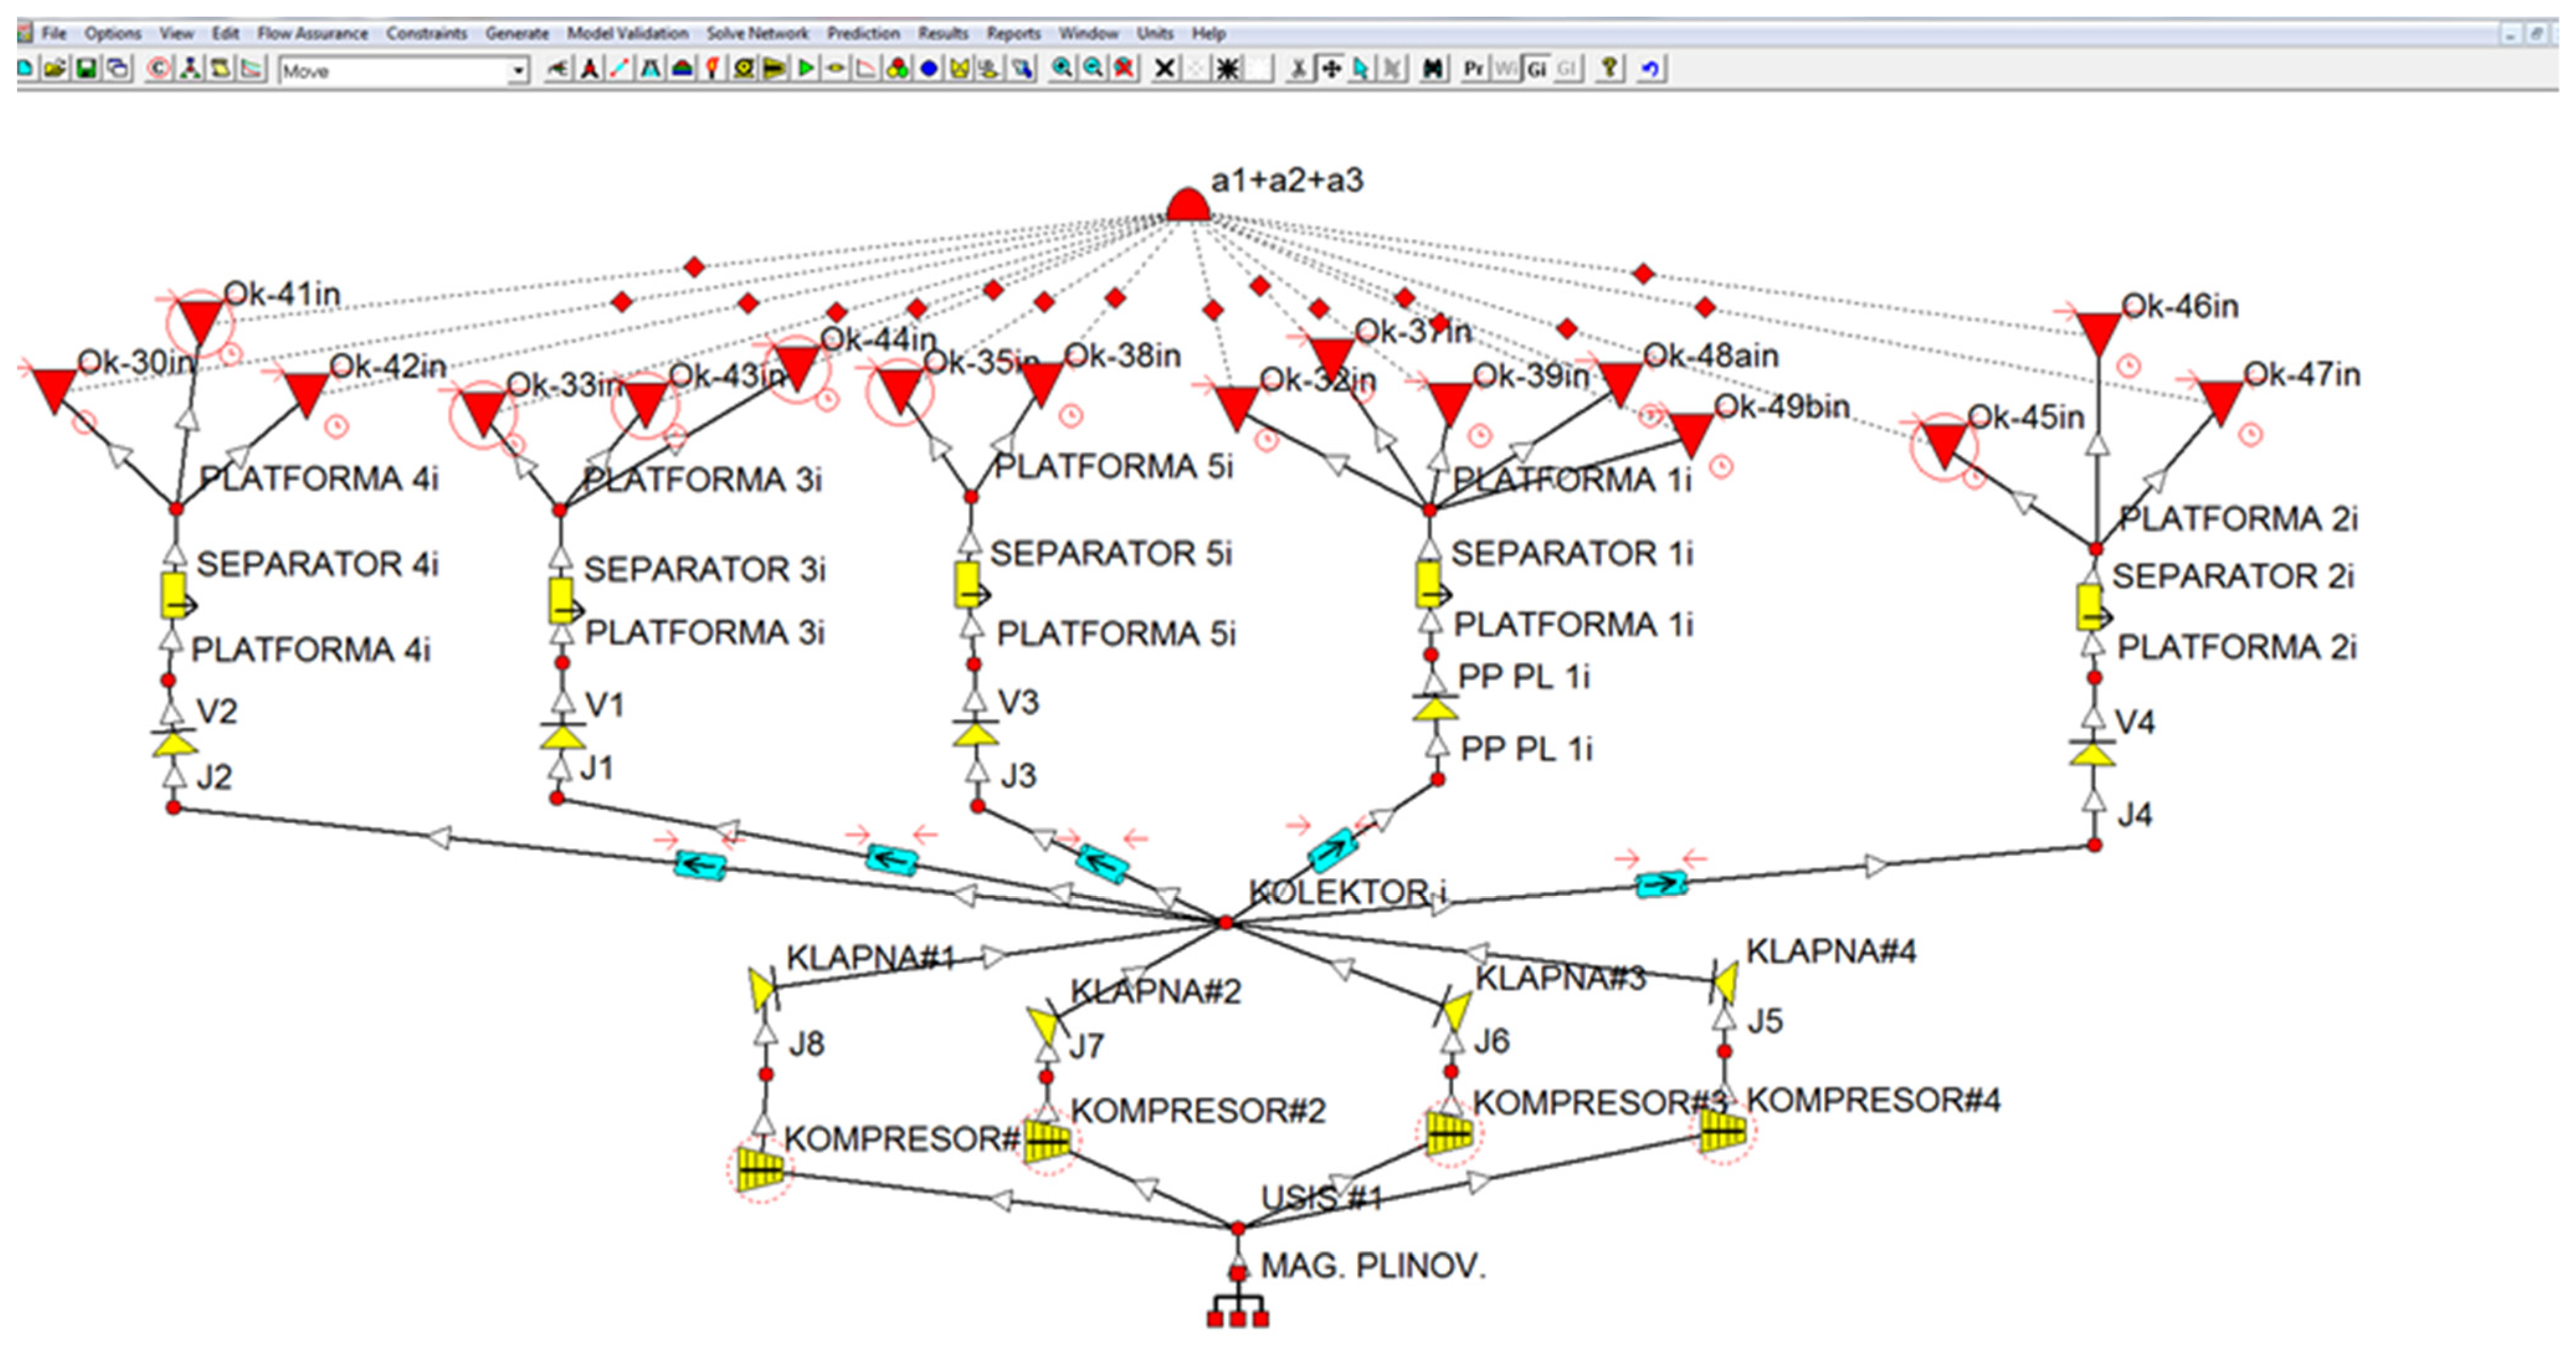
- A model of the surface gathering system is matched on real dynamic production data (pressure and temperature drops through pipes and restrictions).
- -
- Maximum injection gas rate = 3,840,000 m3/d;
- -
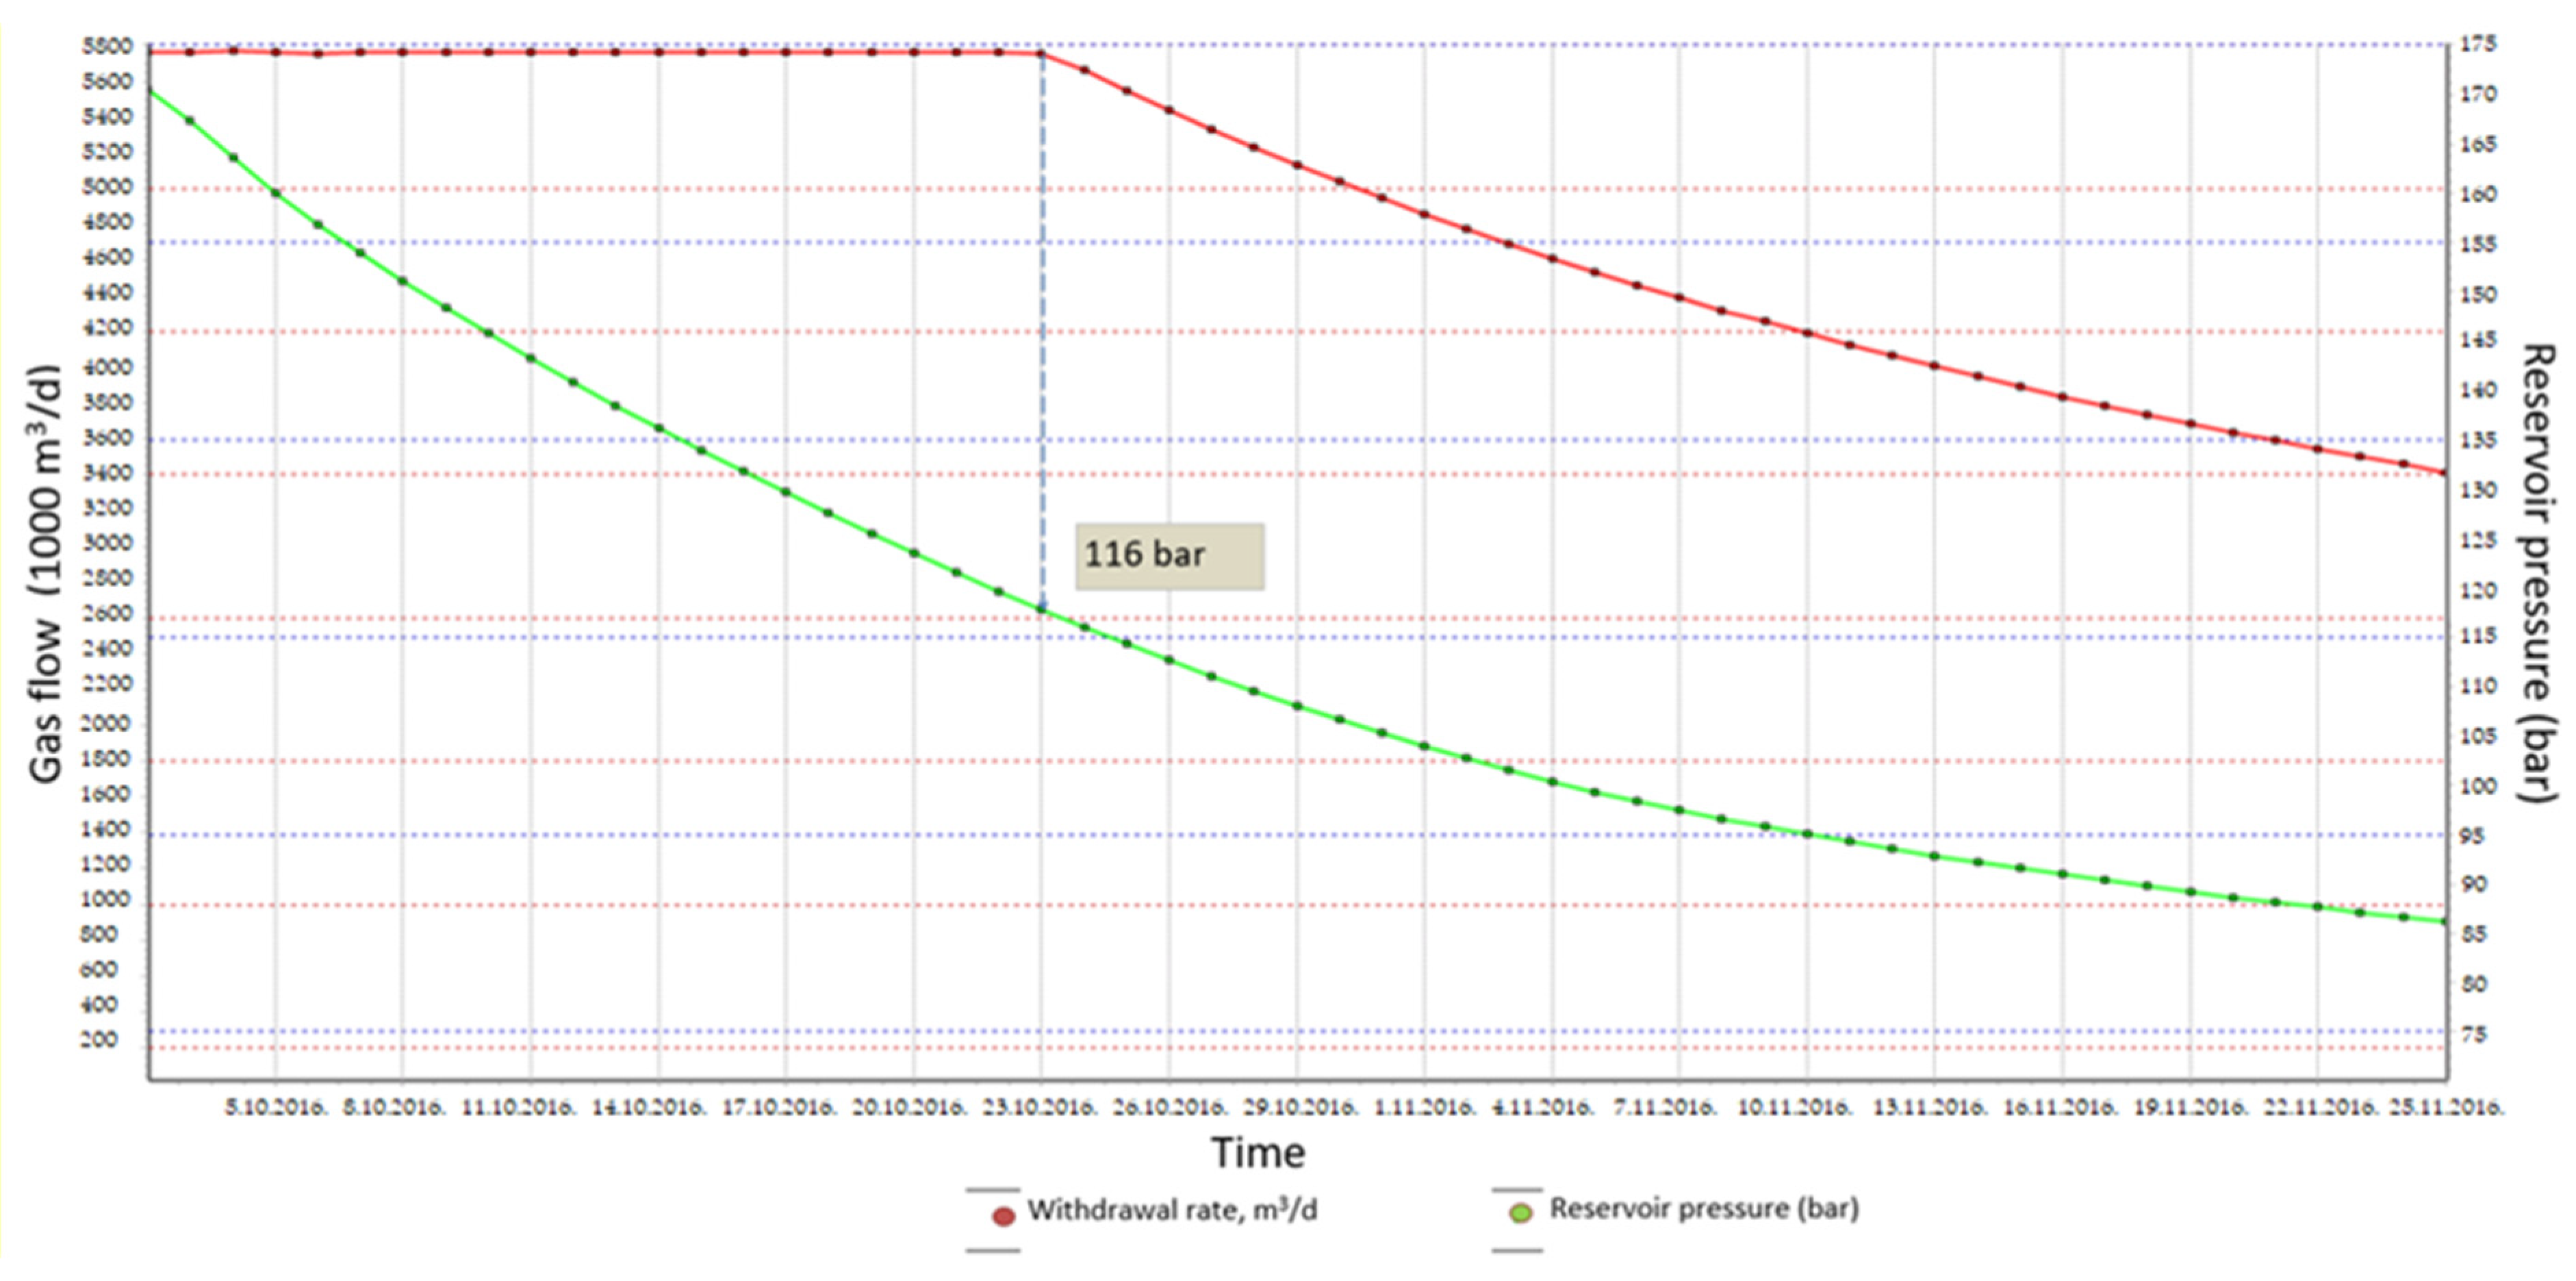
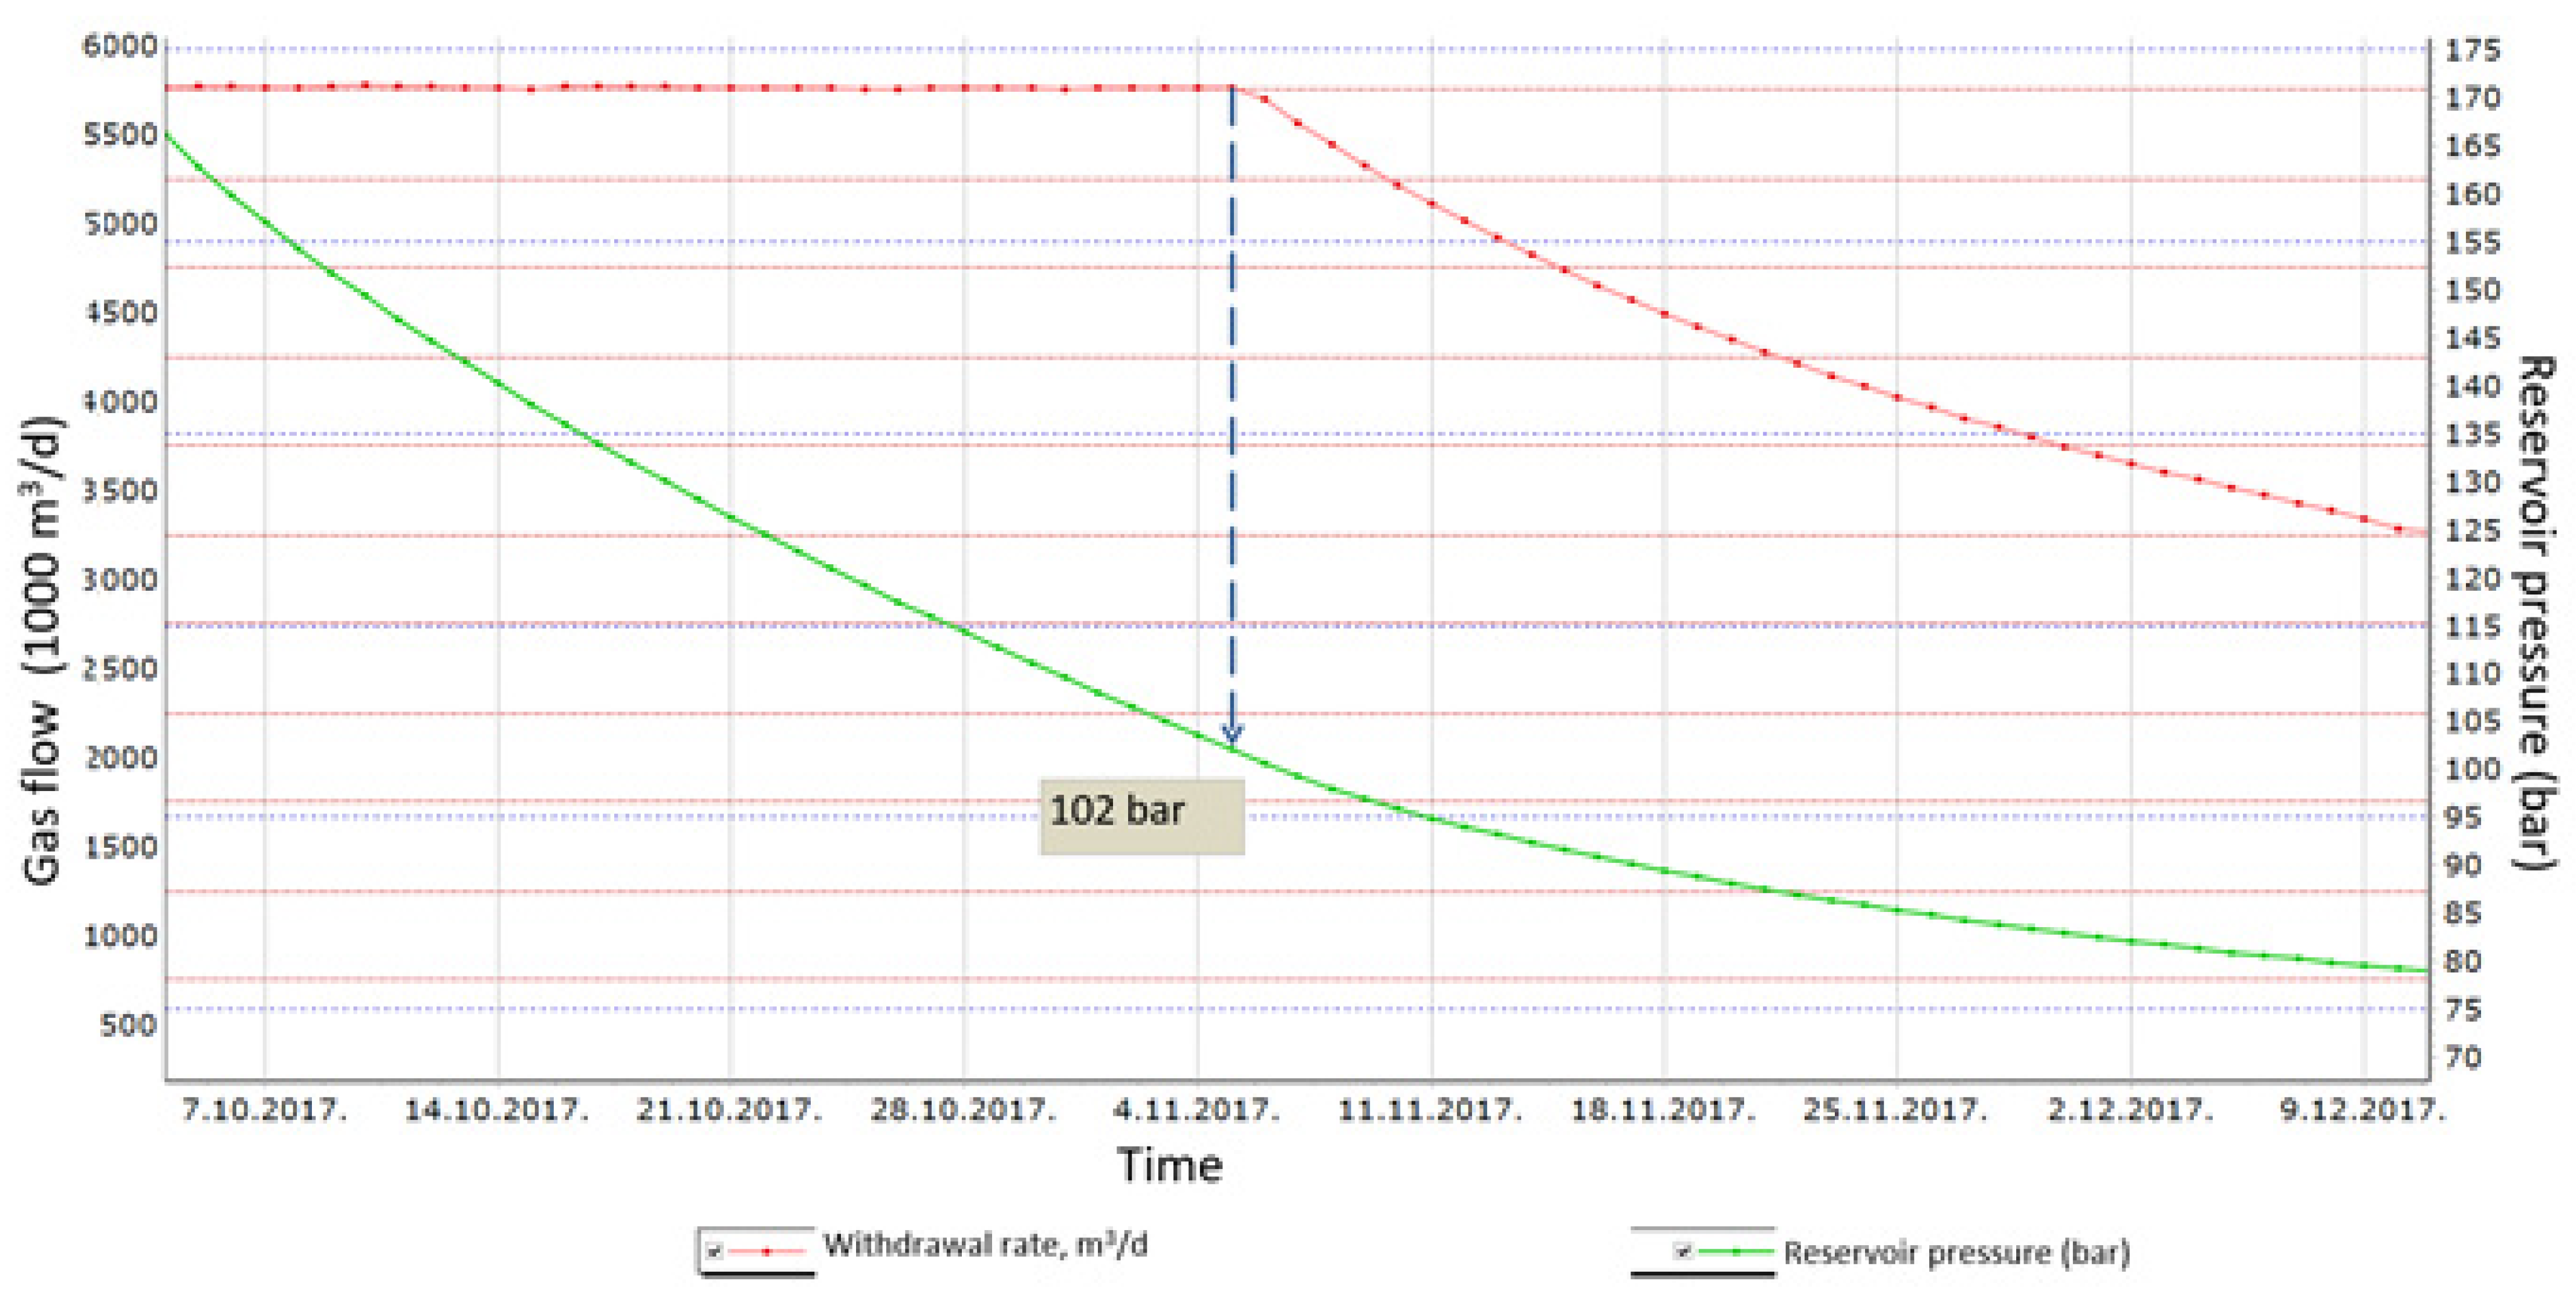
- Maximum withdrawal gas rate = 5,760,000 m3/d;
- -
- Minimum reservoir pressure = 80 bar;
- -
- Maximum reservoir pressure = 196 bar;
- -
- Minimum wellhead pressure = 55 bar;
- -
- Maximum downhole pressure = 212 bar;
- -
- Injection cycle starts at the beginning of April and ends at the beginning of October;
- -
- Withdrawal cycle starts at the beginning of October and ends at the beginning of April.
- -
- Steady-state horizontal flow;
- -
- Kinetic component of pressure gradient is negligible;
- -
- Heat transfer to the ground is assumed to be at steady state and the same material is assumed for all pipes;
- -
- The outlet pressure and temperature are calculated based on incremental energy and mass balances.
4.2. Experimental Determination of Choke Discharge Coefficient
- Cd = discharge coefficient;
- Z = compressibility factor;
- T1 = gas temperature before nozzle, K;
- Ma = molar mass of air, 28.966 × 10⁻³ kg/mol;
- R = general gas constant, 8.3145 J K−1 mol−1;
- γg = relative gas density;
- Tsc = standard temperature, K;
- psc = standard pressure, Pa;
- D = diameter of the nozzle opening, m;
- κ = adiabatic exponent, defined by the specific heat ratio cp/cv;
- p1 = gas pressure before nozzle, Pa;
- p2 = gas pressure after nozzle, Pa.
4.3. Model Simulation Scenarios
5. Data Presentation and Analysis of Results
5.1. Discharge Coefficient Calculation and Results
5.2. Influence of Choke Diameter on Head Loss
5.3. Model Simulation Run Results
6. Discussion
7. Conclusions
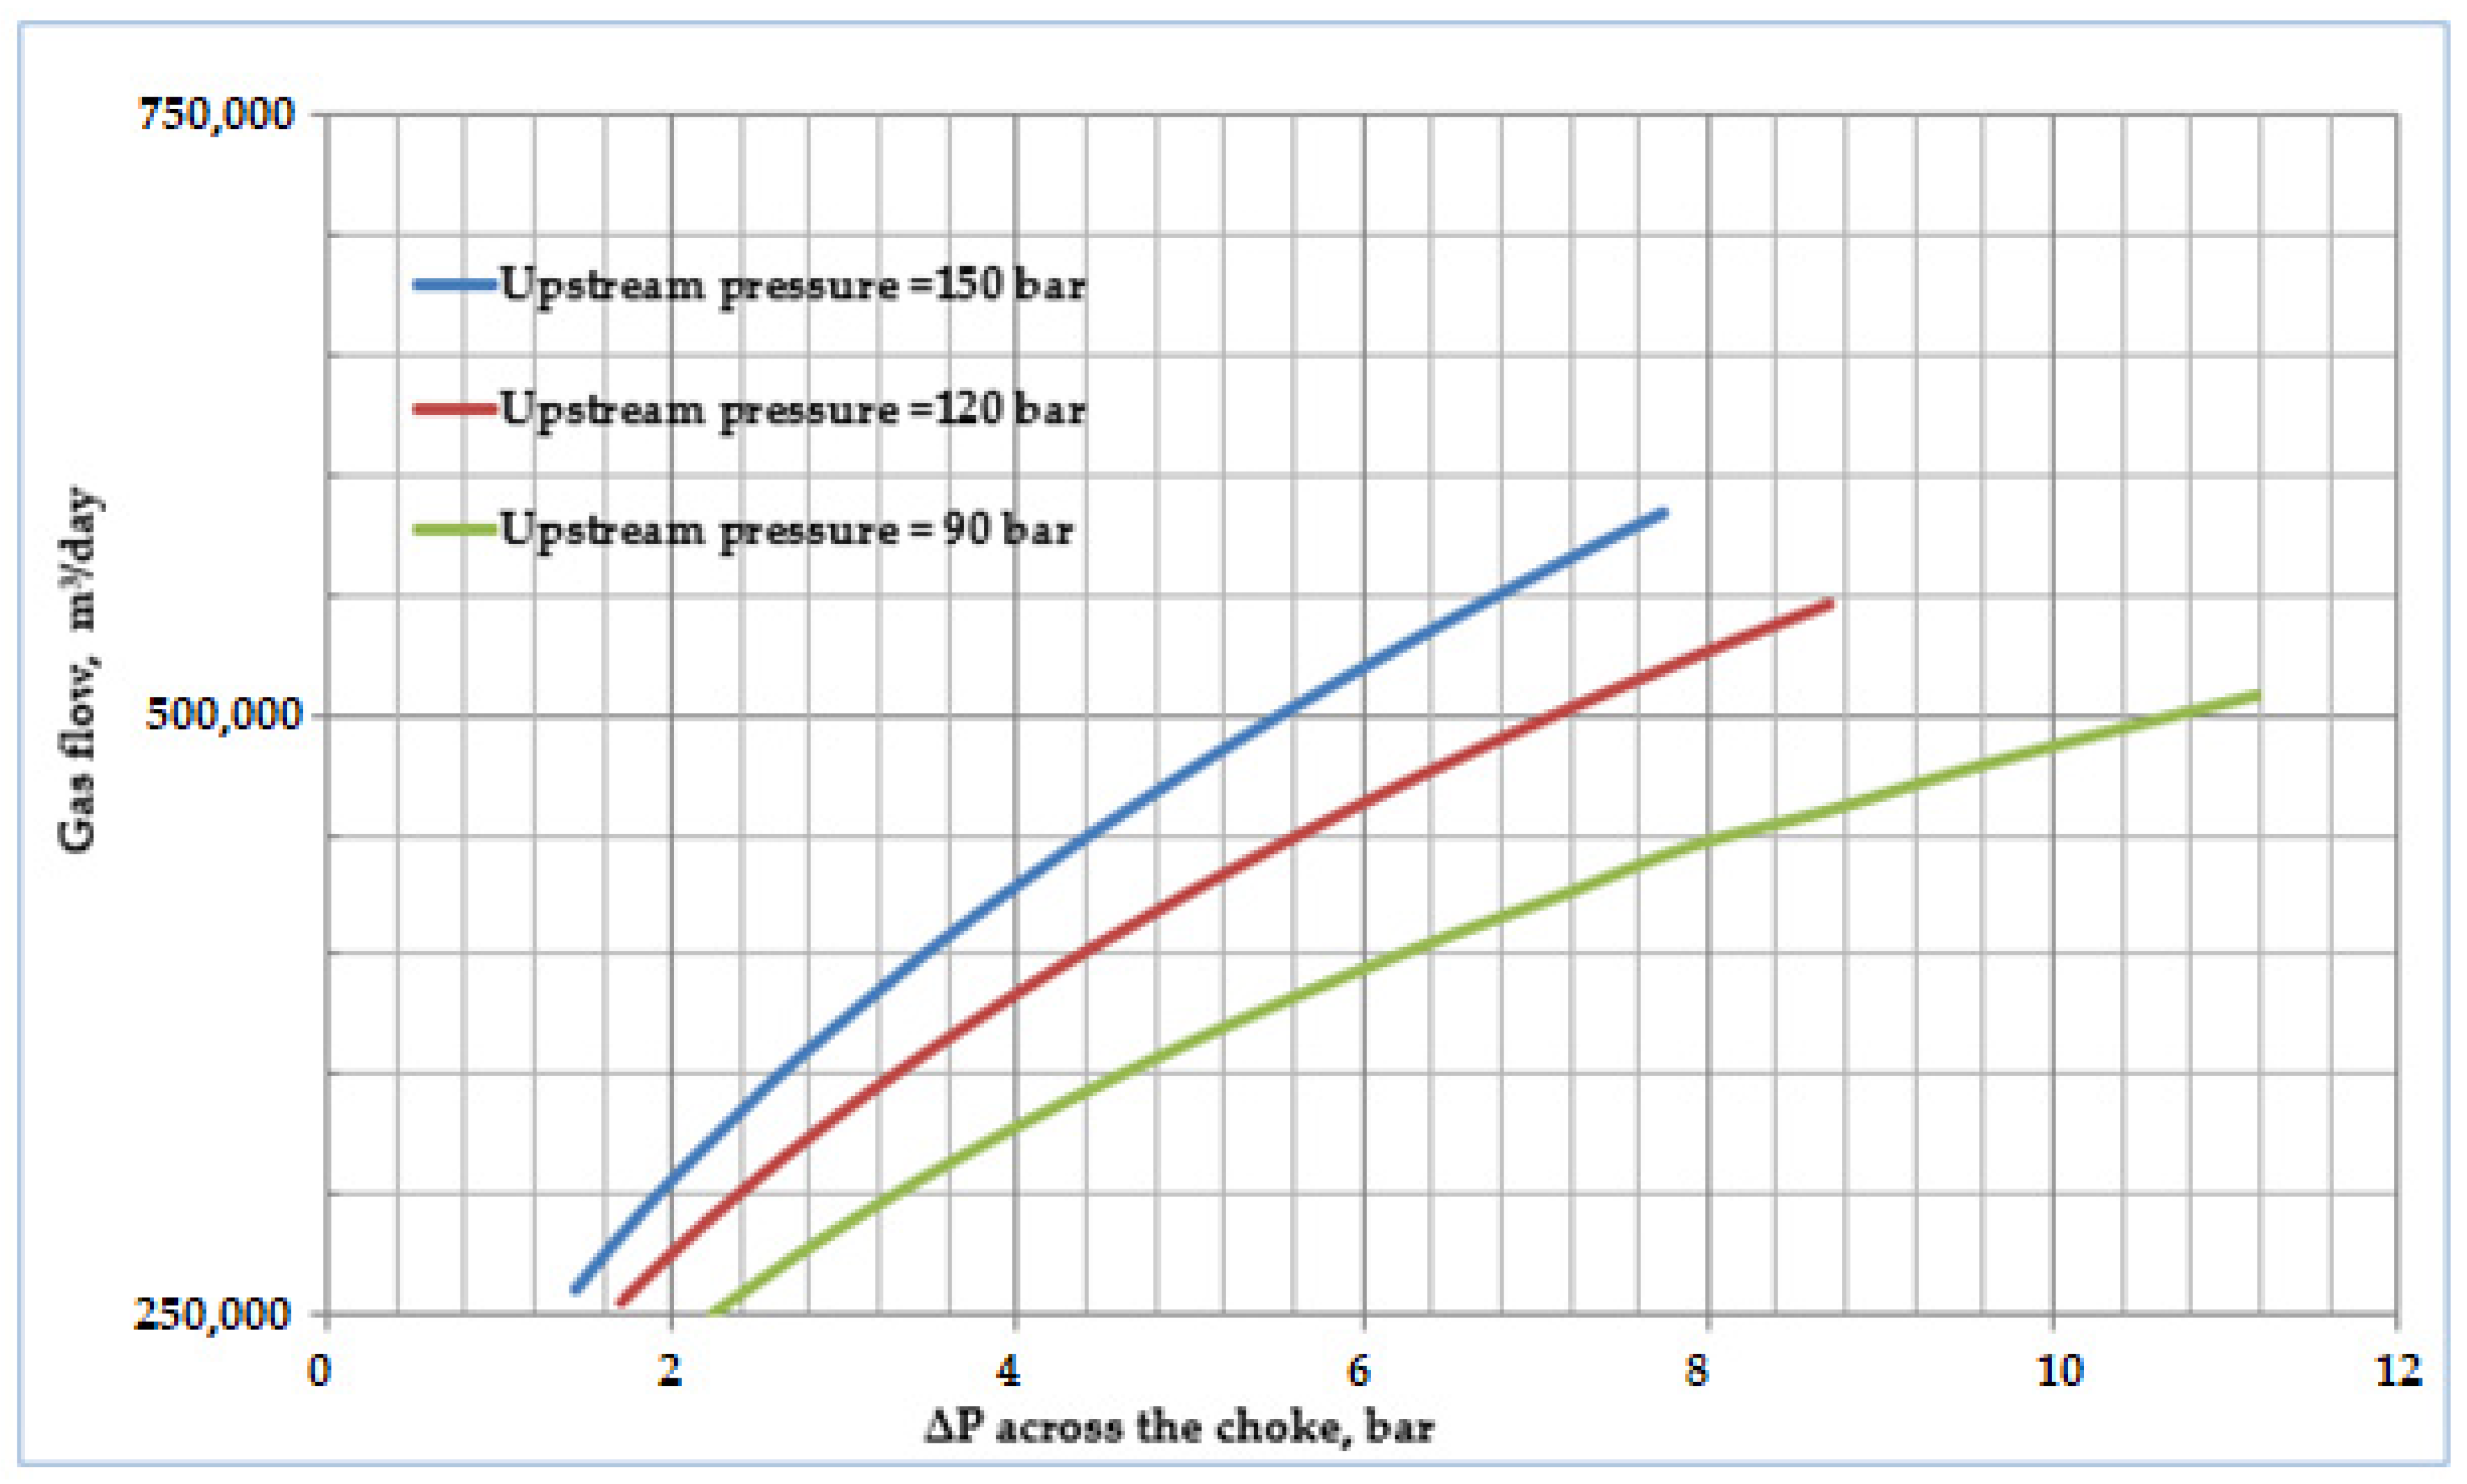
- For the subcritical flow of natural gas through the wellhead chokes (type Needle and Seat choke valve), the average value for the discharge coefficient of 0.76 was determined. The obtained coefficient was applied in the mathematical model for pressure-drop calculation on UGS chokes. With a developed mathematical model of the UGS facility, the impact of hydraulic losses (head loss) on withdrawal capacity was observed.
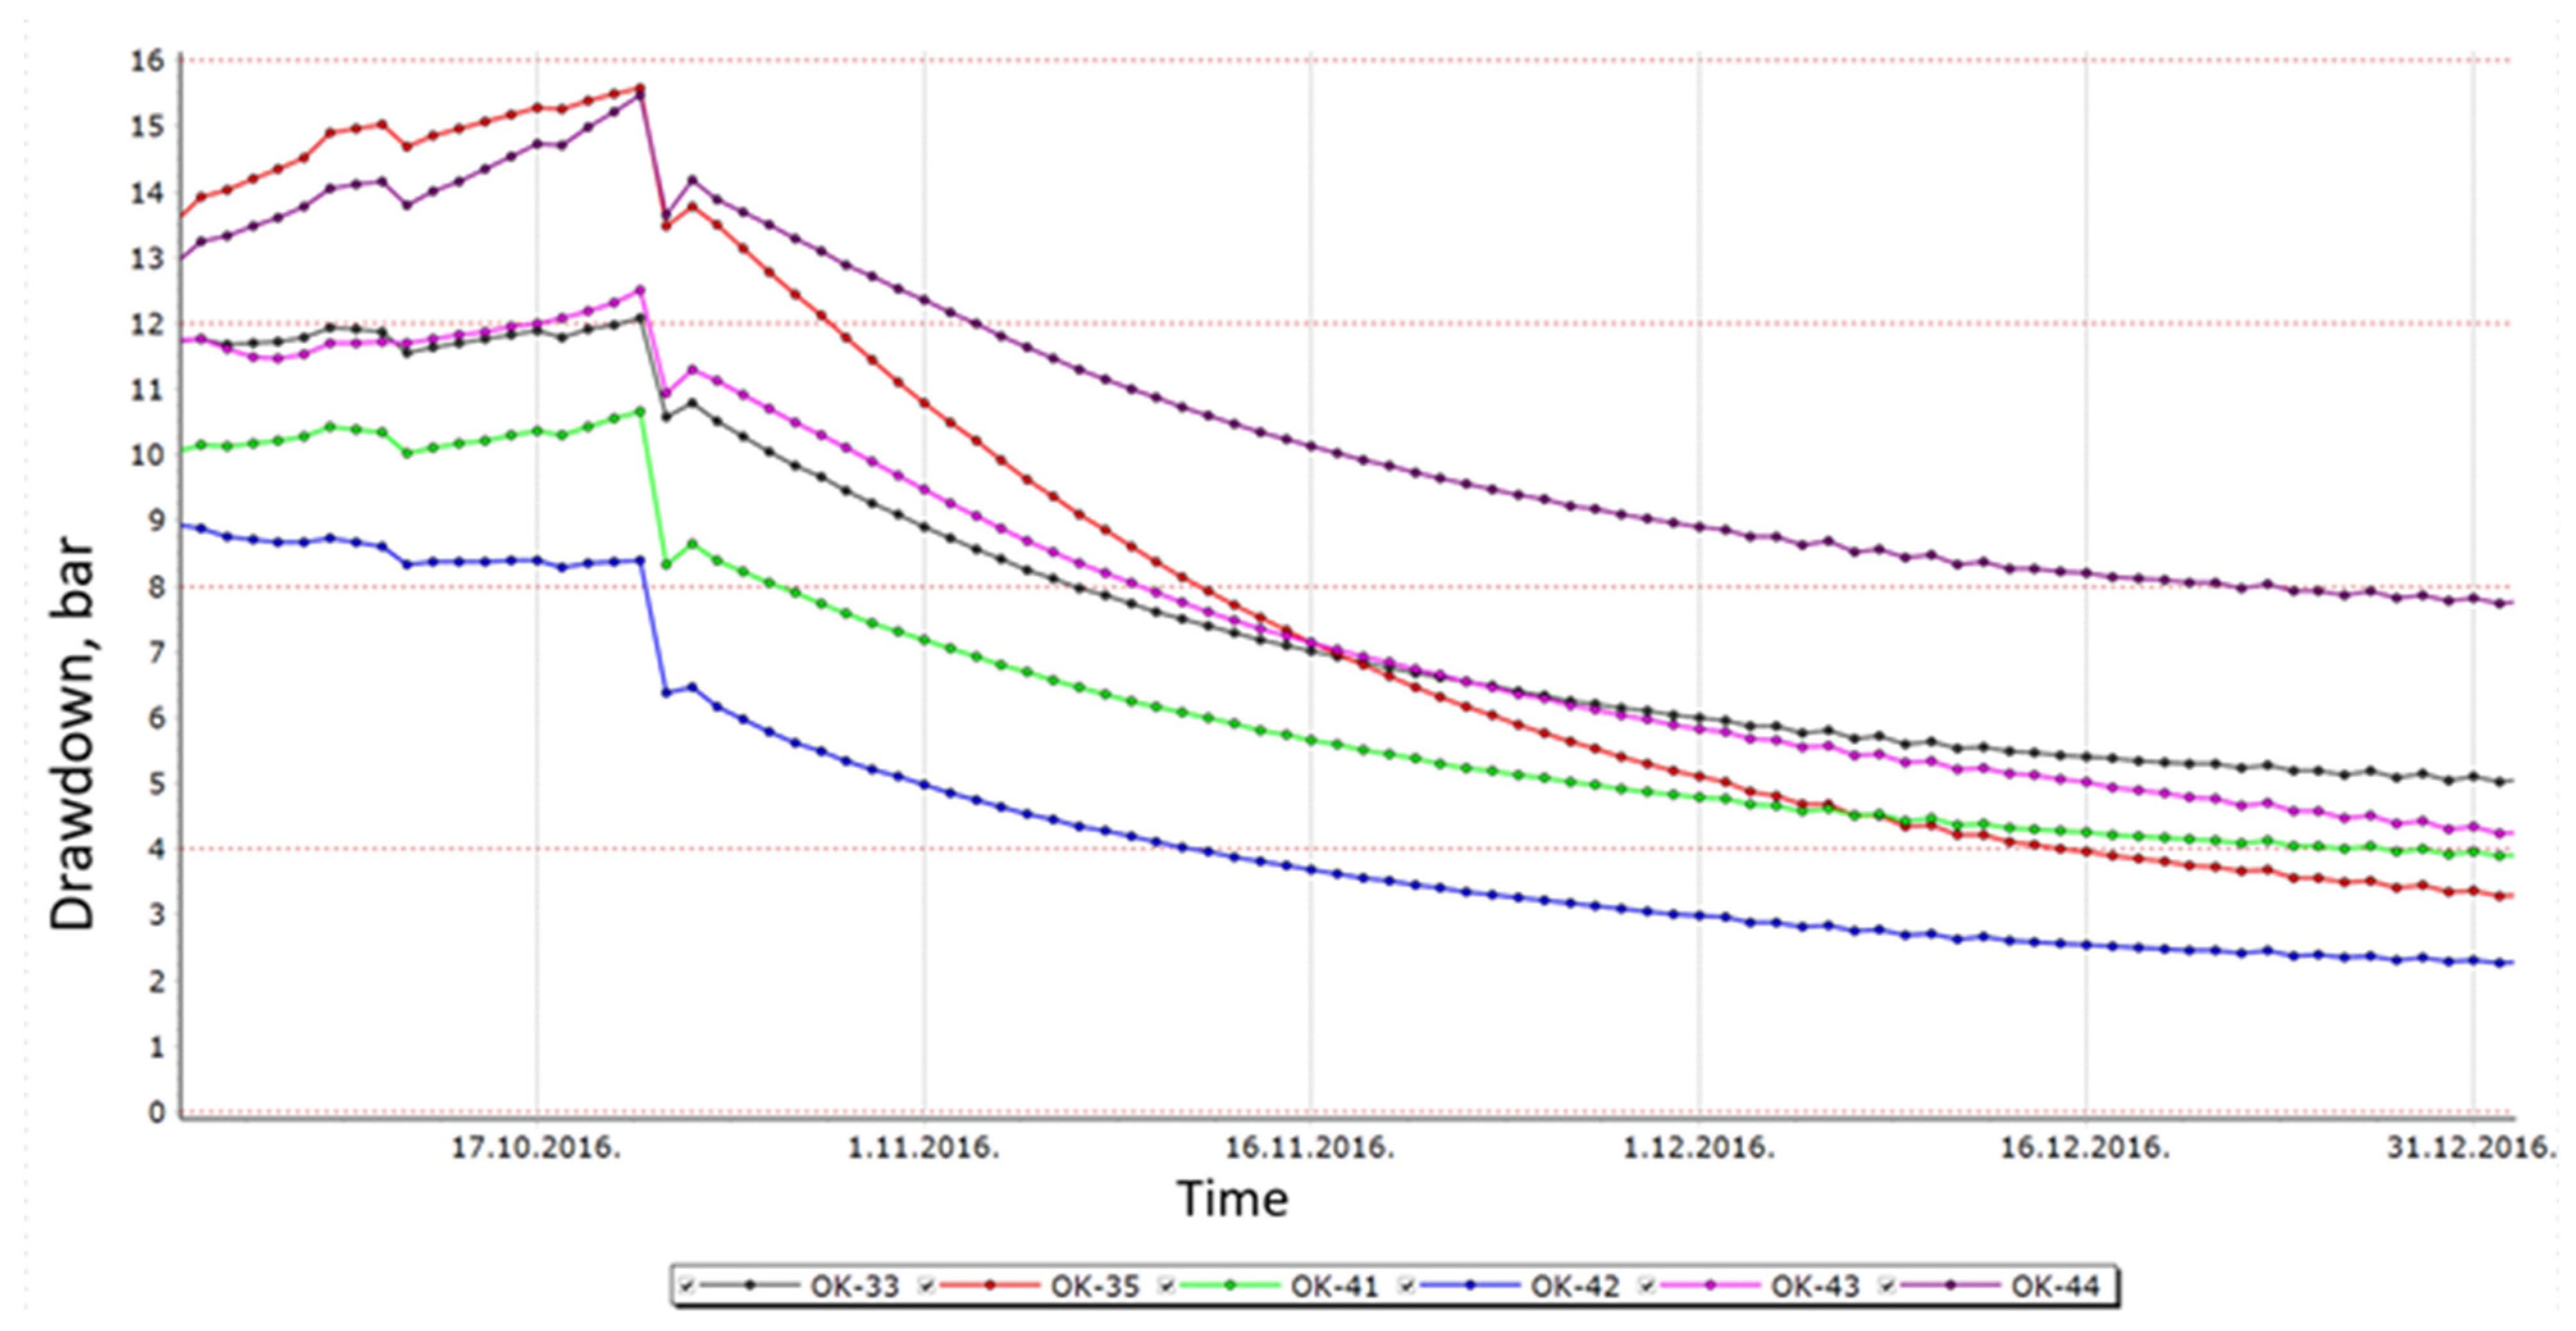
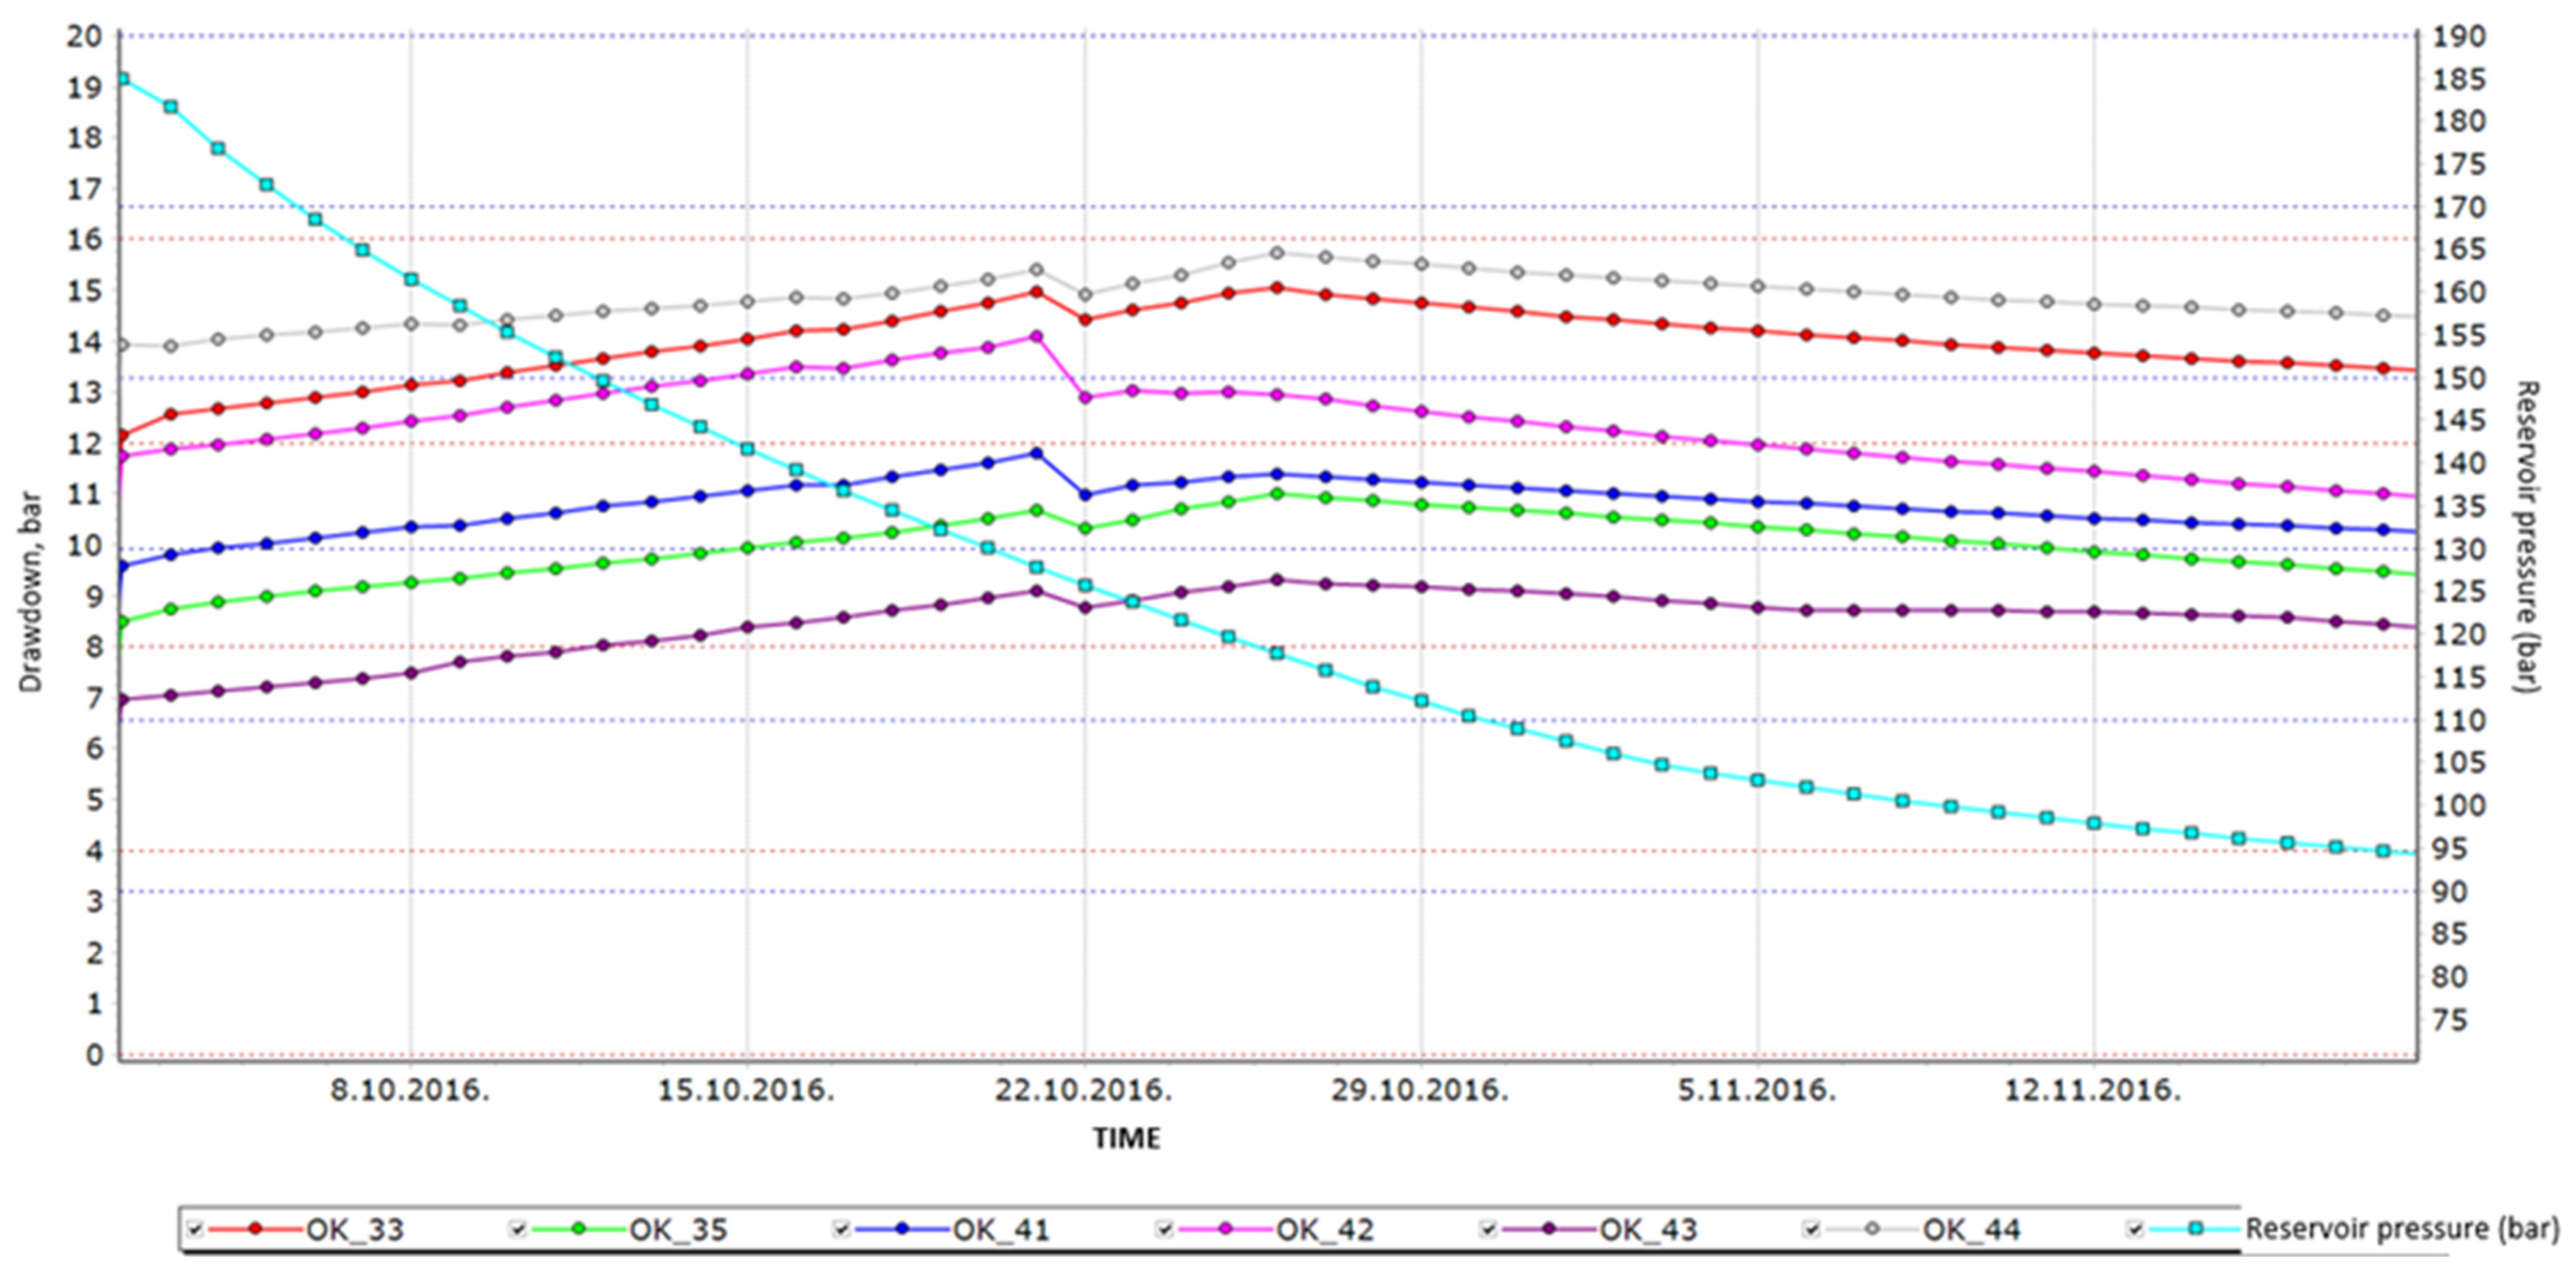
- Larger string diameter results in lower friction between gas particles and the tubing (pipe) wall, enabling higher reservoir pressure drawdown on well perforation level and gas withdrawal capacity extension by 10% related to the initial state (base case model).
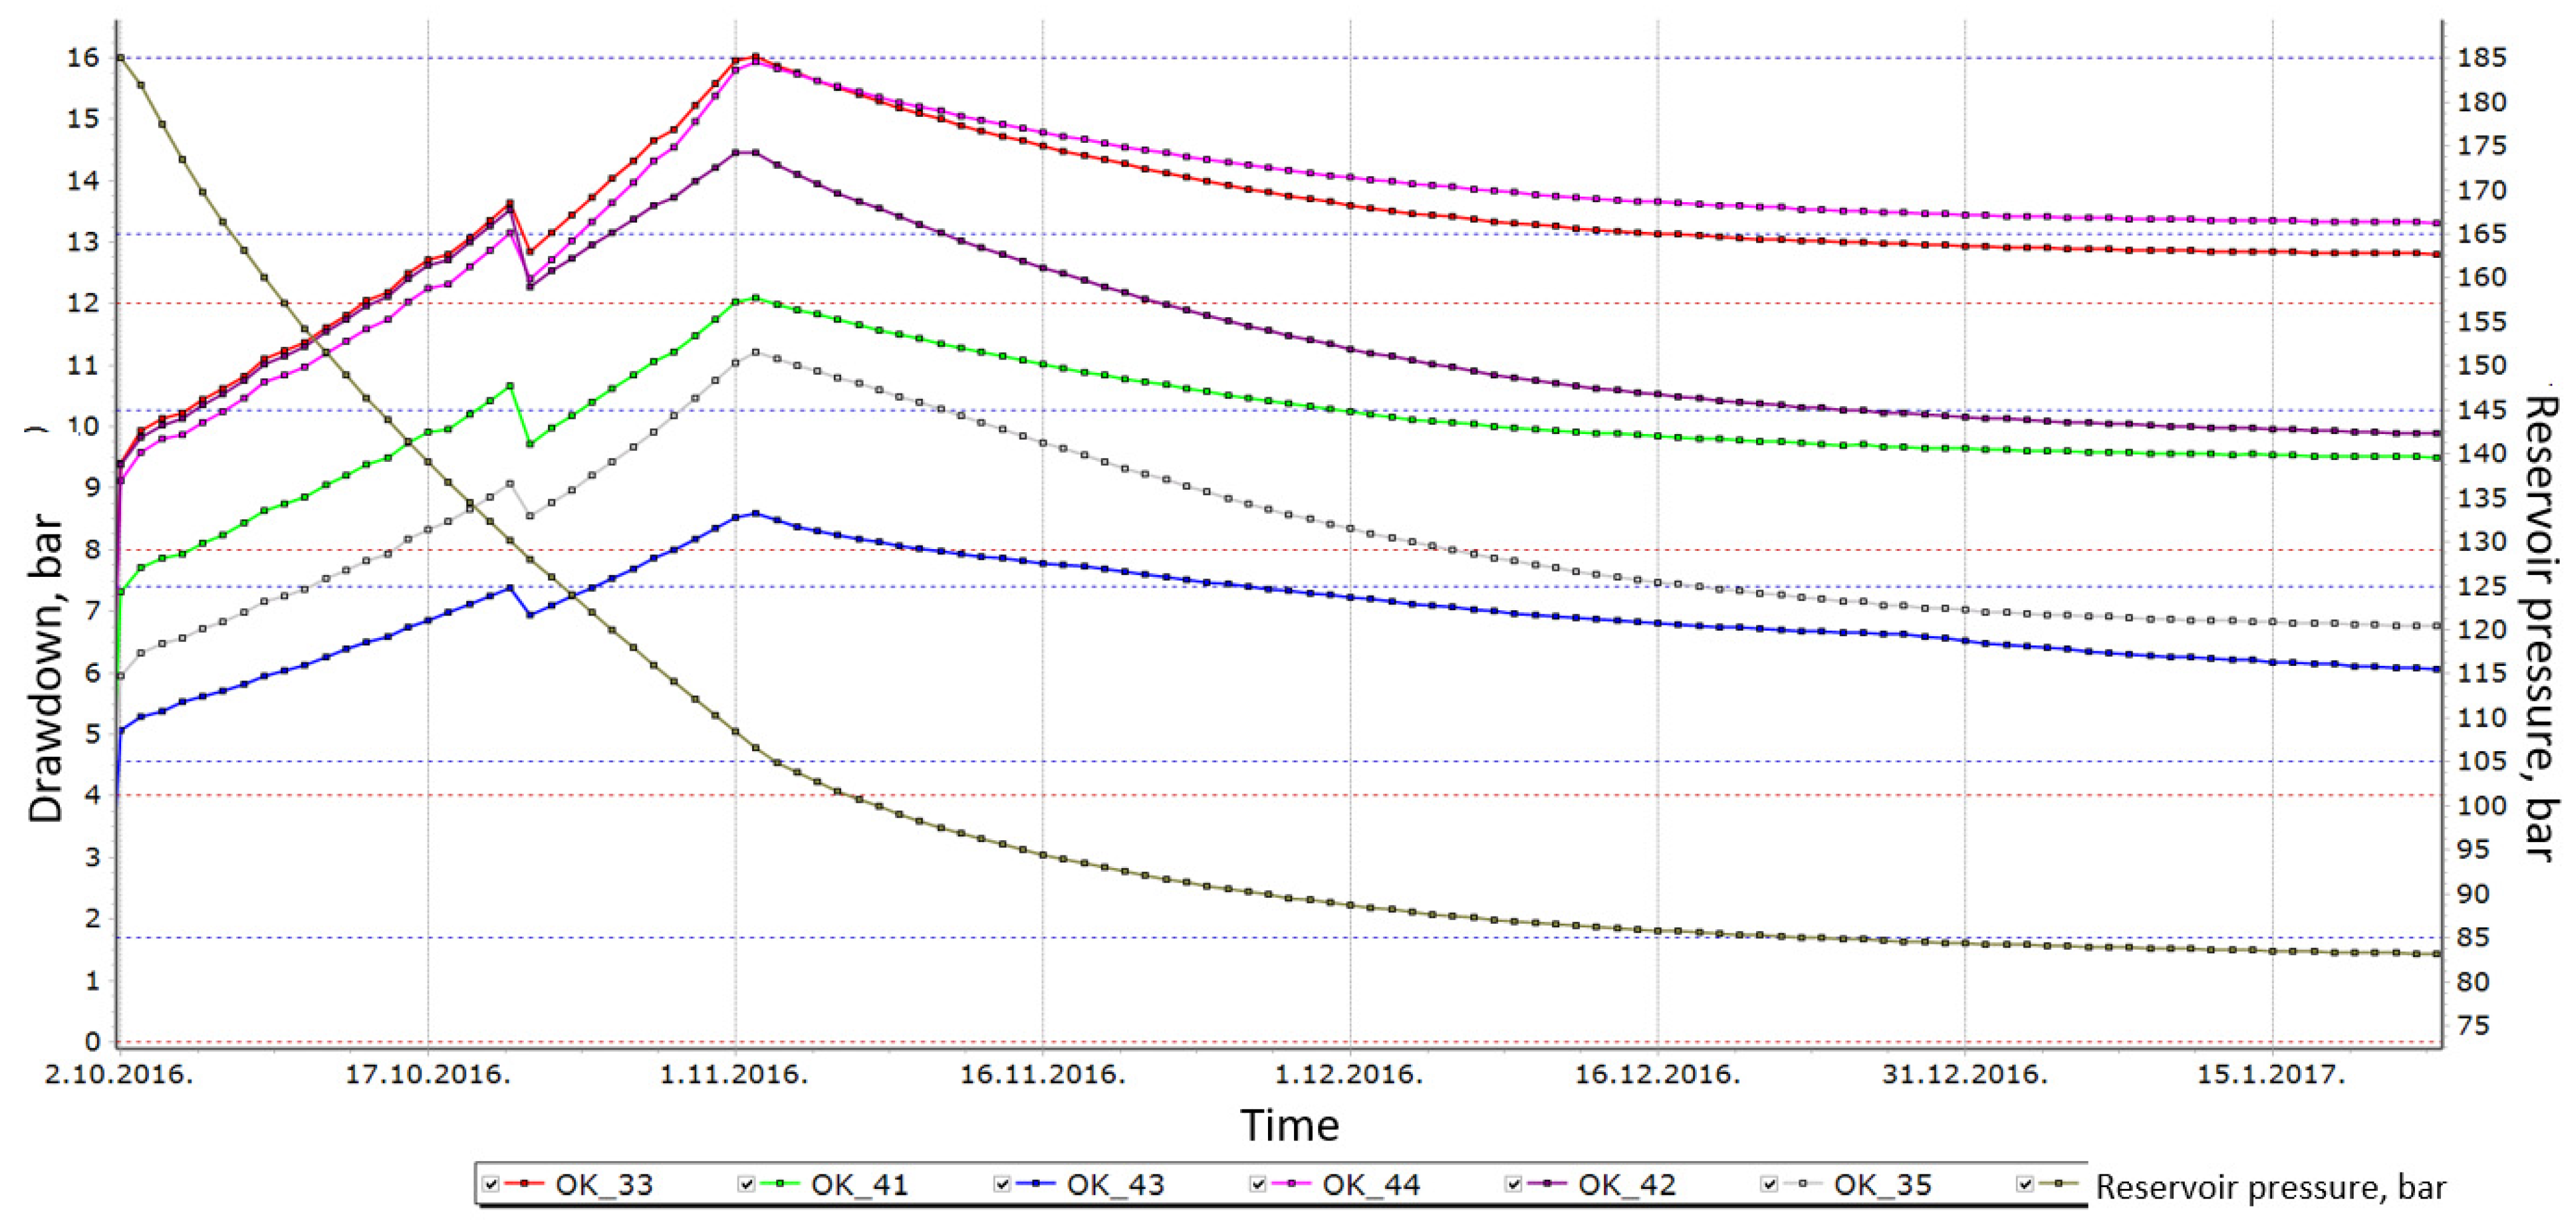
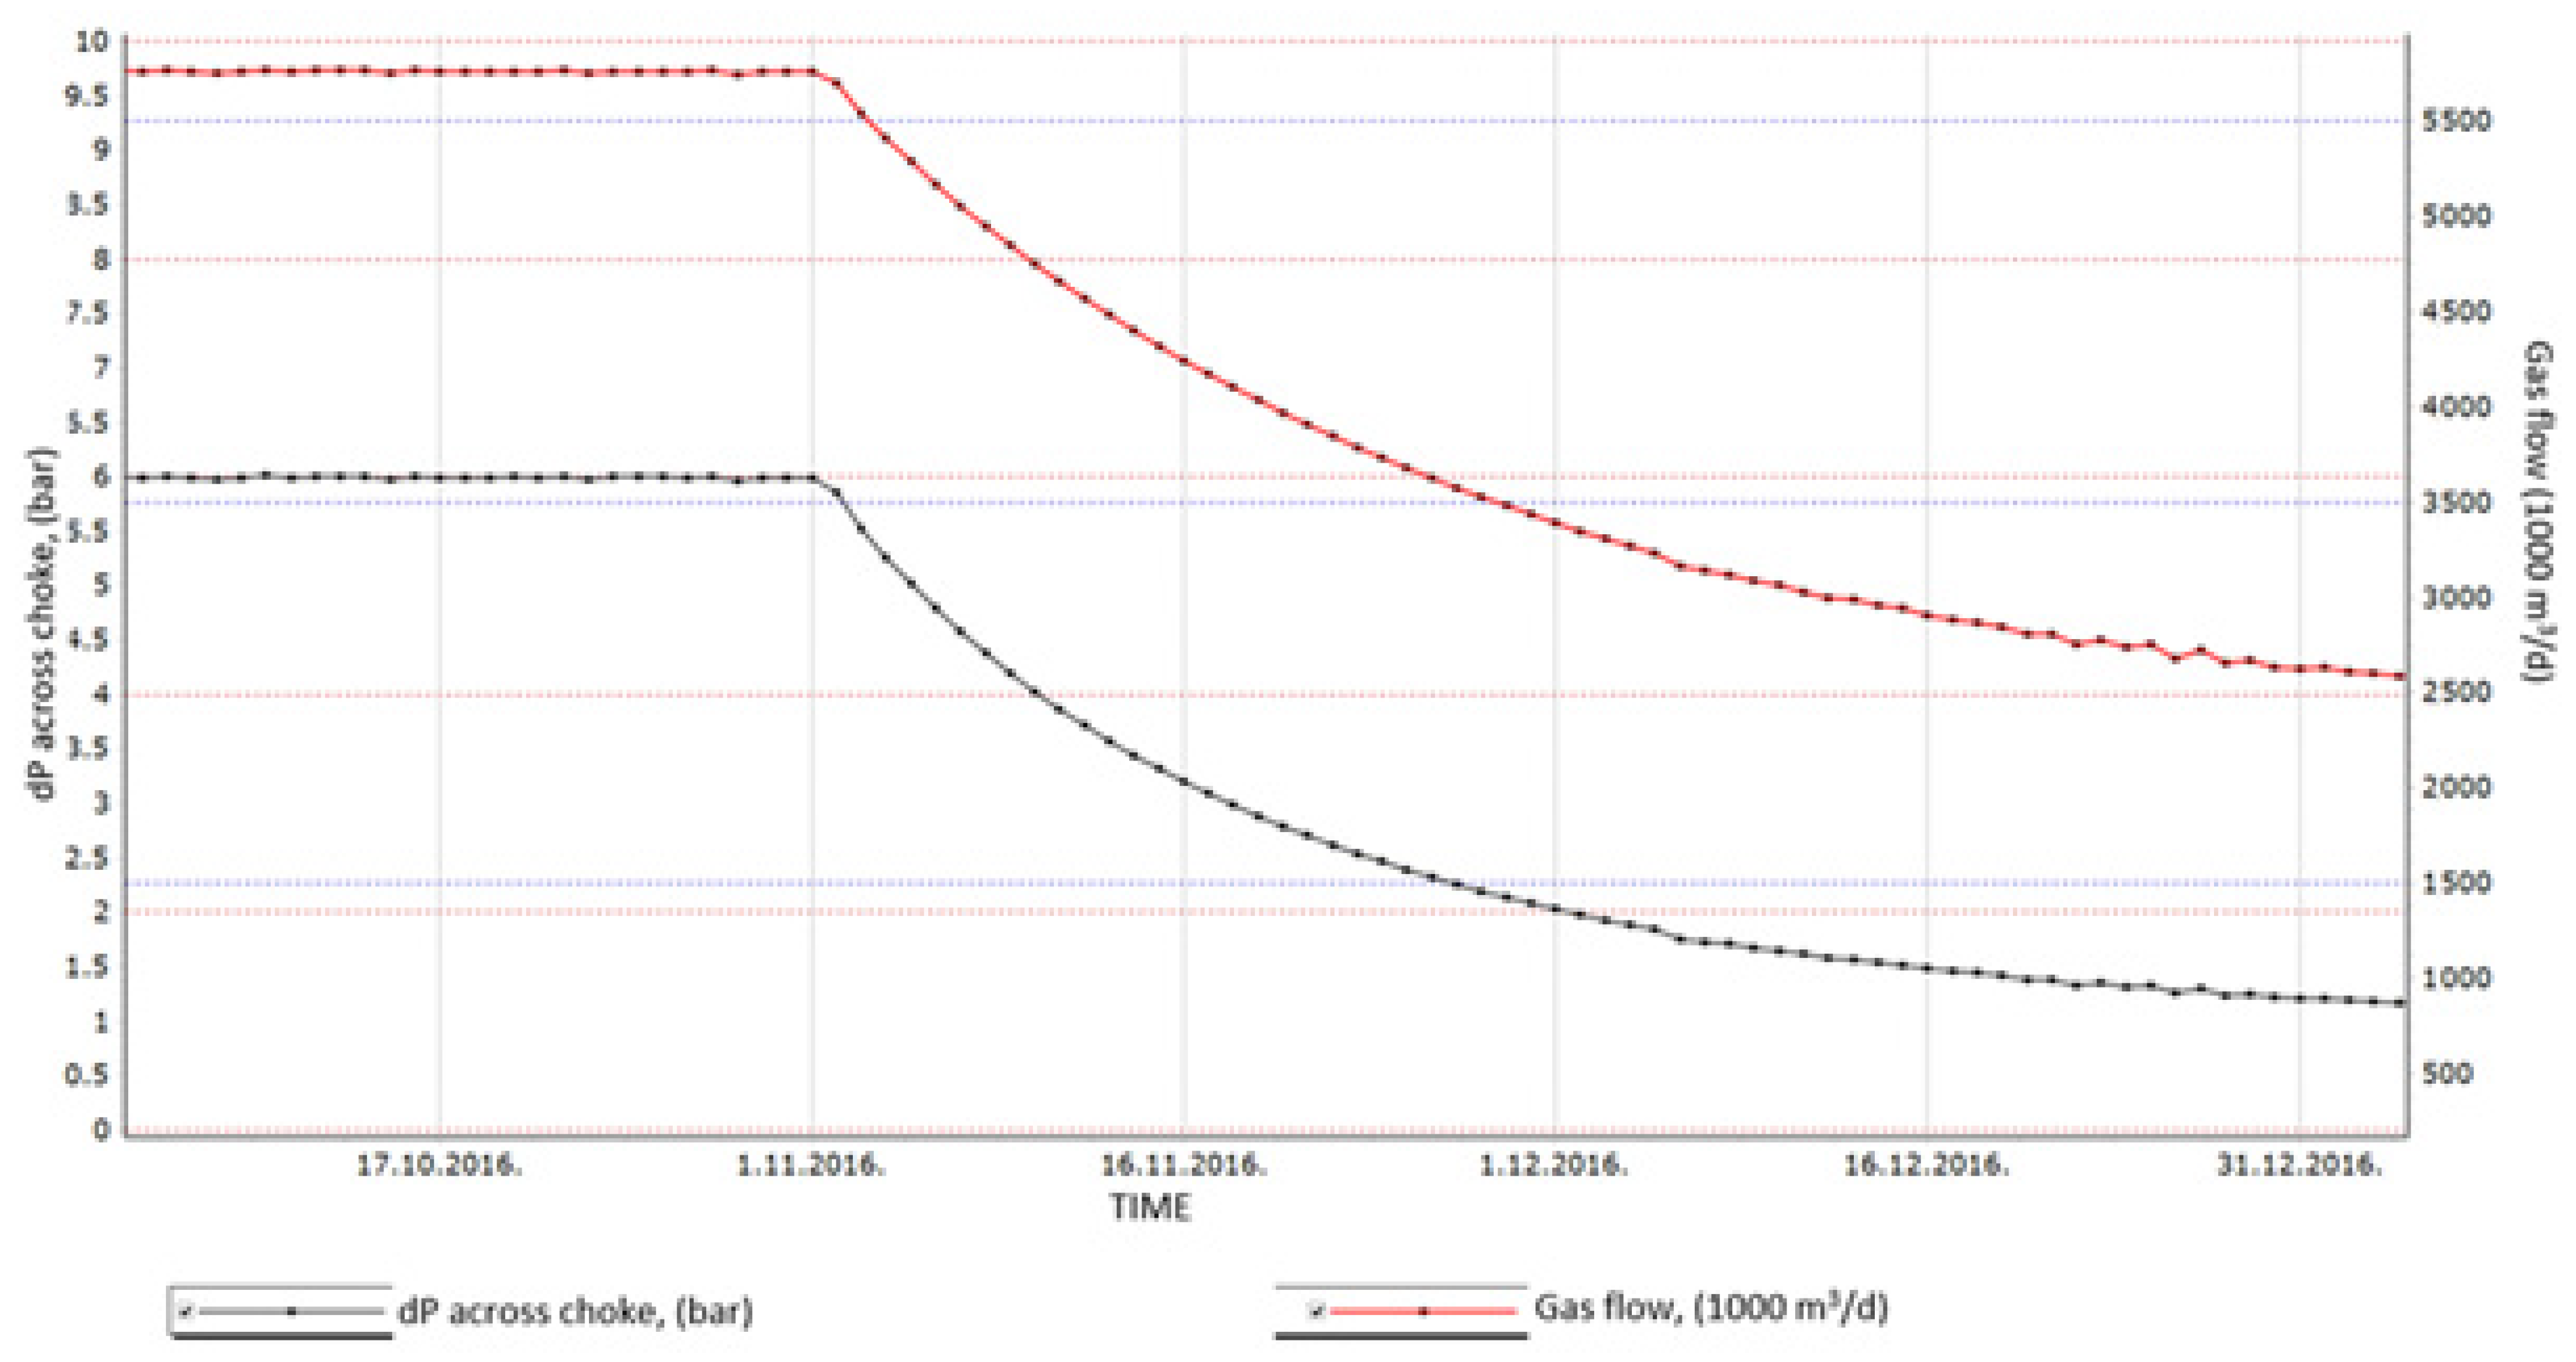
- Hydraulic losses in the chokes during the sub-critical flow of gas in the stage of full choke openness also significantly affect the UGS withdrawal capacity. This is particularly evident at low reservoir pressure due to an increase in gas flow velocity through production equipment. The implementation of a double sized choke diameter (regarding the base case scenario) increases the gas withdrawal capacity extension by 18% for a specific case scenario (Scenario 2).
- For the first time, a dynamic mathematical model was used to valorise the impact of hydraulic losses of production equipment on its working capabilities. Without the use of an integrated mathematical model, it would not be possible to systematically examine the above except by directly changing the equipment and measuring, which is an unprofitable and inappropriate procedure.
Author Contributions
Funding
Data Availability Statement
Conflicts of Interest
References
- Agate, G.; Colucci, F.; Guandalini, R.; Moia, F.; Pagotto, R.; Crosta, G.B. A Numerical Modeling Approach to Investigate the Safety Aspects of the Gas Storage in a Deep Geological Reservoir. In Proceedings of the Offshore Mediterranean Conference and Exhibition, Ravenna, Italy, 29–31 March 2017. [Google Scholar]
- Huo, H.; Li, J.; Li, Z.; Zhang, X.; He, S.; Xu, J.; Dou, P. The Feasibility Analysis of an Underground Natural Gas Storage Using a Depleted Offshore Gasfield. In Proceedings of the International Petroleum Technology Conference, Kuala Lumpur, Malaysia, 23 March–1 April 2021. [Google Scholar] [CrossRef]
- Saradva, H.; Jain, S.; Sarssam, M.; Al Hamadi, M.; Robert, M. Integrated Field Development Planning for Enhanced Condensate Recovery ECR and Gas Storage in Mature Gas Condensate Fields. In Proceedings of the Abu Dhabi International Petroleum Exhibition & Conference, Abu Dhabi, United Arab Emirates, 12–15 November 2018. [Google Scholar] [CrossRef]
- Mgbaja, U.M.; Enwere, N. Reservoir Characterization, Simulation & Estimation of Storage Capacity of depleted Reservoirs in Niger Delta for Underground Natural Gas Storage. In Proceedings of the SPE Nigeria Annual International Conference and Exhibition, Lagos, Nigeria, 31 July–2 August 2017. [Google Scholar] [CrossRef]
- Song, X.; Peng, C.; Li, G.; Wen, K. A Probabilistic Model to Evaluate the Operation Reliability of the Underground System in Underground Gas Storage Transformed from Depleted Gas Reservoir. In Proceedings of the International Petroleum Technology Conference, Bangkok, Thailand, 14–16 November 2016. [Google Scholar] [CrossRef]
- Mu, L.; Liao, X.; Yu, Q.; Hao, L.; Zhang, J.; Zhao, J.; Wu, J. Study on Operation Strategy of Aquifer Underground Gas Storage Using CO2 as Cushion Gas. In Proceedings of the Carbon Management Technology Conference, Houston, TX, USA, 15–18 July 2019. [Google Scholar] [CrossRef]
- Jin, F.; Xi, W.; Chen, C.; Shunyuan, Z.; Bingshan, L. Technical and Risk Evaluation of Underground Gas Storage Construction in Salt Caverns and Its Feasibility in South America. In Proceedings of the SPE Latin America and Caribbean Petroleum Engineering Conference, Buenos Aires, Argentina, 18–19 May 2017. [Google Scholar] [CrossRef]
- Galić., H.; Cawley, S.; Bishop, S.; Todman, S.; Gas, F. CO2 Injection into Depleted Gas Reservoirs. In Proceedings of the SPE Offshore Europe Oil & Gas Conference, Aberdeen, UK, 8–11 September 2009. [Google Scholar] [CrossRef]
- Khodri, D.; Lehuen, L.P.; Labaune, B.; Nabil, R. Modeling of reservoir to surface network coupling: A case study of gas storage management. In Proceedings of the SPE Annual Technical Conference and Exhibition, San Antonio, TX, USA, 5–8 October 1997. [Google Scholar] [CrossRef]
- Brown, K.G.; Sawyer, W.K. Practical Methods to Improve Storage Operations—A Case Study. In Proceedings of the SPE Eastern Regional Conference and Exhibition, Charleston, SC, USA, 20–22 October 1999. [Google Scholar] [CrossRef]
- McVay, D.A.; Spivey, J. Optimizing Gas-Storage Reservoir Performance. SPE Reserv. Eval. Eng. 2001. 4, 173–178. [CrossRef]
- Kuncir, M.; Chang, J.; Mansdorfer, J.; Dougherty, E. Analysis and Optimal Design of Gas Storage Reservoirs. In Proceedings of the SPE Eastern Regional/AAPG Eastern Section Joint Meeting, Pittsburgh, PA, USA, 6–10 September 2003. [Google Scholar] [CrossRef]
- Bagci, A.S.; Ozturk, B. Performance analysis of horizontal wells for underground gas storage in depleted gas fields. In Proceedings of the Eastern Regional Meeting, Lexington, KY, USA, 17–19 October 2007. [Google Scholar] [CrossRef]
- Moradi, B. Study of gas injection effects on rock and fluid of a gas condensate reservoir during underground gas storage process. In Proceedings of the Latin American and Caribbean Petroleum Engineering Conference, Cartagena de Indias, Colombia, 31 May–3 June 2009. [Google Scholar] [CrossRef]
- Sun, J.; Wang, J.; Zheng, D.; Xu, H.; Li, C.; Zhao, K.; Zhong, R. Regional scale 3D geomechanical modeling for evaluating caprock integrity and fault leakage potential during underground gas storage operations in a produced field. In Proceedings of the SPE Reservoir Characterisation and Simulation Conference and Exhibition, Abu Dhabi, United Arab Emirates, 8–10 May 2017. [Google Scholar] [CrossRef]
- Kelkar, M. Natural Gas Production Engineering; PennWell: Tulsa, OK, USA, 2008; p. 571. [Google Scholar]
- Zelenika, I.; The Underground Gas Storage Volume Modelling with Respect to Reservoir Parameters and Production Equipment (In Croatian: Modeliranje radnog obujma podzemnog skladišta plina u funkciji ležišnih parametara i proizvodne opreme). Ph.D. Thesis, University of Zagreb, Faculty of Mining, Geology and Petroleum Engineering, Zagreb, Croatia, 17 May 2017. Available online: https://repozitorij.rgn.unizg.hr/islandora/object/rgn%3A628/datastream/PDF/view (accessed on 17 May 2021).
- Weymouth, T.R. Problems in natural gas engineering. Trans. Am. Soc. Mech. Eng. 1912, 34, 185–231. [Google Scholar]





| Pipeline | Length (m) | Relative Roughness (m) | Pipe ID (m) | Pipe OD (m) |
|---|---|---|---|---|
| Platforma 1 to CP | 2050 | 1.524·× 10−5 | 0.1397 | 0.1524 |
| Platforma 2 to CP | 1640 | 1.524 × 10⁻⁵ | 0.1397 | 0.1524 |
| Platforma 3 to CP | 360 | 1.524 × 10⁻⁵ | 0.1397 | 0.1524 |
| Platforma 4 to CP | 1500 | 1.524 × 10⁻⁵ | 0.1397 | 0.1524 |
| Platforma 5 to CP | 750 | 1.524 × 10⁻⁵ | 0.1397 | 0.1524 |
| Platforma 6 to CP | 640 | 1.524 × 10⁻⁵ | 0.1397 | 0.1524 |
| CP—central gas station, Platforma—UGS well site | ||||
| Pipeline pressure drop correlation | Weymouth (1912) | |||
| Well | Case | Choke ID, (m) | Choke ID at Reduction Station, (m) | Tubing ID, (m) |
|---|---|---|---|---|
| OK-33 | Base case | 0.0254 | 0.054 | 0.076 |
| Case 1 | 0.0254 | 0.054 | 0.1016 | |
| Case 2 | 0.0508 | 0.072 | 0.076 | |
| OK-35 | Base case | 0.0254 | 0.054 | 0.076 |
| Case 1 | 0.0254 | 0.054 | 0.1016 | |
| Case 2 | 0.0508 | 0.072 | 0.076 | |
| OK-41 | Base case | 0.0254 | 0.054 | 0.076 |
| Case 1 | 0.0254 | 0.054 | 0.1016 | |
| Case 2 | 0.0508 | 0.072 | 0.076 | |
| OK-42 | Base case | 0.0254 | 0.054 | 0.076 |
| Case 1 | 0.0254 | 0.054 | 0.1016 | |
| Case 2 | 0.0508 | 0.072 | 0.076 | |
| OK-43 | Base case | 0.0254 | 0.054 | 0.076 |
| Case 1 | 0.0254 | 0.054 | 0.1016 | |
| Case 2 | 0.0508 | 0.072 | 0.076 | |
| OK-44 | Base case | 0.0254 | 0.054 | 0.076 |
| Case 1 | 0.0254 | 0.054 | 0.1016 | |
| Case 2 | 0.0508 | 0.072 | 0.076 | |
| All other UGS wells | Base case | 0.0254 | 0.054 | 0.076 |
| Case 1 | 0.0254 | 0.054 | 0.1016 | |
| Case 2 | 0.0508 | 0.072 | 0.076 |
| Well | Data Point | Upstream Pressure (Choke) P1 (MPa) | Downstream Pressure (Choke) P2 (MPa) | Gas Temperature (Upstream) T1 (K) | Measured Gas Flow Q (m3/h) | Choke ID (m) | Cp (KJ/kg/K) | Cv (KJ/kg/K) | Specific Heat Ratio κ | Z-Factor | Cd |
|---|---|---|---|---|---|---|---|---|---|---|---|
| OK-41 | I | 11.8 | 11.68 | 328.15 | 8739 | 0.0254 | 2.95 | 1.84 | 1.6 | 0.906 | 0.74 |
| II | 10.8 | 10.73 | 327.15 | 6383 | 0.0254 | 2.9 | 1.84 | 1.57 | 0.909 | 0.766 | |
| III | 7.48 | 7.17 | 328.15 | 10,669 | 0.0254 | 2.7 | 1.84 | 1.46 | 0.928 | 0.747 | |
| IV | 7.8 | 7.66 | 325.15 | 7536 | 0.0254 | 2.73 | 1.83 | 1.49 | 0.923 | 0.764 | |
| V | 11.22 | 10.97 | 334.15 | 11,943 | 0.0254 | 2.9 | 1.84 | 1.57 | 0.917 | 0.765 | |
| OK-33 | I | 11.88 | 11.58 | 332.15 | 13,519 | 0.0254 | 2.94 | 1.84 | 1.59 | 0.913 | 0.765 |
| II | 10.5 | 10.21 | 332.15 | 12,416 | 0.0254 | 2.86 | 1.87 | 1.52 | 0.917 | 0.757 | |
| III | 7.5 | 6.63 | 334.15 | 16,512 | 0.0254 | 2.69 | 1.86 | 1.43 | 0.934 | 0.744 | |
| IV | 7.6 | 7.21 | 334.15 | 11,811 | 0.0254 | 2.7 | 1.84 | 1.46 | 0.934 | 0.745 | |
| V | 11.48 | 11 | 335.15 | 16,430 | 0.0254 | 2.91 | 1.83 | 1.59 | 0.918 | 0.764 | |
| OK-35 | I | 11.55 | 11.51 | 325.15 | 5042 | 0.0254 | 2.95 | 1.88 | 1.56 | 0.903 | 0.771 |
| II | 10.21 | 10.17 | 326.15 | 4703 | 0.0254 | 2.87 | 1.86 | 1.54 | 0.91 | 0.769 | |
| III | 6.86 | 6.63 | 331.15 | 8780 | 0.0254 | 2.66 | 1.88 | 1.41 | 0.936 | 0.756 | |
| IV | 7.17 | 7.06 | 331.15 | 6315 | 0.0254 | 2.68 | 1.86 | 1.44 | 0.933 | 0.763 | |
| V | 10.73 | 10.57 | 331.15 | 9457 | 0.0254 | 2.88 | 1.84 | 1.56 | 0.915 | 0.767 | |
| OK-44 | I | 11.66 | 11.55 | 331.15 | 8236 | 0.0254 | 2.93 | 1.84 | 1.59 | 0.912 | 0.769 |
| II | 10.32 | 10.23 | 329.15 | 7015 | 0.0254 | 2.86 | 1.87 | 1.53 | 0.914 | 0.768 | |
| III | 6.94 | 6.63 | 334.15 | 10,094 | 0.0254 | 2.66 | 1.88 | 1.41 | 0.938 | 0.756 | |
| IV | 7.28 | 7.09 | 332.15 | 8274 | 0.0254 | 2.69 | 1.86 | 1.45 | 0.934 | 0.761 | |
| V | 11.12 | 10.94 | 332.15 | 10,189 | 0.0254 | 2.9 | 1.85 | 1.57 | 0.915 | 0.766 | |
| OK-45 | I | 10.72 | 10.58 | 331.15 | 8856 | 0.0254 | 2.88 | 1.85 | 1.56 | 0.915 | 0.767 |
| II | 9 | 8.74 | 332.15 | 10,812 | 0.0254 | 2.78 | 1.88 | 1.48 | 0.924 | 0.76 | |
| III | 8.5 | 8.28 | 331.15 | 9693 | 0.0254 | 2.75 | 1.85 | 1.49 | 0.925 | 0.761 | |
| IV | 6.3 | 5.97 | 330.15 | 9907 | 0.0254 | 2.63 | 1.86 | 1.41 | 0.939 | 0.754 | |
| V | 7.1 | 6.95 | 327.15 | 6608 | 0.0254 | 2.68 | 1.85 | 1.45 | 0.93 | 0.763 |
| Upstream Pressure P1 (MPa) | Downstream Pressure P2 (MPa) | ΔP (MPa) | Gas Temperature T1 (K) | Measured Gas Flow Q (m3/d) |
|---|---|---|---|---|
| 15 | 14.226 | 0.774 | 333.15 | 583,960 |
| 15 | 14.265 | 0.735 | 333.15 | 570,423 |
| 15 | 14.324 | 0.676 | 333.15 | 549,023 |
| 15 | 14.381 | 0.619 | 333.15 | 527,187 |
| 15 | 14.435 | 0.565 | 333.15 | 505,315 |
| 15 | 14.487 | 0.513 | 333.15 | 483,008 |
| 15 | 14.552 | 0.448 | 333.15 | 453,131 |
| 15 | 14.584 | 0.416 | 333.15 | 437,479 |
| 15 | 14.629 | 0.371 | 333.15 | 414,251 |
| 15 | 14.671 | 0.329 | 333.15 | 391,067 |
| 15 | 14.725 | 0.275 | 333.15 | 358,680 |
| 15 | 14.75 | 0.25 | 333.15 | 342,484 |
| 15 | 14.798 | 0.202 | 333.15 | 308,724 |
| 15 | 14.831 | 0.169 | 333.15 | 282,935 |
| 15 | 14.856 | 0.144 | 333.15 | 261,549 |
| Upstream Pressure P1 (MPa) | Downstream Pressure P2 (MPa) | ΔP (MPa) | Gas Temperature T1 (K) | Measured Gas Flow Q (m3/d) |
|---|---|---|---|---|
| 12 | 11.130 | 0.870 | 335.15 | 545,171 |
| 12 | 11.190 | 0.810 | 335.15 | 528,523 |
| 12 | 11.250 | 0.750 | 335.15 | 510,958 |
| 12 | 11.303 | 0.697 | 335.15 | 494,603 |
| 12 | 11.351 | 0.649 | 335.15 | 479,041 |
| 12 | 11.390 | 0.610 | 335.15 | 465,817 |
| 12 | 11.440 | 0.560 | 335.15 | 448,029 |
| 12 | 11.497 | 0.503 | 335.15 | 426,458 |
| 12 | 11.551 | 0.449 | 335.15 | 404,563 |
| 12 | 11.602 | 0.398 | 335.15 | 382,357 |
| 12 | 11.666 | 0.334 | 335.15 | 351,948 |
| 12 | 11.711 | 0.289 | 335.15 | 328,476 |
| 12 | 11.753 | 0.247 | 335.15 | 304,618 |
| 12 | 11.791 | 0.209 | 335.15 | 280,991 |
| 12 | 11.828 | 0.172 | 335.15 | 255,315 |
| Upstream Pressure P1 (MPa) | Downstream Pressure P2 (MPa) | ΔP (MPa) | Gas Temperature T1 (K) | Measured Gas Flow Q (m3/d) |
|---|---|---|---|---|
| 9 | 7.882 | 1.118 | 335.15 | 508,542 |
| 9 | 7.967 | 1.033 | 335.15 | 493,508 |
| 9 | 8.056 | 0.944 | 335.15 | 476,436 |
| 9 | 8.131 | 0.869 | 335.15 | 460,232 |
| 9 | 8.210 | 0.790 | 335.15 | 445,509 |
| 9 | 8.279 | 0.721 | 335.15 | 426,525 |
| 9 | 8.347 | 0.653 | 335.15 | 408,840 |
| 9 | 8.408 | 0.592 | 335.15 | 391,770 |
| 9 | 8.464 | 0.536 | 335.15 | 374,956 |
| 9 | 8.512 | 0.488 | 335.15 | 359,545 |
| 9 | 8.570 | 0.430 | 335.15 | 339,509 |
| 9 | 8.627 | 0.373 | 335.15 | 318,043 |
| 9 | 8.680 | 0.320 | 335.15 | 296,152 |
| 9 | 8.730 | 0.270 | 335.15 | 273,397 |
| 9 | 8.776 | 0.224 | 335.15 | 250,163 |
| Upstream Pressure P1 (MPa) | Downstream Pressure P2 (MPa) | ΔP (MPa) | Gas Temperature T1 (K) | Measured Gas Flow Q (m3/d) |
|---|---|---|---|---|
| 15 | 14.944 | 0.056 | 335.15 | 839,714 |
| 15 | 14.949 | 0.051 | 335.15 | 801,766 |
| 15 | 14.953 | 0.047 | 335.15 | 769,993 |
| 15 | 14.957 | 0.043 | 335.15 | 736,726 |
| 15 | 14.961 | 0.039 | 335.15 | 701,965 |
| 15 | 14.965 | 0.035 | 335.15 | 665,242 |
| 15 | 14.968 | 0.032 | 335.15 | 636,280 |
| 15 | 14.972 | 0.028 | 335.15 | 595,367 |
| 15 | 14.975 | 0.025 | 335.15 | 562,728 |
| 15 | 14.978 | 0.022 | 335.15 | 527,944 |
| 15 | 14.982 | 0.018 | 335.15 | 477,777 |
| 15 | 14.984 | 0.016 | 335.15 | 450,666 |
| 15 | 14.986 | 0.014 | 335.15 | 421,552 |
| 15 | 14.989 | 0.011 | 335.15 | 373,687 |
| 15 | 14.991 | 0.009 | 335.15 | 338,143 |
| Upstream Pressure P1 (MPa) | Downstream Pressure P2 (MPa) | ΔP (MPa) | Gas Temperature T1 (K) | Measured Gas Flow Q (m3/d) |
|---|---|---|---|---|
| 12 | 11.931 | 0.069 | 335.15 | 833,937 |
| 12 | 11.936 | 0.064 | 335.15 | 804,256 |
| 12 | 11.942 | 0.058 | 335.15 | 766,108 |
| 12 | 11.947 | 0.053 | 335.15 | 732,841 |
| 12 | 11.952 | 0.048 | 335.15 | 697,781 |
| 12 | 11.957 | 0.043 | 335.15 | 662,330 |
| 12 | 11.961 | 0.039 | 335.15 | 627,240 |
| 12 | 11.965 | 0.035 | 335.15 | 596,746 |
| 12 | 11.969 | 0.031 | 335.15 | 558,284 |
| 12 | 11.973 | 0.027 | 335.15 | 524,726 |
| 12 | 11.977 | 0.023 | 335.15 | 484,496 |
| 12 | 11.980 | 0.020 | 335.15 | 451,963 |
| 12 | 11.983 | 0.017 | 335.15 | 416,837 |
| 12 | 11.986 | 0.014 | 335.15 | 378,401 |
| 12 | 11.988 | 0.012 | 335.15 | 350,475 |
| Upstream Pressure P1 (MPa) | Downstream Pressure P2 (MPa) | ΔP (MPa) | Gas Temperature T1 (K) | Measured Gas Flow Q (m3/d) |
|---|---|---|---|---|
| 9 | 8.909 | 0.091 | 335.15 | 824,425 |
| 9 | 8.915 | 0.085 | 335.15 | 797,583 |
| 9 | 8.922 | 0.078 | 335.15 | 764,913 |
| 9 | 8.929 | 0.071 | 335.15 | 730,550 |
| 9 | 8.936 | 0.064 | 335.15 | 694,395 |
| 9 | 8.942 | 0.058 | 335.15 | 661,717 |
| 9 | 8.948 | 0.052 | 335.15 | 627,163 |
| 9 | 8.953 | 0.047 | 335.15 | 596,669 |
| 9 | 8.959 | 0.041 | 335.15 | 557,824 |
| 9 | 8.964 | 0.036 | 335.15 | 523,117 |
| 9 | 8.970 | 0.030 | 335.15 | 478,013 |
| 9 | 8.974 | 0.026 | 335.15 | 445,244 |
| 9 | 8.978 | 0.022 | 335.15 | 409,882 |
| 9 | 8.981 | 0.019 | 335.15 | 381,122 |
| 9 | 8.985 | 0.015 | 335.15 | 338,869 |
Publisher’s Note: MDPI stays neutral with regard to jurisdictional claims in published maps and institutional affiliations. |
© 2021 by the authors. Licensee MDPI, Basel, Switzerland. This article is an open access article distributed under the terms and conditions of the Creative Commons Attribution (CC BY) license (https://creativecommons.org/licenses/by/4.0/).
Share and Cite
Brkić, V.; Zelenika, I.; Mijić, P.; Medved, I. Underground Gas Storage Process Optimisation with Respect to Reservoir Parameters and Production Equipment. Energies 2021, 14, 4324. https://doi.org/10.3390/en14144324
Brkić V, Zelenika I, Mijić P, Medved I. Underground Gas Storage Process Optimisation with Respect to Reservoir Parameters and Production Equipment. Energies. 2021; 14(14):4324. https://doi.org/10.3390/en14144324
Chicago/Turabian StyleBrkić, Vladislav, Ivan Zelenika, Petar Mijić, and Igor Medved. 2021. "Underground Gas Storage Process Optimisation with Respect to Reservoir Parameters and Production Equipment" Energies 14, no. 14: 4324. https://doi.org/10.3390/en14144324
APA StyleBrkić, V., Zelenika, I., Mijić, P., & Medved, I. (2021). Underground Gas Storage Process Optimisation with Respect to Reservoir Parameters and Production Equipment. Energies, 14(14), 4324. https://doi.org/10.3390/en14144324


