1. Introduction
The global COVID-19 pandemic has had a huge impact on the world economy in terms of its development. Significant restrictions on all economic activities significantly reduced the mobility of the population and consequently reduced traffic intensity. Today, it is difficult to predict the economic losses of individual regions due to the pandemic, but it is possible to assess the impact of changes in urban mobility caused by quarantines.
Urban transport is essential for the proper functioning and development of cities. Economic development and an increase in the number of inhabitants generate increased traffic intensity and use of public and private transport. All of this leads to unfavorable phenomena such as congestion, air pollution, noise, and road accidents [
1,
2]. There are many forms of urban transport. The most preferred form of mass transport is public transport. From the point of view of environmental protection and human health, forms such as bicycle and pedestrian transport are also important [
3]. In some Western European cities, cycling has a significant share of urban transport [
4].
The pandemic, which spread to all countries, has caused many changes in passenger transport. These changes apply to both urban and intercity transport. The most important of these changes is the decline in passenger transport. This decrease is due to the lockdown, limited economic activity, sanitary recommendations, and people’s fear of infection. One study [
5] describes how the criteria for selecting means of transport changed in particular phases of the pandemic. In the first phase, covering March 2020, the most important aspect was personal and road safety. In the second phase, June 2020, travel time and flexible departure time were the most important criteria. Another study [
6] reviewed the literature on the role of transport in the spread of disease, including COVID-19, and described the impact of the pandemic on traveler behavior and mobility. Fear of COVID-19 and government-imposed mobility restrictions were shown to be among the major factors limiting mobility.
Various methods have been used to analyze the condition of transport. Examples of modern solutions using mobile phones and Google Maps, Apple, or Baidu Maps platforms are presented in [
7,
8,
9,
10,
11,
12]. These studies analyze cases of different countries and continents. A method for determining the number, type, and length of journeys based on the registered logins of mobile phones to base transmitters is described in [
7]. Two data recording systems were used in [
8]. In the first part of that article, mobility in the workplace in six selected countries was defined using data from Google Maps. In the second part of the article, traffic detectors at 24 intersections were used to analyze traffic in the city of Doha. Between February and April 2020, traffic volume fell by up to 50%. In April and May 2020, the number of fatal accidents also decreased by approximately 50% compared with 2019. Data from the Apple platform and traffic detectors were used in [
9]. In two locations under consideration, Los Angeles and Virginia, the maximum decrease in mobility compared with February occurred in April. In the category of walking and driving mobility, the decline was 70% in Los Angeles and 55% in Virginia. In May in Virginia and June in Los Angeles, mobility in both categories returned to pre-pandemic conditions.
Changes in travel time between selected points in the analyzed area based on data from Google Maps are presented in [
10]. There are also data on the decline in various categories of mobility in individual voivodeships of Poland in February and March 2020. The impact of the pandemic on congestion in Shanghai is analyzed in [
11]. Based on data from Baidu Maps, changes in average traffic speed in the first three months of 2020 were determined depending on the time of day and the route. Using data on mobility from Google and Apple Maps, changes in individual mobility categories in New Zealand during COVID-19 from February to July were examined in [
12]. The largest drops in mobility were recorded in the category of public transport. Since June, mobility in the workplace has reached pre-pandemic levels. Public transport was characterized by a further 40% decrease.
To analyze the intensity of vehicle traffic, a system recording Wi-Fi signals from passing cars was used in [
13]. The paper presents changes in traffic intensity in March and June 2020 in a city in India, and includes graphs illustrating vehicle traffic flow rates on selected days during the pandemic period. During the curfew, the drop in traffic reached more than 85%. The data on traffic volume show only the number of passing cars with a Wi-Fi transmitter turned on. The share of cars in traffic with Wi-Fi enabled has a different value and is closely related to the specific city. In many countries, traffic restrictions have varied. Passenger car traffic in England, after a sudden steep decline at the end of March 2020 of about 70%, was partially restored within a few months [
14]. In September, the decline was only around 20%. In the following months, during the next wave of the epidemic, traffic was limited, and in November the drop reached about 35%. More detailed data on the functioning of many forms of transport in the UK from 1 March 2020 to May 2021 can be found in [
15]. At the end of the period considered, only motor vehicles and bicycles had reached their pre-pandemic state.
Even greater declines were seen in public transport. Here, additional factors influencing the decline included sanitary restrictions regarding the maximum number of passengers allowed on a given means of transport and passengers’ fear of infection.
In public transport, the changes are more permanent. In most cities, there was an 80% decrease in public transport [
16,
17,
18,
19] and its restoration was much slower than that of passenger cars. Selected US cities were examined in [
16] through a series of statistical analyses aimed at assessing the phenomena occurring in public transport. Data on reduced travel in selected US and Canadian cities and selected countries up to June 2020 can be found in [
17].
Data on decreased travel in eight selected cities and in Israel from 11 March to 30 August 2020 are presented in [
18]. The pace of restoration of transport was different in individual cities. At the end of August, the decline compared with the pre-pandemic period in many cities was still from 25% to 68%. For example, in April, Israel saw an almost 86% drop in transport, and in Madrid, the decline was 88%; after 5 months, the decline was 24% and 44%, respectively. In general, there has been a significant decrease in mobility everywhere considering all forms of transport, including pedestrian transport. According to data in [
10], shortly after the introduction of lockdown in Poland, the decline in mobility in terms of work, shopping, and travel reached 40% to 80%. In the cities examined in [
8,
16,
17,
18,
19], the limitations on the mobility of inhabitants resulted in different values. The mobility of residents in New York City at the end of January 2021 was 23% of the level at the end of January 2020. In Stockholm and Moscow [
19], the mobility of residents after the sudden collapse in April 2020 increased in August to 70–80% of the previous year’s value. The second wave of the pandemic reduced that value at the end of January 2021 to around 50%. The problem of the decline in mobility in 10 selected countries was studied in [
20]. Current data on the status of selected mobility categories in relation to the baseline are available in [
21]. The baseline is the median value for the corresponding day of the week during the 5-week period from 3 January to 6 February 2020.
One of the few forms of urban transport that in many cases did not experience a significant decrease after the period of sudden decline in the mobility of inhabitants is bicycle transport. Due to their zero emissivity, bicycles are a preferred form of transport. However, during the pandemic, fear of infection was the main factor behind the choice to use bicycles [
22]. In London, after all transport collapsed in April, cycling quickly recovered; by May 2020, it was at least 200% [
14] of the pre-pandemic level. A similar situation took place in China [
23]. After a sudden traffic slump at the end of January, in early March the city’s bike rental system saw a significant increase in travel, reaching at least 50% of the pre-pandemic level. Information on the growing importance of bicycle transport can also be found in [
24,
25]. Their research results clearly show increases in the shares of motor vehicle, bicycle, and pedestrian traffic.
Many studies dealing with the impact of the pandemic on vehicle traffic also considered the impact on road safety and environmental pollution. Road safety issues were analyzed in [
26] concerning a city in Spain, as well as in a previously cited work [
8].
The issue of the emission of environmental pollutants by vehicle traffic was considered in many studies from different countries. One study examined this issue in Croatia [
27]. Other studies examined the impact of the pandemic on air pollution in Portugal [
28] and China [
29]. The problems of road traffic and its impact on air pollution in India were studied in [
30,
31]. Another study from Asia [
32] shows the state of air pollution in selected Malaysian cities in January 2020. A global analysis of the impact of the pandemic on air quality in many regions was presented in [
33].
All of the previously discussed factors, in particular sanitary restrictions, made necessary an analysis of the functioning of existing transport systems and the development of post-pandemic guidelines [
34].
The decrease in traffic in city areas undoubtedly contributes to a reduction in the emission of harmful substances into the atmosphere.
However, the total level of air pollution measured above the earth’s surface depends on many sources and the external weather conditions. The influence of such external meteorological conditions on air pollution was considered in [
29]. The structure, type, and share of these sources in total pollution can vary in different cities.
Therefore, in the measurement data recorded during the spring, for example in Poland, Portugal, and India [
28,
30,
31,
32], the shares of means of transport in total air pollution were not the same. In April and early May, temperatures in Poland often remained below freezing at night. For space heating, coal heating appliances are often used, representing a significant source of emissions. Such a situation certainly does not exist in Portugal, India, or the Mediterranean countries. To estimate the impact of road vehicles on air pollution and environmental safety, it was decided to use simulation studies based on a developed mathematical model. This model uses data on traffic volume, vehicle structure, and external environmental conditions.
Research on methods for assessing and improving the environmental safety of road vehicles has been carried out by many authors [
35,
36,
37,
38]. The application of systemic methods to determine the level of environmental pollution from exhaust gases and to assess fuel efficiency under operating conditions is described in [
39]. This work also indicates ways to improve the environmental safety of vehicles and determine their effectiveness. The development of such research is closely related to the integration of innovative information and communication technologies. These technologies enable us to receive, process, and analyze large amounts of structured and unstructured information.
Big data, Internet of things (IoT), sensors, a variety of small devices, and video that transmits data in real time (data in motion) expand the functionality of intelligent transport systems and smart cities to optimize and improve transport infrastructure and traffic. The features of the vehicle-to-infrastructure (V2I) information system and the process of monitoring and evaluating vehicle technical conditions while under operation, with the possibility of forecasting, are described in [
40]. The peculiarities of developing a mathematical model of the traffic flow–road system and the creation of specific elements for an intelligent system to monitor vehicle environmental safety in operational conditions are described in [
41,
42]. Individual vehicles, their propulsion systems, and urban traffic flows are considered as objects for monitoring in [
43]. The features of information and analytical systems for the monitoring of road vehicle performance and environmental impact under different conditions are presented. Similarly, the features of information and analytical systems for the monitoring of the operating processes and environmental performance of vehicle propulsion systems are described in [
44]. A simulation of vehicle environmental indicators in traffic flow and an evaluation of roadside pollution by traffic flow are presented in [
45].
The aim of this paper was to investigate the impact of the COVID-19 pandemic and related restrictions on city traffic and to determine the impact of changes in urban traffic on the level of environmental pollution due to harmful gases from vehicles, based on the example city of Rzeszow, Poland.
The paper is organized as follows:
Section 2 presents the characteristics of the studied city, including data on the number of registered vehicles and the number of vehicles entering the city.
Section 3 analyzes the data obtained from traffic and air pollution measuring devices. The first part presents vehicle traffic data and analyses, and the second part focuses on the analysis of direct roadside pollution data and external conditions.
Section 4 presents the selected method used to determine air pollution from means of transport, and describes and verifies the adaptation of the mathematical model of the transport flow–roadside environment system to the studied conditions.
Section 5 presents the results of the air pollution simulation on a selected road section under normal traffic conditions and in the quarantine period.
Section 6 summarizes the obtained results and presents conclusions.
2. Characteristics of the Object of Study
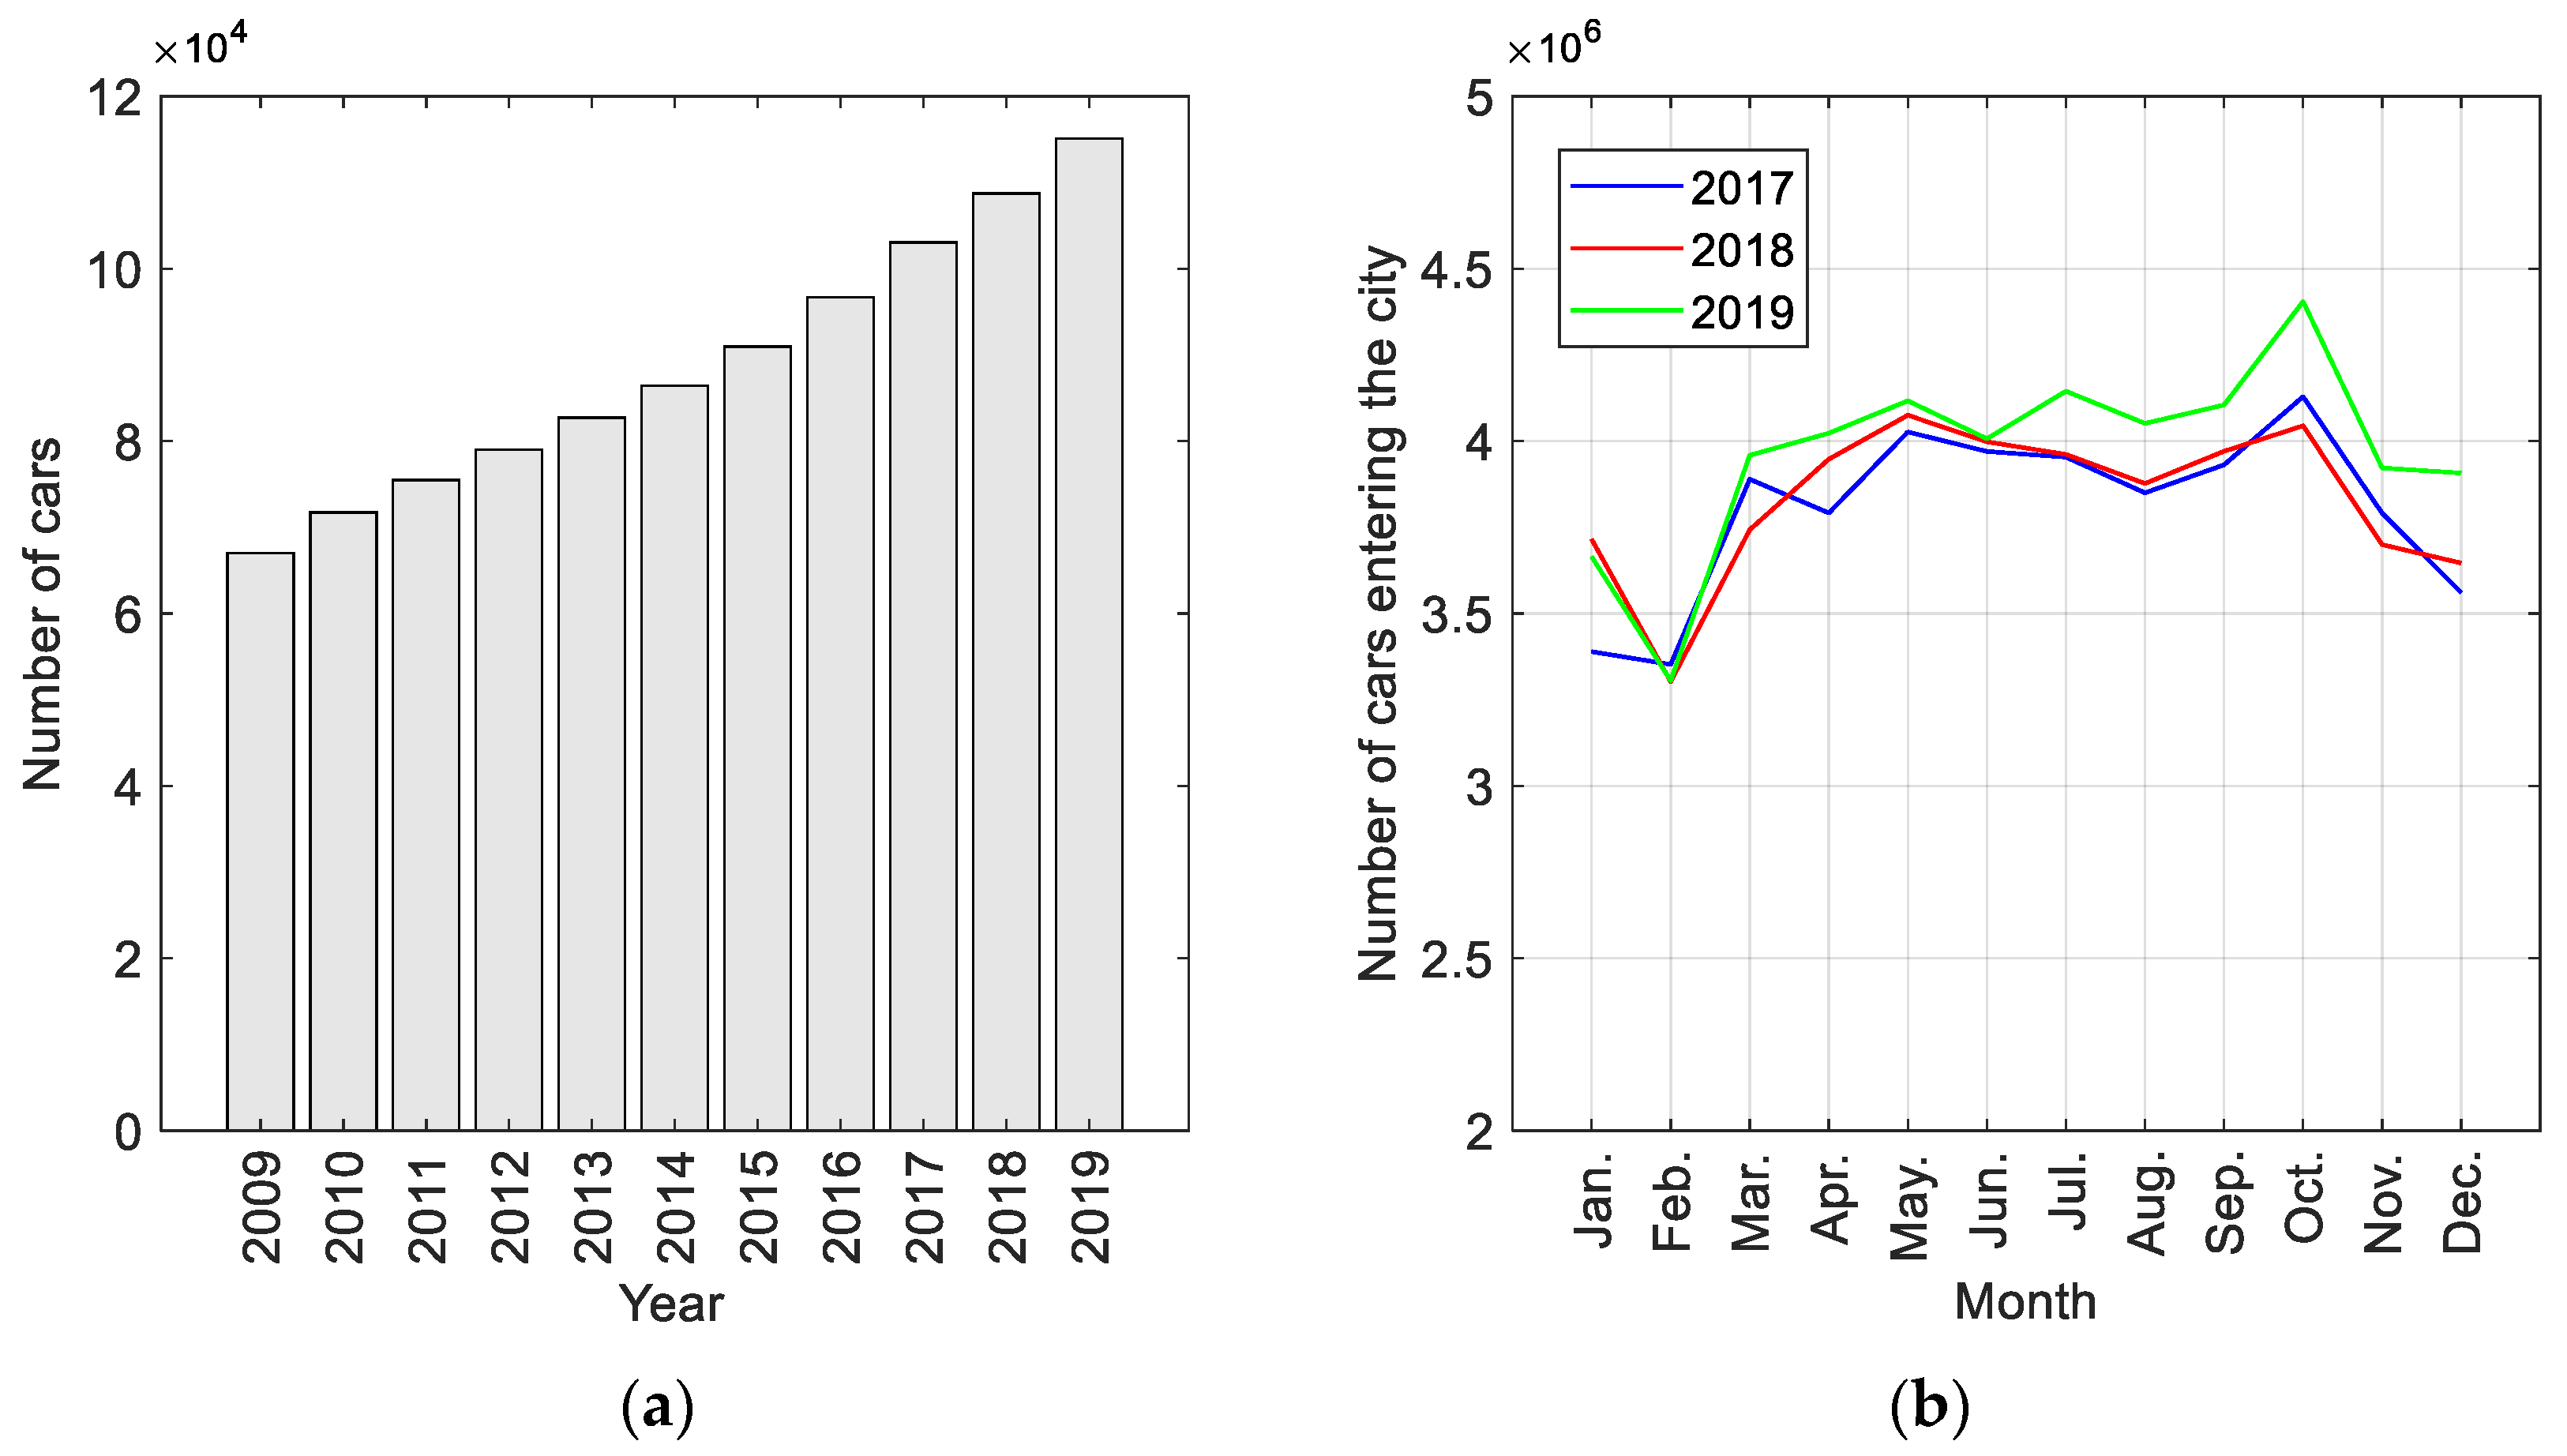
The city of Rzeszow is the center of Podkarpackie Voivodeship, located in southeastern Poland, and has about 200,000 inhabitants. Over the past 10 years, the level of motorization of the city has increased more than 1.5 times and, since 2017, has exceeded 500 cars per 1000 inhabitants. The increase in the number of passenger cars registered in the city in recent years is shown in
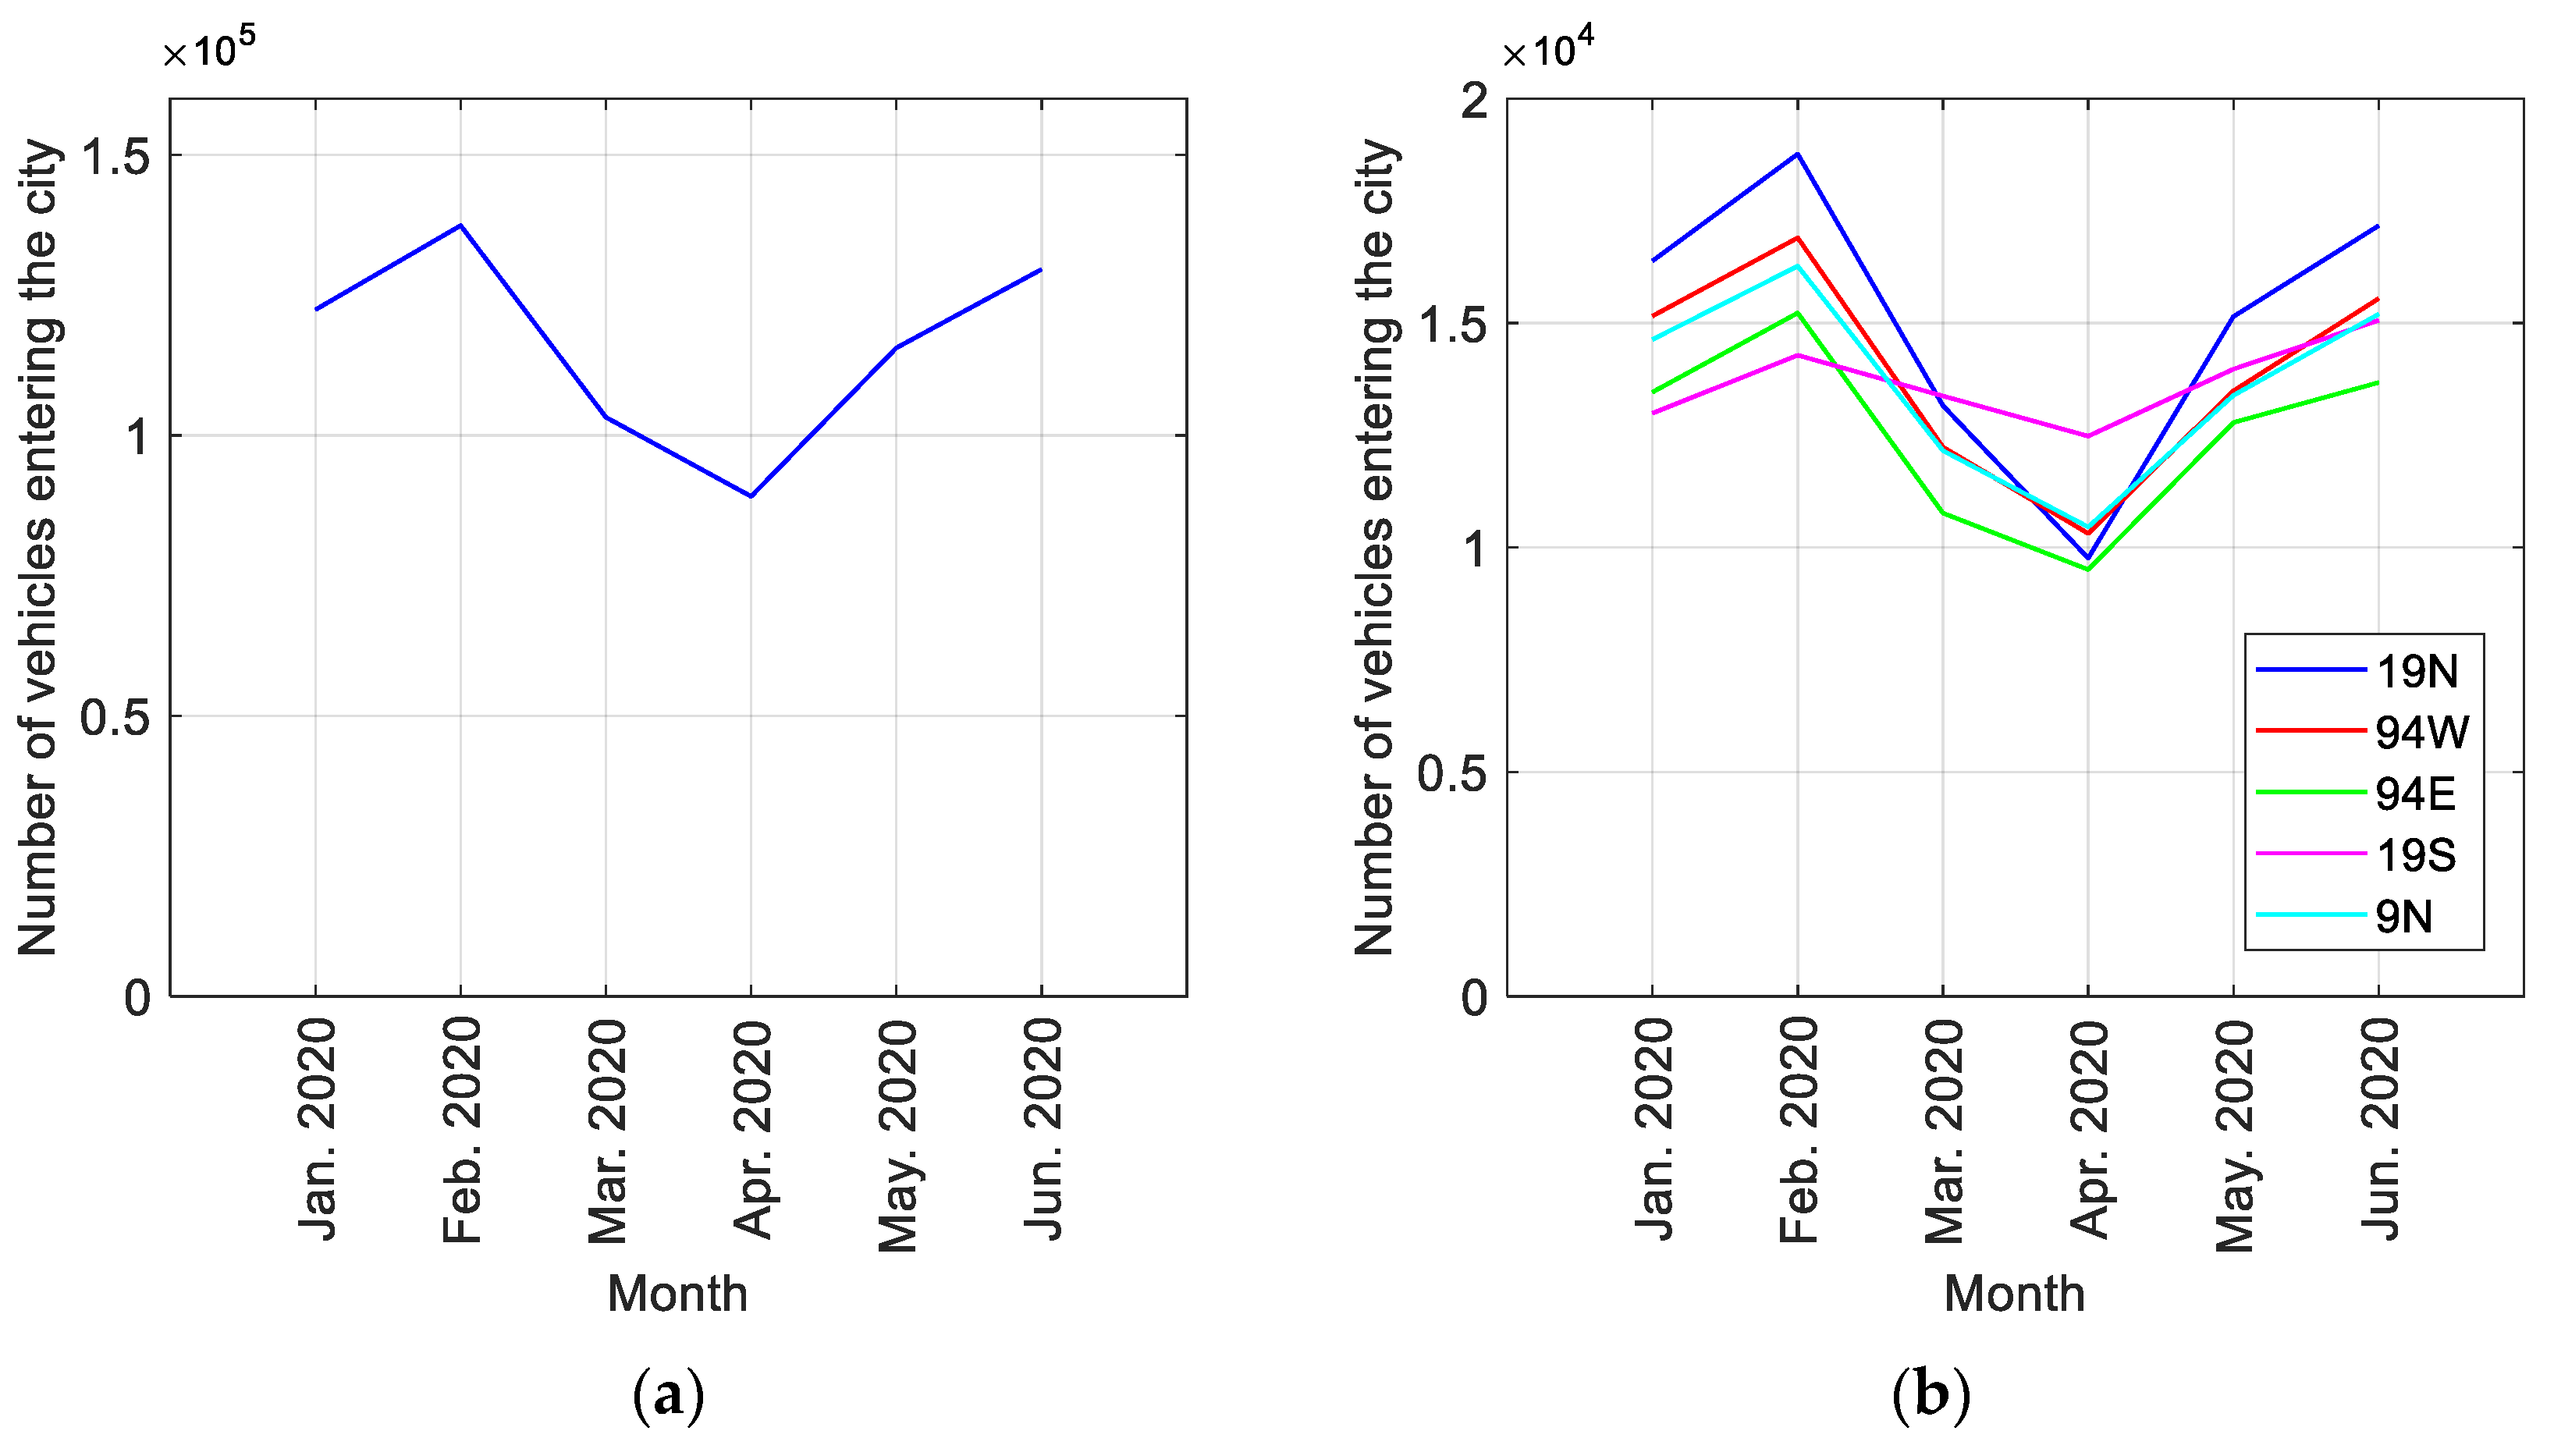
Figure 1a. Not only vehicles registered in Rzeszow participate in city traffic; every working day, more than 100,000 cars enter the city. The graph in
Figure 1b presents data illustrating the number of vehicles entering the city in individual months.
There is a visibly clear decrease in February in all analyzed years as there are fewer days in that month.
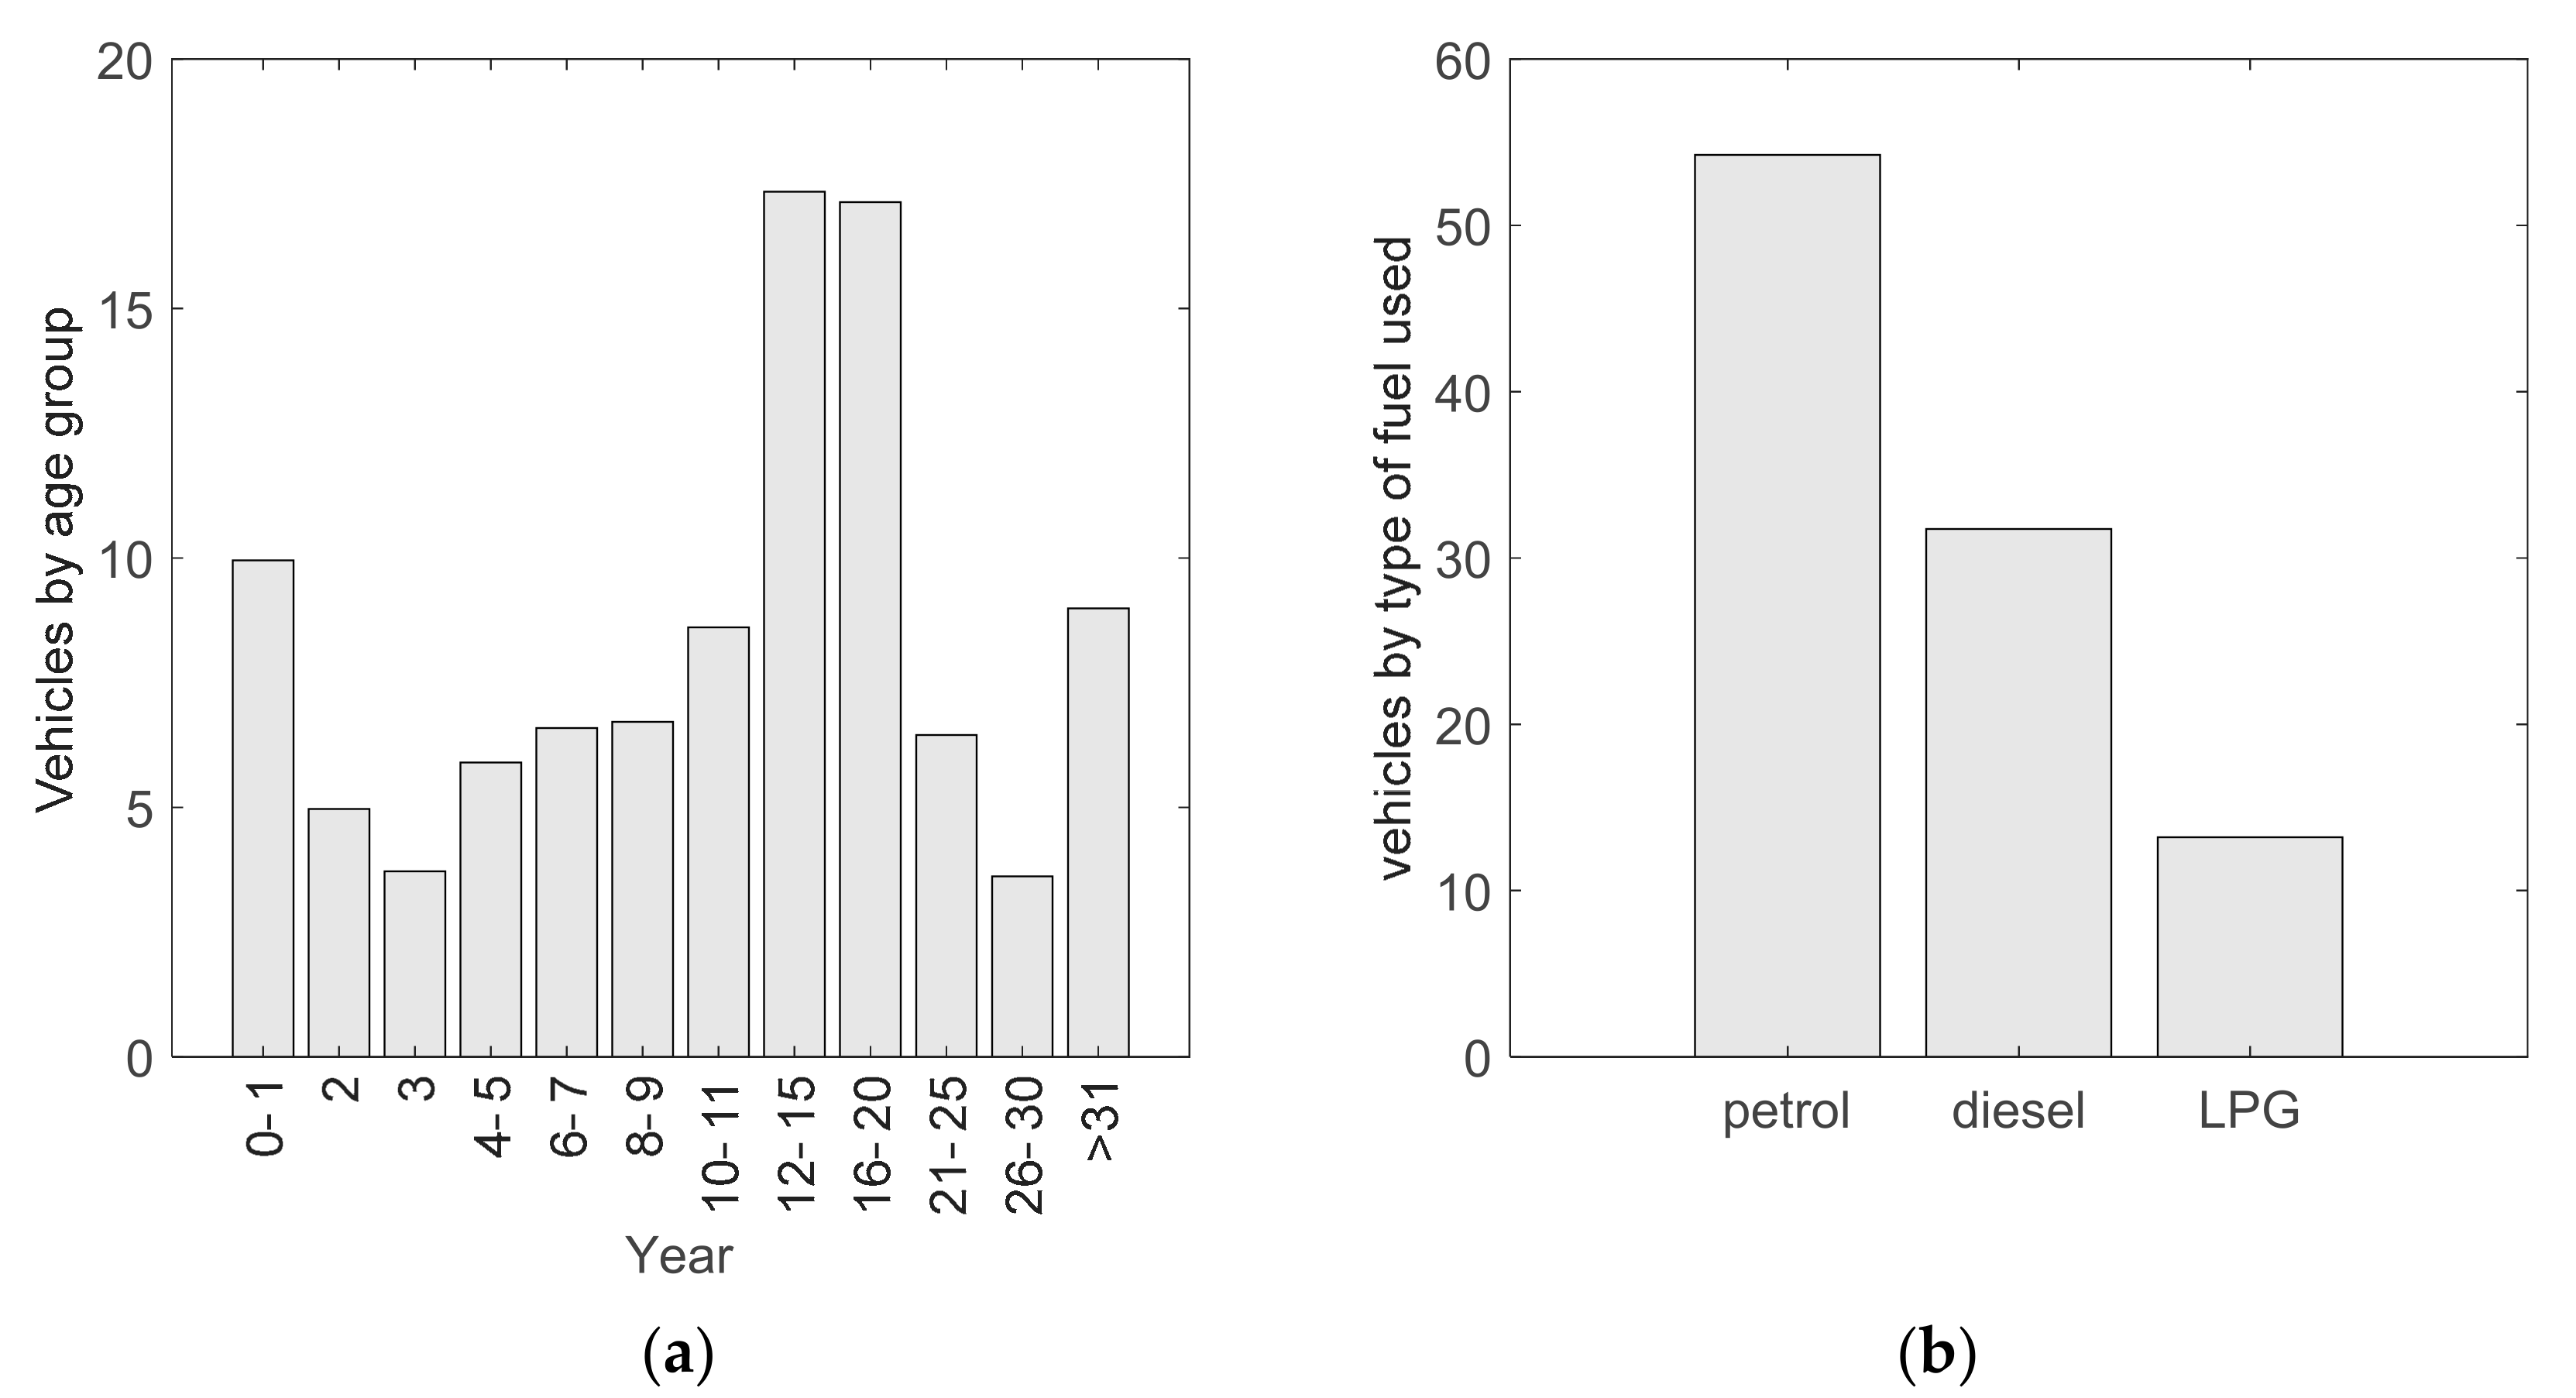
The analysis of statistical information on the composition of the vehicle fleet of Rzeszow shows that 78% are cars of category M1, and about 16% are trucks of categories N1, N2, and N3. Vehicle category designations M and N follow the classification of the United Nations Economic Commission for Europe. This is also a group of registered buses, constituting 0.5% of the total vehicles. The average age of category M1 vehicles is approximately 13.5 years. The share of individual age groups is shown in
Figure 2a. These cars use petroleum fuel, and the percentage share of individual types of fuel is shown in
Figure 2b.
Fuels of petroleum origin remain the main source of energy for road vehicles; more than half of vehicles use gasoline, about 30% use diesel fuel, and the share of alternative fuels, including LPG and CNG, does not exceed 15%.
Transit traffic of N3 vehicles was eliminated from the city area and traffic of N2 vehicles has been significantly reduced. The traffic of transit vehicles is transferred to the ring road or bypasses Rzeszow via the motorway.
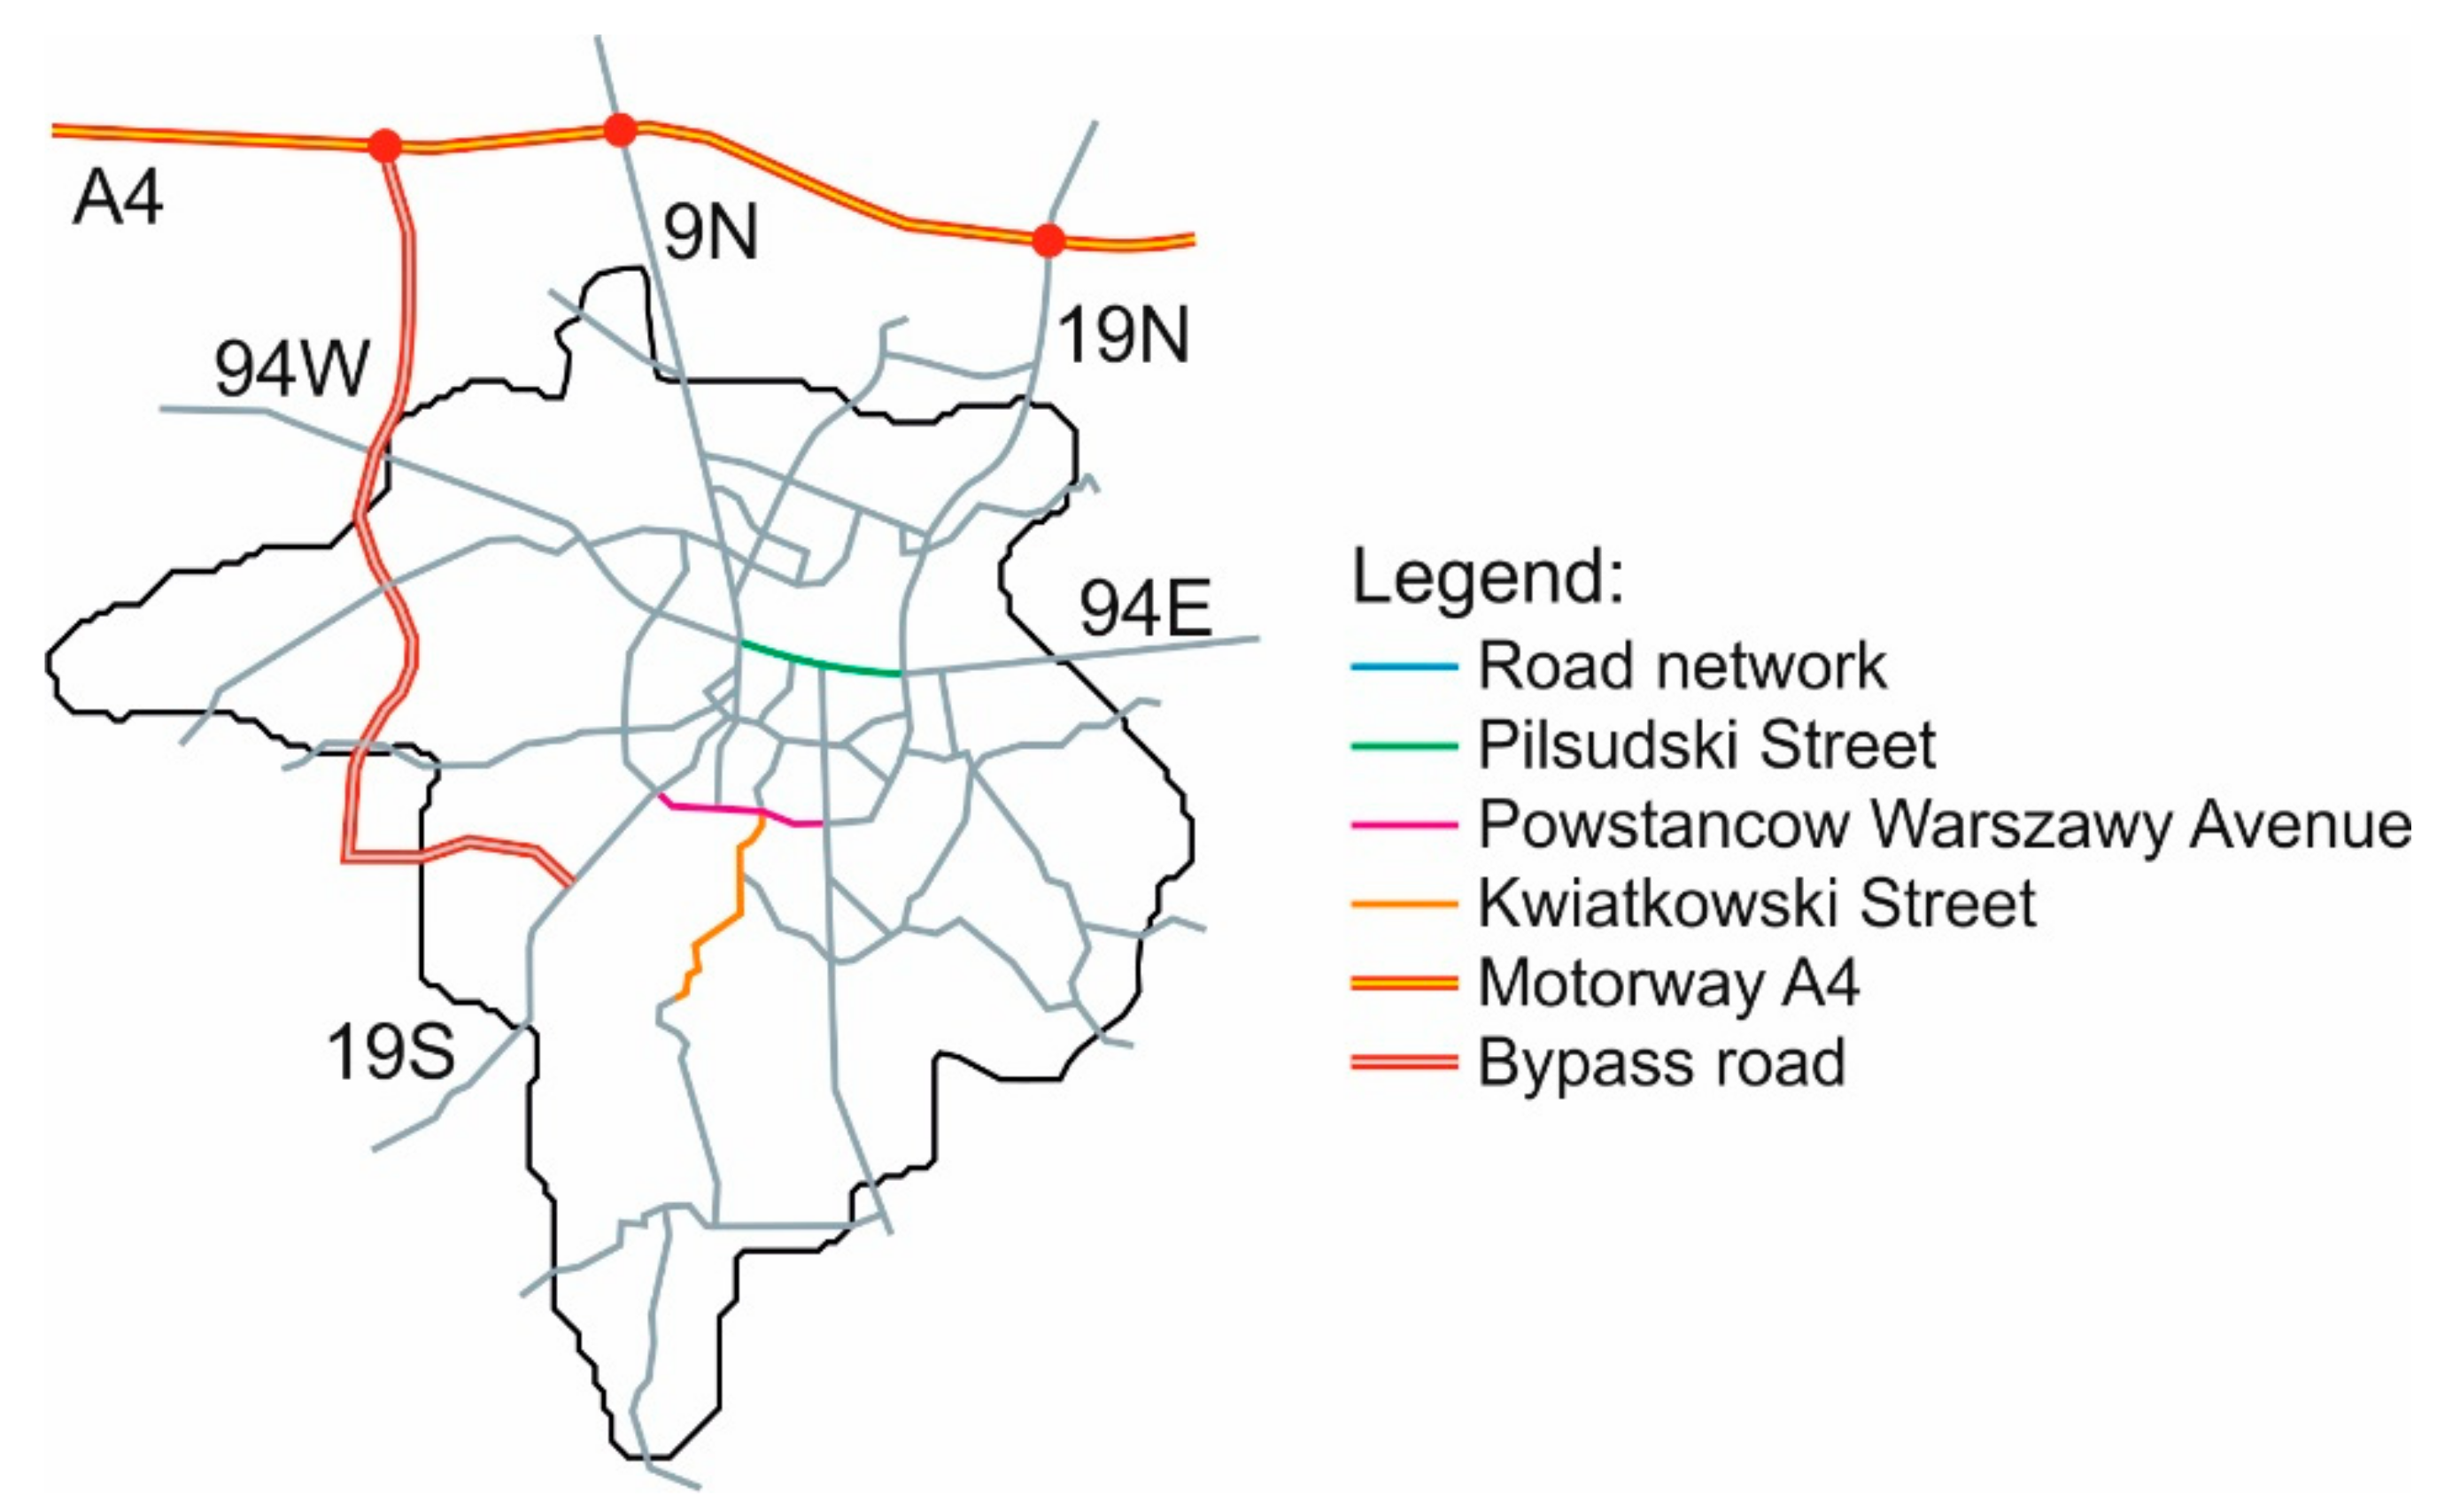
Figure 3 shows the scheme of the road system in the city. Three national roads, 9, 19, and 94, pass through the city. Depending on the location in the diagram in relation to the city, the inlets of individual roads are marked as follows: road 94 has an east inlet, 94 E, and a west inlet, 94 W; road 19 has a north inlet, 19 N, and a south inlet, 19 S; and road 9 has a north inlet, 9 N, and joins road 19 S in the south of the city. About 70% of vehicles enter Rzeszow using these inlets, shown in
Figure 3. In addition to the main entry routes, the figure also shows the bypass road and three selected sections of city streets, which are the subject of further analysis in
Section 3.
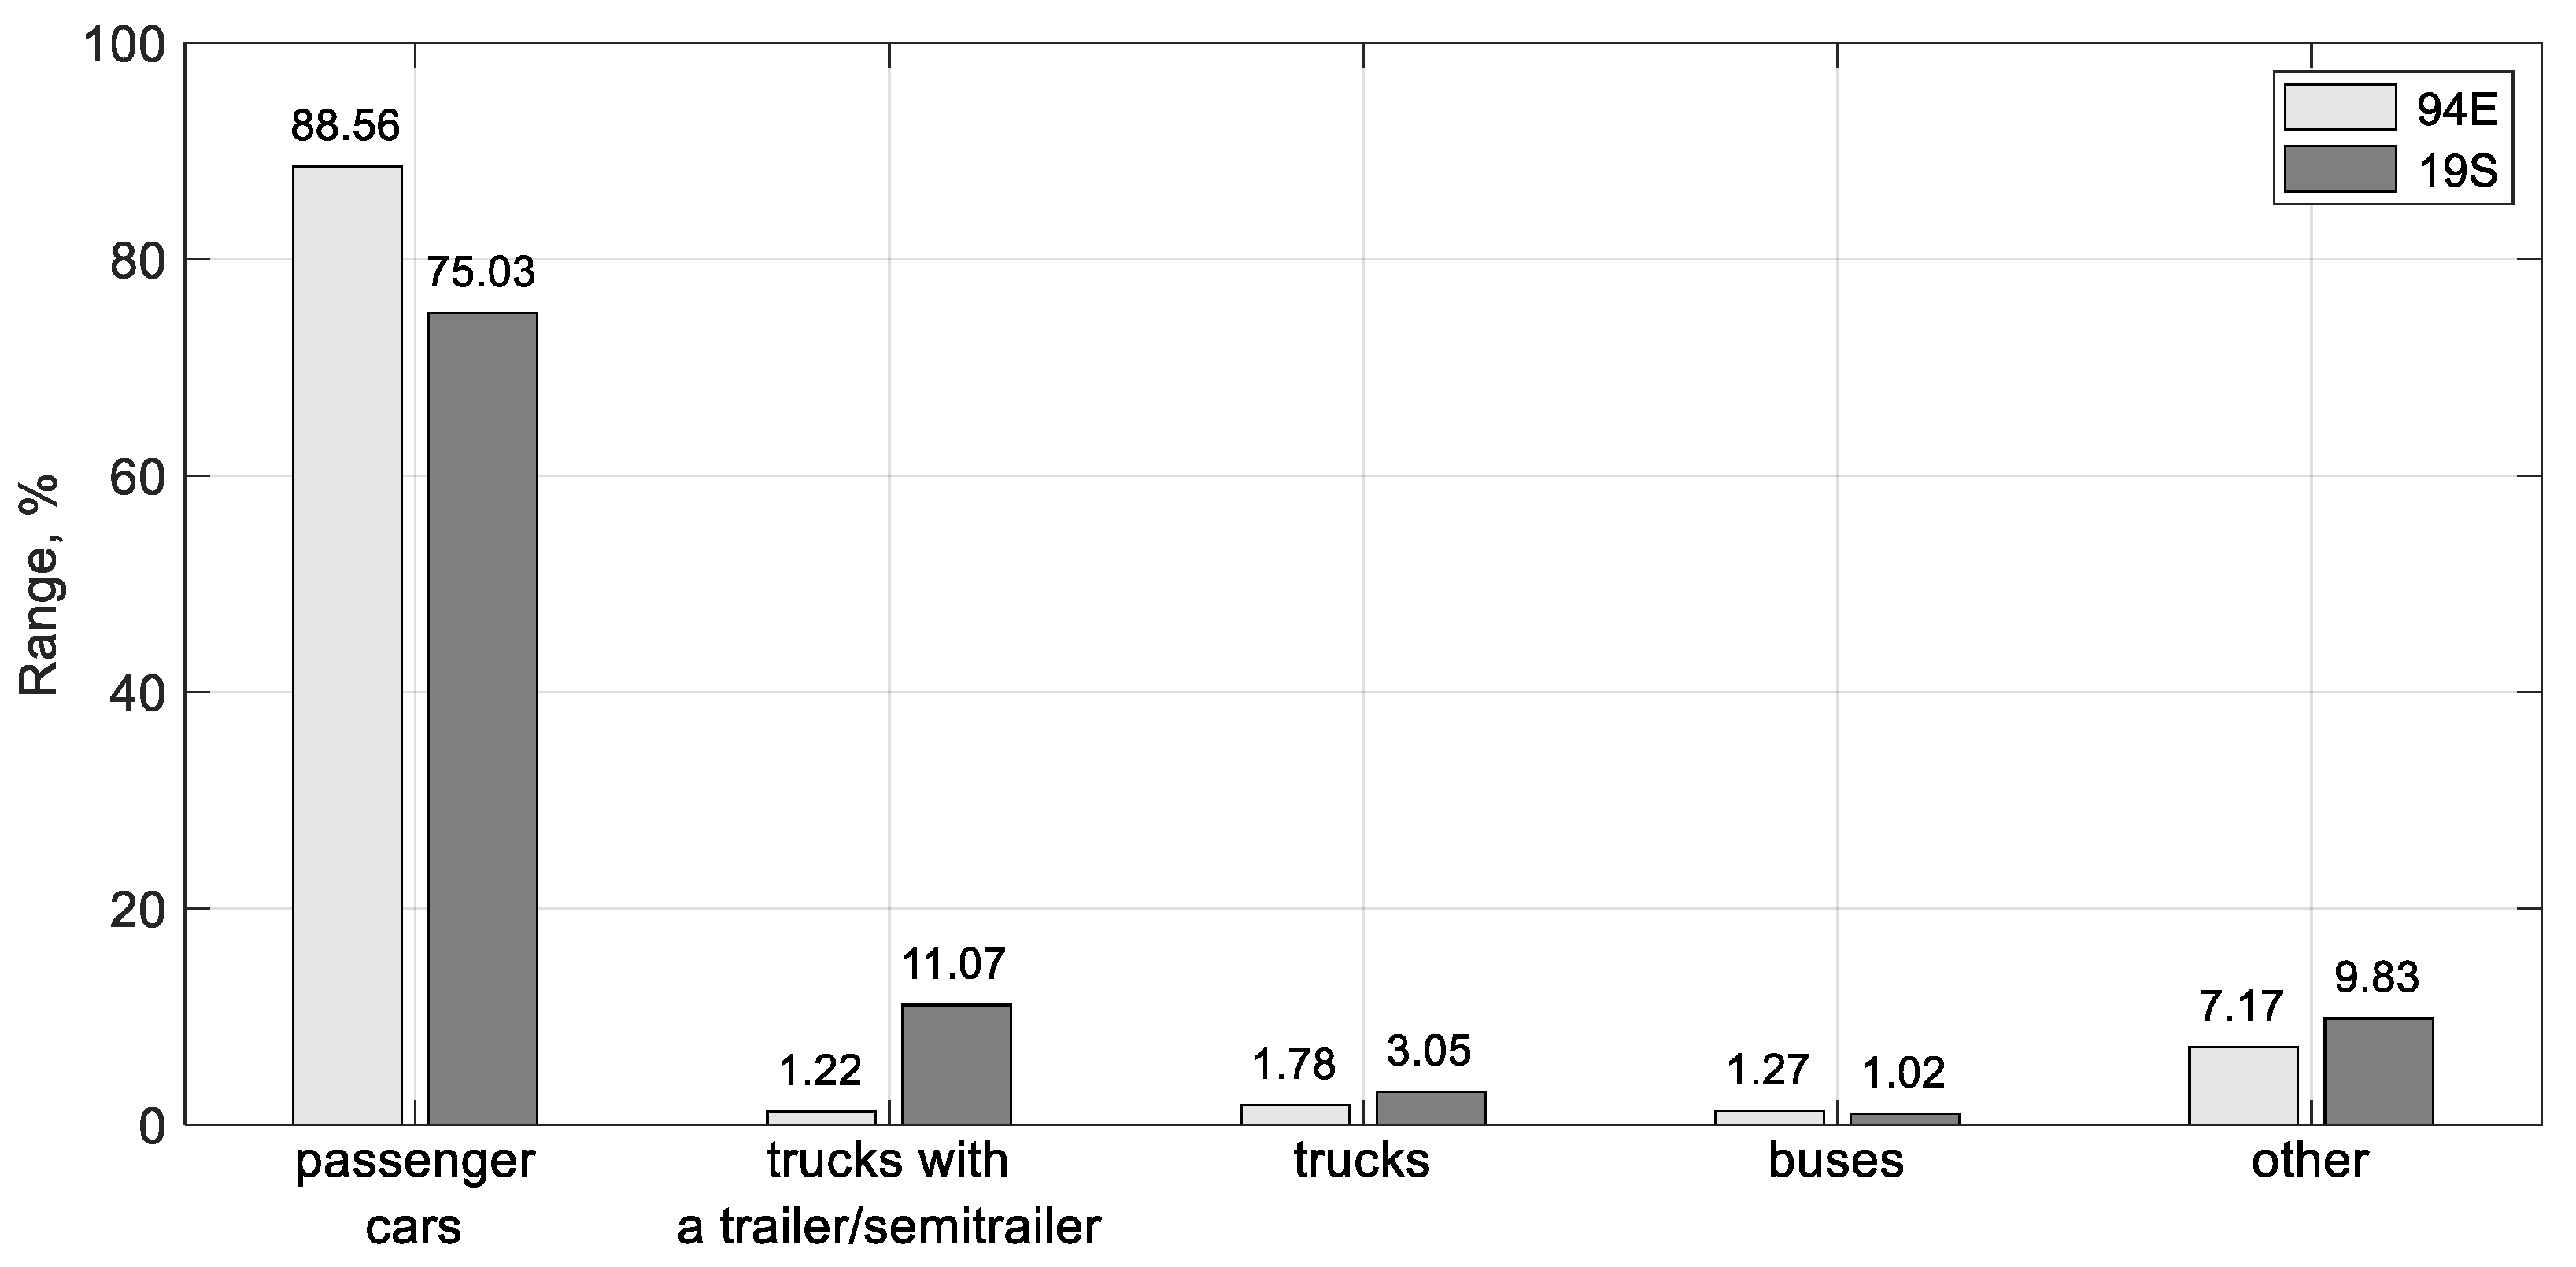
Figure 4 [
46] shows the types of vehicle traffic on the entry roads from the east to the city, marked as 94 E, and from the south, marked as 19 S. The share of N3 heavy vehicles in the traffic on road 94 is negligible. Road 94 is parallel to the A4 motorway, which connects the east and west of Poland and is a transit route from Germany to Ukraine.
Data on the traffic composition on entry road 19 S to Rzeszow came from a measuring station located a few kilometers outside the city limits. The share of trucks is much greater here. Cars from southern Europe (Slovakia, Hungary) travel along this road. However, these vehicles do not participate in city traffic. They use the bypass road around the city to continue their way north or west.
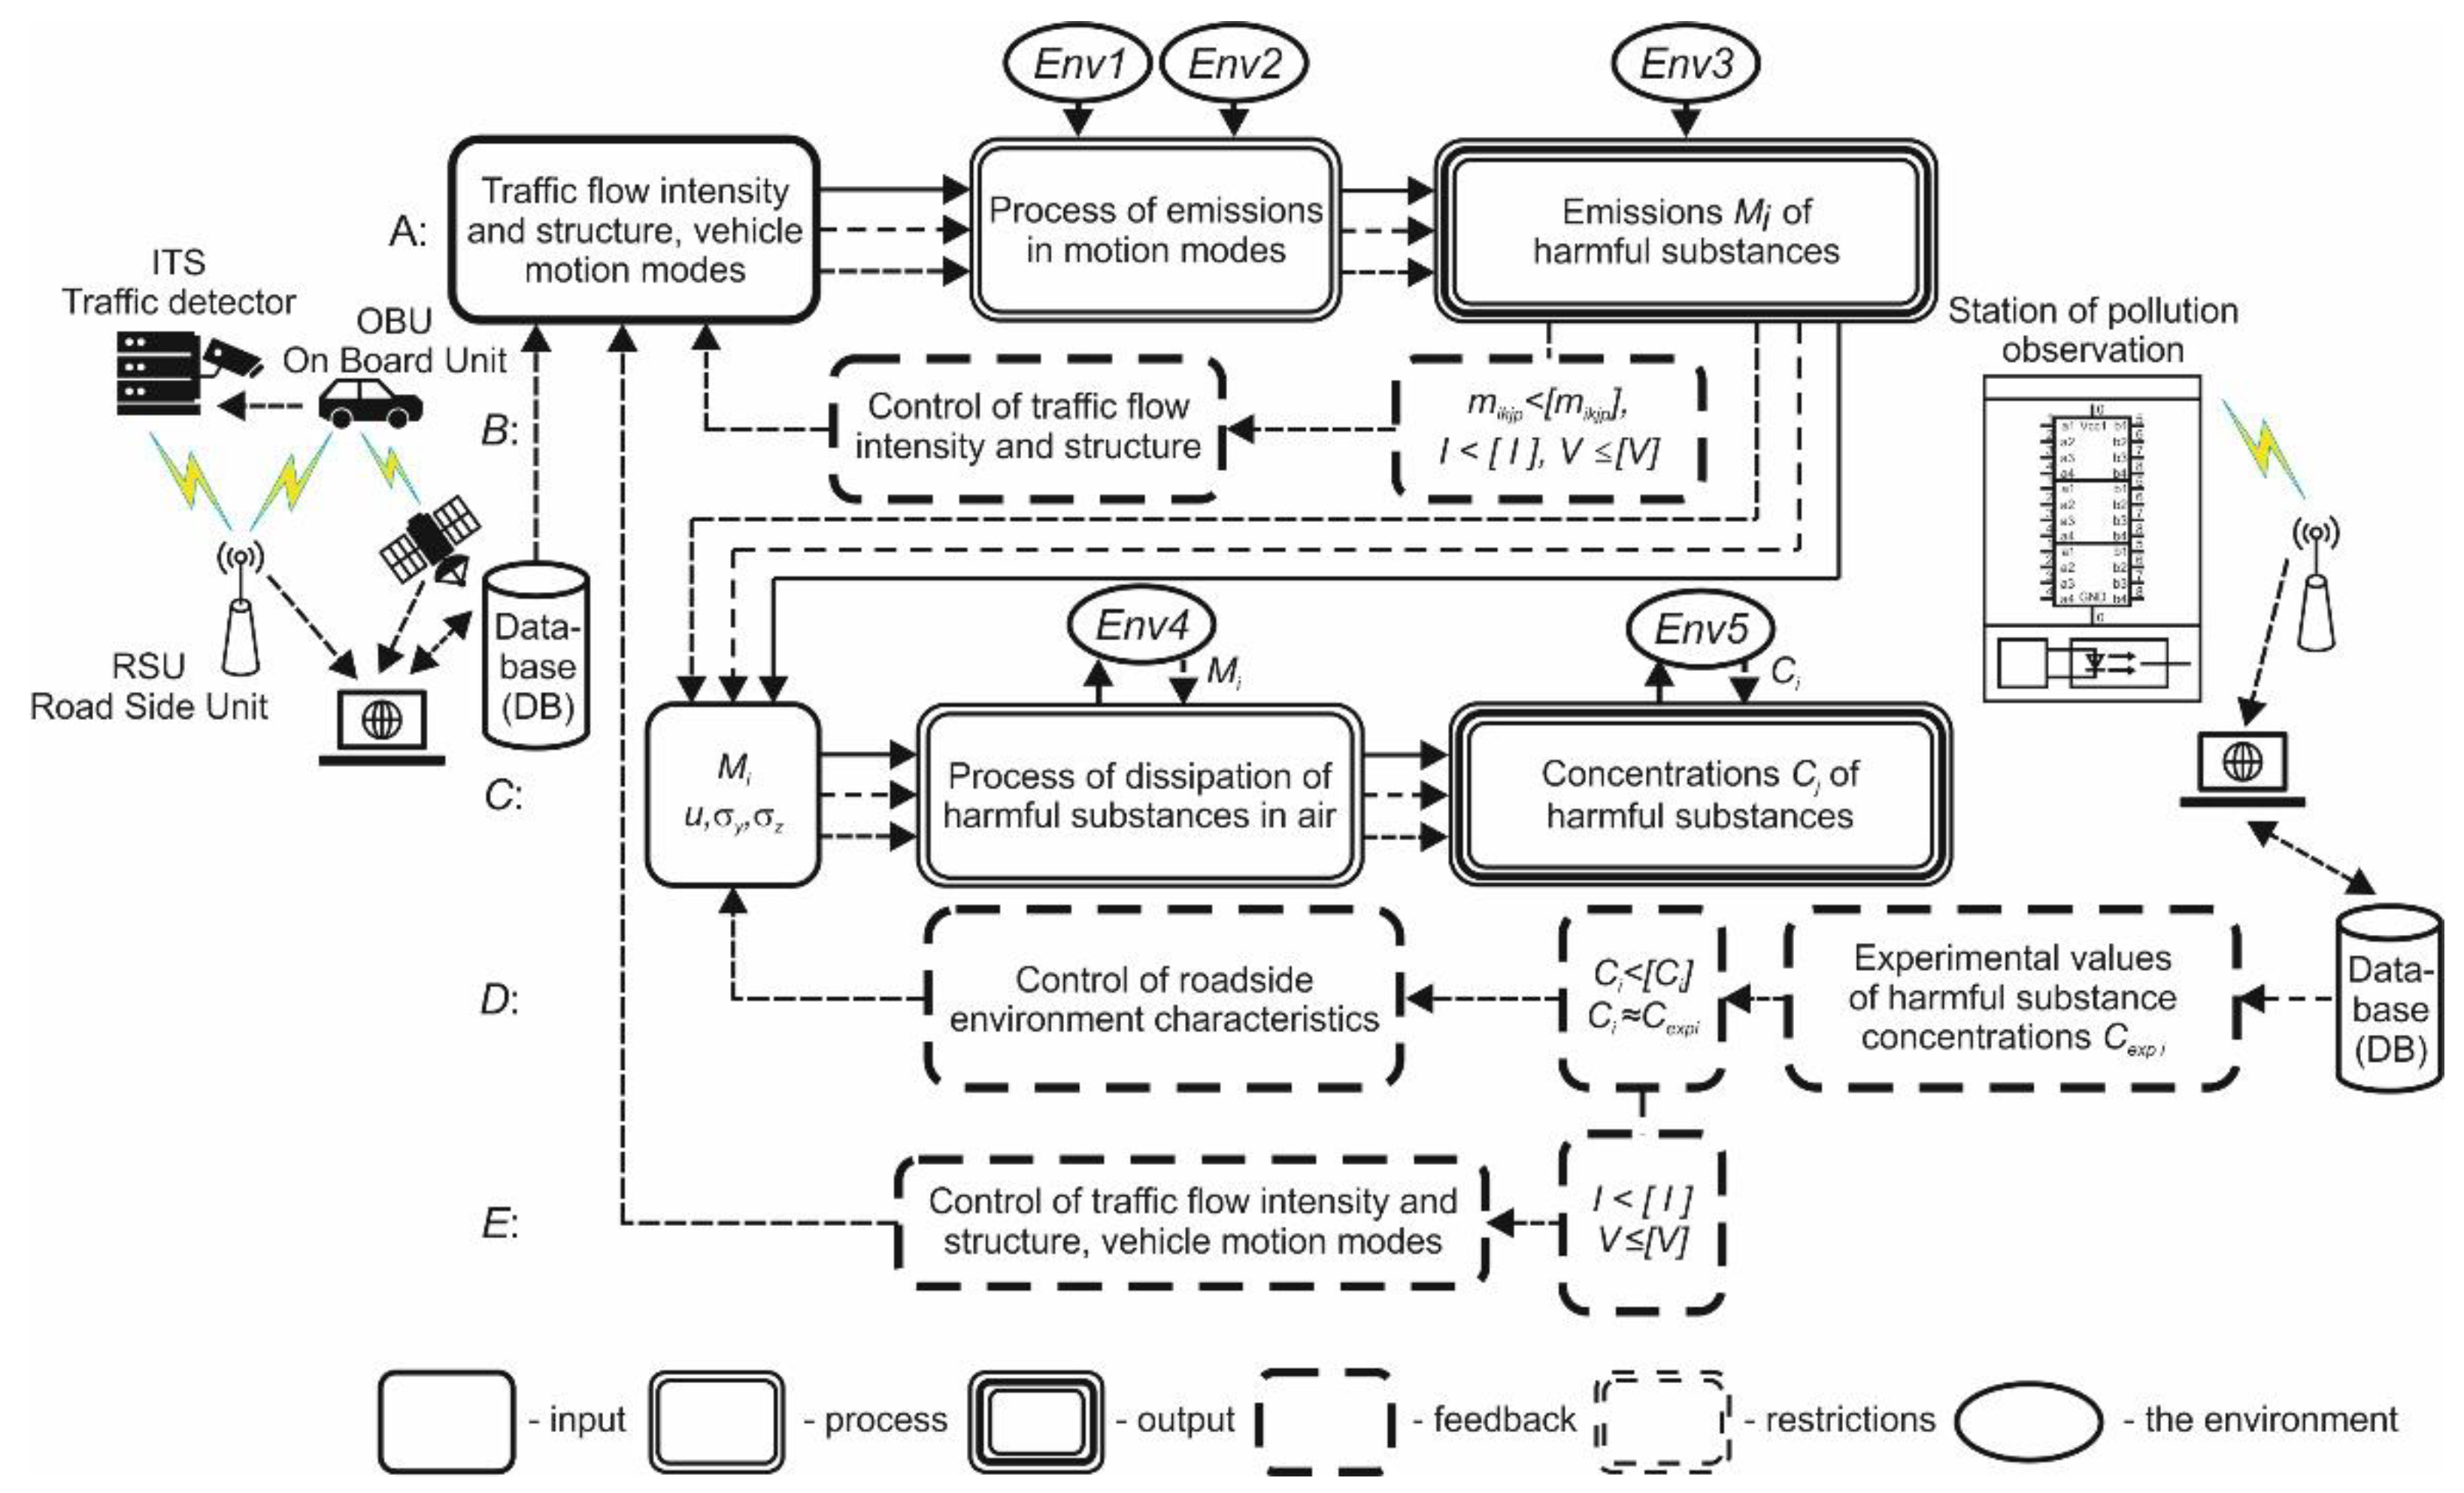
4. Method of Air Pollution Simulation
The simulation of air pollution in the observation zones was carried out with the help of an information analytical system based on the model of the traffic flow–roadside environment system [
41,
42,
43,
45]. Considering the information from external stationary observations of the movement of vehicles and atmospheric conditions and on-board measuring systems, the basic model was adapted to the study conditions. The modified structure of the model is presented in
Figure 13.
During traffic flow on the road section, the main process (level A) determines the level of roadside pollution in terms of the emissions Mi of pollutants as the sum of the specific emissions mikjp of individual vehicles. The intensity and parameters of vehicle traffic modes are fixed by the external surveillance system measurements, as well as on-board telematics units.
Simulation of vehicle motion in the traffic flow was carried out on the 1 km experimental section of the road during the driving cycle, which includes the following traffic modes: active idling mode, to simulate the expectation of a green light at the intersection; acceleration to 50 km/h; motion with constant speed on a certain section; and braking to a complete stop.
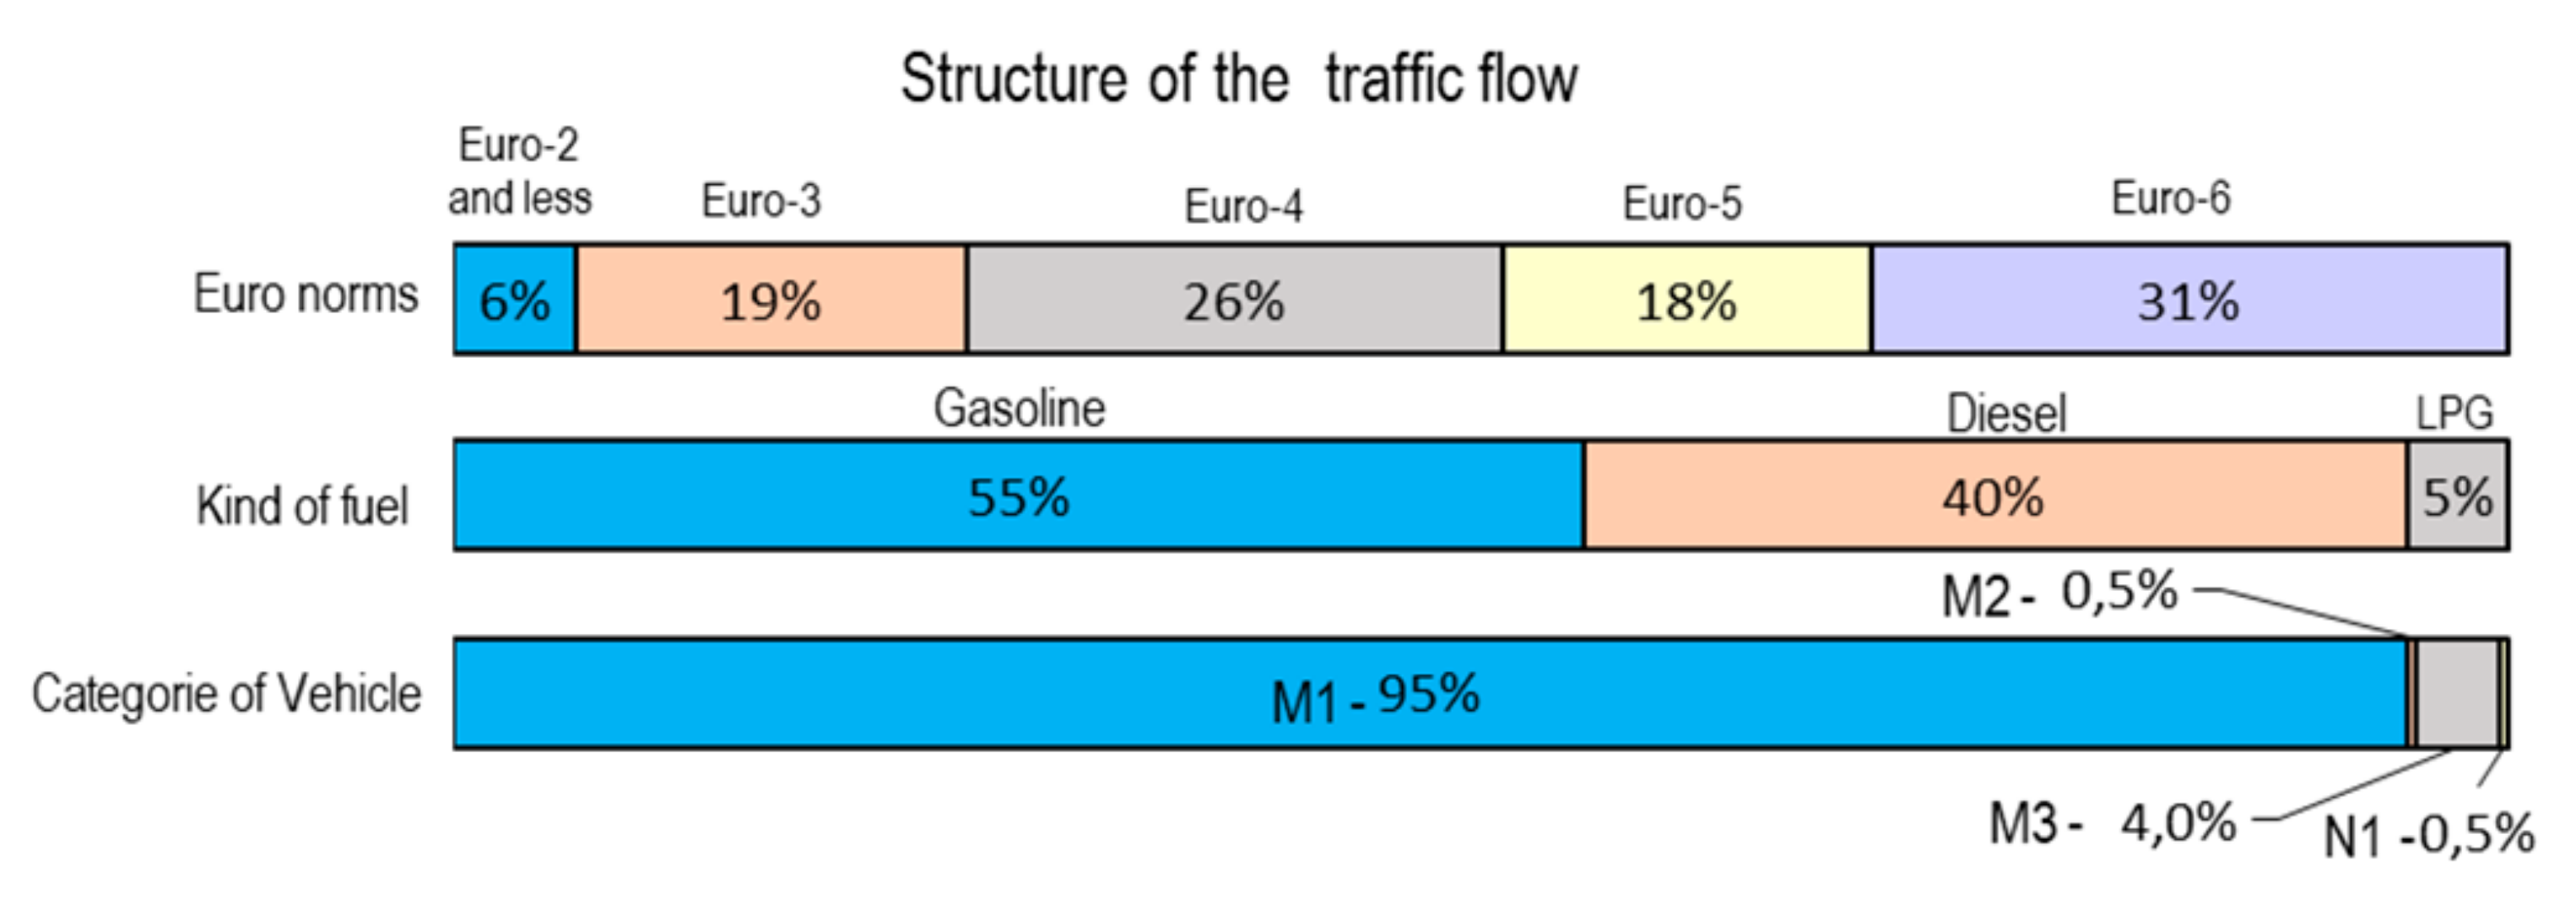
Figure 14 shows the structure of the traffic flow of Rzeszow, which was adopted to simulate the level of air pollution on the experimental section of the road.
Regarding the composition of the fleet, the share of vehicles that meet higher environmental standards of Euro 5 and 6 (under 10 years old) is growing every year, reaching 49%, but about a quarter of the fleet is comprised of vehicles with high emissions that meet environmental standards below Euro 3 (over 15 years old).
The types of vehicles in traffic on the selected road section differs from that of vehicles registered in the city. Not all vehicles registered in the city are involved in everyday traffic, and, in addition, a significant number of vehicles entering Rzeszow from outside the city are on the streets every day.
Specific emissions of carbon monoxide (CO), hydrocarbons (CnHm), nitrogen oxides (NOx), and particulate matter (PM) were determined by the simulation results depending on the parameters and modes of motion of individual vehicles in the flow. For this purpose, mathematical models were used, which are described in detail in [
41,
42,
43,
45].
The output of the emission process at level A is the mass emissions of pollutants
Mi by the traffic flow as the sum of specific emissions
mikjp of individual vehicles, μg/s:
where
I is traffic intensity (units/hour);
mikjp represents specific emissions of the
ith pollutant of a vehicle of the
kth category of the
jth Euro standard operating on the
pth type of fuel in the corresponding mode of motion (g/km); and γ
kjp is the share of vehicles of the
kth category of the
jth Euro standard on the
pth type of fuel.
Feedback at level B enables control of the output of the level A process by changing the intensity, composition, and modes of motion of the traffic flow. The restrictions of this process are the permissible specific emissions of the vehicle mikjp < [mikjp], and the velocity V < [V] and intensity I < [I] of traffic flow on the studied section.
The process of level C is the dissipation of pollutants
Mi in air under given atmospheric conditions. The output of the process of level C is the concentrations of the
ith pollutants
C(
x)
i in the air at a given distance
x (μg/m
3):
where
u is the wind speed (m/s);
α is the angle between the wind direction and road direction (°);
σy and
σz are dispersions of the distribution of substances in the atmosphere in directions
y and
z at a given distance
x from the axis of the road (m); and
h is the height of the emission source (m).
Feedback at level D controls the output of process C by influencing the characteristics of the roadside environment, and by changing the intensity, composition, and modes of motion of the traffic flow. Restrictions of the process are the permissible concentrations of Ci < [Ci], and the velocity V < [V] and intensity I < [I] of traffic flow on the studied section.
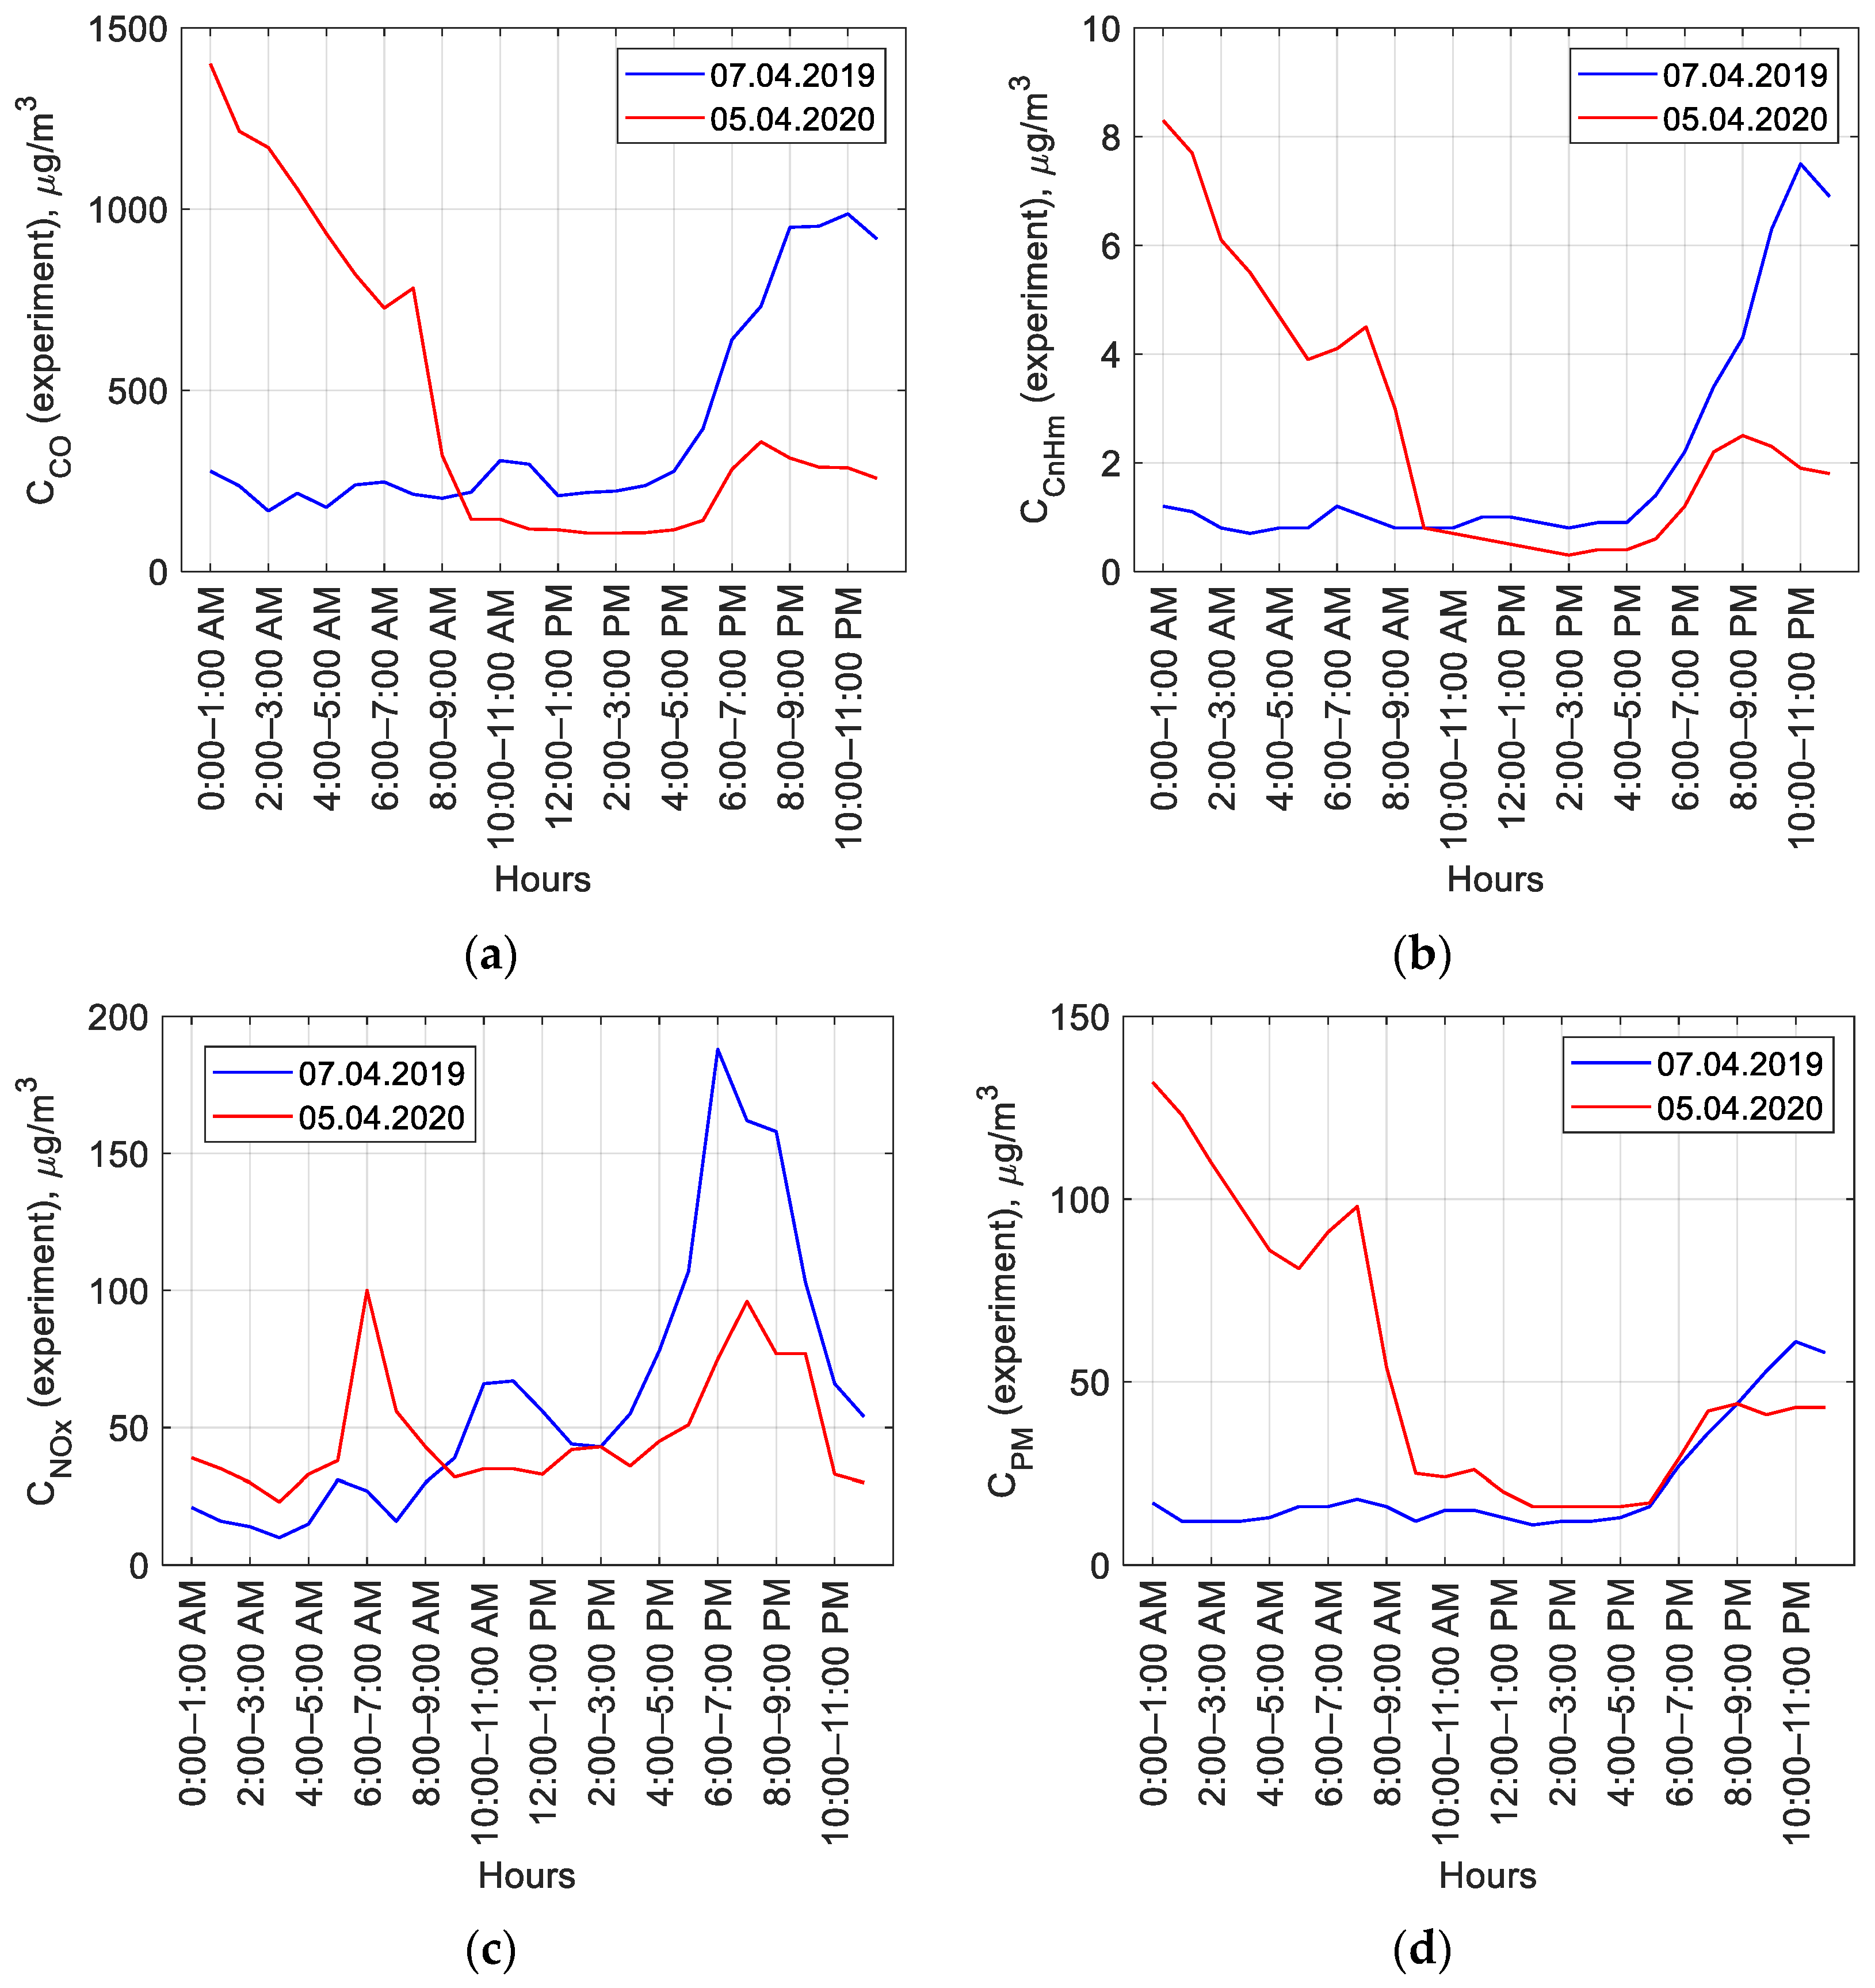
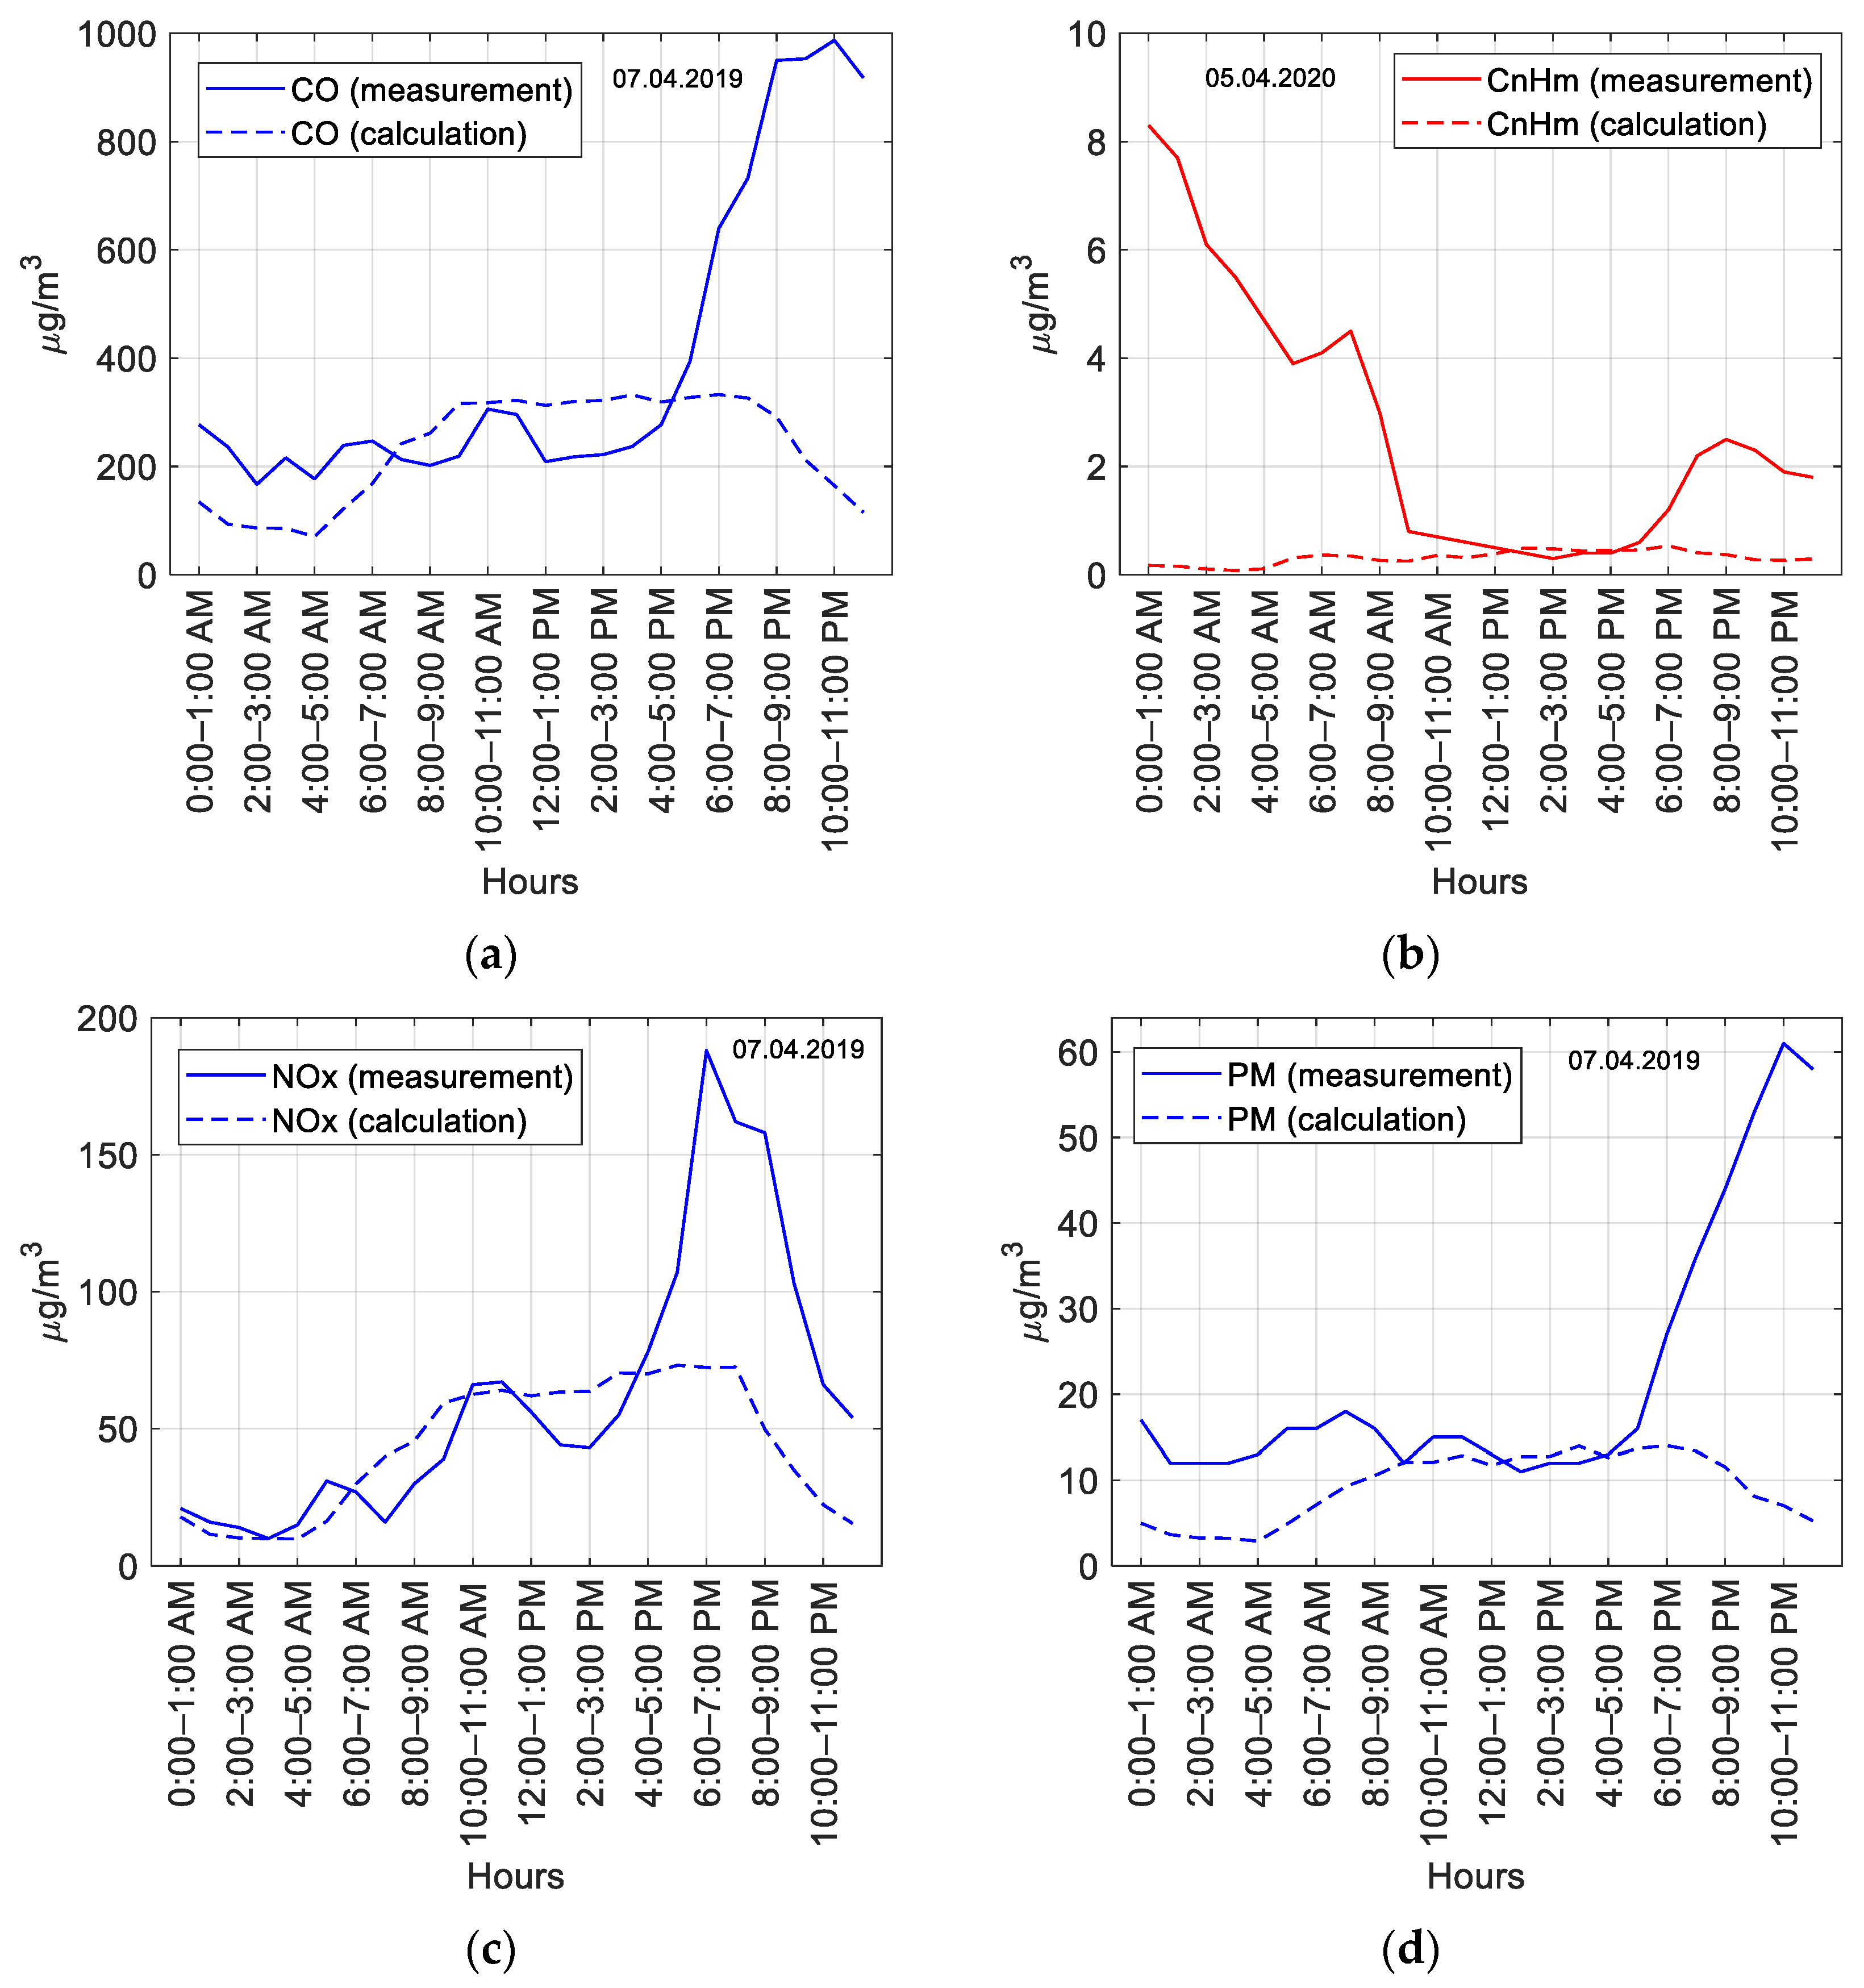
5. Results of Air Pollution Simulation
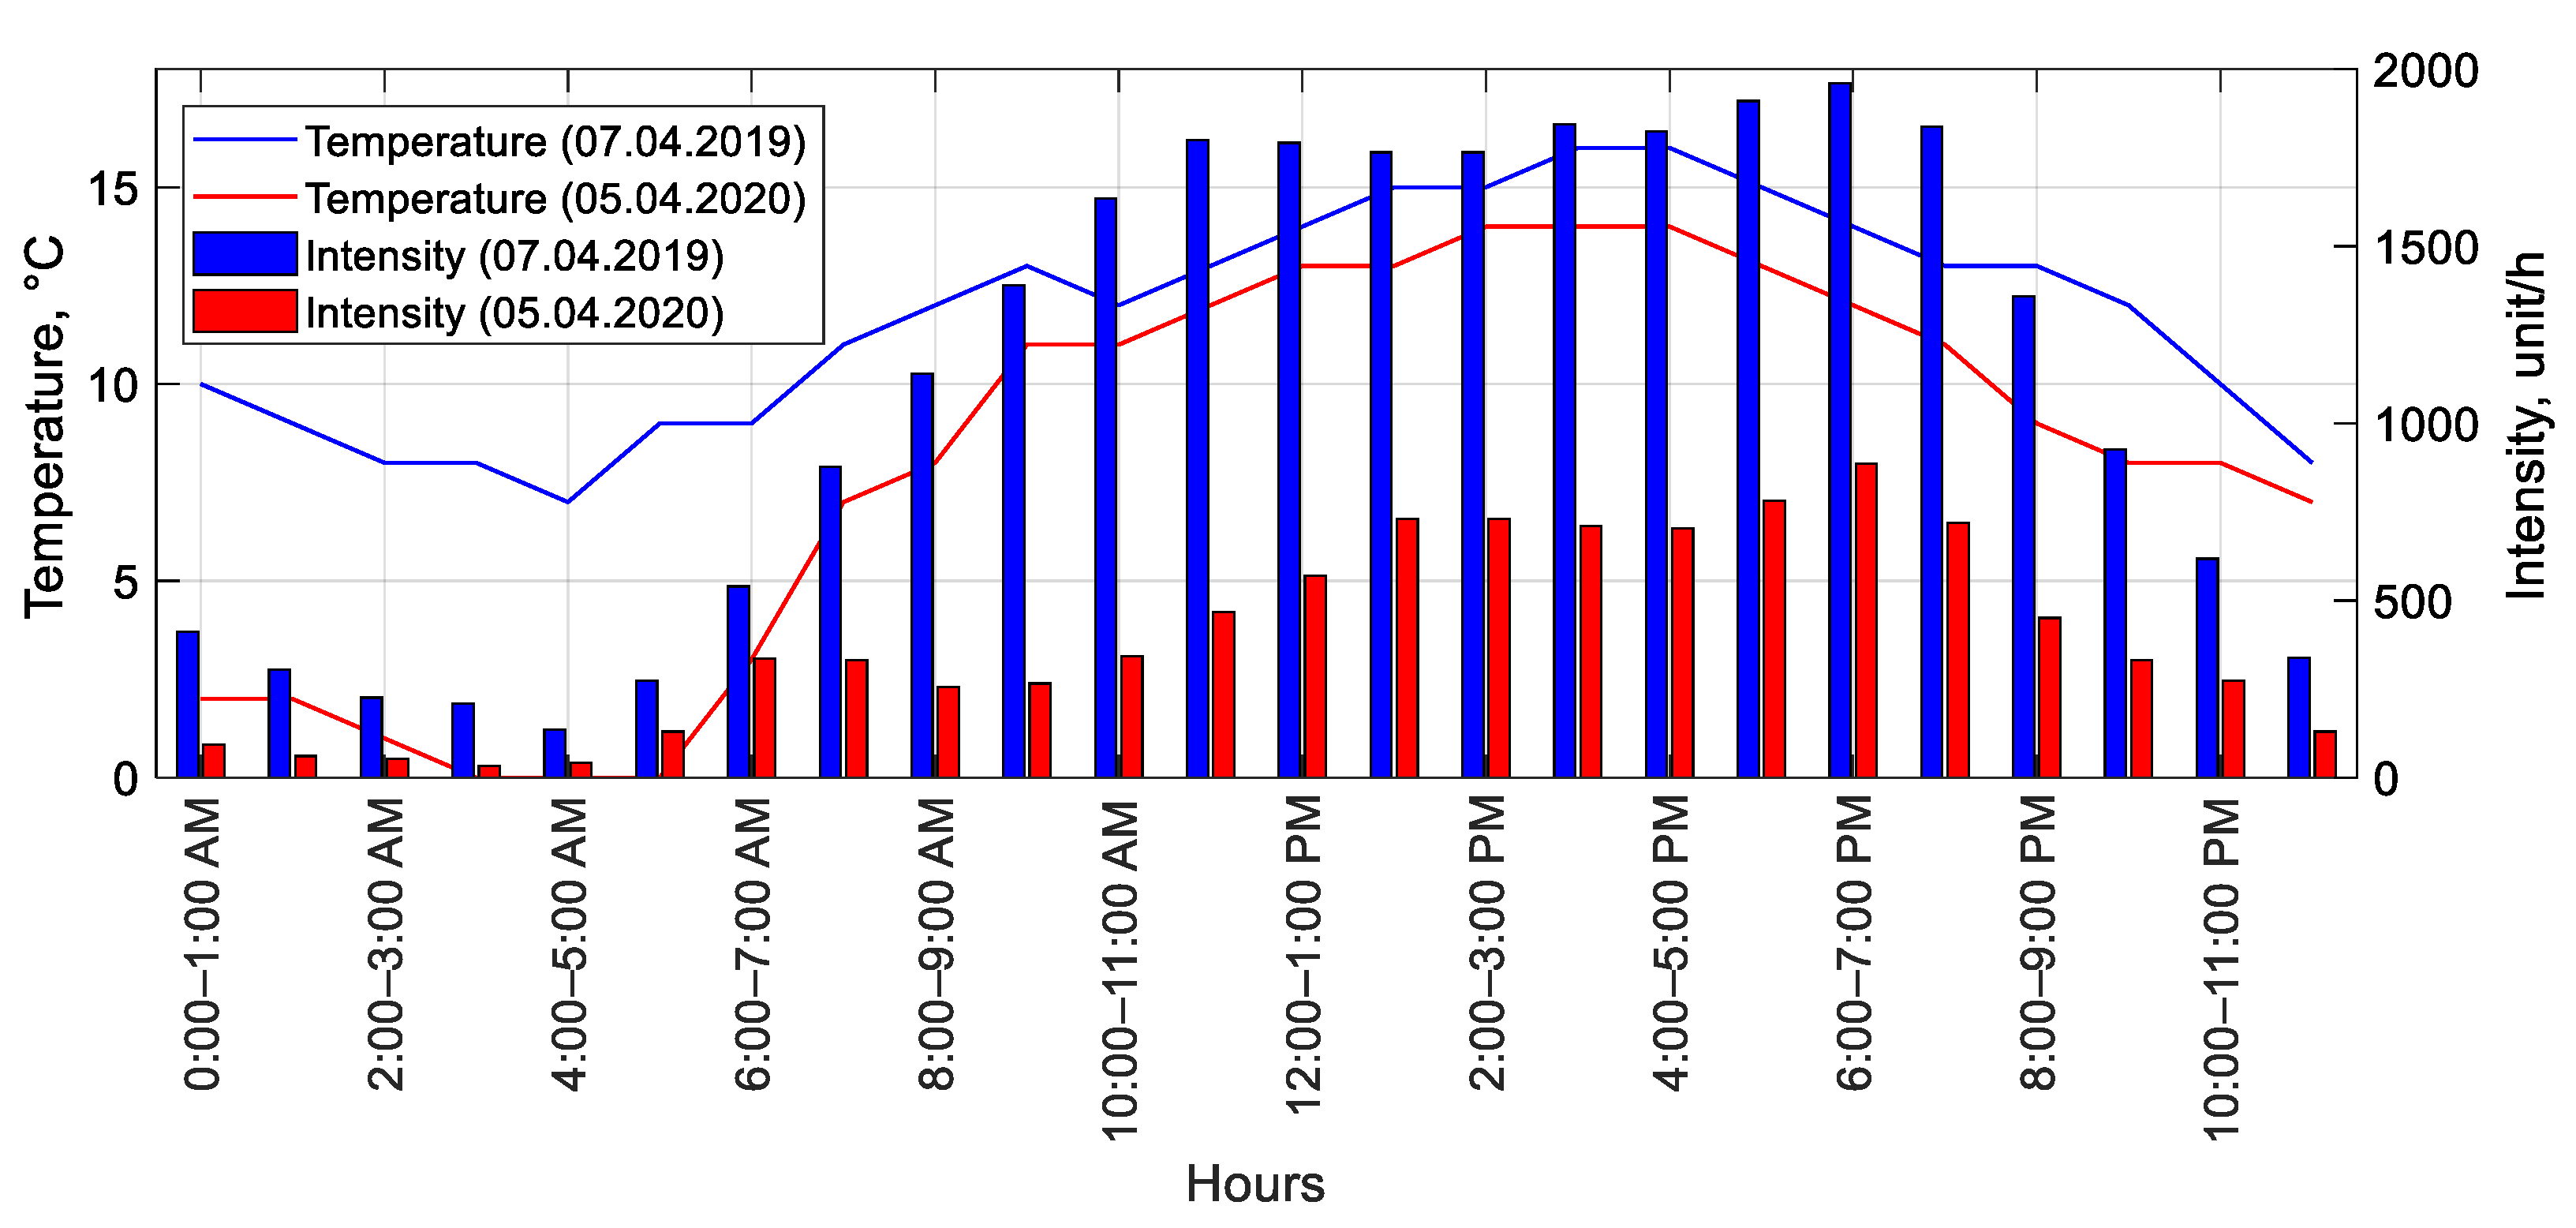
The model was verified by comparing the calculated
Ci and measured
Cexpi values of pollutant concentrations in the air. The results of calculating these concentrations, obtained on the basis of simulating pollution of the roadside environment by traffic flow using the described model, compared with their values as measured by the observation station on 7 April 2019 and 5 April 2020 are shown in
Figure 15.
Analysis of the comparison results demonstrated that the mathematical model adequately describes the process of pollution of the roadside environment by traffic flow during the day between 9:00 a.m. and 5:00 p.m., when vehicles are the main source of emissions. However, a significant increase in pollutant concentrations was observed from 6:00 p.m. to 8:00 a.m. Concentrations of NOx and PM even exceeded the maximum permissible values, which are 30 and 50 μg/m3, respectively. This is caused by other sources of emissions related to the combustion of solid fuels for heating due to low ambient temperature.
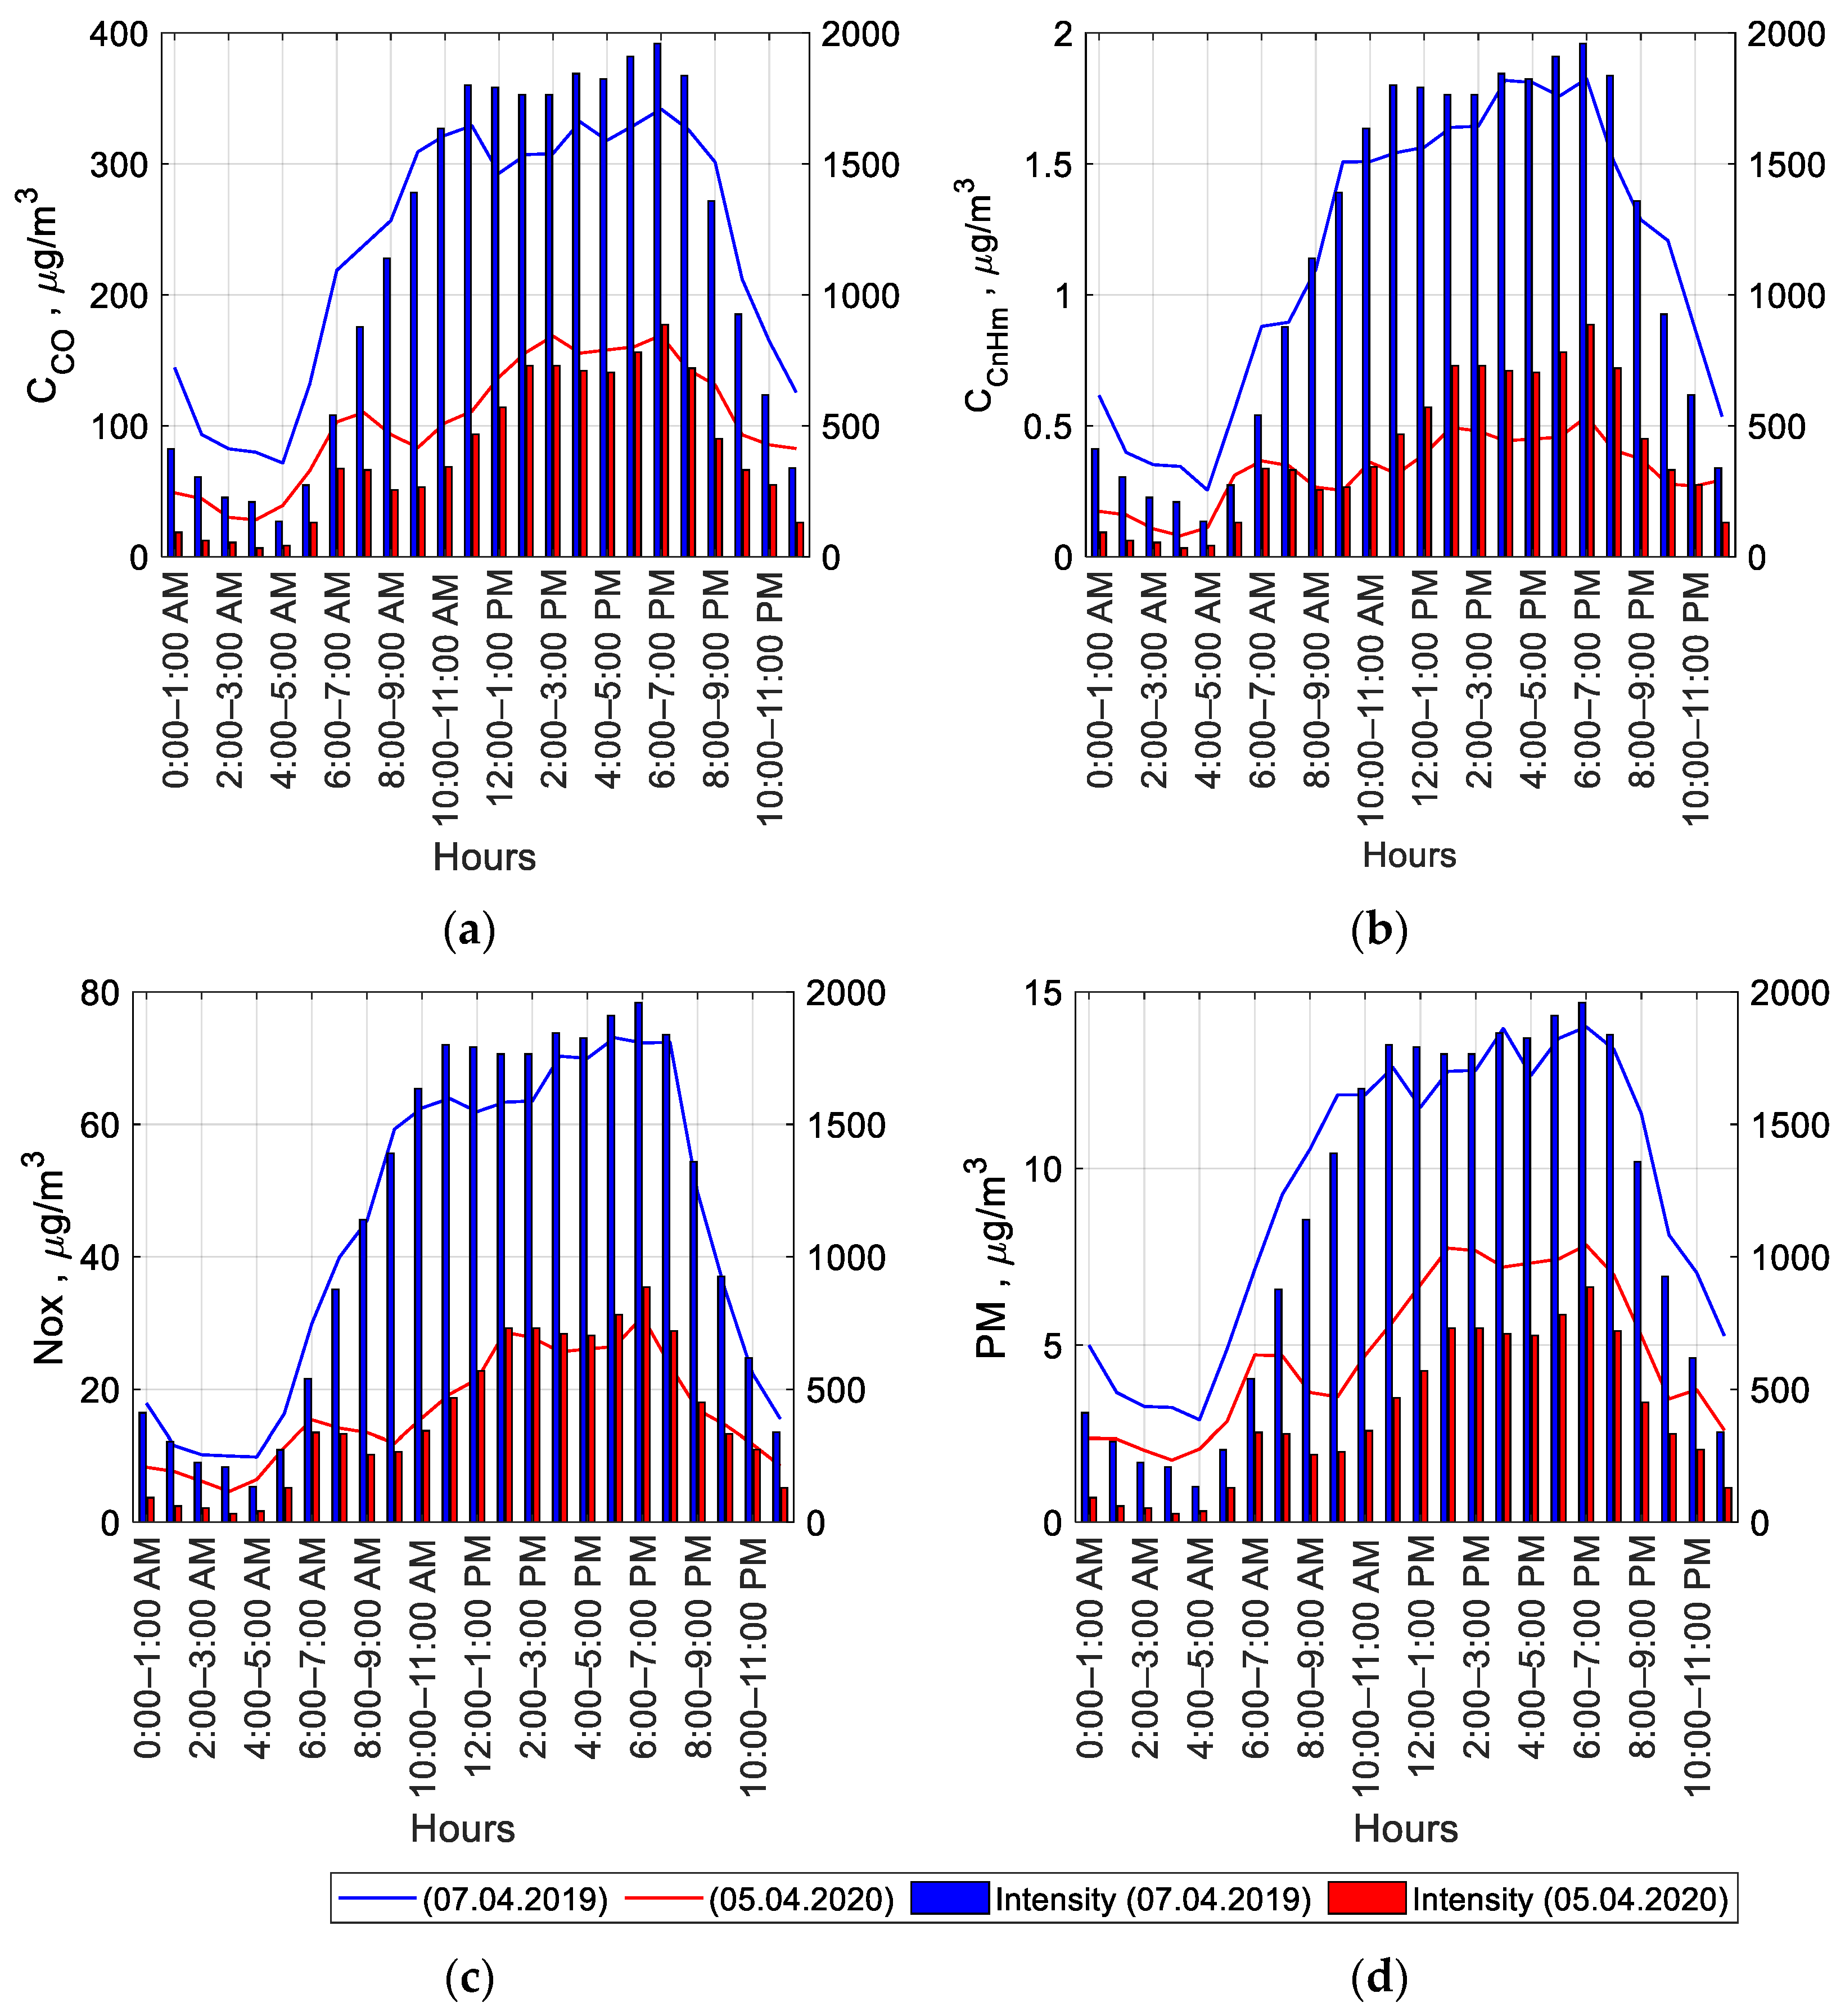
The improved mathematical model enables us to assess the impact of changes in urban mobility caused by the COVID-19 pandemic on the level of environmental pollution due to traffic flow, and to determine the role of road vehicles in urban air pollution.
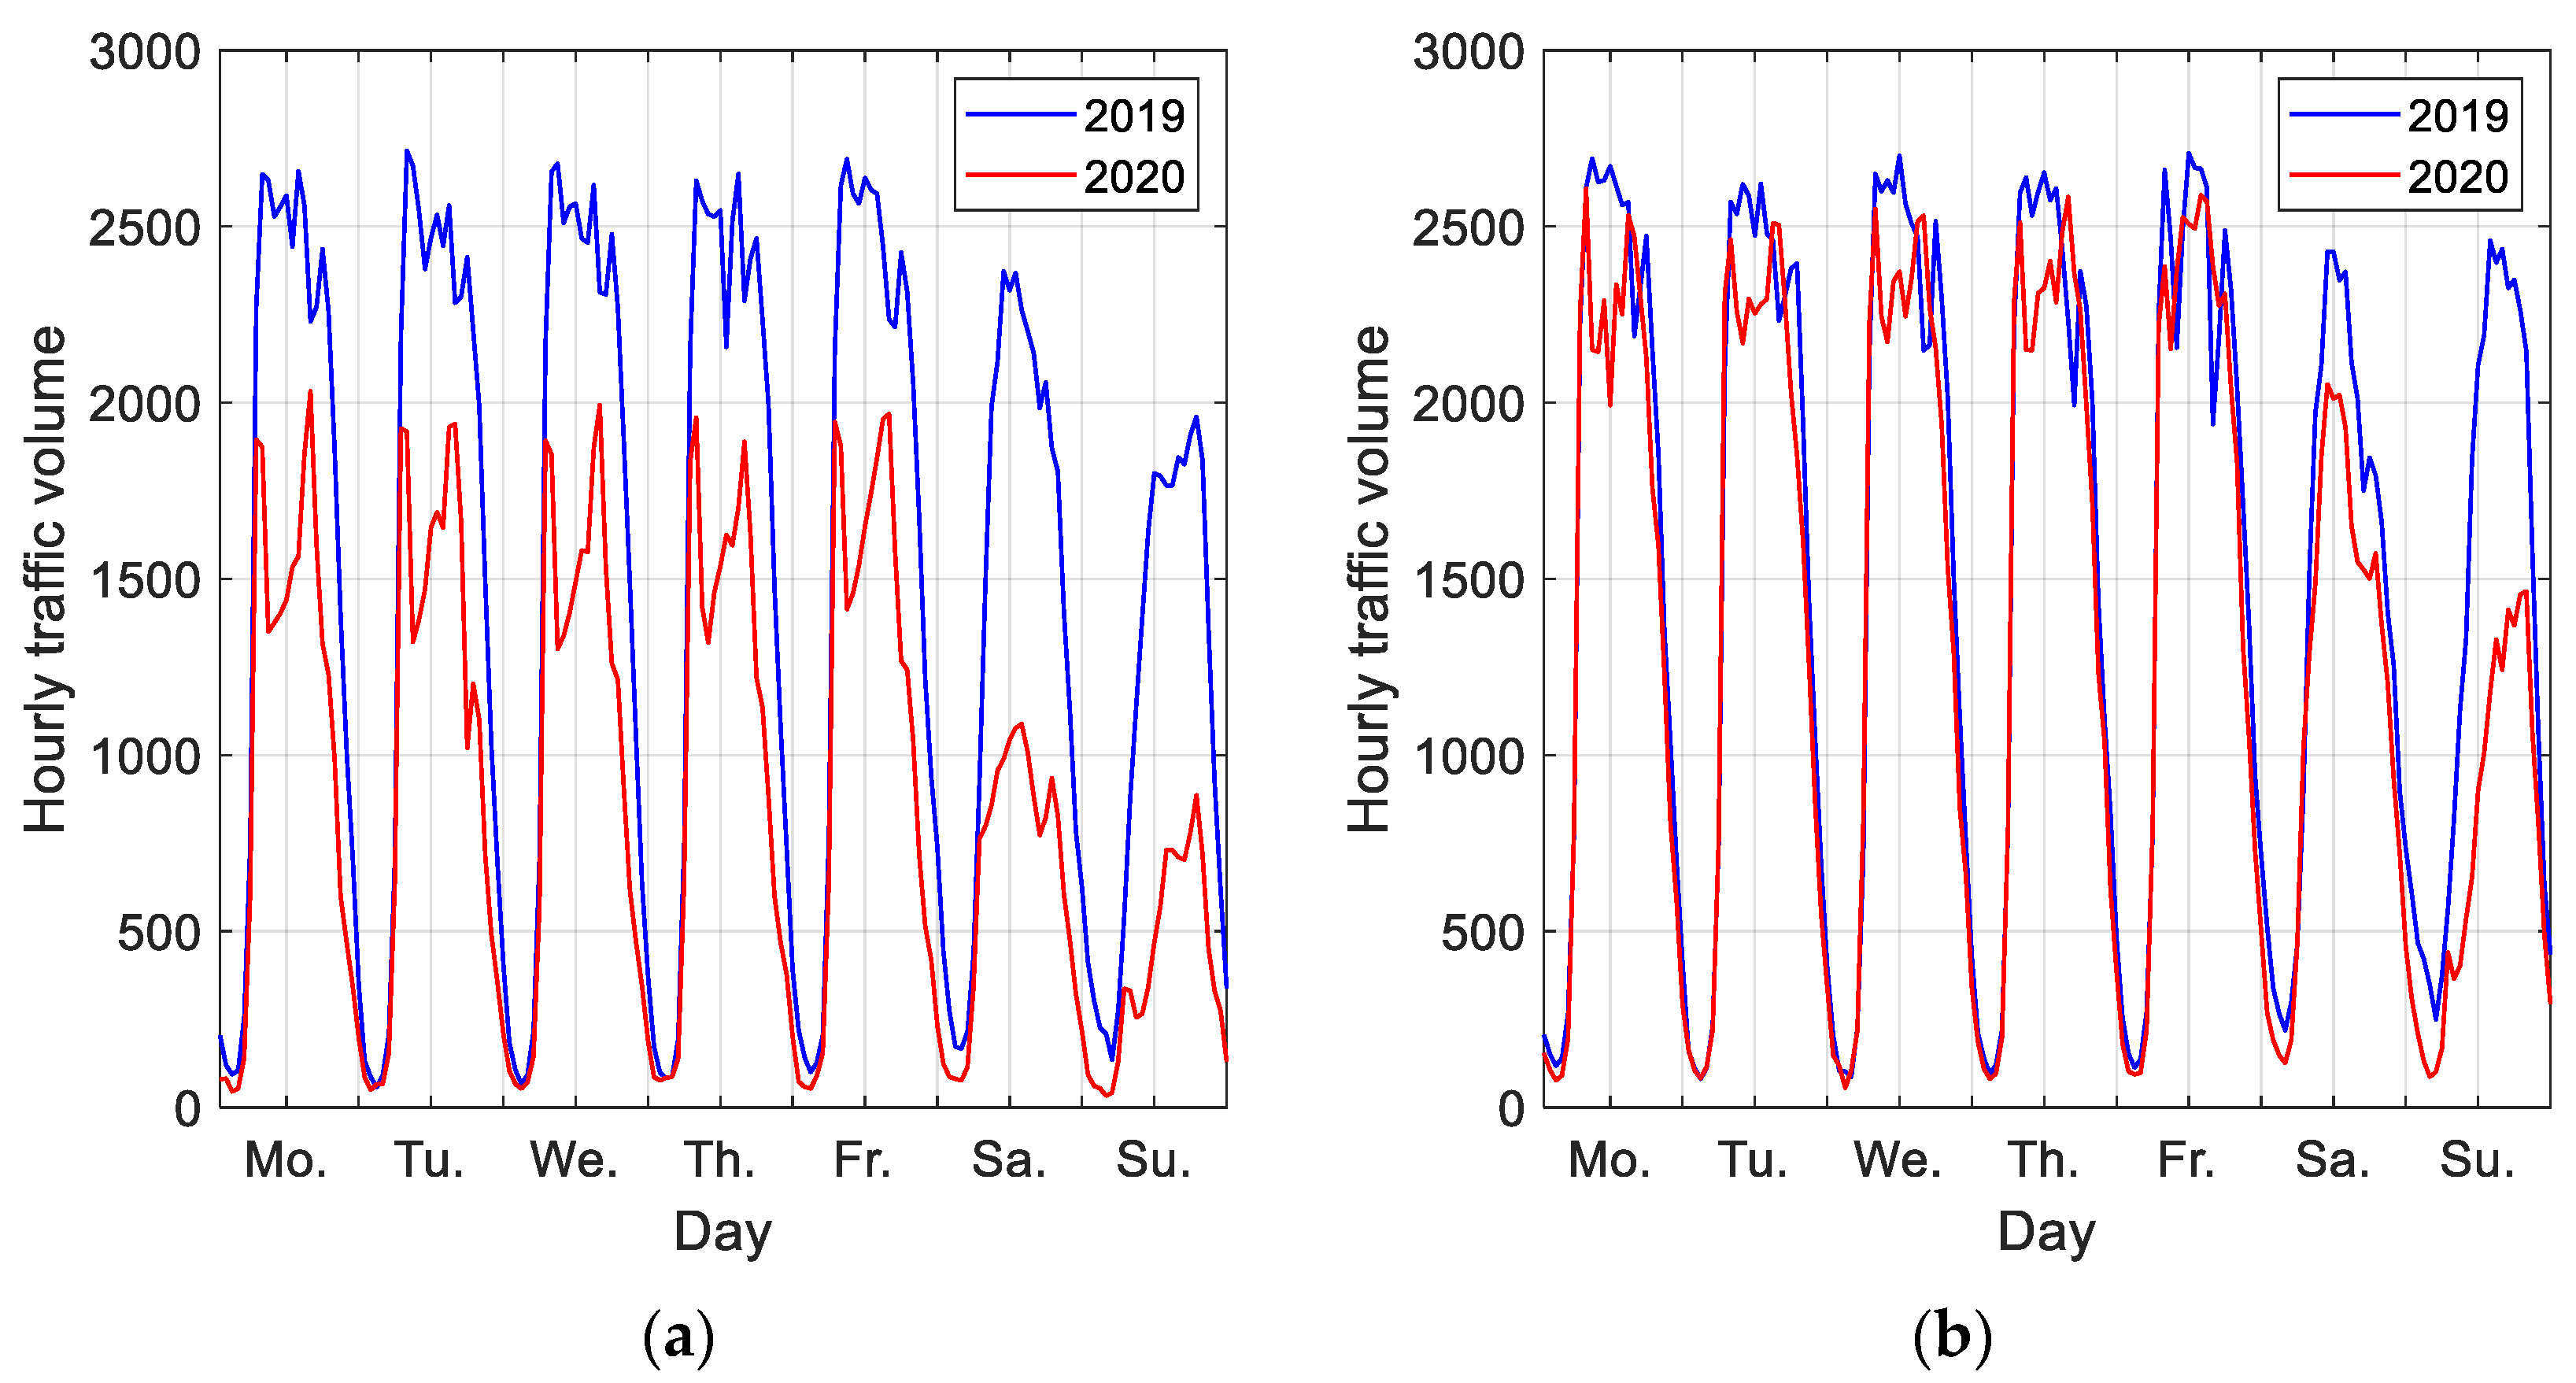
To address this task, a comparative assessment of air pollution by traffic flow on the studied road section under normal (7 April 2019) and quarantine (5 April 2020) conditions was conducted. The introduction of quarantine led to a decrease in average daily traffic intensity by 66%, and hourly intensity by 47–85%.
Traffic intensity under the same weather conditions is a determining factor of the level of roadside pollution, which was confirmed by the simulation results (
Figure 16).
Analysis of the dependencies of changes in hourly pollutant concentrations in the air demonstrated that their values are proportional to traffic intensity. The decreased traffic intensity during the quarantine period led to a decrease in CO concentration by 1.58–3.68 times, CnHm concentration by 1.81–5.96 times, NOx concentration by 1.45–4.98 times, and PM concentration by 1.39–3.42 times. For total daily emissions, the decreases amounted to: CO, 2.25; CnHm, 3.55; NOx, 2.64; and PM, 1.96.
The significant influence of atmospheric characteristics on the level of roadside pollution, especially wind speed, should also be noted, as well as the class of atmospheric stability; these determine the nature of the dissipation of harmful substances in the air.
Thus, the proposed approach for the assessment of roadside pollution by traffic flow enabled us to assess the impact of the pandemic on the level of air pollution in Rzeszow and to show that city traffic is often not the main source of air pollution.
The improved mathematical model of the traffic flow–roadside environment system is a powerful tool for studying the impact of traffic flow characteristics and road infrastructure on the level of urban air pollution, and for evaluating the effectiveness of ways to reduce roadside pollution by traffic flow.
6. Discussion and Conclusions
The main goal of this work was to investigate the impact of the pandemic on city traffic in Rzeszow in the first half of 2020 and to determine changes in the emission of pollutants emitted into the atmosphere by motor vehicles.
The COVID-19 pandemic is significantly changing the way urban transport functions. The introduction of lockdown significantly reduced city traffic and passenger transport everywhere. Changes in vehicle traffic and passenger transport that were observed in Rzeszow do not differ from changes in the other cities described in the first part of this paper.
In this study, the data necessary to conduct relevant analyses of traffic volume were obtained in a different way, as was the case in most of the discussed works in
Section 1 [
7,
8,
9,
10,
11,
12,
13]. For the city of Rzeszow, the data came from sensors equipped with induction loops installed on access roads to the city and a significant number of intersections. This superior system counts and records the number of passing vehicles in real time. Using this data on actual registered journeys of vehicles and by selecting the appropriate time point (the reference period was the beginning of 2020 or the appropriate week in 2019), hourly, daily, and monthly drops in traffic were determined. In the earlier works cited, which were based on data from the Google, Apple, and Baidu Maps systems, only information on percentage drops in individual mobility categories was included. Comparing the data presented there with the data obtained for Rzeszow in
Figure 4,
Figure 6,
Figure 7 and
Figure 8, a clear similarity can be seen. In most cases, for Rzeszow, vehicle traffic decreased 40% to 60%. On the other hand, public transport decreased almost 80% (
Figure 5b). Such declines can be found in other studies [
10,
16,
17,
18]. In May and June, motor vehicle traffic in Rzeszow increased. In June, the decrease in traffic compared with January did not exceed 20%. Similar information on the decline in vehicle traffic in June compared with the period before the lockdown can be found in [
8,
9,
12,
15]. The routes shown in
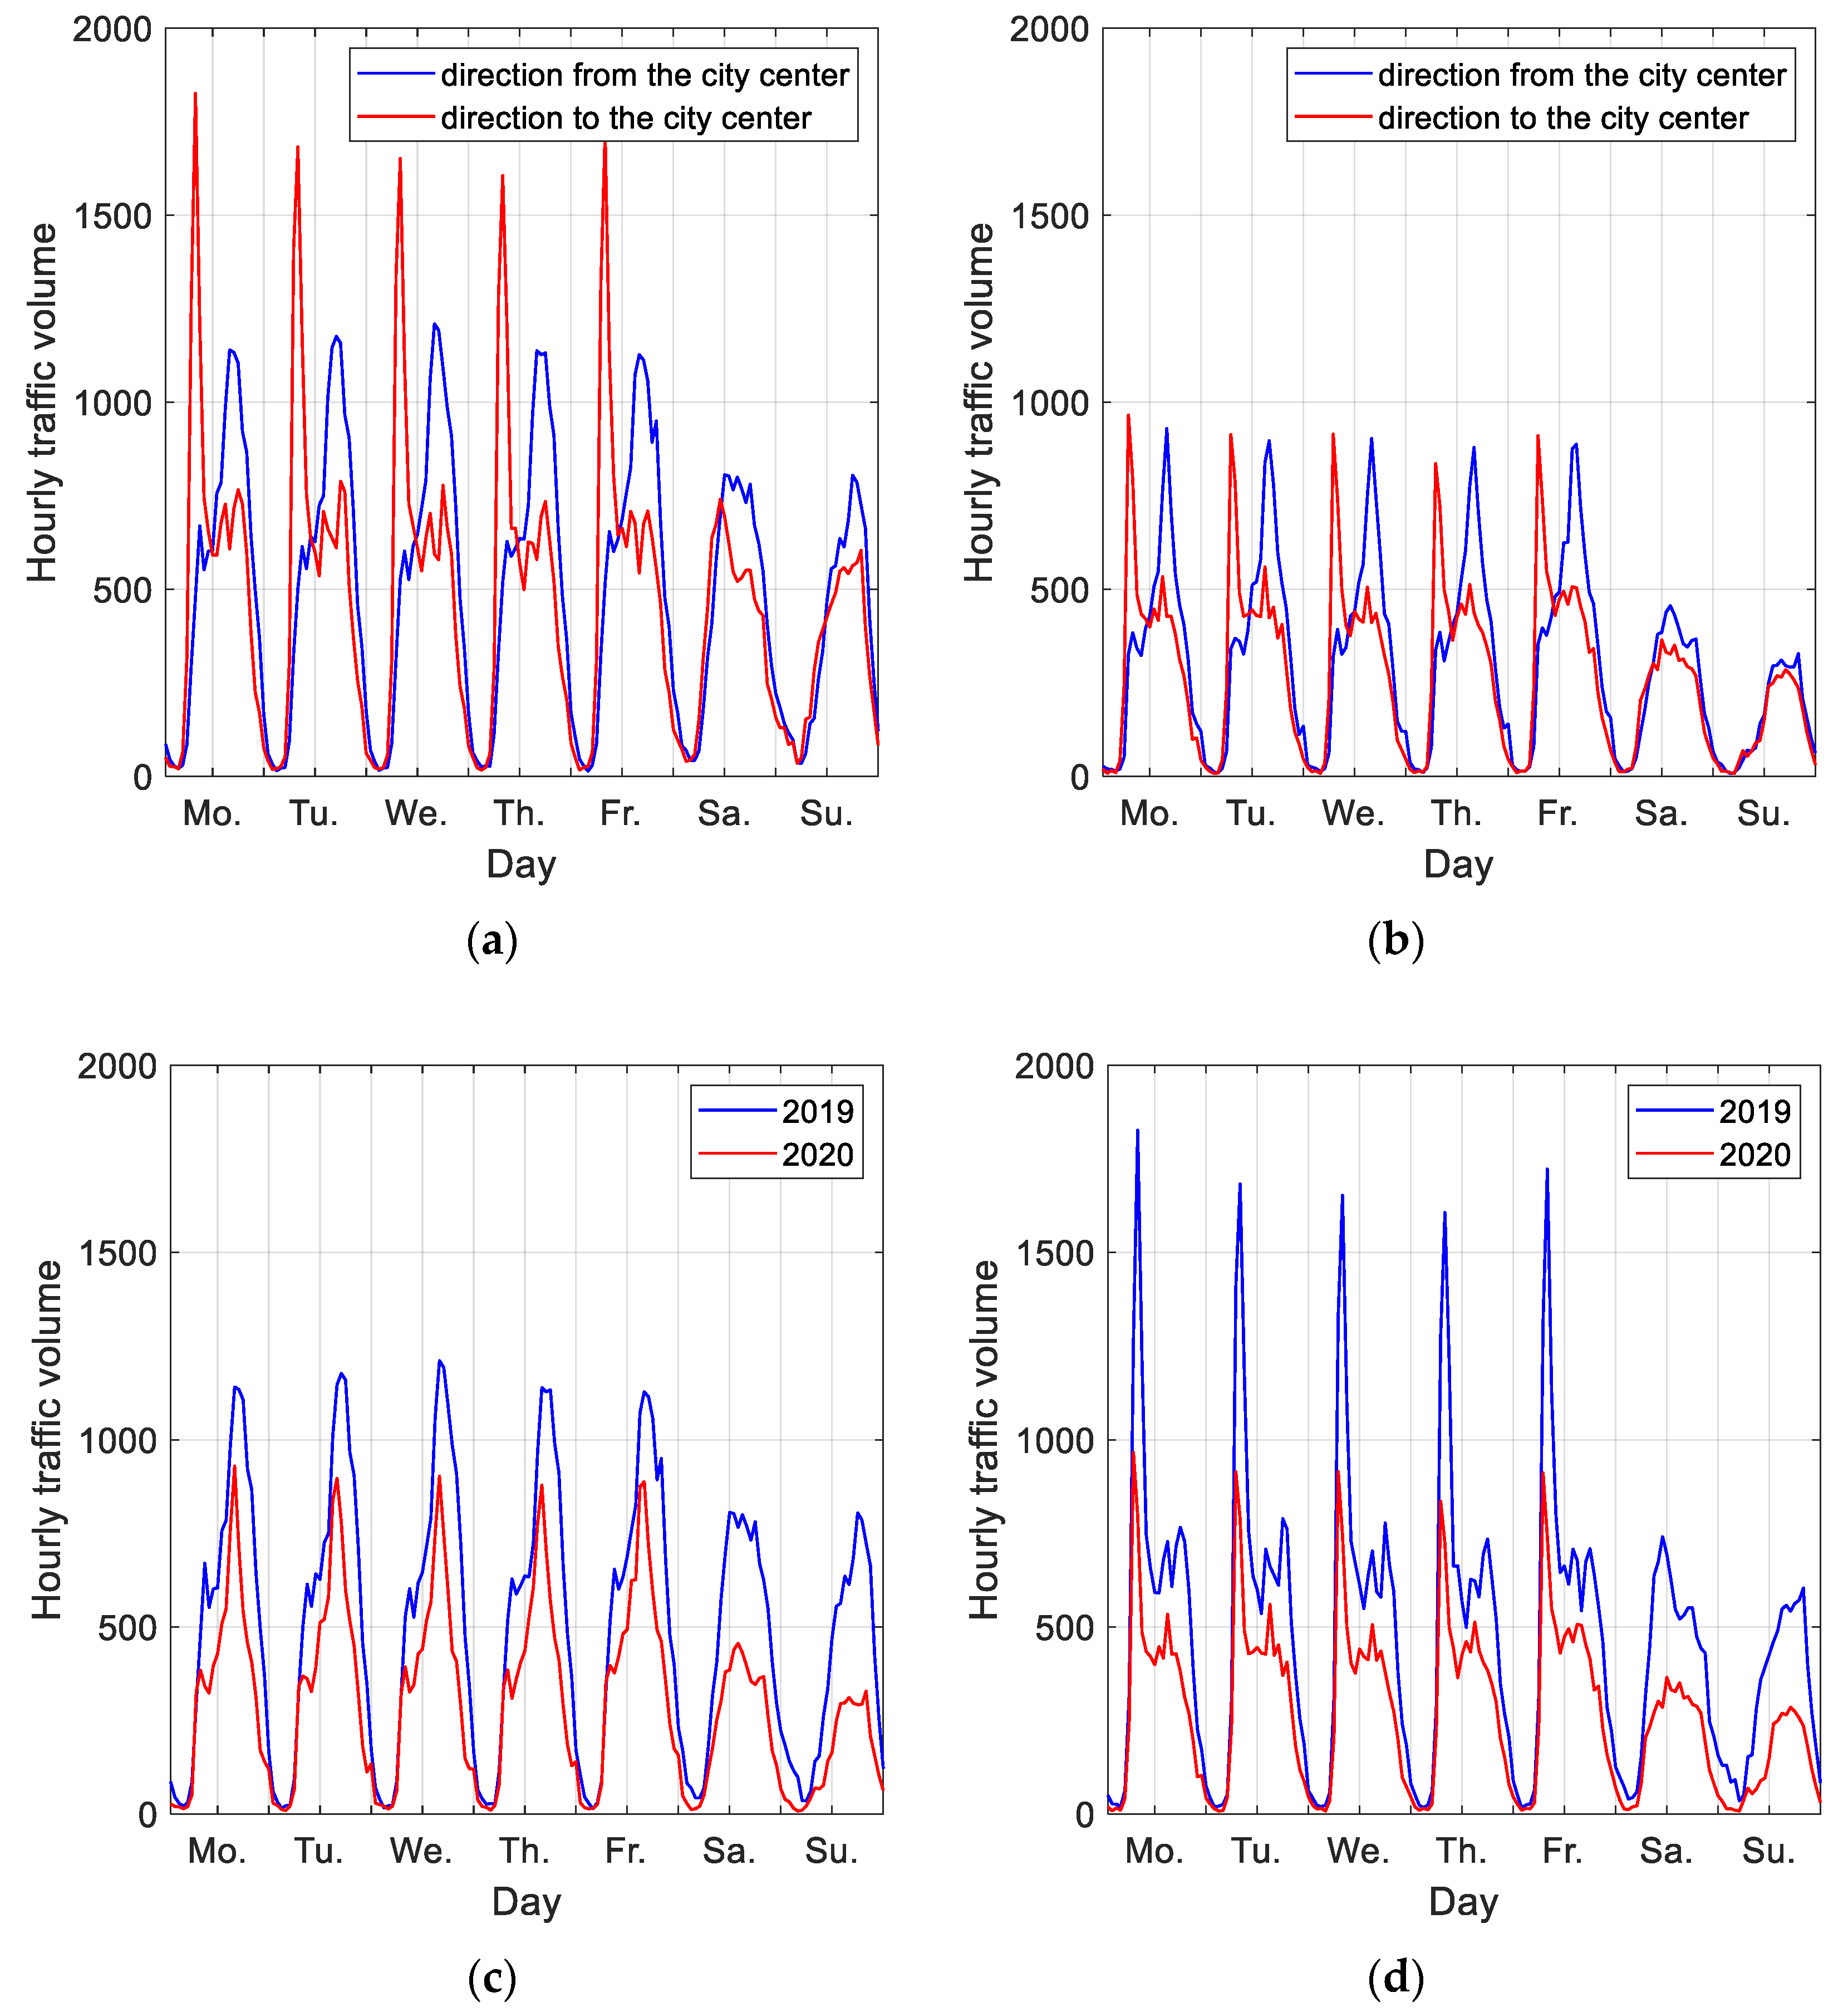
Figure 7a also inform us about changes in the types of travel. At the beginning of April 2020, travel related to work, characterized by morning and afternoon peaks, dominated. In May, the number of non-commuting journeys increased and the peaks observed previously were no longer as marked. The quoted literature sources also note such changes in the nature of travel.
Limiting vehicle traffic also means reducing the emission of harmful substances into the atmosphere. Such changes have been observed in most cities [
27,
28,
29,
30,
31,
32,
33].
In the case of Rzeszow, when analyzing the results for air pollution obtained from the analyzed roadside measuring station from March and April, it is possible to make an erroneous conclusion about the lack of or low impact of vehicle traffic on the degree of pollutant emissions into the atmosphere.
The maximum concentrations shown in
Figure 12 occurred at times of the day when traffic was light. March and April are months when the city has low outside air temperature. In the evening and morning hours, air temperature very often reaches zero or negative degrees Celsius. Thus, the sharp increases in the concentrations of harmful substances in the air in the evening, night, and morning hours, as seen in
Figure 12, are caused by non-automotive emission sources. The combustion of solid fuels in home heating devices when there is low ambient temperature is responsible for that increase.
To determine the impact of the intensity of traffic flow on emission levels, a mathematical model was built based on the transport flow–roadside environment system. This model required data on actual hourly traffic volume. Such data were available for Rzeszow, along with data on the level of air contamination and meteorological conditions.
The model was verified with the example of a section of the road network of the city equipped with tools to determine air quality and traffic characteristics under normal and quarantine conditions. The model was verified with the use of measurement data from the hours when the air temperature did not change significantly and was close to the maximum temperature. The obtained results of the computer simulation enabled a comparison of the hourly concentrations of harmful substances in the air and the total pollutant emissions of traffic flows on the given section of the route under normal and quarantine conditions. In the case of total daily emissions, the decreases in specific factors amounted to 2.25 for CO, 3.55 for CnHm, 2.64 for NOx, and 1.96 for PM. The maximum hourly emissions of individual substances into the atmosphere were reduced to a similar extent. However, emission reductions in 2020 resulting from the decreased traffic volume on many analyzed days with lower outside temperature were significantly lower than the additional increase in emissions from other sources, e.g., devices used for space heating. As a result, on the days in 2020 with low external temperature, the level of total contamination exceeded that of comparable days in 2019. The situation observed in Rzeszow is not unique in this respect. Similar data on the lack of impact of the pandemic on total air pollution in selected cities can be found in [
29,
32]. In those cities, other sources of pollution dominated motorized sources.
The proposed approach for the assessment of roadside pollution enables analysis of the impact of traffic flow characteristics and road infrastructure on the level of urban air pollution, and evaluation of the effectiveness of ways to reduce roadside pollution.

 ,
, 


