Article

Structural Response of a Single-Stage Centrifugal Compressor to Fluid-Induced Excitations at Low-Flow Operating Condition: Experimental and Numerical Study

by
Kirill Kabalyk
1,*,
Andrzej Jaeschke
1,
Grzegorz Liśkiewicz
1,
Michał Kulak
1,
Tomasz Szydłowski
2 and
Robert Pietruszewski
2
1
Institute of Turbomachinery, Lodz University of Technology, Wólczańska 217/221, 93-005 Łódź, Poland
2
Department of Vehicles and Fundamentals of Machine Design, Lodz University of Technology, Stefanowskiego 1/15, 90-537 Łódź, Poland
*
Author to whom correspondence should be addressed.
Energies 2021, 14(14), 4292; https://doi.org/10.3390/en14144292
Submission received: 2 June 2021 / Revised: 12 July 2021 / Accepted: 13 July 2021 / Published: 16 July 2021

Abstract

:
The article describes an assessment of possible changes in constant fatigue life of a medium flow-coefficient centrifugal compressor impeller subject to operation at close-to-surge point. Some aspects of duct acoustics are additionally analyzed. The experimental measurements at partial load are presented and are primarily used for validation of unidirectionally coupled fluid-structural numerical model. The model is based on unsteady finite-volume fluid-flow simulations and on finite-element transient structural analysis. The validation is followed by the model implementation to replicate the industry-scale loads with reasonably higher rotational speed and suction pressure. The approach demonstrates satisfactory accuracy in prediction of stage performance and unsteady flow field in vaneless diffuser. The latter is deduced from signal analysis relying on continuous wavelet transformations. On the other hand, it is found that the aerodynamic incidence losses at close-to-surge point are underpredicted. The structural simulation generates considerable amounts of numerical noise, which has to be separated prior to evaluation of fluid-induced dynamic strain. The main source of disturbance is defined as a stationary region of static pressure drop caused by flow contraction at volute tongue and leading to first engine-order excitation in rotating frame of reference. Eventually, it is concluded that the amplitude of excitation is too low to lead to any additional fatigue.

1. Introduction

The modern industrial process market is characterised by consistently restricting environmental and economic regulations [1]. For OEMs of centrifugal compressors, this means that newer machinery must be more compact and more efficient. Its performance range should offer higher flexibility, whereas any reliability compromises are impossible. The most powerful, though expensive, strategy to accomplish these tasks is to broaden the existing banks of so-called “experimental model stages” [2]. The data from model tests should be then used in next-generation units: directly, in designs based on similarity theory [3], or indirectly, through designs based on statistical semi-empirical mathematical models [4,5]. It is known that aerodynamically stable operational range of these (or any other) centrifugal compressors will be limited by inception of “choking” in the vicinity of m ˙ > m ˙ d e s and by onset of “surging” at a certain point as m ˙ < m ˙ d e s [6]. Both phenomena are extremely undesirable from the standpoint of continuous operation. Choke would normally result in levelled-up synchronous vibrations (consequence of circumferential pressure non-uniformity at stages with volutes [7]) whereas surge would require an immediate intervention (via bypass or via blow-off) to prevent failure. In fact, conventional restrictions demand the actuation of an anti-surge valve at the flow rate which is ten percent higher than the predicted surge capacity [8]. For stages with high load factors, this potentially eliminates operation at peak efficiencies. Consequently, either a performance or a size (number of stages) parameter has to be compromised.
To ensure safe operation beyond the ten percent margin, the compressor train’s layout must satisfy at least two conditions:
(1)
It should run a reliable and affordable active surge protection.
(2)
It should sustain dynamic aero-loads originated by surge-preceding flow transients (recirculation, rotating stall, etc.).
Active surge control has been a subject of numerous works [9,10,11,12] and is still on the way to the debut in industrial applications. Fulfilment of the second condition, requires the knowledge of dynamic stress at critical locations (primarily in impeller) as the machine interacts with unsteady flow structures. Research in this field have also been accomplished, but the amount of relevant data available in the literature is yet limited. Haupt and Rautenberg [13] implemented high-sensitivity semi-conductor strain gauges and telemetry to study the response of highly loaded impeller with thin blades at stable operation, rotating stall and surge. It was discovered that (at certain speeds) blade vibration amplitudes at vaneless diffuser rotating stall had the same order as at unbalance-induced resonances. Dickmann et al. [14] used the same technique enriched with tip-timing optical measurements and CFD-CSM uncoupled numerical simulations to study the response of a supercharger impeller to excitations at “close-to-Choke” and “close-to-Surge” points. The authors reported good qualitative agreement between computed and measured amplitudes of forced vibrations. Jenny and Bidaut [15] reported cases of impeller resonances subjects to excitations from vaned diffuser rotating stall. The sophisticated experimental rig enabled synchronized dynamic pressure and strain acquisition in rotating frame of reference. The extension of the study published in [16,17], was focused on implementation of numerical model to describe the fluid-structure interaction mechanisms and to assess the impact of diffuser stall on high-cycle fatigue dynamics of the wheel. The study resulted in a new diffuser design and a subsequent reduction of vibration amplitude at resonance. Moreover, numerical FSI-modelling also showed a reasonable success in root-cause analyses of impeller failures caused by Tyler-Sofrin [18] resonances, as written in [19,20,21].
This work, has a similar context as those discussed above. Its main purpose is to rate the capability of a one-way coupled unsteady FSI numerical model to predict the modes of forced vibrations of the “shrouded impeller-vaneless diffuser-volute” system. The research incorporates experimental analyses of excitation sources (unsteady pressure fluctuations) and of dynamic response of the rotor. These were carried out at low impeller tip speed (due to safety limitations), with main intention to establish a base for simulations’ validation. The primary numerical campaign, however, concerns an operating condition at reasonably higher speed and suction pressure, which is done to reproduce the loads commonly met in industry. This part of the work is referred to as “model implementation”.

2. Test Compressor

The test vehicle resembles a single-stage blower derived from the former integrally geared air compressor (3 VRK 150/285, VEB Pumpen und Gebläsewerk Leipzig). The layout of the facility is presented in Figure 1. The rotor is directly coupled to an electric variable speed motor. The stage includes a shrouded medium load- and flow coefficient impeller (1) with tip diameter of D 2 = 265 mm (15 blades) and a vaneless diffuser (2). Upstream the wheel, the mass flow measurement inlet cone (4) and the suction pipeline (5) are flange-linked to the casing of an overhung volute with constant internal diameter (3). At the discharge, the latter is connected to a straight circular duct (6) completed by a spherical-type throttle (7). The values of the basic geometric parameters of the stage are defined in Table 1.

2.1. Basic Measurement Instrumentation and Uncertainty Estimation

The rig’s equipment enables the analysis of the compressor’s stationary performance characteristics in a “flange-to-flange” fashion. The pressures at inlet ( p a t m ) and outlet ( p o u t ) are measured with piezoelectric industrial-quality transducers whereas the corresponding temperatures ( T a t m , T o u t ) are recorded employing Pt100 RTD probes. The mass flow is estimated in agreement with [22] using a conical mouthpiece and a single static pressure tap linked to a differential piezoelectric transducer ( Δ p I C ).
Moreover, the stand possesses 21 “slots” designed specifically for the transient measurements of wall static pressure fluctuations. Altogether, a pair of stations is implemented nearby the impeller eye ( F P 0 , F P 0 ), the next pair is accommodated in diffuser’s shroud ( F P 2 , F P 4 ) and a single-slotted station is executed in the outlet diffuser downstream the volute. The stations at the eye are composed of three slots uniformly distributed along the 180° sector whereas the stations at VLD acquire seven non-uniformly spaced slots each.
Eventually, the basic configuration of the rig permits absolute vibration monitoring via three single-axis accelerometers (PCB ICP 603C01).
The data acquisition and control are carried out using the hardware of NI CRIO-9035 FPGA controller and a routine developed in LabVIEW environment. All incoming signals are synchronized. The sampling frequencies are 50 kHz and 12.8 kHz for the fast-response pressure sensors and the accelerometers respectively. The suppliers’ specification sheets claim the relative uncertainties of 0.5% for unsteady pressure- [23] and of 1% for vibro-acceleration [24] measurements. In stationary aerodynamic performance analysis, the combined relative uncertainties u c ( y ) / y were evaluated following the guidelines in [25] and are collected in Table 2.

2.2. Additional Instrumentation

To perform multi-point vibration measurements in rotating frame of reference, a single-axis laser vibrometer system (Polytec PSV-500) has been additionally installed (Figure 2c). The system is based on the main multi-point scanning head (1) and on an auxiliary single-point laser (2) for phase reference. Data-acquisition in relative frame is ensured by a prism-type optical derotator (3). The latter is synchronized with the drive through the encoder and an in-house-built interface (5). The control units (6), (7), (4) serve for signal transformations when operating the system via an industrial-grade PC (8). The acquisition frequency was set to 10 kHz and was not synchronized with the basic layout. The accumulative relative error of vibro-velocity measurements is 1.1% [26]. A detailed description of underlying physics is provided in [27].

2.3. Description of Measurement Campaign

The measurements discussed in this work, incorporated the employment of four Kulite XCQ-062 high-response pressure transducers. A single probe abbreviated “I” has been inserted into a vertical-plane slot of the F P 0 station, a pair of transducers (“DA” and “DB”) has been mounted in the corresponding neighbouring slots at the F P 4 and another single probe “OD” has been placed at the volute’s outlet diffuser ( F P o u t ). The positions of the probes are illustrated in Figure 1 (photo), Figure 2a,b.
Probing of absolute lateral vibrations was implemented by placing two accelerometers on the gearbox casing (at the front-bearing area) in vertical and horizontal positions respectively—direct monitoring on the bearing case was restricted by lack of space. It was, however, possible to locate the third (longitudinal) probe on the upper housing of the front bearing. This measurement point will be illustrated later while discussing the measurements’ results.
The optical access for the beam of the laser vibrometer was limited to the region of impeller eye (Figure 2b). The achievement of the desirable angle between the beam and the blade’s surface (90° completely eliminates the interference error) was seriously compromised by blade curvature at inlet. During the measurements, the beam was automatically shifted (step-by-step) through the pre-specified grid. The grid had 165 points and covered the leading edge areas of six consecutive blades (B1, B2, …, B6). Moreover, five points were defined on the front mounting sleeve for comparison with longitudinal accelerometer data.
The full curriculum implied three series of stationary- and transient pressure- and vibration acquisition at n = 4200 rpm ( M u = 0.17 ), n = 5880 rpm ( M u = 0.24 ) and n = 7200 rpm ( M u = 0.29 ) respectively. Commencing with a fully open throttle, each series involved an incremental closure of the valve until the state of aerodynamic stability loss was settled. The entire array of the collected operating points is represented in Figure 3 as a time-averaged pressure ratio performance map. Generally, four distinct regimes were observed: “stable operation”, “local flow instabilities”, “mild surge” and “deep surge”. A complete analysis of these aerodynamic modes has been done in [28] and is not a purpose of this paper. The experimental data acquired at M u = 0.29 , however, will be discussed to demonstrate the excitation-response mechanisms at this maximal test speed and to validate the numerical simulations. The best-efficiency-point mass flow of m ˙ r e f 029 = 0.32   kg / s will be used for reference.

3. Numerical Model

The development of the fluid-flow- (FVM) and structural (FEM) numerical models as well as their successive coupling were conducted in ANSYS Workbench 19.2. ANSYS CFX and ANSYS Mechanical (Application) solvers were selected for FVM- and FEM simulations respectively. ANSYS System Coupling service was used for solver-coupling. The simulations were run on a single node of the institutional cluster (Intel Xeon(R) 2.6 GHz, 20 cores, 256 GB RAM).

3.1. Fluid-Flow Model

The computational domain used in fluid-flow analysis (Figure 4a), was composed of full-annulus rotating- (“Impeller-VLD”) and stationary (“Inlet duct”, “Volute”) sub-domains. The impeller-VLD grid was generated in ANSYS Turbogrid out of hexahedral elements whereas the rest of the mesh was built with ANSYS Meshing using the “tetra-prism” algorithm. Some characteristics of the grid are collected in Table 3.
The size and quality of the final grid were established on the basis of the procedure described in [29]. Three grid resolutions labelled as “coarse (3)”, “medium (2)” and “fine (1)” were initially considered. Direction and magnitude of the absolute velocity vector at VLD inlet were subjected to the grid convergence index assessments as the crucial factors triggering radial diffuser instabilities [6]. GCIs for polytropic head- and internal work input coefficients were additionally evaluated to trend the discretization uncertainties with respect to predictions of the overall stage performance. The resultant grid convergence indices are listed in Table 4. The data correspond to steady-state tasks and to BEP conditions. The convergence is generally monotonous whereas the indices are already below 1% at coarse refinement. The coarse mesh was therefore promoted for further implementation in the coupled model to ensure the CPU times did not exceed three days per revolution.
The simulations were conducted employing the unsteady-RANS method for turbulence modelling. A single impeller revolution was resolved in 256 timesteps with three internal coefficient loops. Initialized by a previously completed steady-RANS session, the unsteady computations ran continuously until the periodically-steady flow pattern was settled. Later on, at least five impeller revolutions were recorded in a periodically-steady state to obtain data for further amplitude-frequency analyses. A very similar approach has been reported in [14] revealing rather satisfying matching between computed and experimentally measured forced-responses.
The boundary conditions imposed at inlet involved the mass flow, the total pressure, eddy viscosity ratio and turbulence intensity. At the discharge, the opening condition with area-averaged static pressure and static temperature was specified. The respective values of the parameters used for validation and implementation are in Table 5. The values used in validation, are with respect to condition referred to as “local flow instabilities” in Figure 3 ( M u = 0.29 ). At the implementation stage, an equivalent regime with diffuser flow characterised by unsteady rotating cells of negative meridional velocity and local drops of static pressure was simulated. The precise set in Table 5 was derived iteratively with intention to model the second stage of a four-stage nitrogen booster at full load. These machines are particularly common for air-separation industry, including the authors’ country.
To increase the accuracy of fluid-flow prediction at impeller discharge, the impeller-VLD interface was omitted modelling both domains in rotating frame of reference and defining the diffuser’s walls as counter-rotating [30]. Hence, the transient rotor-stator (sliding mesh) interfaces were defined respectively at impeller’s inlet and diffuser’s outlet. The transport of turbulence was computed by a standard k ω   SST model with automated wall-function management. For discretization, the “high-resolution” procedure was applied to turbulent- and convective fluxes whereas the second-order backward Euler scheme was selected for temporal derivatives. Pressures, temperatures and velocity components were monitored at 840 points seeded alongside two neighbouring impeller blades (“B1” and “B2” in Figure 2b and Figure 4) and across the whole VLD annulus.

3.2. Structural Model

The material assigned to the structural model had the properties of the original X5CrNi 13-4 (1.4313) steel. The quenched-tempered heat treatment (QT900) was assumed giving the yield-, ultimate- and fatigue strengths of σ y = 900   MPa , σ R = 1000   MPa and σ 1 = 510   MPa respectively. To account for possibilities of operation in plastic deformation region, the bilinear isotropic hardening model [31] was selected with constant tangent modulus of E T = 2 × 10 3   MPa .
The structural computational domain is illustrated in Figure 4b. The computational grid was generated out of approximately 425000 nodes and was locally refined in the vicinities ofthe blades’ leading- and trailing edges to improve the modelling accuracy at higher stress gradients. The grid’s dominating element type was “SOLID187”: a ten-node quadratic structural tetrahedron [31]. Two additional meshes, “medium” (1.7 M nodes) and “fine” (2.5 M nodes), were generated to execute the grid-convergence test. The test assumed absence of any external loads but the centrifugal forces and the rotational speed as at the implementation phase (24300 rpm). It revealed 2–10% increments of total strains, equivalent stresses and rates of plastic deformation at impeller tip each time the mesh resolution was further improved. The available original impeller, on the contrary, lacked any plastic deformations after years of regular industrial service. The reason for this discrepancy is yet unclear, but it could be linked with deficiencies of applied stress-strain relationship. A better fit could have been achieved if the exact constitutive material data were available. To match the limitations in accessible hard-drive memory, it was eventually decided to employ the initial “coarse” FE-grid in the coupled model.
The changes in element stiffness subject to deflections (large deflection model) were accepted, but no numerical stiffness increments (weak springs) were introduced. Simulation of element damping was implemented in the following way: material (Rayleigh) damping ζ M was omitted [32] whereas the effects of aerodynamic damping ζ A were modelled by assigning an initial guess of numerical dissipation of γ = 0.1 . The sensitivity of resultant element strains with respect to ζ A was later checked by an analytic scaling algorithm. The latter will be additionally discussed in the ultimate section.
The wheel’s connection to the shaft was interpreted as a cylindrical support with zero degrees of freedom. The centrifugal loads were applied by specifying the respective rotational speed. The constant pressure loads were defined on the surfaces facing the side cavities. The blades’, hub’s and shroud’s surfaces were treated as fluid-solid interfaces.

3.3. Models’ Coupling

Assuming the structural deformations would not impact the impeller flow pattern significantly, an unidirectional coupling approach was employed, with parameter transfer limited exclusively to static pressures [19]. Compared to bidirectional FSI, this approach is less computationally expensive. The “rigid” fluid grid guarantees no solution interruptions triggered by over-deformed “negative-volume” elements. Its disadvantage, on the other hand, is an exclusion of direct simulation of aero-damping effects. At resonant points, the latter is known to have a crucial impact on both average and dynamic strain [7]. In this work, however, none of the reported regimes (neither at validation, nor at implementation) was resonant, which yielded the use of unidirectional coupling as sufficient.
Three solver-coupling iterations were completed at each timestep. The blade surface data exchange was organized in an “individual” fashion by specifying fifteen separate “blade-to-blade” transfers, which ensured satisfactory mesh mapping.

4. Experimental Results

4.1. Rotor Excitation and Response at M u = 0.29

Fluctuating components of static pressure p f l u c t measured at four throttling rates, from BEP ( m ˙ / m ˙ r e f 029 = 1.00 ) to deep surge ( m ˙ / m ˙ r e f 029 = 0.37 ), are shown in Figure 5. The temporal traces are supplied with Fast-Fourier spectra.
The BEP-signals are dominated by 156-Hz spectral peaks, with exception to the outlet diffuser (“OD”). The maximal amplitudes are observed in VLD (gauges “DA”, “DB”) and exceed those at impeller eye (“I”) by a factor of 3.7. The presence of these peaks was re-confirmed by an additional repeatability-test. In attempt to reveal the underlying phenomenon, these three signals were subjected to a cross-correlation procedure in MATLAB, which did not return any reasonable phase lags. On the other hand, the 156 Hz peaks were not so distinctly observed at the rest of the stable operating points (e.g., at m ˙ / m ˙ r e f 029 = 0.85 , Figure 5b) and do not represent an engine-order harmonic ( f E O 1 = 120   Hz ). A crossing of an acoustic resonance was therefore hypothesised.
Acoustic excitations in the ducts and cavities of centrifugal compressors have been systematically studied and reported since the 1990s [33]. The work [34] claimed the inducer rotating instability and rotor-stator interaction to be respectively responsible for narrow-band “humps” (at certain frequencies below BPF) and tonal peaks (at BPF) observed on sound pressure spectra at subsonic flow regimes. The noise radiating from co-existing impeller progressive- and vaneless diffuser rotating stall was experimentally studied in [35]. The former was associated with amplitude humps at 0.5 × f E O 1 , the latter—with similar weaker modes at 0.2 × f E O 1 . In absence of stationary vanes and flow instabilities, as at m ˙ / m ˙ r e f 029 = 1 , tonal noise is only radiated from blade vortex shedding [36]. It is known that this source may resonate with impeller side-cavities [36], inter-blade channels (Parker modes) [37] and scroll ducts [38]. The concerned frequency of 156 Hz, however, is too low to be associated with either a side-cavity- or a Parker mode whose representative eigenfrequencies (in centrifugal compressors) should be higher by at least one order of magnitude [36,37]. The discussed peaks at m ˙ / m ˙ r e f 029 = 1 could therefore only reflect the response of the volute or the entire duct.
To detect the potential resonant modes, an additional finite-element modal acoustic analysis of the complete compression duct (including side cavities and pipelines) has been performed. The third ( f n A 3 = 120   Hz ) and the fourth ( f n A 4 = 176   Hz ) computed eigenmodes (Figure 6b,c) were found in the close proximity of the experimentally observed peaks at 156 Hz (Figure 5a). The shape of the n A 3 is in better agreement with the experiment since the whole stage acts as a single pressure antinode. The amplitude reaches the maxima in the VLD and in the scroll, then weakens in the OD and eventually approaches the node in the discharge elbow. On the contrary, the elbow hosts an antinode at the n A 4 and the strongest amplitudes are settled in the outlet pipe. The latter is in conflict with data in Figure 5a.
Based on the above, it is believed that 156 Hz modes at m ˙ / m ˙ r e f 029 = 1 should have been invoked through the resonant coupling between the tonal noise source (trailing edge wake vortices) and the receiver (VLD and volute). A thorough assessment of this belief, however, requires a not yet available method for estimation of characteristic Strouhal numbers at exits of centrifugal compressor impellers [36].
The spectra at m ˙ / m ˙ r e f 029 = 0.47 (“stability limit”) are rather flat. Subsequent throttling the compressor to m ˙ / m ˙ r e f 029 = 0.37 results in immediate surging (Figure 5d). All signals manifest the presence of 10-Hz fluctuation mode with prevailing amplitude. In addition, any phase shifts between the signals are absent, which was confirmed by the aforementioned cross-correlation procedure. Summarising, the Fourier transformations at M u = 0.29 proclaim abrupt deep surge inception without any VLD-associated transitional regime in-between (e.g., diffuser stall [39]). As will be shown below, the continuous wavelet transformation analysis reconfirms this scenario.
The results of the rotor structural response measurements are compiled in Figure 7. The vibration velocities are presented in frequency domain for an identical set of operating states as in Figure 6. The map (a) refers to the absolute longitudinal vibrations recorded at the front bearing casing by the accelerometer. The measurement point is highlighted in the attached photograph. The vibrometer data are in the map (b) and maps (c)–(f) respectively for a point on rotation axis (AoR) and for four individual blade-based points (“B1”–“B4”, see Figure 2b).
The accelerometer results reveal four distinguishable frequencies. The highest amplitudes are reached at the frequency of f E O 1 = 120   Hz and are the consequences of residual unbalance. Another group of peaks at 72 Hz signalizes the mechanical wear of front cylindrical bearing. At deep surge ( m ˙ / m ˙ r e f 029 = 0.31 ), the spectrum contains a 10 Hz forced-response component one order of magnitude weaker in comparison with the rotor unbalance. Finally, the 914-Hz stems show moderate amplitude growth regardless of the operating regime. The origin of the latter is yet unclear and might be referred to natural vibrations of the upper bearing clamp.
To a reasonable rate, the vibrometer spectra collected at machine’s axis (Figure 7b) display a qualitative replication of the pattern described above, though significantly amplified and with no signs of 10- and 914-Hz modes. The amplification effect is a consequence of the residual misalignment between compressor and derotator. It is, therefore, decided to scope exclusively on qualitative aspects of these data.
At blades, the misalignment is superimposed by reasonably sharp angles between the laser beam and blades’ surfaces, as mentioned earlier. This results in erroneously high stems at 72 Hz, f E O 1 , 2 × f E O 1 and in overall noise increase. Nevertheless, these measurements show two important trends from viewpoint of numerical model validation:
(1)
The lack of any noticeable deviations in amplitudes between the blades implies a zero phase lag forced-vibration mode.
(2)
The absence of any eigenfrequency-related peak means no aero-interaction resonance [7] crossings within surge-preceding operating range.
Identification of the second trend required an execution of a supplementary modal structural simulation. Its most crucial results are listed in Table 6 for the fundamental family of disk-dominated modes. The shapes of the third (OND) and the first (1ND) eigenmodes are illustrated in Figure 8.

4.2. Validation of Numerical Model

Time-averaged values of the pressure ratios predicted by unsteady simulations at the nominal point ( m ˙ / m ˙ r e f 029 = 1 ) and the stability limit ( m ˙ / m ˙ r e f 029 = 0.47 ) have been shown in Figure 3 along with the measured values. The modelling accuracy reaches maximum at the BEP where the relative deviation with experiment is 0.3%. Even though the parasitic losses in side-cavities are ignored in the model, this level of agreement is seen as reasonably high, which implies the friction losses are computed correctly. The latter, however, cannot be applied to the incidence losses with the same confidence as at m ˙ / m ˙ r e f 029 = 0.47 the deviation approaches 1%.
Further focus of validation is on assessment of the model’s relevance in forecasting the flow-related sources of excitations at close-to-surge condition. For this purpose, the numerical and experimental signals of unsteady static pressure were submitted to continuous wavelet transformations using the 12-cycle Morlet wavelets. The resultant scalograms are shown in Figure 9 and refer to locations of high-frequency pressure transducers explained earlier.
The experimental scalograms reveal the presence of four excitation frequencies labelled as “pressure modes” PM1–PM4. The numerical model reflects the presence of PM1 and PM4, but completely eliminates the PM2 and PM3. The measured and modelled signals (alike their CWTs) lack any noticeable time-lags with respect to location of a gauge or a monitor point. The latter again implies that vaneless diffuser rotating stall (RS) known for its circumferentially travelling lobes at subsynchronous speeds [40,41] has not yet settled. Indeed, the fundamental works [41,42] have shown that a moderate-width, low-radius-ratio vaneless diffuser followed by a scroll and receiving the flow at low Mach numbers may not stall until the very surge onset.
In the absence of VLD RS, the pressure modes in Figure 9 should indicate either impeller-, volute- or entire duct-related phenomena. An attempt to interpret these trends follows below. The exact values of experimental excitation frequencies are based on the large-window (25 s) FFT data.
PM1 ( f P M 1   e x p 87   Hz ) is the only excitation to exist inside the subsynchronous range. Its measured signatures are equally strong at impeller inlet and in VLD, but vanish in outlet diffuser. The value of f P M 1   e x p is in 99% match with the second acoustic natural frequency of the duct (Figure 6a). It would be therefore logical to suggest that the measured instances of PM1 represent the response of the n A 2 to some source. The source is suspected to be the shear layer broadband noise amplified by high incidence at the leading edge, which is based on the findings in [43]. Its more exact definition requires a separate research. In the simulations, the frequency of this mode is 13% higher ( f P M 1   n u m 98   Hz ) and can be solely linked to the source itself (the acoustic response is obviously out of the model’s scope). The inspection of the flowfield reveals the source is the multi-lobe circumferential pressure disturbance just upstream the leading edge (see Figure 9(e1)). The disturbance is believed to be triggered by the intense incidence-caused flow separation at impeller throat.
The modes PM2 ( f P M 2   e x p 181   Hz ) and PM3 ( f P M 3   e x p 369   Hz ) are again in close proximity to the fourth ( f n A 4 = 176   Hz ) and the eighth ( f n A 8 = 340   Hz ) predicted acoustic eigenfrequencies of the system (Figure 6c,d). The mode n A 8 is characterised by a single nodal line crossing the volute and the VLD. The latter could justify the scattering of PM3 at the “DB” gauge in the case the transducer appeared closer to- or at the node. In addition, the assignment of these pressure modes to the natural acoustic response may explain their absence in numerical predictions.
The measured frequency of PM4 ( f P M 4   e x p 616   Hz ) matches the seventeenth ( f n A 17 = 615   Hz ) FEM-estimated acoustic eigenmode with two nodal lines (Figure 6e). Its signature is the strongest at “DA”, then scatters reasonably at “DB” and is barely noticeable outside the VLD (gauges “I”, “OD”). This is a good shape-correlation with n A 17 too. The computed frequency of this mode ( f P M 4   n u m 601   Hz ) is underestimated by 2.5%. Its amplitude has been found to maximize in immediate vicinity of the volute’s tongue where the flow separates in volute because of the incidence (Figure 9(e2)). The separation bubble thickness h is close to 10 mm whereas the flow approaches the tongue at averagely c t o n g u e = 27   m / s . Applying the methodology proposed in [44], the bubble-thickness-based Strouhal number S t h = f P M 4   n u m × h c t o n g u e yields 0.22. In [44], S t h = 0.2 was shown to characterise the vortex shedding of “deep airfoil stall” at low Mach numbers. It is therefore deduced that f P M 4   n u m is an indicator of vortex shedding frequency at tongue separation area.
Summarizing, the developed finite-volume fluid model may be validated against the available measured data only to a limited extent. It correctly predicts the compressor aerodynamic performance at the nominal point ( m ˙ / m ˙ r e f 029 = 1 ) and manages to indicate the absence of VLD RS at M u = 0.29 . On the other hand, it underestimates the incidence losses at m ˙ / m ˙ r e f 029 = 0.47 . It eventually suggests two sources of the incidence-induced sound at the impeller throat and the volute tongue, which could not yet be verified due to instrumentation limitations.
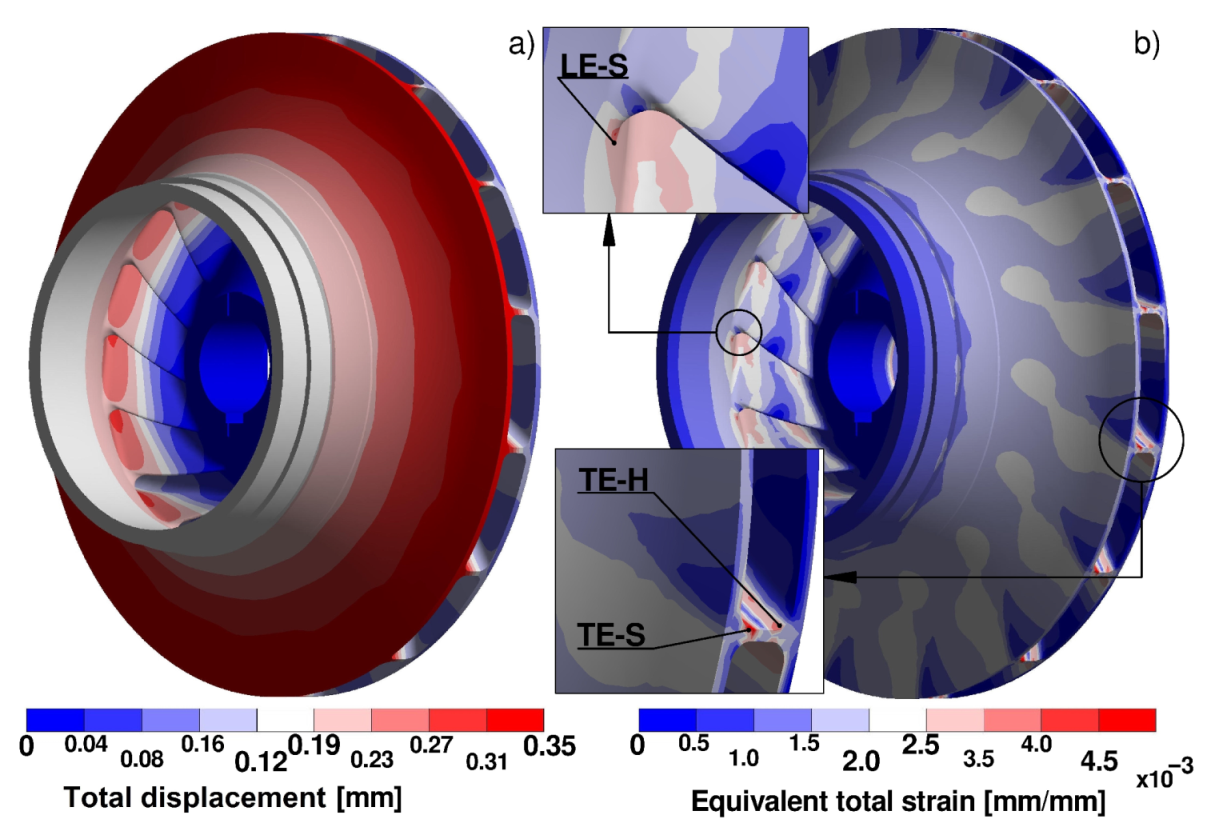
The results of the coupled FE structural simulations are in satisfactory fit with the measurements should the aforementioned vibrational data boundaries be assumed. The experimentally detected and the computed (Figure 9f) response modes at m ˙ / m ˙ r e f 029 = 0.47 are alike free of nodal diameters, circles or other phase-lag indicators. The maximal numerically obtained amplitude of total nodal displacement was 2.5 × 10 4   mm or 0.7% of the time-average maximum. The latter obviously implies a steady-state non-resonant response, which was likewise observed at the test-rig. The quantitative validation of structural simulations remains a task too complex for the present experimental layout. It effectively requires a set of dynamic strain gauges mounted on rotating impeller and a telemetry system [13,15] both of which are yet unavailable.
In conclusion, the model’s relevance is rather assessed as a compromise between accuracy and CPU/hard-drive load. Its ability to correctly describe the vaneless diffuser flow behaviour at aerodynamic stability limit (acoustics abandoned) is seen as the main merit to justify its further implementation.

5. Numerical Results

5.1. Analysis of Local Flow Disturbances

The impeller excitation mechanism at low flow, M u = 0.93 and p o u t = 2 × 10 6   Pa will be interpreted using instantaneous contour-plots of static pressure in Figure 10. Two separate colourbars are implemented to distinguish between pressure gradients at the eye (effectively at throat) and at VLD. The constant-span control surfaces are at 90%- and 10% of the channel height respectively.
The interaction between the flow at vaneless diffuser outlet and volute tongue generates the largest circumferential pressure disturbance which is abbreviated as “tongue cell” (TC). In [45], the rate of pressure drop in this cell was controlled by amount of unsteady separation downstream the tongue (similar to the one observed at the validation phase). However, as seen from the overlayed absolute velocity vectors in Figure 10, the separation does not occur. The pressure depression is rather a consequence of local flow acceleration triggered by two contracting mass flows: a portion of “fresh” mass delivered from VLD (a) and a recirculating portion returning from the upstream volute at low flow angle (b). The resultant stationary cell covers averagely 130° of azimuthal coordinate and should be a source of EO1 excitations. Moreover, TC significantly impacts the shroud-adjacent flow at impeller throat intensifying the flow separation at suction side. A very similar pattern has been also reported in [14] for a turbocharger stage of a comparable size with exception to the flow at throat which was optimized by a casing bleed system.
The trend of circumferential pressure disturbance at region not covered by the tongue cell (first and second quadrants), manifests the presence of several co-rotating stall cells abbreviated as “diffuser cells” (DC). The analysis of pressure- and velocity fields in this area uncovers several details:
(1)
The instantaneous number of formed diffuser cells is unsteady, but is either three or four.
(2)
The angular velocity of the cells is at fairly stable level of 0.43 × ω r o t in quadrant II with gradual increment up to 0.52 × ω r o t in quadrant III.
(3)
The character of circumferential pressure non-uniformity in VLD is not a representative of a “classic” low-lobe-number (one or two), low-angular-velocity ( 0.1 × ω r o t ÷ 0.2 × ω r o t ) and rigid-body-like VLD RS (one of its best representatives has been recently reported in [40] for an intermediate stage type). The volute’s axial asymmetry significantly alters the diffuser stall mechanism. The cells emerge and collapse along the annulus, their number and angular speed rise. As concluded in [46], such change would typically weaken the negative impact of VLD RS on the rotor dynamics.
The listed trends are in a very good correspondence with observations published in [47]. From the structure-interaction viewpoint, the above implies that the impeller would receive from one to two additional excitations per revolution subject to its interaction with the DCs. In overall, the observed vaneless diffuser flow field should induce the excitation modes from EO1 to EO3.
The first, second and third engine-orders are in fact dominating the CWT-scalograms of static pressure fluctuations in the wheel if computed in rotating frame of reference (Figure 11). This dominance is particularly obvious at trailing edge (b). At leading edge (c) and at mid-passage (d), however, the contribution of EO4 is equally evident. The mode is promoted by the earlier-mentioned intense separation at throat.

5.2. Analysis of Impeller’s Structural Response

The instantaneous distributions of total displacement (a) and equivalent total strain (b) in impeller are shown in Figure 12. The plots represent the final time-frame of the coupled run at implementation phase. The dynamics of deformation at areas with the highest displacement amplitudes are illustrated in Figure 13. The nodal temporal traces and their CWT-scalograms are intentionally given for two consecutive blades (B1, B2) to identify possible deviations in phase or magnitude.
The simulations reach the periodically stable state after 2.8 revolutions, which is achieved by running the structural solver without time-integration at several initial iterations. Such approach effectively introduces a static pre-stress condition and, thus, significantly accelerates the convergence.
The response mode is the “umbrella” with zero nodal lines. The scalograms in Figure 13 are prevailed by amplitude peaks lying in close coincidence with the third disk mode of natural vibrations defined by frequency of 2548 Hz and zero nodal diameters (see Table 6 and Figure 8a). Suspicion of aero-interaction resonance, however, must be eliminated. The interference diagrams computed following Singh’s methodology [48] detected no possible frequency-shape matches of this mode with any engine-order (Figure 14). It is therefore referred to undamped numerical noise. On the other hand, the impact of forced-vibrations is likewise present. The strongest response is in the case of the fundamental engine-order (EO1): the peaks are clearly distinct at hub disk at trailing edge (b), at mid-passage (c) and at leading edge (d). The magnitude of EO4 is equally high at impeller outlet, but diminishes at lower radii, as do the average displacements. The vibrations at EO2 are the weakest and exhibited solely at TE.
The maxima of equivalent total strain are found at both “blade-disk” fillets at trailing edge and at shroud fillet at leading edge (Figure 12b). The assessment of resistance to high-cycle fatigue was therefore applied to the latter regions abbreviated as “TE-S(H)” and “LE-S” respectively. Goodman-Haigh model of constant fatigue life was implemented since its accuracy had been reported as sufficient in similar works [19]. Amplitudes of dynamic strain ϵ a were estimated based on CWT-scalograms equivalent to those in Figure 13. Solely EO1 forced-vibration modes were considered. Employing the SDOF model of damped forced vibrations [32] the strain amplitudes were scaled up to 5% damping ratio [19] at f n = 1513   Hz (see Table 6 and Figure 8b), but no sensitivity was found due to low ratio of f E O 1 / f n = 0.27 . Corresponding values of mean ( σ m ) and dynamic ( σ a ) stresses were then obtained from assumed model of stress-strain curve. Finally, the Goodman-Haigh diagrams were analysed at three critical locations and the factors of safety s were derived. The results are grouped in Table 7 for initially assumed 10% total damping.
Even though the safety-factors proclaim high probability of fatigue failure, the contribution of fluid-induced dynamic loads is negligible. The mean stresses caused by static centrifugal loads are severely high and even reach slightly beyond the material yield strength of σ y = 900   MPa at “TE-S”. The latter, however, must be an overprediction since the original impeller experienced no mechanical failures during years of continuous service at prescribed rotational speed, as aforementioned. Identification of reason for the overprediction, requires an additional study with a more complex material stress-strain model. It should be additionally stressed that the analysed tip speed of u 2 , M u = 0.93 = 337 m/s represents a challenge for static strength of a stainless-steel-manufactured shrouded wheel. To the best authors’ knowledge, the number of relevant and openly published studies offering proper stress-strain correlations for these objects is yet very low.

6. Conclusions

The forced-response of a medium flow-coefficient centrifugal impeller has been studied at close-to-surge condition. The research campaign has been implemented both experimentally and numerically. The test-rig data received at lower speed yielded the basis for validation of the coupled numerical model. The latter was then “implemented” to reproduce operating loads common to process industry. The most crucial findings of the work are summed up below.
  • The unsteady flow measurements at M u = 0.29 showed no signs of rotating stall in the vaneless diffuser up to the very inception of deep surge. The detected modes of static pressure fluctuations were referred to the natural acoustic spectrum of the entire duct. The source for their excitation was suspected to be the impeller-incidence-induced shear layer broadband noise and the trailing edge vortex shedding.
  • Quality of vibratory response laser measurements was significantly compromised by high blade curvature at impeller inlet resulting in falsely high measured amplitudes of rotor speed harmonics. These data identified a non-resonant condition and a zero nodal diameter response mode. The coupled FE simulations returned the same result.
  • Validation of the coupled numerical model revealed its “strengths” and “weaknesses”. Prediction of friction losses, reproduction of rotating stall absence in vaneless diffuser (at M u = 0.29 ) were the former. Estimation of the incidence losses along with the implemented model of stress-strain constitutive relation were the latter.
  • At implementation phase, the predicted flow in vaneless diffuser was characterised by several co-rotating and a single stationary stall cells. The latter emerged from two contracting flows (fresh-feed flow and recirculating flow) at volute tongue and was a primary source of impeller excitation at the first engine-order.
  • The impeller response mode was dominated by EO1 vibrations at implementation phase. The amount of dynamic stress induced by these vibrations, was marginal from viewpoint of constant fatigue life assessment.

Author Contributions

Conceptualization, K.K.; methodology, K.K.; validation, K.K.; formal analysis, K.K., A.J.; investigation, K.K.; resources, M.K., T.S., R.P.; data curation, K.K., A.J.; writing—original draft preparation, K.K.; writing—review and editing, K.K., A.J., M.K., G.L., T.S., R.P.; visualization, K.K.; funding acquisition, G.L. All authors have read and agreed to the published version of the manuscript.

Funding

This research was funded by Polish National Centre for Research and Development (Narodowe Centrum Badań i Rozwoju), Grant No Lider/447/L-6/14/NCBR/2015.

Acknowledgments

The authors would like to thank B. Pawłowski for designing and implementing the electronic synchronizing interface between the compressor drive and the optical derotator. Words of gratitude are also addressed to L. Horodko for providing a versatile software for signal analysis.

Conflicts of Interest

The authors declare no conflict of interest. The funders had no role in the design of the study; in the collection, analyses, or interpretation of data; in the writing of the manuscript, or in the decision to publish the results.

Abbreviations

The following abbreviations are used in this manuscript:
Latin
AoRAxis of rotation
BEPBest efficiency point
BPFBlade-passing frequency
cabsolute flow velocity
c 2   a v e Mass-flow averaged absolute velocity at vaneless diffuser inlet
CFDComputational fluid dynamics
C-RCounter-rotating
CPUCentral processing unit
CSMComputational structural mechanics
CWTContinuous wavelet transform
DCDiffuser cell
e a Approximate relative error [29]
EOEngine-order
ERExpansion ratio
fFrequency (Hz)
FE(M)      Finite-element (method)
FPGAField-programmable gate array
FSIFluid-structure interaction
FVMFinite-volume method
G C I Grid convergence index [29]
hthickness of the boundary layer separation bubble [44]
ITurbulence intensity (-)
LELeading edge
m ˙ Mass flow rate (kg/s)
M u Tip speed-based Mach number (-)
nImpeller rotational speed (rev/min)
NTotal number of grid cells [29]
NDNodal diameter
OEMOriginal equipment manufacturer
pPressure (Pa)
PCPersonal computer
PMPressure mode (mode of static pressure fluctuations)
PSPressure side
rGrid refinement factor [29]
RSRotating stall
RTDResistive temperature detector
SDOFSingle degree of freedom
SSTShear-stress transport
TTemperature (K)
TCTongue cell
TETrailing edge
URANSUnsteady Reynolds-averaged Navier-Stokes
VLDVaneless diffuser
Greek
α 2   a v e Mass-flow averaged absolute flow angle at vaneless diffuser inlet
(with respect to tangential direction, deg)
β b l 2 Impeller blade angle at outlet (with respect to tangential direction, deg)
ϵ Mechanical strain (-)
μ / μ T Eddy viscosity ratio (-)
Π Flange-to-flange pressure ratio of compressor (-)
σ Mechanical stress (MPa)
Ψ i Internal work input coefficient h i / u 2 2 (-)
ψ p   0 4 Polytropic head coefficient evaluated between impeller inlet and
vaneless diffuser outlet (-)
ω r o t Rotor angular frequency (rad/s)
Subscripts
desrefers to design point
exprefers to experimental measurements
fluctfluctuating component
atmatmospheric
outoutlet
aalternating
mmean
nrefers to natural vibrations
numrefers to numerical simulations

References

  1. Chemicals; IEA: Paris, France, 2020; Available online: https://www.iea.org/reports/chemicals (accessed on 20 March 2021).
  2. Hazby, H.; Casey, M.; Robinson, C.; Spataro, R.; Lunacek, O. The design of a family of process compressor stages. In Proceedings of the 12th European Conference on Turbomachinery Fluid Dynamics and Thermodynamics, ETC 2017, Stockholm, Sweden, 3–7 April 2017. [Google Scholar]
  3. Dalbert, P.; Casey, M.V.; Schurter, E. Development, testing, and performance prediction of radial compressor stages for multistage industrial compressors. J. Turbomach. 1988, 110, 283–292. [Google Scholar] [CrossRef]
  4. Galerkin, Y.B.; Semenovskiy, V.B.; Soldatova, K.V. Creating model stages of centrifugal compressor based on experimental data. AIP Conf. Proc. 2019, 2141, 030026. [Google Scholar]
  5. Galerkin, Y.; Rekstin, A.; Soldatova, K.; Drozdov, A.; Solovyeva, O.; Semenovskiy, V.; Marenina, L. The Current State of the Engineering Method for the Optimal Gas-Dynamic Design and Calculation of Centrifugal Compressor. Energies 2020, 13, 5651. [Google Scholar] [CrossRef]
  6. Aungier, R. Centrifugal Compressors: A Strategy for Aerodynamic Design and Analysis; ASME Press: New York, NY, USA, 2000. [Google Scholar]
  7. Kushner, F.; Shurina, J.; Strickland, R.A. Rotating Component Modal Analysis and Resonance Avoidance—An Update. In Proceedings of the 42nd Turbomachinery Symposium, Houston, TX, USA, 1–3 October 2013; Texas A & M University, Turbomachinery Laboratories: College Station, TX, USA, 2013. [Google Scholar]
  8. API Standard 617, Axial and Centrifugal Compressors and Expander-Compressors; API Publishing Services: Washington, DC, USA, 2014.
  9. Gravdahl, J.T.; Egeland, O. Compressor surge control using a close-coupled valve and backstepping. In Proceedings of the American Control Conference, Albuquerque, NM, USA, 4–6 June 1997. [Google Scholar]
  10. Gravdahl, J.T.; Willems, F.; de Jager, B.; Egeland, O. Modelling of surge in free-spool centrifugal compressors: Experimental validation. J. Propuls. Power 2004, 24, 849–857. [Google Scholar] [CrossRef] [Green Version]
  11. Simon, J.S.; Valavani, L.A. Lyapunov based nonlinear control scheme for stabilizing a basic compression system using a close-coupled control valve. In Proceedings of the American Control Conference, Boston, MA, USA, 26–28 June 1991. [Google Scholar]
  12. Liskiewicz, G.; Kabalyk, K.; Jaeschke, A.; Grapow, F.; Kulak, M.; Kryllowicz, W.; Ouyang, H.; Shen, X. Experimental Analysis of Surge-Detection System Based on Pressure Derivatives at Part-Speed Operation. ASME. J. Eng. Gas Turbines Power 2021, 143, 051018. [Google Scholar] [CrossRef]
  13. Haupt, U.; Rautenberg, M. Blade Vibration Measurements on Centrifugal Compressors by Means of Telemetry and Holographic Interferometry. ASME. J. Eng. Gas Turbines Power 1984, 106, 70–78. [Google Scholar] [CrossRef]
  14. Dickmann, H.-P.; Wimmel, T.S.; Szwedowicz, J.; Filsinger, D.; Roduner, C.H. Unsteady Flow in a Turbocharger Centrifugal Compressor: Three-Dimensional Computational Fluid Dynamics Simulation and Numerical and Experimental Analysis of Impeller Blade Vibration. ASME J. Turbomach. 2006, 128, 455–465. [Google Scholar] [CrossRef]
  15. Jenny, P.; Bidaut, Y. Experimental Determination of Mechanical Stress Induced by Rotating Stall in Unshrouded Impellers of Centrifugal Compressors. ASME. J. Turbomach. 2017, 139, 031011. [Google Scholar] [CrossRef]
  16. Mischo, B.; Jenny, P.; Mauri, S.; Bidaut, Y.; Kramer, M.; Spengler, S. Numerical and experimental fluid-structure interaction-study to determine mechanical stresses induced by rotating stall in unshrouded centrifugal compressor impellers. ASME J. Turbomach. 2018, 140, 111006. [Google Scholar] [CrossRef]
  17. Mischo, B.; Jenny, P.; Bidaut, Y.; Fonzi, N.; Hermann, D.; Wirsum, M.C. Experimental Investigation for Enhanced Control of Rotating Unsteady Flow Instabilities in an Unshrouded Centrifugal Compressor Impeller. ASME. J. Turbomach. 2020, 142, 011001. [Google Scholar] [CrossRef]
  18. Tyler, J.; Sofrin, T. Axial flow compressor noise studies. SAE Trans. 1961, 70, 309–332. [Google Scholar]
  19. Lerche, A.; Moore, J.J.; White, N.M.; Hardin, J. Dynamic stress prediction in centrifugal compressor blades using fluid-structure interaction. In Proceedings of the ASME Turbo Expo 2012, Copenhagen, Denmark, 11–15 June 2012. [Google Scholar]
  20. Degendorfer, C.; Abhari, R.S.; Vogel, K.; Hunziker, R. Experimental and numerical investigation of blade resonance in a centrifugal compressor for varying gas properties. J. Glob. Power Propuls. Soc. 2018, 2, 415–428. [Google Scholar]
  21. Mao, Y.; Qi, D.; Xu, Q. Fatigue Analysis and Lifetime Estimation of Centrifugal Compressor Impeller Blades. In Proceedings of the ASME Turbo Expo 2009, Orlando, FL, USA, 8–12 June 2009. [Google Scholar]
  22. ISO 5801:2017, Fans-Performance Testing Using Standardized Airways; International Standard, ISO/TC117; ISO: Geneva, Switzerland, 2017.
  23. Kulite Semiconductor Products, Inc. Available online: https://kulite.com//assets/media/2018/01/XCQ-062.pdf (accessed on 11 March 2021).
  24. PCB Piezotronics, Inc. Available online: https://www.pcb.com/products?m=603C01 (accessed on 11 March 2021).
  25. Evaluation of Measurement Data—Guide to the Expression of Uncertainty in Measurement. JCGM100:2008; Bureau International des Poids et Mesures: Paris, France, 2008.
  26. Polytec Scanning Vibrometer PSV-500. Hardware Manual; Polytec GmbH: Waldbronn, Germany, 2012.
  27. Boedecker, S.; Draebenstedt, A.; Heller, L.; Kraft, A.; Leonhardt, A.; Pape, C.; Ristau, S.; Reithmeier, E.; Rembe, C. Optical derotator for scanning vibrometer measurements on rotating objects. In Proceedings of the Seventh International Conference on Vibration Measurements by Laser Techniques: Advances and Applications, SPIE 6345, Ancona, Italy, 19–22 June 2006. [Google Scholar]
  28. Liśkiewicz, G.; Kabalyk, K.; Jaeschke, A.; Grapow, F.; Kulak, M.; Stajuda, M.; Kryłłowicz, W. Unstable flow structures present at different rotational velocities of the centrifugal compressor. Energies 2020, 13, 4146. [Google Scholar] [CrossRef]
  29. Celik, I.B.; Ghia, U.; Roache, P.J. Procedure for estimation and reporting of uncertainty due to discretization in CFD applications. J. Fluids Eng. 2008, 130, 078001. [Google Scholar]
  30. Kabalyk, K.; Kryllowicz, W. Influence of definition of impeller-vaneless diffuser boundary on physical validity of numerical simulations of viscid flow in the vaneless diffuser of a centrifugal compressor: A short review of case studies. AIP Conf. Proc. 2017, 1889, 020015. [Google Scholar]
  31. Zienkiewicz, O.C.; Taylor, R.L.; Fox, D. The Finite Element Method for Solid and Structural Mechanics, 7th ed.; Butterworth-Heinemann: Oxford, MA, USA, 2014; pp. 75–145. [Google Scholar]
  32. Kammerer, A.; Abhari, R. Experimental Study on Impeller Blade Vibration During Resonance—Part 2: Blade Damping. ASME. J. Eng. Gas Turbines Power 2009, 131, 022509. [Google Scholar] [CrossRef]
  33. Lawless, P.B.; Fleeter, S. Rotating Stall Acoustic Signature in a Low-Speed Centrifugal Compressor: Part 1—Vaneless Diffuser. ASME J. Turbomach. 1995, 117, 87–96. [Google Scholar] [CrossRef]
  34. Raitor, T.; Neise, W. Sound generation in centrifugal compressors. J. Sound Vib. 2008, 314, 738–756. [Google Scholar] [CrossRef]
  35. Kabral, R.; Åbom, M. Investigation of turbocharger compressor surge inception by means of an acoustic two-port model. J. Sound Vib. 2018, 412, 270–286. [Google Scholar] [CrossRef]
  36. Koenig, S.; Petry, N.; Wagner, N. Aeroacoustic phenomena in high-pressure centrifugal compressors—A possible root cause for impeller failures. In Proceedings of the Thirty-Eighth Turbomachinery Symposium, Houston, TX, USA, 14–17 September 2009; Texas A & M University, Turbomachinery Laboratories: College Station, TX, USA, 2009; pp. 103–122. [Google Scholar]
  37. Koenig, S.; Petry, N. Parker-Type Acoustic Resonances in the Return Guide Vane Cascade of a Centrifugal Compressor—Theoretical Modelling and Experimental Verification. ASME J. Turbomach. 2012, 134, 061029. [Google Scholar] [CrossRef]
  38. Ziada, S.; Oengoeren, A.; Vogel, A. Acoustic resonance in the inlet scroll of a turbo-compressor. J. Fluids Struct. 2002, 16, 361–373. [Google Scholar] [CrossRef]
  39. Japikse, D. Stall, stage stall, and surge. In Proceedings of the Tenth Turbomachinery Symposium, USA; Texas A & M University, Turbomachinery Laboratories: College Station, TX, USA, 1981. [Google Scholar]
  40. Bianchini, A.; Biliotti, D.; Rubino, D.T.; Ferrari, L.; Ferrara, G. Experimental Analysis of the Pressure Field Inside a Vaneless Diffuser From Rotating Stall Inception to Surge. ASME J. Turbomach. 2015, 137, 111007. [Google Scholar] [CrossRef]
  41. Frigne, P.; van den Braembussche, R. Distinction Between Different Types of Impeller and Diffuser Rotating Stall in a Centrifugal Compressor With Vaneless Diffuser. ASME J. Eng. Gas Turbines Power 1984, 106, 468–474. [Google Scholar] [CrossRef]
  42. Senoo, Y.; Kinoshita, Y. Limits of Rotating Stall and Stall in Vaneless Diffuser of Centrifugal Compressors. In Proceedings of the ASME Gas Turbine Conference and Products Show, London, UK, 9–13 April 1978. [Google Scholar]
  43. Hellmich, B.; Seume, J.R. Causes of Acoustic Resonance in a High-Speed Axial Compressor. ASME J. Turbomach. 2008, 130, 031003. [Google Scholar] [CrossRef]
  44. Moreau, S.; Roger, M.; Christophe, J. Flow Features and Self-Noise of Airfoils Near Stall or in Stall. In Proceedings of the 15th AIAA/CEAS Aeroacoustics Conference, Miami, FL, USA, 11–13 May 2009. [Google Scholar]
  45. Hellström, F.; Gutmark, E.; Fuchs, L. Large Eddy Simulation of the Unsteady Flow in a Radial Compressor Operating Near Surge. ASME J. Turbomach. 2012, 134, 051006. [Google Scholar] [CrossRef]
  46. Biliotti, D.; Bianchini, A.; Vannini, G.; Belardini, E.; Giachi, M.; Ferrari, L.; Ferrara, G. Analysis of the Rotordynamic Response of a Centrifugal Compressor Subject to Aerodynamic Loads Due to Rotating Stall. ASME J. Turbomach. 2015, 137, 021002. [Google Scholar] [CrossRef]
  47. Niu, Z.; Sun, Z.; Wang, B.; Zheng, X. Effects of Non-Axisymmetric Volute on Rotating Stall in the Vaneless Diffuser of a Centrifugal Compressor. In Proceedings of the ASME Turbo Expo 2020: Turbomachinery Technical Conference and Exposition. Volume 2E: Turbomachinery, Online, 21–25 September 2020. [Google Scholar]
  48. Singh, M.P.; Thakur, B.K.; Sullivan, W.E.; Donald, G. Resonance Identification for Impellers. In Proceedings of the 32nd Turbomachinery Symposium; Texas A & M University, Turbomachinery Laboratories: College Station, TX, USA, 2003. [Google Scholar]
Figure 1. Layout scheme of the experimental rig.
Energies 14 04292 g001
Figure 2. Internal view of diffuser shroud with pressure transducers “DA” and “DB” (a); magnification of impeller eye area with definition of blade-counting relatively to the angular location of the key (b); general view of PSV-500 vibrometer-based measurement suite (c).
Energies 14 04292 g002
Figure 3. Dependences of static-to-static pressure ratios on the normalized mass flow rate measured at three subsequent peripheral Mach numbers. The simulated values are shown for the purpose of numerical model validation and are discussed in the corresponding section.
Energies 14 04292 g003
Figure 4. Finite-volume- (a) and finite-element (b) domains used in fluid- and structural simulations respectively, with highlighted grids.
Energies 14 04292 g004
Figure 5. Experimental traces of static pressure in temporal- (left column) and frequency (right column) domains at stable operation (a,b), at stability limit (c) and at deep surge (d).
Energies 14 04292 g005
Figure 6. Modes of acoustic natural vibrations returned by a supplementary modal acoustic FE-analysis. (ac): 2nd to 4th modes with zero nodal lines in volute, (d,e): 8th and 17th modes with respectively one and two nodal lines in volute.
Energies 14 04292 g006
Figure 7. Right column: Fourier spectra of longitudinal vibration velocities measured by the accelerometer (a) and by laser-vibrometer (b); Left column: Fourier spectra of vibration velocities measured at blades “B1”–“B4”, (cf). All maps represent single-point data.
Energies 14 04292 g007
Figure 8. Total displacement contours of the impeller natural vibration modes: (a)—third mode with zero ND, (b)—first mode with one ND.
Energies 14 04292 g008
Figure 9. Continuous wavelet transform scalograms of measured (right frames) and modelled (left frames) signals of static pressure at impeller eye (a), at vaneless diffuser (b,c) and at outlet diffuser (d); numerically predicted contours of static pressure at 85% span (e) with magnifications at impeller inlet- (e1) and volute tongue (e2) areas; total displacement of deformation obtained in coupled FVM-FEM run (f). m ˙ / m ˙ r e f 029 = 0.47 .
Energies 14 04292 g009
Figure 10. Instantaneous distributions of static pressure supplied by absolute (VLD) and relative (impeller eye) velocity data at four successive time-frames (ad). Each frame is shifted by 60° of impeller rotation with respect to preceding one.
Energies 14 04292 g010
Figure 11. Temporal histories of static pressure fluctuations at three monitor points located respectively at impeller’s trailing edge (TE-PS), at mid-passage (1/2M-PS) and at leading edge (LE-PS) (a) and their CWT-scalograms (bd) computed in rotating frame of reference. Data from pressure side of “B1” at 90% span.
Energies 14 04292 g011
Figure 12. Illustrations of predicted structural response mode at implementation phase: (a)—total displacement, (b)—equivalent total strain.
Energies 14 04292 g012
Figure 13. Temporal histories of total displacement in impeller at three nodal monitors with total displacement maxima at the hub disk at outlet (TE, hub) and mid-passage (1/2M, hub), and at shroud at leading edge (LE, shroud) (a) and their CWT-scalograms (bd). Data from “B1” and “B2”.
Energies 14 04292 g013
Figure 14. Interference “SAFE” [48] diagram plotted for the first family of axial disk modes and harmonics of the first engine-order at n = 24,300   rpm .
Energies 14 04292 g014
Table 1. Main geometric parameters of the test stage.
D 0 / D 2 D 2 / D 2 D 4 / D 2 D 4 / D 2 b 2 / D 2
0.491.221.471.360.05
b V L D / D 2 L a x / D 2 Z 0 / L a x Z 0 / L a x β b l 2 , °
0.050.311.671.3075
Table 2. Mean average estimates of relative uncertainties u c ( y ) / y for basic variables of stationary performance analysis (%).
pT Π m ˙
0.060.150.080.03
Table 3. Parameters of the numerical grid used in CFD simulations.
Sub-DomainElements/NodesNo. of Infl. LayersER y + max Min Angle
Inlet73768/37741101.22660°
Imp.-VLD1736640/1923075101.41533°
Volute416307/96803691.42060°
Table 4. Results of grid convergence indices estimation for finite-volume grids used in CFD simulations (subscript “3” refers to the grid finally used in the study, nomenclature is in accordance with [29]).
α 2   a v e c 2   a v e ψ p   0 4 Ψ i
N 3 , N 2 , N 1 , ( × 10 6 ) 2.2, 5.1, 11.1
r 32 , r 21 1.33, 1.29
e a 32 , e a 21 ( × 10 2 ) 4.6, 0.30.5, 0.31.3, 0.11.2, 0.2
G C I 32 , G C I 21 ( × 10 2 ) 0.5, 0.20.8, 0.50.02, 0.010.2, 0.05
Table 5. Specification of boundary conditions used in CFD model.
Simul. PhaseBoundary/Condition Type
-Inlet/Inlet Outlet/Opening
m ˙ (kg/s) T t (K) I ( % ) μ T / μ p o u t (Pa) T o u t (K)
Validation0.149295510 1.049 × 10 5 301.9
Implementation10.5316510 2 × 10 6 397
mediumn (rpm) M u timestep [s]
Validationair ideal gas72000.29 3.26 × 10 5
Implementation N 2 ideal gas24,3000.93 9.65 × 10 6
Table 6. Results of numerical modal analysis of impeller. First family of disk modes.
Nr of ND0123456
Eigenfrequency f n , Hz2548151320974111562759715801
Table 7. Results of Goodman-Haigh safety factors estimation. 10% total damping.
Monitor ϵ m × 10 3 ϵ a × 10 3 σ m , MPa σ a , MPa s
TE-S4.910.0089071.50.99
TE-H4.080.0048190.81.11
LE-S4.120.0038270.61.10
Publisher’s Note: MDPI stays neutral with regard to jurisdictional claims in published maps and institutional affiliations.

