1. Introduction
Airborne particle and pollution deposition on panels is a current issue that affects photovoltaic energy production to a very variable degree. Such a phenomenon strongly depends upon panel location and local pollution: the related energy loss can go from 3% up to 50% (or even more) of the expected efficiency, as described by T. Sarver et al. [
1]. There are various mitigation approaches, and these are characterised by different efficiencies. One of the most diffused approach is panel cleaning, which is performable in many ways and was described by H.A. Kazem at al. [
2] as “preventative” (meaning it is based on special coating materials), “automatic” (carried out by means of machines and robots), and “manual” (labour driven).
Automatic and manual panel cleaning methods often require water use, but it is mandatory to verify water quality, as stated by R. Appels et al. [
3]. Employing demineralised water can be one of the best solutions [
1,
3] because it is effective and it avoids chemicals addition. Demineralised water is often recommended by panel cleaning robot manufacturers because it avoids nozzle clogging. Moreover, it must be noted that surfactants, salts, and other elements, when added to water for cleaning, can reduce the efficiency of panels over time due to the deposition and adhesion of such substances to the PV glass surface [
2]. However, how to obtain demineralised water is a critical issue that must be confronted. It can be produced, for example, by means of a reverse osmosis process applied to fresh water. This process normally implies water wasting (eluate) up to 50% of the whole treated liquid, in order to minimize electrical consumption.
Increasing shortage and pollution of fresh water traditional sources, as underlined in the United Nations World Water Development Report [
4] and highlighted also in the Special Report on Climate Change and Land [
5], should be alarming enough to prompt the search for other solutions in order to obtain demineralised water. Moreover, even if a photovoltaic field is placed in an area not affected by water scarcity or stress, the availability of such a resource can suddenly change in case of drought in particular or unexpected emergency conditions. Due to climate changes, natural disasters related to water are expected to increase: UNICEF reported that “around 74 per cent of natural disasters between 2001 and 2018 were water-related including droughts and floods. The frequency and intensity of such events are only expected to increase with climate change” [
6]. Another factor that must be taken into account is the water price, which in many countries has been maintained artificially low for equity reasons. However, such a policy is no longer sustainable, due to increasing water needs and water scarcity, because it leads to high inefficiency in water usage, as noted by R.Q. Grafton et al. [
7]. Thus, it is reasonable to consider the fact that water price is expected to increase in the next years, in particular when its use is not strictly related to human consumption.
An alternative source of cleaning water can be seen in desalinated sea water. However, residual salinity is composed of chlorine compounds, which makes it not very suitable for panel cleaning because such substances can strongly affect panel and electrical circuit integrity. Moreover, according to A. Panagopoulos et al. [
8], the disposal of brine (the eluate) represents a critical issue for desalinisation sustainability. K.L. Petersen et al. in [
9] underlined that brine can be heavily polluted and could require a specific treatment, in particular if the eluate comes from sea water through reverse osmosis, as it may contain not only a very high salinity ratio but also other chemicals involved in the desalinisation process. A sustainable approach in photovoltaic panel cleaning should avoid not only traditional fresh water reservoir depletion but also brine creation and water pollution due to chemicals use.
It must also be underlined that areas with the highest radiation levels are often located in desert regions, are very far from traditional water sources, and are characterised by lack of rainfall. M.Z. Al-Badra et al. [
10] stated that in those areas there are large-sized solar panel plants, and M. Saidan et al. added that such panels are affected by high dust accumulation [
11]. As noted by H.A. Kazem et al. [
12], this can be due to the critical environmental conditions in the surroundings. In such places, water scarcity and unsteady supply are issues to confront, without forgetting possible social conflicts arising from arbitration on water different uses [
13].
One technical solution, which allows for having fresh demineralised water and, at the same time, independence from traditional water sources, is the employment of air water generator (AWG) technology. Humidity extraction from air can be carried out by means of different technologies, as found by Y. Tu et al. [
14], while H. Jarimi et al. [
15] investigated the technology in continuous development; on the current market, the most diffused one is condensation, obtained through a compression reverse cycle [
16]. A brief description of such a technology is given below.
Water coming from humidity condensation is naturally poor in salts content, as described by S. Algarni in [
17] and by M. Jahne in [
18]; thus, it can be directly used in panel cleaning, without an osmosis stage or any other particular filtration technique, except for a mild microbiological treatment, such as a UV lamp disinfection, in order to avoid mould and fungi growth. The AWG-produced water, in comparison to the condensate coming from air conditioning or heat pumps, is purer, even if not particularly treated; this is because of the particular materials employed in the condensation section, which must be certified as suitable for coming into contact with drinking water, as underlined by the authors in [
19].
Up until today, AWG technology has been thought of principally for drinking water, or, at the most, for cleaning water in households (or, in the future, for watering), as deduced from [
14,
15]. The idea of using AWG systems to produce water for panel cleaning is a novel approach in such a field which, until now, has never been described in literature. However, such a use raises some new research issues to confront.
The first difficulty is related to dry and/or cold areas. Such an issue has been already overcome by some companies by means of defrosting cycles, which is a diffused and already well-known practice in the heat pump field, or through the employment of desiccants, as described by F. Fathieh et al. in [
20] where a metal organic framework (MOF) based prototype was employed in a desert area to harvest water in very dry conditions.
After this, there are two more issues that are linked to one another: the fact that an AWG system has not a constant water production during the year, and the fact that producing water requires energy (related to the condensation process and air fans, as described by authors in [
21]). Such energy consumption is variable and is related to water production. As a matter of fact, each AWG system, independent from the implemented technical solution employed in moisture condensation from environmental air, has a variable efficiency in terms of water production and energy consumption; this efficiency strongly depends upon the thermodynamic and hygrometric air state, i.e., from weather conditions. In effect, as relative humidity and temperature increase, extracted water is more abundant and requires less energy; if the climate is dry and/or cold, the yield lessens and energy consumption increases. Moreover, each AWG model has its own efficiency and size that influence energy consumption and water production. If an AWG system is to be employed in panel washing, it is necessary to understand that its changing behaviour and its size both play a significant role in cleaning planning, as such a planning is based on an analysis between costs and benefits. As a matter of fact, each panel cleaning method introduces additional management costs, and thus it requires a balance between costs and benefits; specifically, this translates to a need in determining an optimal time interval between the two cleaning operations. For example, P. Besson et al. [
22] studied the optimal cleaning period for an installation in the Santiago region; E.G. Luque et al. [
23] proposed a cleaning optimization for bifacial modules, while L. Micheli et al. [
24] studied an optimum cleaning frequency that takes into account panel degradation. The above methods take into account water as a constant cost or, at the most, an increasing cost due to inflation and thus in their formulation are not tailored to AWGs.
The scope of the current paper is to address the above research issues and propose for the first time a method oriented to effectively employ AWG technology in panel washing, taking into account its particular traits. In particular, the authors propose a simplified method for choosing between the many AWG models on the market, determining the size of the system, and calculating the optimal cleaning interval. To achieve such a result, after a brief description of AWG systems, the authors propose a simplified soiling model in order to predict energy losses of panels in function of time. A cleaning period optimization method that is specifically AWG oriented is afterward developed, and a simplified method for machine selection and size determination is proposed. Finally, a case study where the said methods are applied is presented and discussed. The proposed methods for an effectual AWG technology employment aim to address the recommendation of [
2] regarding the “use of more optimized method for water usage”.
2. Methodology
Taking into account the water requirements in panel cleaning, which comprise washing techniques [
2], required water quality [
3], and required water quantities (R.K. Jones et al. [
25]), this section presents and analyses the various systems of water extraction from air, and the most suitable is then chosen for the panel washing application. The analysis is carried out by considering not only literature examples but also real machines that are available on the market [
16]. After this, a literature analysis is given, focusing in particular on the experimental results concerning panel soiling, and a simplified soiling equation is developed, taking into account the main parameters involved in dust deposition. This part of the research is described in the paragraph dedicated to the DIrt method. Subsequently, a cleaning period optimization method is developed, with an approach similar to that proposed by Besson et al. [
22] and Mithhu M.M.H. et al. [
26], but this approach here focuses on AWG machines and comprises a simplified soiling equation. Finally, in the next sections, a case study, based on literature experimental results (B.R. Paudyal et al. [
27]), is analysed and results discussed.
2.1. Water From Air Supplied by AWG Systems: Highlights and AWG Technology Choice for Panel Washing
Besides fog harvesting, which can be carried out only in particular cases, water extraction from air is based on the condensation of part of the air vapour content, generally obtained by means of air cooling. The cooling process can be carried out by means of different methods, as described in [
14], reprised in [
15], and furtherly investigated by G. Raveesh et al. in [
28]. The most common methods can be summarised as follows:
The last two techniques, in current practice, are employed when the required daily production is few litres a day. The first technique, in particular when based on a compression reverse cycle, is the most diffused one, for three main reasons. First, it is based on a well-known cooling technique, and the first applications of water extraction based on this technique can be dated back in 1960s (B. Hellström [
31]). Second, it requires comparatively less space for installing AWG machines in comparison to the second technique, as stated in [
15]. This can be verified by consulting the specifications listed for AWG machines on the market [
16]. Lastly, it can provide higher daily water production, which can go from a few tens to several thousands of litres a day [
15].
In the current paper, this last technique was taken into account because until today it is the most diffused one on the market and because its water production volumes are compatible with medium- and large-sized solar field cleaning operations. The panel washing requirement was estimated to be around 3.2 dm
3 of water for each kW peak of installed power (0.5 dm
3/m
2) [
25]. At any rate, the cleaning time optimization method and the system selection and size determination method that are proposed here can be applied to any kind of AWGs.
The extraction process of water from a reverse cycle based AWG consists of using fans to force the environmental air into a cooling coil, where it reaches its dew point and releases part of its vapour content in liquid phase. The cooling coil is the evaporator of a reverse cycle, driven by a compressor powered by electricity. The refrigerant, which flows through the thermodynamic close cycle, absorbs heat from the treated airflow and releases it into the local environment by means of a condenser. The cooled dry air is released into the environment as well.
In order to make the right choice among the many AWG machines available on the market, it is necessary to determine their behaviour, not only in terms of water production but also in energy consumption. A detailed description of mass and energy equations that governs an AWG machine can be found, for example, in [
21]. It is important to remember here that the behaviour of those machines, whether integrated or not, strongly depends upon environmental conditions, due to the variation of the efficiency of the reverse cycle that is directly related to environmental air temperature and humidity, as underlined by B. Gido et al. [
32] and A. Magrini et al. [
33]. Moreover, AWG machines are designed in different ways; thus, their behaviour can strongly differ from one to another, even if tested in the same environment, as stated by F. Bagheri [
34]. Some of them are specifically designed for particular climates and thus are more proficient in some conditions than in others. This topic is further discussed in the following subsections.
A final interesting consideration can be made concerning the employment of AWG technology in panel cleaning, namely that water production from air can be used as a method for energy storage. Grid-connected solar fields can cause dramatic grid instabilities, according to Lamsal D. et al. [
35]. In order to avoid such an issue, photovoltaic energy injection modulation is required, which is usually carried out by disconnecting some panel arrays from the grid. Diverting unused energy to water generation could be a smart solution to overcome such an issue, at least partially.
2.2. Soiling Related Efficiency Reduction Prediction Model Using the DIrt Method
The first step before planning panel washing is to understand how panels lose efficiency due to dirt. In the work by T. Sarver et al. [
1], they summarised the main parameters in dust deposition that have been studied up until 2013, and they also reported findings of dust effects on panel output power. H.A. Kazem et al. [
2] provided in 2020 some updates to the review, adding particular detail about corrosion. K. Ilse et al. [
36] carried out a deep analysis of microscopic and macroscopic parameters that influence soiling. In analysing previous literature results, it can be said that panel efficiency reduction due to soiling follows an exponential behaviour, as given for example in [
11]. In the current work, the authors propose a function that has the same behaviour and makes explicit some of the main parameters depicting airborne dust and its accumulation on panels described in [
36].
Light travelling through the dust layer undergoes an attenuation, following the Beer-Lambert exponential decay, depending upon the layer thickness and the absorptivity properties of the dust particles; therefore, the ratio between solar radiation power reaching the panel in soiled conditions and that reaching the panel in clean conditions can be written as:
where
η is the ratio between soiled panel efficiency and clean panel efficiency;
Psoiled is the solar radiation power reaching the soiled panel (kW);
Pclean is the solar radiation power reaching the clean panel (kW);
D is the dust attenuation coefficient (absorptivity) due to particle type and size (m
2/g);
l is the optical path length (dust thickness, in m); and
c is the dust density (g/m
3).
The product
l∙c can be renamed as
m, that is the dust density per area unit (g/m
2), and therefore Equation (1) can be written as:
The dust density per area unit is a time-dependant function that represents dust accumulation on the panel surface. It comes from a mass-balancing equation that describes the increment of dust density as the difference between soiling deposition and soiling reduction rate:
where
I is the panel inclination form-factor (ratio of dust actually accumulated and not falling apart) that takes into account panel tilt angle and goes from 0.0 to 1.0;
r is the soiling deposition rating on a perfectly flat (horizontal) surface (g/(s·m
2)); and
R is the soiling reduction rate coefficient (1/s), which represents natural effects that remove dust from the panel (i.e., gravity, rebound, wind effect, etc.). The actual reduction rate is proportional to such a coefficient and to the dust layer thickness.
Equation (3) can be integrated with the initial condition where soiling at
t = 0 is equal to 0:
Replacing
m(t) in the exponential decay efficiency function, Equation (1), the following formulation can be obtained:
Equation (6) describes a function that over time achieves asymptotically the maximum efficiency degradation due to dirt. This can be confirmed, for example, by the experimental results of [
25].
The product DIr represents the energy loss per time unit due to soiling deposition. As a matter of fact, there are only two parameters to be determined in order to calculate Equation (6): the product DIr and the inverse time constant R.
In order to carry out a first estimation of those two parameters, the ratio can be written as:
where
en(
t) is the energy production (kJ or kWh) of the solar field at time
t, and
en0(
t) is the energy production (kJ or kWh) of the perfectly clean solar field at time
t.
Combining Equations (6) and (7), it is possible to write:
The term
en(t) can be directly measured, because it is the real electricity production. The term
en0(
t) can be estimated in two ways: (1) it can be set equal to the expected theoretical production, considering clean panels, as noted by N.W. Alnaser et al. [
37]; (2) it can be evaluated by means of a control set, composed of one or more panels that are maintained constantly cleaned, as noted by M.M. Fraga et al. [
38].
Moreover, there are other two possibilities:
- (i).
If the measure is carried out in a brief period of time, for example within a month, the term en0(t) can be, at first approximation, maintained constant and equal to the value measured at the beginning of the test, en0, in cleaned conditions.
- (ii).
If the entire year’s theoretical expected production in cleaned conditions is available, another possible approximation is to set the parameter equal to the average daily expected production. In this last case, en0(t) is set a constant, i.e., en0.
DIr and
R can be estimated by means of direct measures of
en(t). The ratio between
DIr and
R can be calculated when the maximum efficiency degradation due to dirt is reached. In that case it is possible to write:
Thus, from Equation (8), the following is obtained:
So that:
where
endirty is the energy measured when panels reach the maximum efficiency degradation due to dirt (when, from experimental measure, the ratio between
en(
t) and
en0(
t) reaches a constant value).
To determine
R, at least a second measure of
en is needed, carried out in an instant
t1 >
t0, where
t0 is the measure starting point. Combining Equation (11) with Equation (8), it comes:
If more than one measure is carried out, the R value can be estimated with higher accuracy, e.g., by means of the least squares method.
The energy loss ratio
ELR due to dirty deposition can be expressed as:
Consequently, the energy loss due to soiling can be written as:
where
EL(t) is the solar field energy loss due to soiling (kJ or kWh).
Now, combining Equation (14) with Equations (13) and (6), the energy loss can be calculated as:
As a first approximation, the exponential can be expressed by means of the Taylor series, truncated at the second term:
Making a similar approximation in the efficiency function, the following is derived:
Thus, the energy loss becomes:
This simplified formulation requires the estimation of a single constant,
DIr, which summarises all the deposition phenomenon. Such a linear behaviour can be seen in various experimental results, as for example in [
37], in Darwish Z.A. et al. [
39], or even in B. Hammad et al. [
40], and it is considered the most expected behaviour also in [
24]. This proposed simplified method to determine the energy loss due to soiling is called the DIrt method.
2.3. Cleaning Period Optimization Method
The optimal period for cleaning is the time interval between one cleaning operation and the other, in which the panel energy production is maximized and the cleaning costs are minimized simultaneously [
22]. In the following, a method to calculate such a period when using an AWG machine is proposed. In that case, the cleaning raw material, i.e., the distilled water, is directly translated in terms of the electrical energy required by the AWG machine to produce it, and its amount is deducted from the solar field energy production.
In order to carry out the calculations, the following steps must be considered:
- 1.
Calculate the water needed for one field cleaning,
W [kg], considering the specific water quantity that is required by the intended cleaning method (e.g., cleaning robots or manual brushing require 3.2 kg/kW i.e., 0.5 kg/m
2, as given in [
25], assuming the constant density for water ρ = 1000 kg/m
3) and the solar field installed power or the solar field panels surface.
- 2.
Gather weather data about the solar field location that describe the entire year on the basis of statistical data; a hourly sampling frequency is recommend, taking into account previous work performed in the AWG field [
21].
- 3.
Determine the behaviour of the AWG machine, on the basis of collected hourly weather data, in terms of the produced water and related energy consumption, taking into account the entire energy cost of each item involved in the water extraction from air, in liquid phase, apart from any sanification/filtration system, as described in [
21]. Such a step is mandatory because AWG systems change behaviour depending upon inlet air conditions. In the case of AWGs employed for panel cleaning, it is a reasonable assumption to take into account only those AWG machines that treat external air.
- 4.
Define solar field electrical losses due to the dirt accumulation as described in
Section 2.2 by means of the DIrt function.
- 5.
Calculate the average energy required by the AWG for water production, i.e., enw (kJ/kg or kWh/kg), taking into account the data from Step 3.
- 6.
Determine the cleaning operation costs (
c.o.c.) and translate them into equivalent energy by means of the electrical energy selling price (
e.s.p.) granted to the photovoltaic field, where
c.o.c. is the cleaning operation costs (currency), and
eneq is the equivalent electrical energy (kJ or kWh):
- 7.
Determine
Ce, which is the whole energy cost due to cleaning (kJ or kWh), as:
where
Ce is a constant and its value is the energy amount that is required for water production as employed in the cleaning process, and the equivalent energy amount due to cleaning operations (kJ or kWh).
- 8.
Define the daily average energy loss due to the combination between the panel soiling and cleaning costs as:
where
AEL(tc) is the daily average energy loss (kJ or kWh), and
tc is the cleaning time interval (days).
- 9.
Calculate
t1, the cleaning optimal time interval (days), which minimizes Equation (21). An integration step of one day was chosen in compliance with the proposal given in Equation (22).
Taking into account the simplified expression in Equation (18) for
EL(t), the above formulation, which minimize
t1, can be written in the following way:
where
en0 is the energy production of the clean panel (kJ or kWh), which is considered to be constant during the calculation period, whose approximation was already discussed.
Deriving the above equation and setting it equal to zero allows for finding the optimal interval of time
t1 that minimizes the whole energy loss:
Equation (24) is in full accordance with [
26]. The calculation can be carried out, in the first approximation, by taking into account the yearly average energy consumption related to water production and an average yearly behaviour of
EL(t). In such a way,
t1 is the same for each month of the year. Such a simplification is acceptable not only when the production curve of the AWG during the year is almost flat but also when it is possible to provide the site with water storages, which is currently a very common solution that is already adopted in many cases, for example when the rainfall is collected.
2.4. Method for Selecting the AWG Machine and Determining System Size
The above method is suitable for determining the optimum interval between one cleaning operation and the next one, in case the AWG machine is already defined. On the contrary, if there is the need to make a choice among the different AWG machines and to find the optimal number of machines to provide cleaning, the criterion that selects the most cost-effective solution is to choose the configuration that minimizes AEL(tc). In order to achieve such a target, the authors propose the following simplified procedure:
- 1.
Carry out the actions described in Steps 1 and 2 of the cleaning period optimization method (in
Section 2.3).
- 2.
Consider the existing AWGs and choose a possible group of them on the basis of their working range, expressed in temperature and relative humidity of the air, which must be compatible with environmental conditions of the solar field site.
- 3.
Carry out the actions in Step 3 of the cleaning period optimization method.
- 4.
Transform machine cost in equivalent energy by means of the electrical energy selling price of the photovoltaic field production, where
m.c. is the machine cost (currency);
e.s.p. is the electrical energy selling price (currency/kJ or currency/kWh); and
en’eq is the equivalent energy machine cost (kJ or kWh):
- 5.
On the basis of the expected life of the considered AWGs, determine the entire expected water production, i.e., e.w.p., that each machine can provide during its lifetime.
- 6.
Divide each machine equivalent energy (
en’eq as calculated at Step 4) by its expected entire production of water during its lifetime (calculated at Step 5), in order to find the additional equivalent energy cost for mass of produced water, where
e.w.p. is the machine expected entire water production during its lifetime (kg),
en’w is the equivalent energy cost for mass of produced water (kJ/kg or kWh/kg):
- 7.
Calculate
Ce for each considered AWG:
- 8.
Choose the model that gives the lowest Ce value.
- 9.
Carry out the actions described in Steps 8 and 9 of the cleaning period optimization method.
- 10.
Determine the yearly water requirements for the optimum cleaning
Wy (kg):
- 11.
Divide the chosen AWG water yearly productions by Wy and determine the number of machines, NAWG, that are required to satisfy the cleaning needs.
The above described procedure does not take into account the price and cost actualization because it is a simplified procedure that is oriented to obtain a method for the first selection. In order to obtain a better precision in results, besides cost actualization, an energy selling price evolution scenario should be taken into account. The development of such a study is planned for further research work by the authors, starting from the approach of L. Micheli [
24].
In the next subsection, the simplified method is applied to a case study, based on the literature results in terms of panel yielding in order to show how to choose between two different AWG machines.
3. Case Study: Methodology Application
In order to show how to apply the DIrt method and the AWG system selection and sizing procedure for panel washing, the climate of Kathmandu was considered, as well as the soiling of such a place as seen in 27, where a comparison between constantly cleaned and uncleaned panels was carried out for 5 months, and the efficiency loss was determined. In particular, the efficiency loss ratio was almost linear until it reached about 27% in 145 days (not considering the peak of about 30%, achieved between day 133 and day 140). For such a place, the cleaning operation cost was unknown, and thus it was not considered in the first approximation.
The electricity price was found by consulting [
41], and the value was rounded to 0.07 EUR/kWh. A field of 1 MW of installed power was considered, giving a yearly energy yield of 1,381,239 kWh in cleaned conditions.
Due to the linear behaviour of efficiency loss, it is possible to apply Equation (18) in order to calculate the
DIr coefficient. Recalling Equation (14), it is possible to write the following for the 145th day:
Thus, the amount was calculated as follows:
Taking into account the value found in [
25] of 3.2 dm
3/kW for the required water and a water density of 1000 kg/m
3, it is possible to calculate the entire water mass required to clean the whole solar field:
The next step was to determine the climate of Kathmandu. The authors found hourly climate data of the place, by means of the weather database of the Tribhuvan international airport, located in Kathmandu’s surroundings.
Table 1 shows the monthly averages, calculated on the basis of hourly data gathered for the last five years.
Two AWG machines, both based on a compression reverse cycle, were taken into account (
Table 2).
Machine 2 is cheaper than 1; its price is about one third of the other model. However, the expected lifetime of the first machine is 20 years, while the lifetime of the other is 10 years. The working range is almost the same for the two models and is compatible enough with the local weather, even if during winter the production is expected to be lower than in the other seasons.
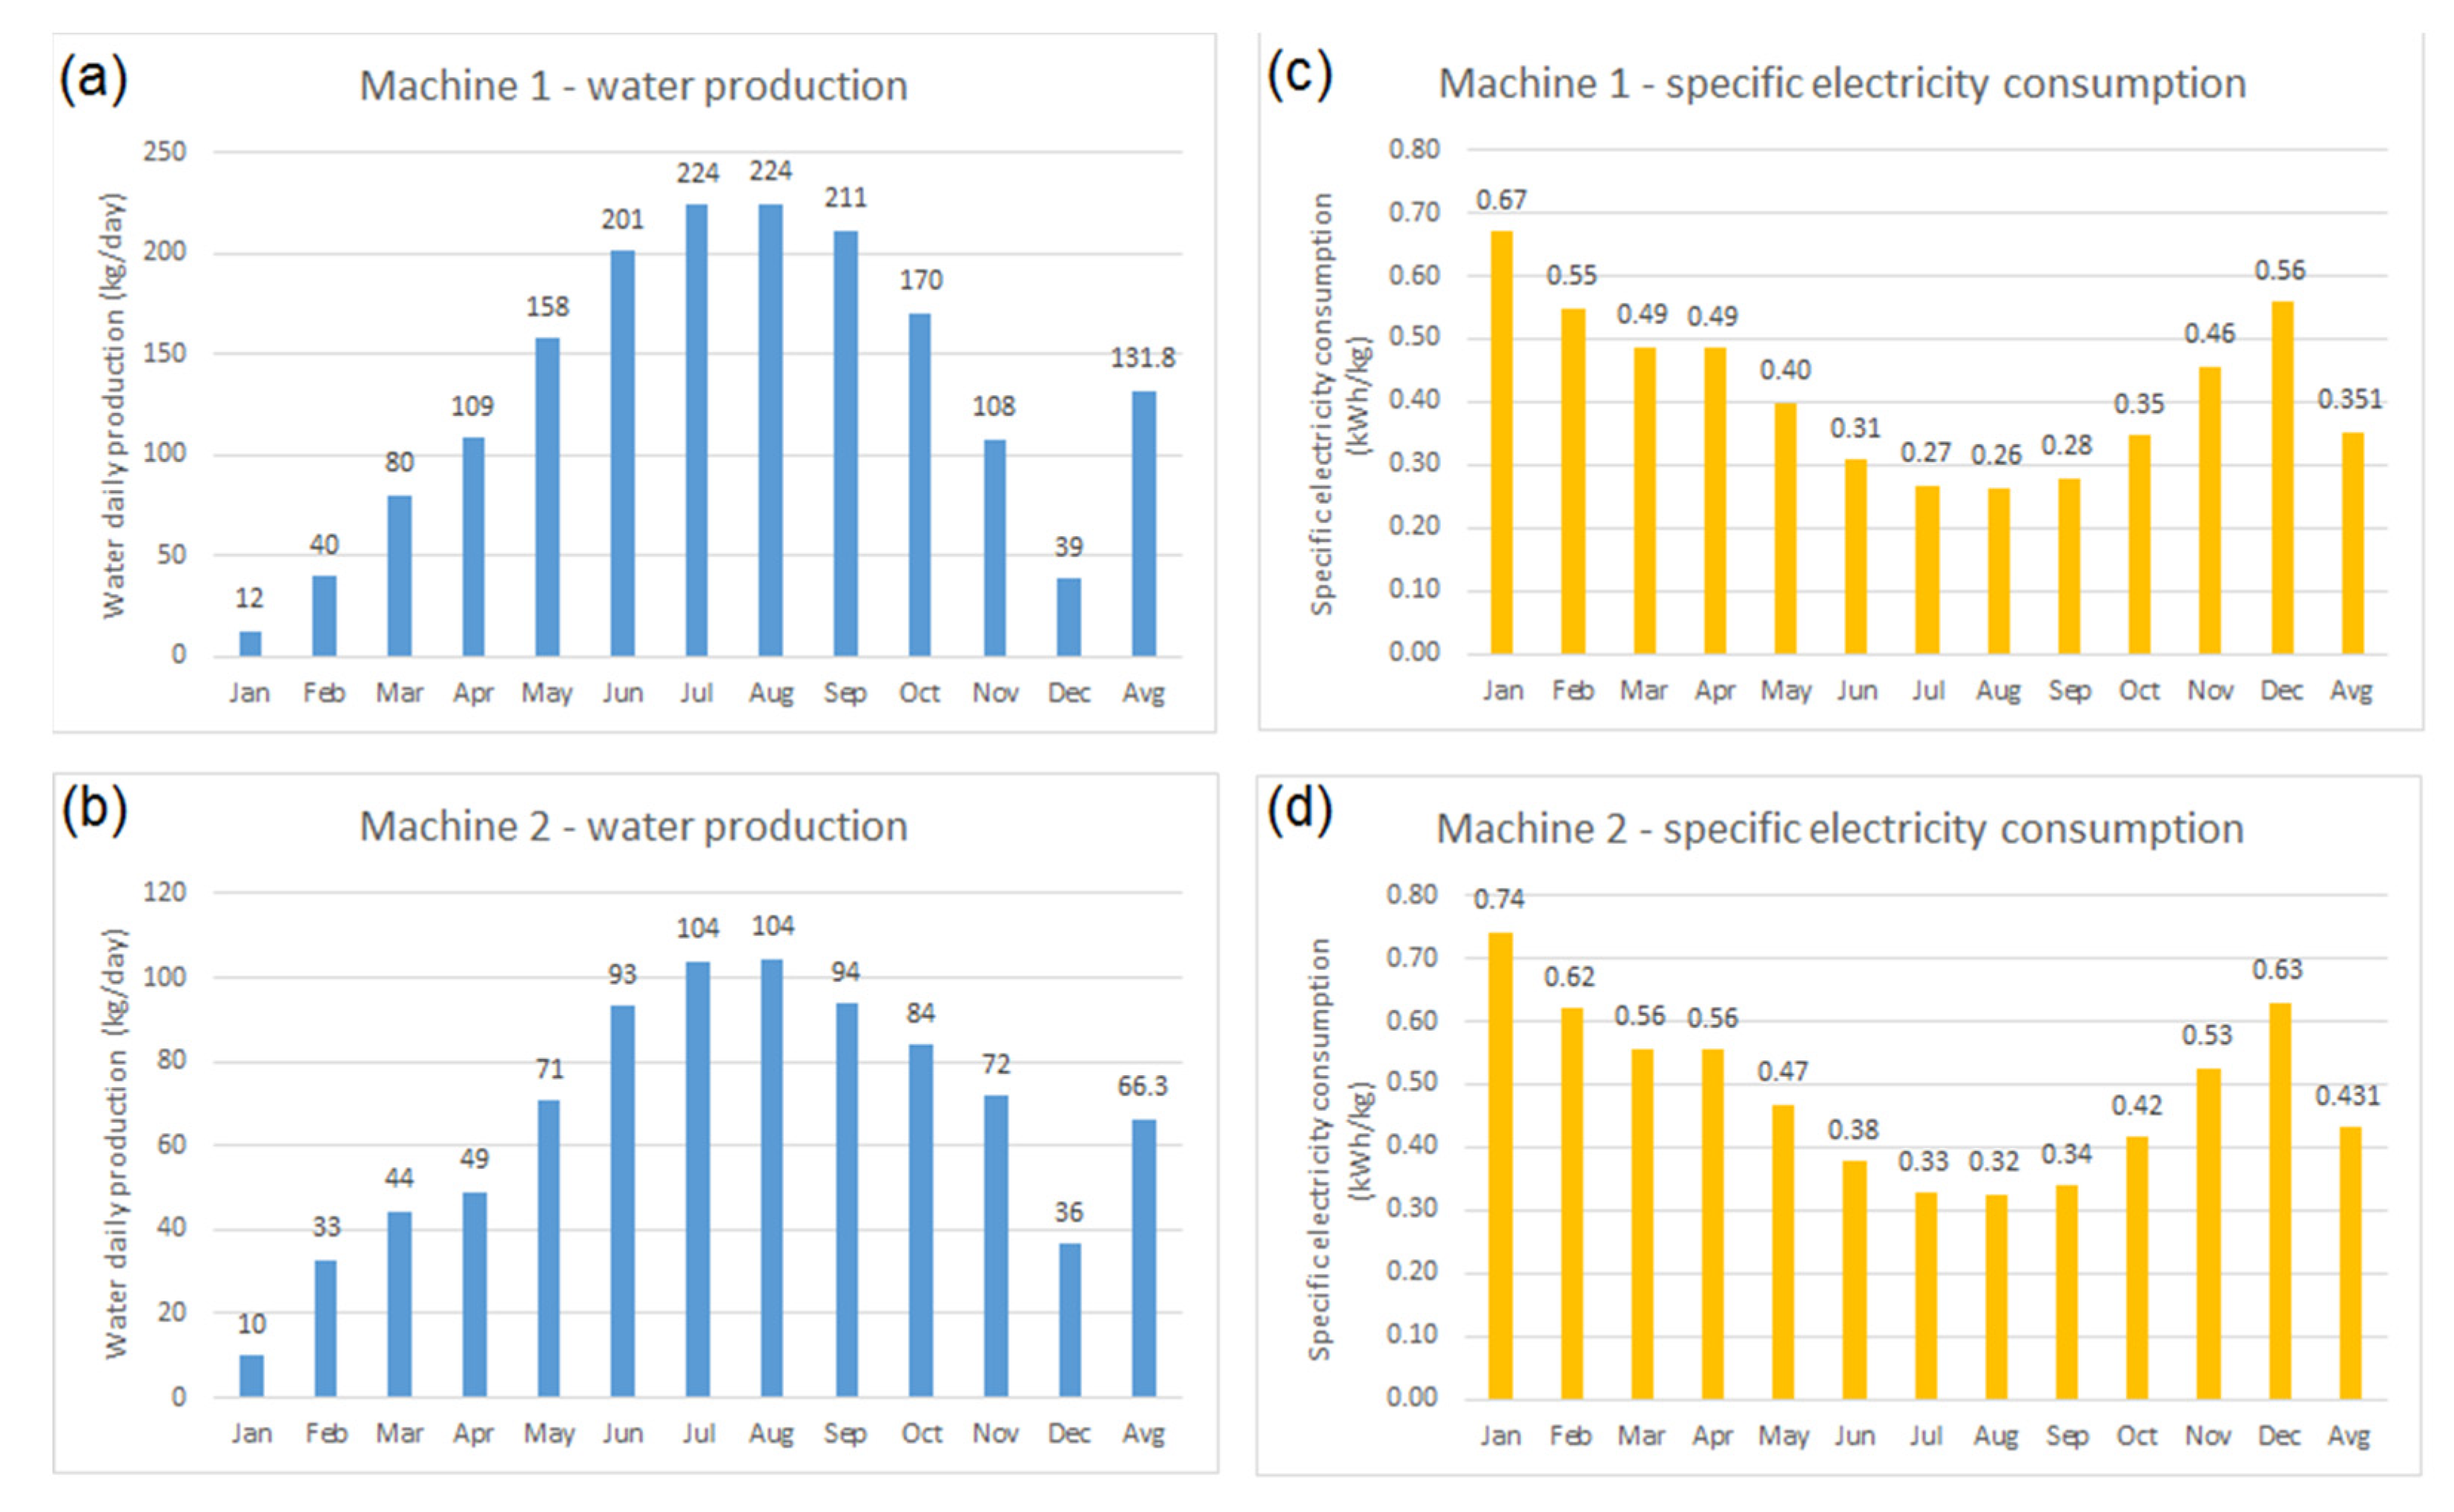
The behaviour of each machine in Kathmandu climate was calculated, and results are summarised in
Figure 1.
Figure 1a,b describes the average water production of Machine 1 and Machine 2, respectively, while
Figure 1c,d describes the electricity consumption required by Machine 1 and Machine 2, respectively, to extract 1 kg of liquid water from air.
The shapes of the production curve and consumption curve are similar, but the absolute values are different: the first one has a production almost twice of that of the second one with an average consumption that is 18.4% less than that of the other machine (
Table 3). Such a difference in production and consumption is due to machines own characteristics, which are related to their main features and to the performances of their controlling software.
4. Results
Taking into account the electricity price (0.07 EUR/kWh), the machines cost, the entire water production, and the average electricity specific consumption (
Table 3), it is possible to determine
en’w and thus
Ce, in combining Equations (24) and (25) and applying Equation (26). Results are reported in
Table 4.
By means of a comparison between the two Ce values, Machine 1 is the best choice for panel washing in the current case, as it shows the minimum energy cost due to cleaning. Once the best solution is determined, it is possible to calculate the optimal time interval by applying Equation (23).
In this case,
en0 was considered constant and equal to the average daily production, calculated simply as:
Thus, the following is obtained:
Applying Equation (28), the entire water quantity required in the whole year is:
Remembering that the yearly production of machine 1 is 48,115 kg, and dividing
Wy by such a number, the number of machines becomes:
The
AEL(t1), remembering that
t1 = 25, applying Equation (21) is:
AEL represents the average daily loss that affects the solar field due to the cleaning costs and soiling accumulating during the interval between one cleaning and the other. Such a loss represents 4.6% of the daily panels production.
The same calculations carried out for machine 2 give an AEL equal to 189.6 kWh/day, 5% of the daily panels production, higher than the previous one demonstrating that machine 1 is the best choice.
5. Discussion and Further Developments
The case study results show how the applied procedure allows for choosing between two different models of AWG machine and to calculate the optimal time interval between two cleanings. Such a procedure can be applied to any type of AWG machines, not only on those based on a reverse cycle. It is only required to know the behaviour of the considered model in the climatic conditions of the panel installation.
The proposed method to determine the optimal cleaning frequency differs from the one proposed by P. Besson [
22], not only because water becomes a fundamental explicit term into the cost/benefit balance, but also because due to the particularity of AWG technology, it was possible to consider its impact by means of the corresponding energy loss. In a more complex analysis, taking into account, for example, the net present value calculations as proposed by L. Micheli [
24], the approach permits simplifying the analysis of the cleaning costs behaviour prevision, as the two main costs, i.e., the costs of the machine and of the water, are only linked to the electricity cost. The proposed procedure allows also for quantifying the energy saving due to an optimal cleaning frequency provided by AWG. In making a comparison with the experimental data of [
27], the solar field efficiency without cleaning drops by 27% after 145 days. This means that the energy loss in a not cleaning scenario is expected to be at least 1021.68 kWh/day; this value may be even worse because the study stops after 145 days, and 27% has not yet been determined as the regime value. On the contrary, the energy loss in the cleaning configuration, provided by Machine 1, is only 4.6% of the expected average daily production, giving a net advantage of about 847 kWh/day, which means 83% of energy loss saved.
The behaviour of each machine involved in the study strongly determines the final result. The produced water influences the number of required machines to cover the cleaning needs, and the energy efficiency strongly influences the energy cost of each litre. The higher the specific energy for water production, the higher the period is between one cleaning operation and the other, and thus the higher the energy losses due to dirt accumulation. On the other side, a higher number of machines increases the investment cost and thus affects in an indirect way the cleaning frequency, which is likely to increase. In the case study, the cheaper machine was not the best choice, even if its price was less than one third of the other one, precisely because its behaviour in terms of water production and energy consumption was far worse than the other. However, the difference in final results was not so marked, underling that the choice was not a foregone one.
The proposed method can be applied to any existing case of solar field, where it is possible to provide at least two measures of energy loss due to soiling. In many cases, such measures can be carried out by a comparison between a not cleaned panel and a perfectly cleaned one. The procedure can be also applied to a solar field in design stage, but in such a case, soiling should be predicted using models, such as those based on an analysis of the local airborne pollution, as seen in L. Zhou et al. [
42].
The other information that must be known, in order to apply the procedure, is the weather behaviour at the installation site. In particular cases, it can be enough to know the monthly averages, but normally it is better to be provided with hourly values. Such kind of data are not so difficult to collect, as it is not uncommon for the companies that install and manage photovoltaic systems to carry out weather measure campaigns with a collection frequencies of sample in the minutes order. These data are of great importance in determining AWG behaviour.
The current research presents two interesting points that should be furtherly developed in next research works. The first one concerns the storage of produced water. The case study highlights that both machines do not have a constant production during the year; in particular, in winter the daily production is considerably lower than in the rest of the year. Such a behaviour is normal and expected because water production from air, as already underlined, strongly depends upon environmental conditions. This means that even if the machine is correctly sized with a yearly production that covers the requirements, it may happen in some periods of the year that the water produced is not enough, so it should be necessary to store water when production exceeds the needs. Storage sizing can be carried out following the same procedures used, as for example by S. Umapathi et al. in [
43], for rain collection.
Moreover the study shows that also water production energy changes during the year. Thus storing water in the most favourable period of the year could be more cost effective in comparison to a day-by-day production. This means that it could possible that a different solution in system sizing (e.g., using two or more machines, using a bigger one, working only during the most favourable periods) could be advantageous from an economic point of view. A further development of the current research will concern such an aspect, analysing how to comprise possible water storage into calculations.
A second point, deserving further developments, regards energy use optimization. The reverse cycle based AWG technology is characterised by a not negligible energy consumption, as remembered in [
15]. In the current research such an energy consumption was taken in due account and treated as the water “cost”. To be able to decrease such a cost would permit to increase the cleaning frequency and, thus, to furtherly minimize panel energy loss. Moghimi and al. [
44] suggest that integrated AWG machines are a mean to address the issue of energy consumption in water extraction from air.
An integrated AWG machine permits to effectively use the by-side effects of a reverse cycle based AWG system. Such a machine is smartly designed in order to recover the heat flux, coming from the condenser, and the cooled and dry airflow, coming from the cooling process, instead of disposing them into the environment. The use of an integrated AWG in panel washing, instead of a simple AWG, could provide some interesting improvements. Firstly, cooled and dry airflow can be employed for inverter cooling, avoiding dedicated air conditioning systems or helping the existing ones, thus reducing their energy consumption. Secondly, if there are settlements near the solar field, heating energy too, coming from the process and made available by the integrated machine, can be exploited. If such a machine is employed, the final balance between exploited useful effects and required energy to obtain them can dramatically increase. Those last aspects are going to be furtherly developed by authors in a subsequently research work, aimed to determine the meaningfulness of thermal contributions, potentially provided by an AWG integrated system, in panel cleaning management.
6. Conclusions
In the current paper, a new employment of AWG systems was analysed, specifically their use in photovoltaic cleaning. AWG technology permits to obtain water, suitable for panels washing because naturally low in salt content, without depletion of traditional sources and without issues concerning brine disposal. In order to effectively employ AWGs in such a task, the most suitable machine model should be chosen and an optimized cleaning frequency calculated, taking into account the particular traits of an AWG. In the current paper, the authors addressed this by (1) developing a simplified soiling prediction model that could determine energy loss due to soiling, on the basis of few solar field output power measurements; (2) proposing a method to determine the optimum cleaning period, tailored expressly for AWG machines and based on the said simplified soiling prediction model; and (3) introducing a method to choose the correct AWG machine and determine the optimal settings, that involves the optimum cleaning period and takes into account the machine’s own behaviour.
Such methods were applied to a case study, and results were discussed. It was found that the proposed procedure allows for determining the optimal cleaning time and the energy saving for two different types of AWG machine and permits to choose between the two machines, taking into account their behaviors and characteristics. Once the cleaning frequency was calculated, it was also possible to determine the optimized system size (i.e., the number of machines to provide the required water) and to confirm, on the basis of energy savings results, the best solution between the two models. In particular, for the studied example, it was found that the optimized choice could prevent 83% of the losses.
The procedure can be applied to existing solar fields, where using the soiling model, energy losses due to soiling can be experimentally stated by means of few measures and where yearly weather conditions can be known. It can be also applied to a solar field in the design stage, but in such a case, soiling should be predicted.
The next steps of the current work is to study the effectiveness of an integrated AWG machine in panel washing by means of possible employment of its useful effects in a solar field and to investigate how to consider water storage in calculations.


