
Transition to Zero Energy and Low Carbon Emission in Residential Buildings Located in Tropical and Temperate Climates

 ,
,  , ,
, ,  ,
,
Abstract
:1. Introduction
2. Keywords Analysis
2.1. Buildings and Zero-Energy Concept
2.1.1. Nearly Zero-Energy Building
2.1.2. Passive Building
2.2. Zero-Energy Building
2.3. Positive-Energy Building
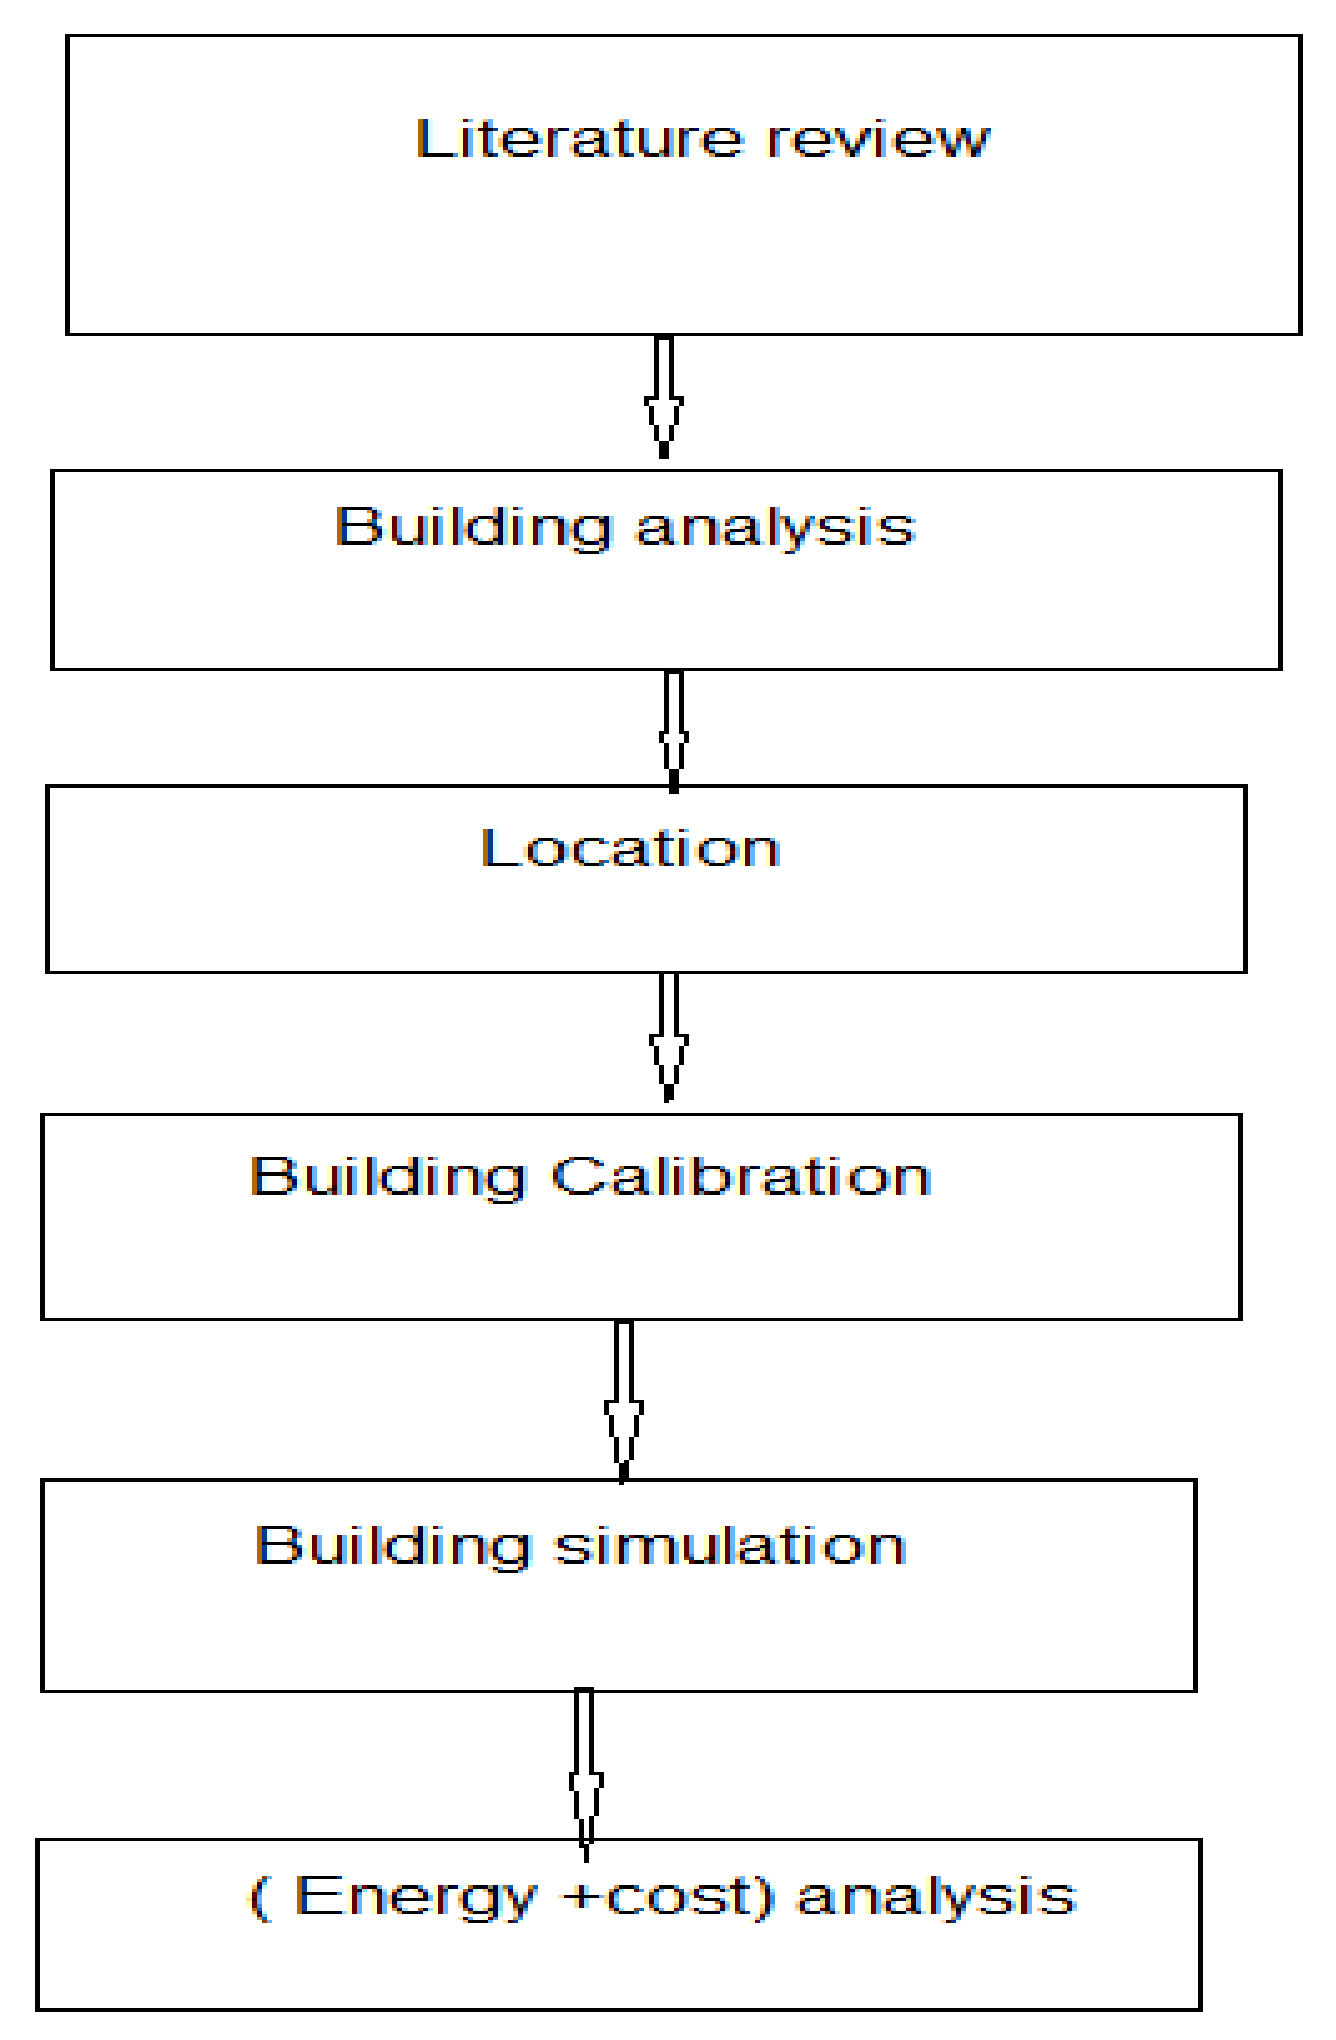
3. Methodology
3.1. Location
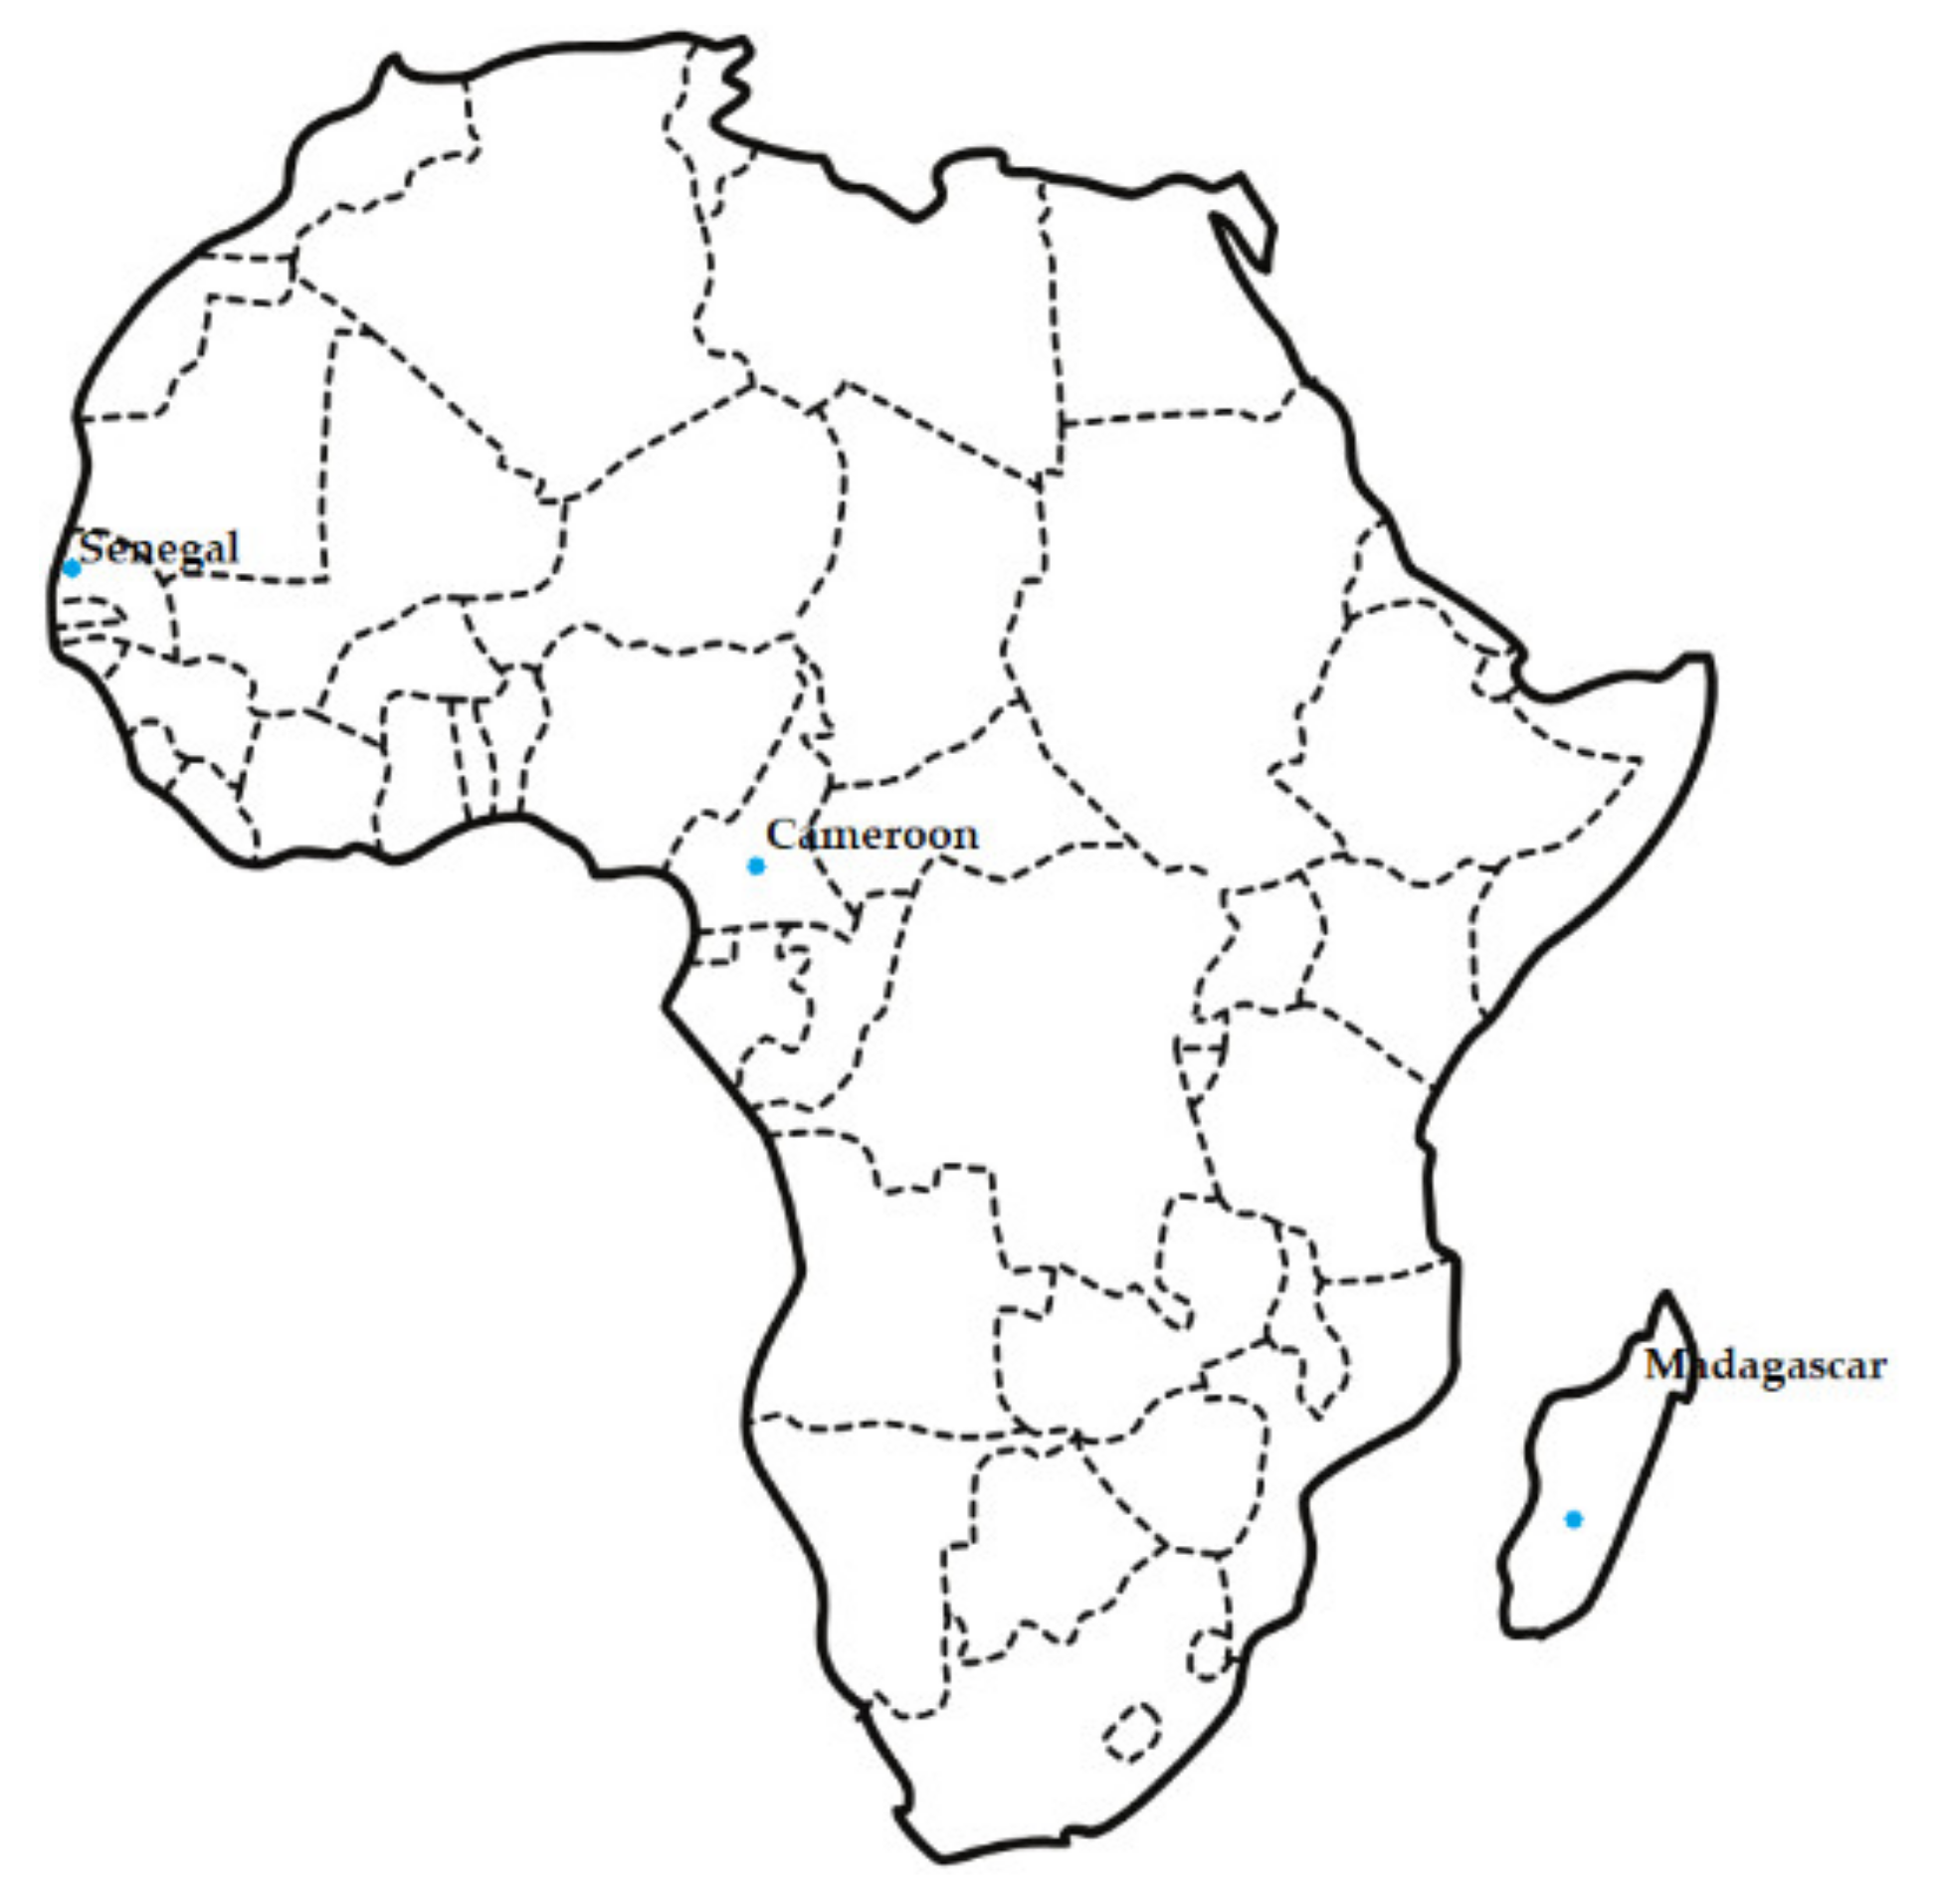
3.1.1. Studied Locations
- (1)
- Located between 4°03′ N and 9°4′ E, the city of Douala is the economic capital of Cameroon. Douala covers 923 km2 and is strongly dominated by the tropical climate essentially made up of two seasons: the dry season from November to April and the rainy season from April to November.
- (2)
- Dakar is the main city of Senegal. It is a coastal city located on the edge of the Atlantic Ocean. This city is dominated by the tropical climate and crossed by the monsoon coming from the southwest which is a humid wind bringing rain, and also a dry wind (the Harmattan). Dakar is one of the largest metropolises in Africa with a very high growth rate.
- (3)
- Located 1435 m above the sea, the city of Antananarivo, the political capital of Madagascar, is spread over 350 km of surface. The city of Antananarivo is strongly dominated by the tropical climate of such an altitude. It has notably cool, mild winters and very rainy summers. Figure 2 gives the geographical location of these different cities studied, while Table 3 shows some climatic characteristics.
- (4)
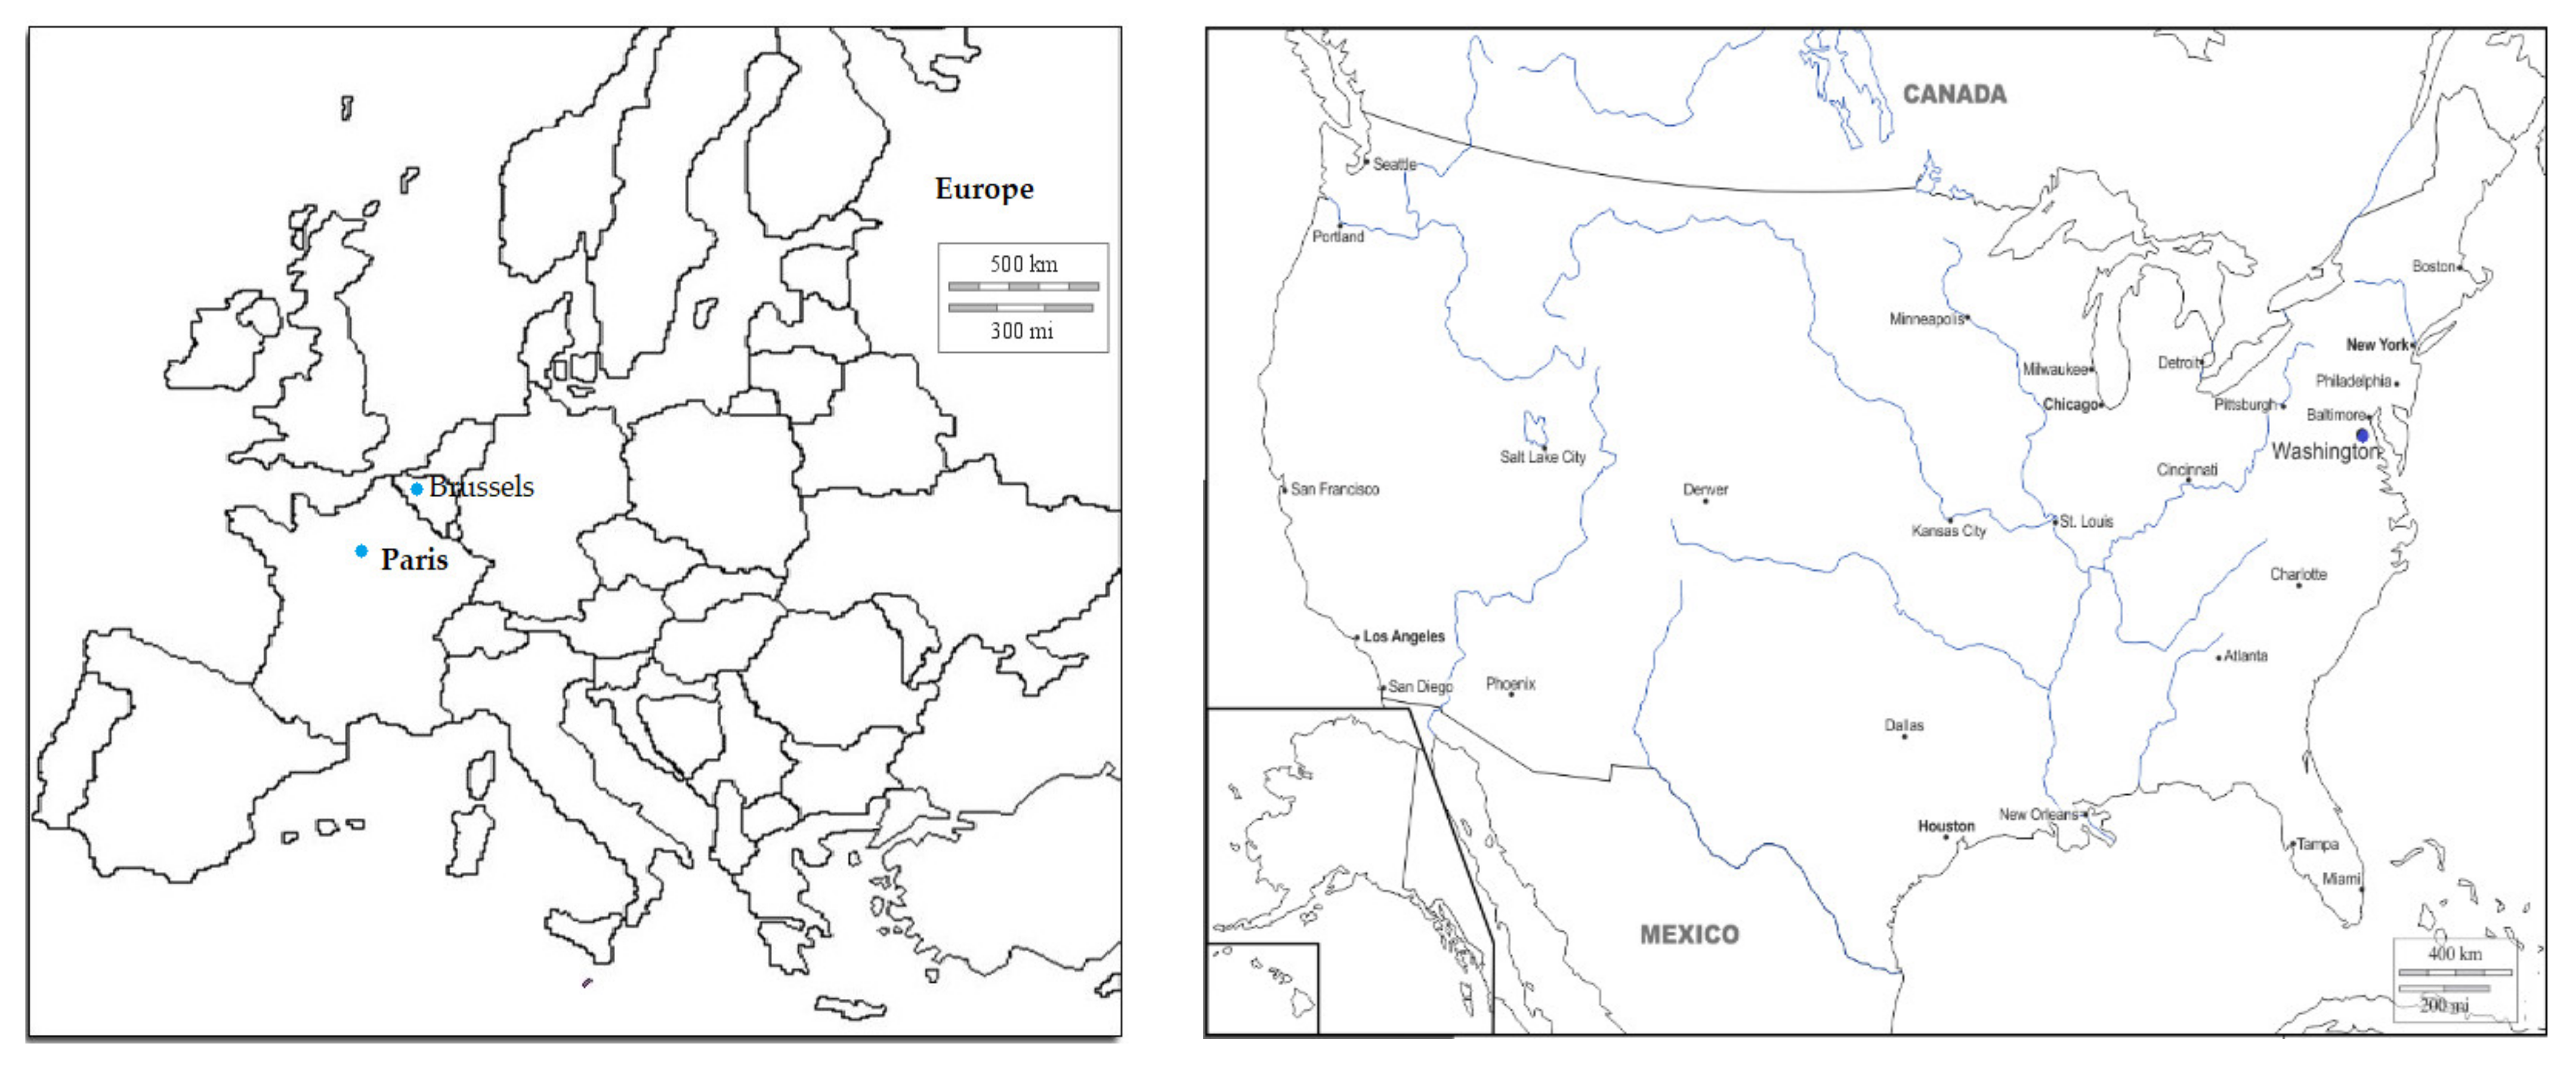
- Brussels is the capital of Belgium, the French Community of Belgium, the Flemish Community, and the seat of several European Union institutions. The climate of Brussels is temperate and influenced by the Gulf Stream. The proximity to the sea has a strong influence on this climate. The climate of Brussels is generally characterized by mild and rainy winters and relatively cool and humid summers.
- (5)
- Washington DC is one of the world’s largest cities, located in the mid-Atlantic region of the East Coast of the United States, between Virginia and Maryland. The nation’s capital is around 40 miles south of Baltimore, 30 miles west of Annapolis and the Chesapeake Bay, and 108 miles north of Richmond. Founded in 1791, Washington DC is the place where the seat of the American congress is located [22]. Major factors determining Washington’s climate include the large semi-permanent high-pressure and low-pressure systems of the North Pacific Ocean, the continental air masses of North America, and the Olympic and Cascade Mountains [22]. In spring and summer, a high-pressure anticyclone system dominates the North Pacific Ocean, causing air to spiral out in a clockwise fashion [22].
- (6)
- Paris is the capital city of France, and the largest city in France. The area is 105 km2. Paris is also the centre of the French economy, politics, traffic, and culture. The climate of Paris is said to be a warm temperate. The rainfall in Paris is significant, with precipitation even during the driest month. The average annual temperature in Paris is 11.3 °C. Figure 3 shows location of some cities studied in this research.
3.1.2. Climatic Data
3.2. Buildings
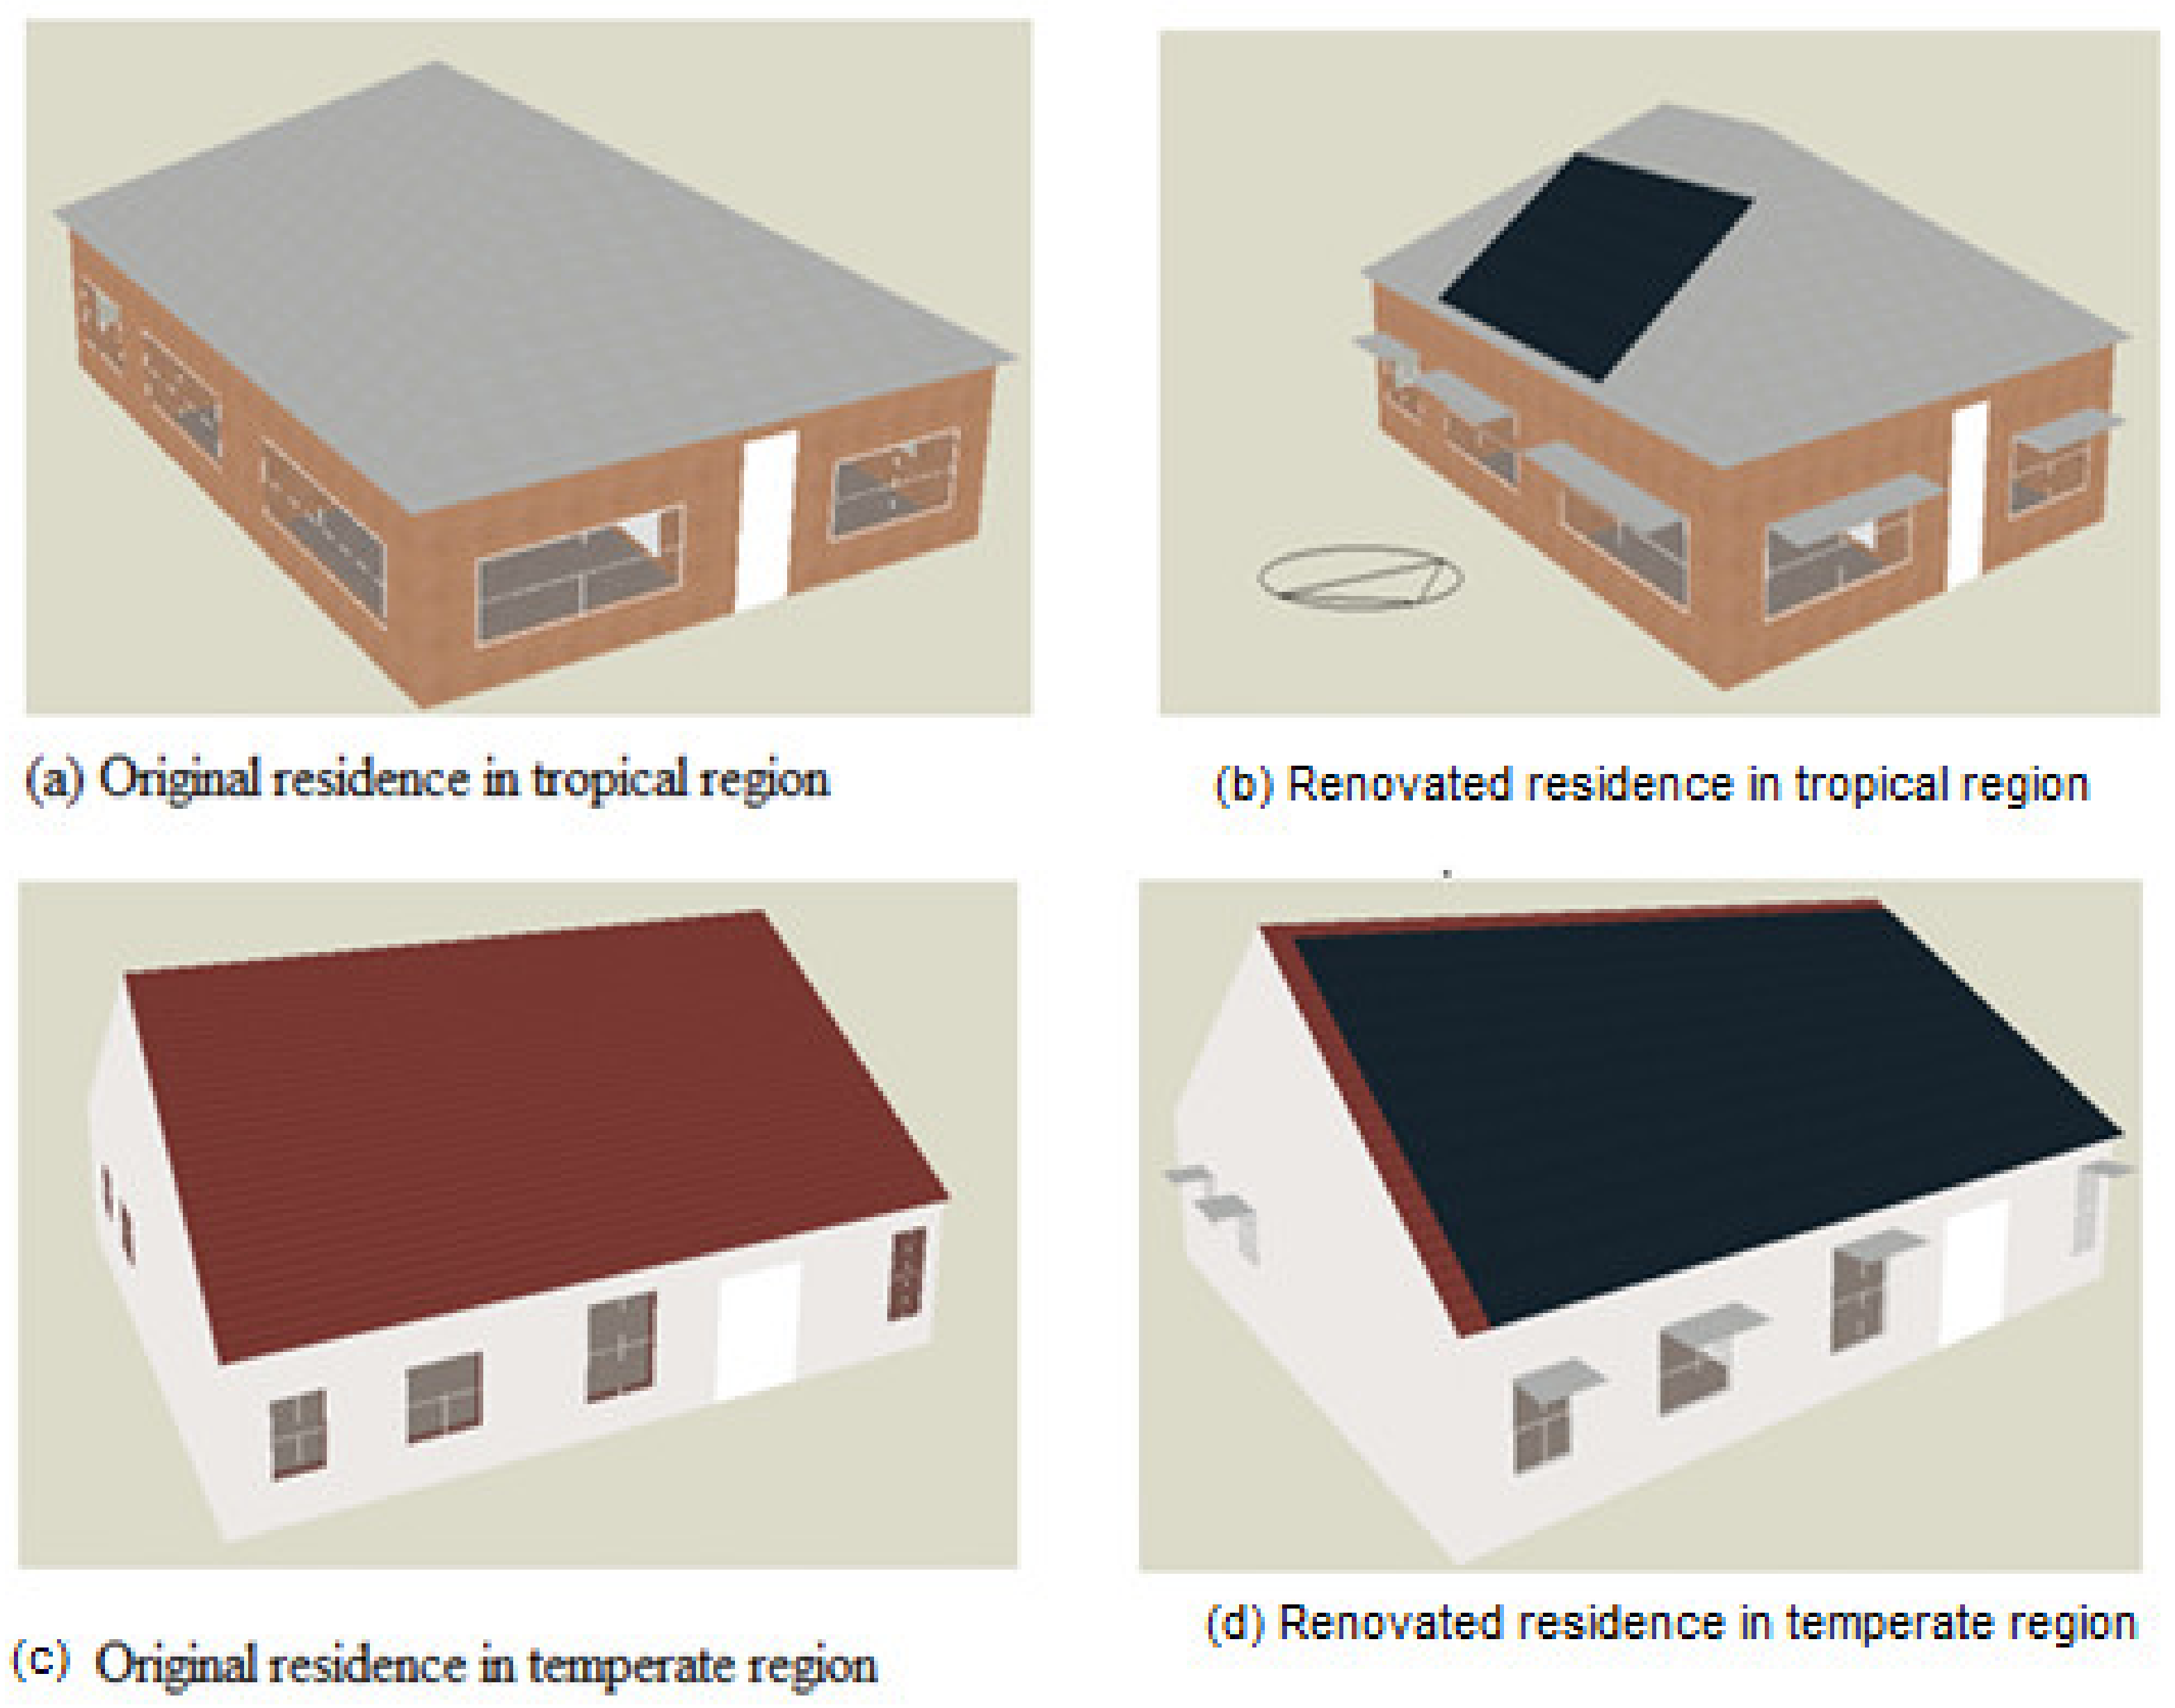
- -
- The first residential building designed for this project, and located in the tropical region, was a simple one-floor family house consisting of four bedrooms, a shower room, and a kitchen. The building materials mainly consisted of Earth bricks and essentially glazed windows (glass thickness: 5.5 cm).
- -
- The second residential building designed for this project, and located in the temperate region, was a familiar residence composed of two bedrooms, a living room, kitchen, and restroom. The different building materials are detailed in Table 4.

| No | Country | City | Climate | Location | Temp.(°C) | RH (%) | ||
|---|---|---|---|---|---|---|---|---|
| Min | Max. | Min. | Max. | |||||
| 1 | Belgium | Brussels | temperate | 50.85° N, 4.35° E | −1 | 30 | 30 | 90 |
| 2 | Cameroon | Douala | tropical | 4.05° N, 9.76° E | 18 | 37 | 30 | 90 |
| 3 | France | Paris | temperate | 48.85° N, 2.35° E | −10 | 31 | 30 | 90 |
| 4 | Madagascar | Antananarivo | tropical | 18.87° S, 47.50° E | 10 | 35 | 55 | 90 |
| 5 | Senegal | Dakar | tropical | 14.72° N, 17.46° W | 15 | 35 | 30 | 100 |
| 6 | United States | Washington | temperate | 38.90° N, 77.03° W | −2 | 33 | 30 | 98 |
| Region | Building Category | Building Clement | Layer | Component | Thickness (m) | Thermal Conductivity (W/mK) | Density (kg/m3) | Specific Heat Capacity (J/kg K) | Embodied Carbon (kg CO2/kg) | U-Value (W/(m2K)) |
|---|---|---|---|---|---|---|---|---|---|---|
| Tropical region | Residence in the initial state | Exterior wall | Layer1 | Plaster | 0.025 | 0.500 | 1300 | 1000 | 0.12 | 2.750 |
| Layer2 | Concrete block | 0.120 | 1.630 | 2300 | 1000 | 0.08 | ||||
| Layer3 | Plaster | 0.050 | 0.500 | 1300 | 1000 | 0.12 | ||||
| Partition wall | Layer | Concrete block | 0.120 | 1.630 | 2300 | 1000 | 0.08 | 5.850 | ||
| Roof | Layer1 | Clay Tile | 0.025 | 1.000 | 2000.0 | 800 | 0.46 | 0.160 | ||
| Layer2 | Stone Wool | 0.242 | 0.040 | 30.0 | 840 | 1.05 | ||||
| Layer3 | Roofing felt | 0.005 | 0.190 | 960.0 | 837 | - | ||||
| Residence after renovation | Exterior wall | Layer | Wood | 0.153 | 0.040 | 110 | 1800 | 0.00 | 0.250 | |
| Partition wall | Layer | Wood | 0.070 | 0.040 | 110 | 1800 | 0.00 | 0.250 | ||
| Roof | Layer1 | Clay Tile | 0.025 | 1.000 | 2000.0 | 800 | 0.46 | 0.160 | ||
| Layer2 | Stone Wool | 0.242 | 0.040 | 30.0 | 840 | 1.05 | ||||
| Layer3 | Roofing felt | 0.005 | 0.190 | 960.0 | 837 | - | ||||
| Temperate region | Residence in the initial state | Exterior wall | Layer1 | Plaster | 0.030 | 0.500 | 1300 | 1000 | 0.12 | 0.330 |
| Layer2 | Concrete | 0.140 | 0.510 | 1400 | 1000 | 0.08 | ||||
| Layer3 | Extruded polystyrene | 0.120 | 0.034 | 35 | 1400 | 2.88 | ||||
| Layer4 | Facing brick | 0.090 | 0.620 | 1700 | 800 | 0.22 | ||||
| Partition wall | Layer1 | Plaster | 0.030 | 0.500 | 1300 | 1000 | 0.12 | 1.570 | ||
| Layer2 | Brick | 0.140 | 0.720 | 1920 | 840 | 0.22 | ||||
| Layer3 | Plaster | 0.030 | 0.500 | 1300 | 1000 | 0.12 | ||||
| Roof | Layer1 | Roof tiles | 0.030 | 0.550 | 1900 | 837 | 0.05 | 0.180 | ||
| Layer2 | Wooden lathing | 0.038 | 0.130 | 2800 | 896 | 0.45 | ||||
| Layer3 | Air gap | 0.025 | - | - | - | - | ||||
| Layer4 | Wood | 0.042 | 0.120 | 510 | 1380 | 0.45 | ||||
| Layer5 | Rock wool | 0.400 | 0.100 | 500 | 1000 | 0.98 | ||||
| Layer6 | composite wood | 0.018 | 0.040 | 160 | 1888 | 0.19 | ||||
| Residence after renovation | Exterior wall | Layer1 | Plaster | 0.030 | 0.500 | 1300 | 1000 | 0.12 | 0.350 | |
| Layer2 | Concrete | 0.140 | 0.510 | 1400 | 1000 | 0.08 | ||||
| Layer3 | Wood frame | 0.030 | 0.120 | 510 | 1380 | 0.45 | ||||
| Layer4 | ISOCELL cellulose | 0.020 | 0.100 | 400 | 1360 | - | ||||
| Layer5 | Composite wood panel | 0.020 | 0.250 | 900 | 1000 | 0.12 | ||||
| Layer6 | Wooden cladding | 0.022 | 0.130 | 160 | 1800 | 0.05 | - | |||
| Partition wall | Layer1 | Plaster | 0.030 | 0.50 | 1300 | 1000 | 0.12 | 1.570 | ||
| Layer2 | Brick | 0.140 | 0.720 | 1920 | 840 | 0.22 | ||||
| Layer3 | Plaster | 0.030 | 0.500 | 1300 | 1000 | 0.12 | ||||
| Roof | Layer1 | Roof tiles | 0.030 | 0.550 | 1900 | 837 | 0.05 | 0.180 | ||
| Layer2 | Wooden lathing | 0.038 | 0.130 | 2800 | 896 | 0.45 | ||||
| Layer3 | Air gap | 0.025 | - | - | - | - | ||||
| Layer4 | Wood | 0.042 | 0.120 | 510 | 1380 | 0.45 | ||||
| Layer5 | Hemp wool | 0.400 | 0.037 | 800 | 1000 | 0.00 | ||||
| Layer6 | Composite wood | 0.018 | 0.130 | 1000 | 1000 | 0.01 |
3.3. Simulation Tools
3.4. Description of the Photovoltaic Panel
3.5. Model Validation
- —
- Hourly MBE between ±10% and hourly RMSE smaller than 30%.
- —
- Monthly MBE between ±5% and monthly RMSE of less than 15%.
3.6. Experiment
4. Results and Discussion
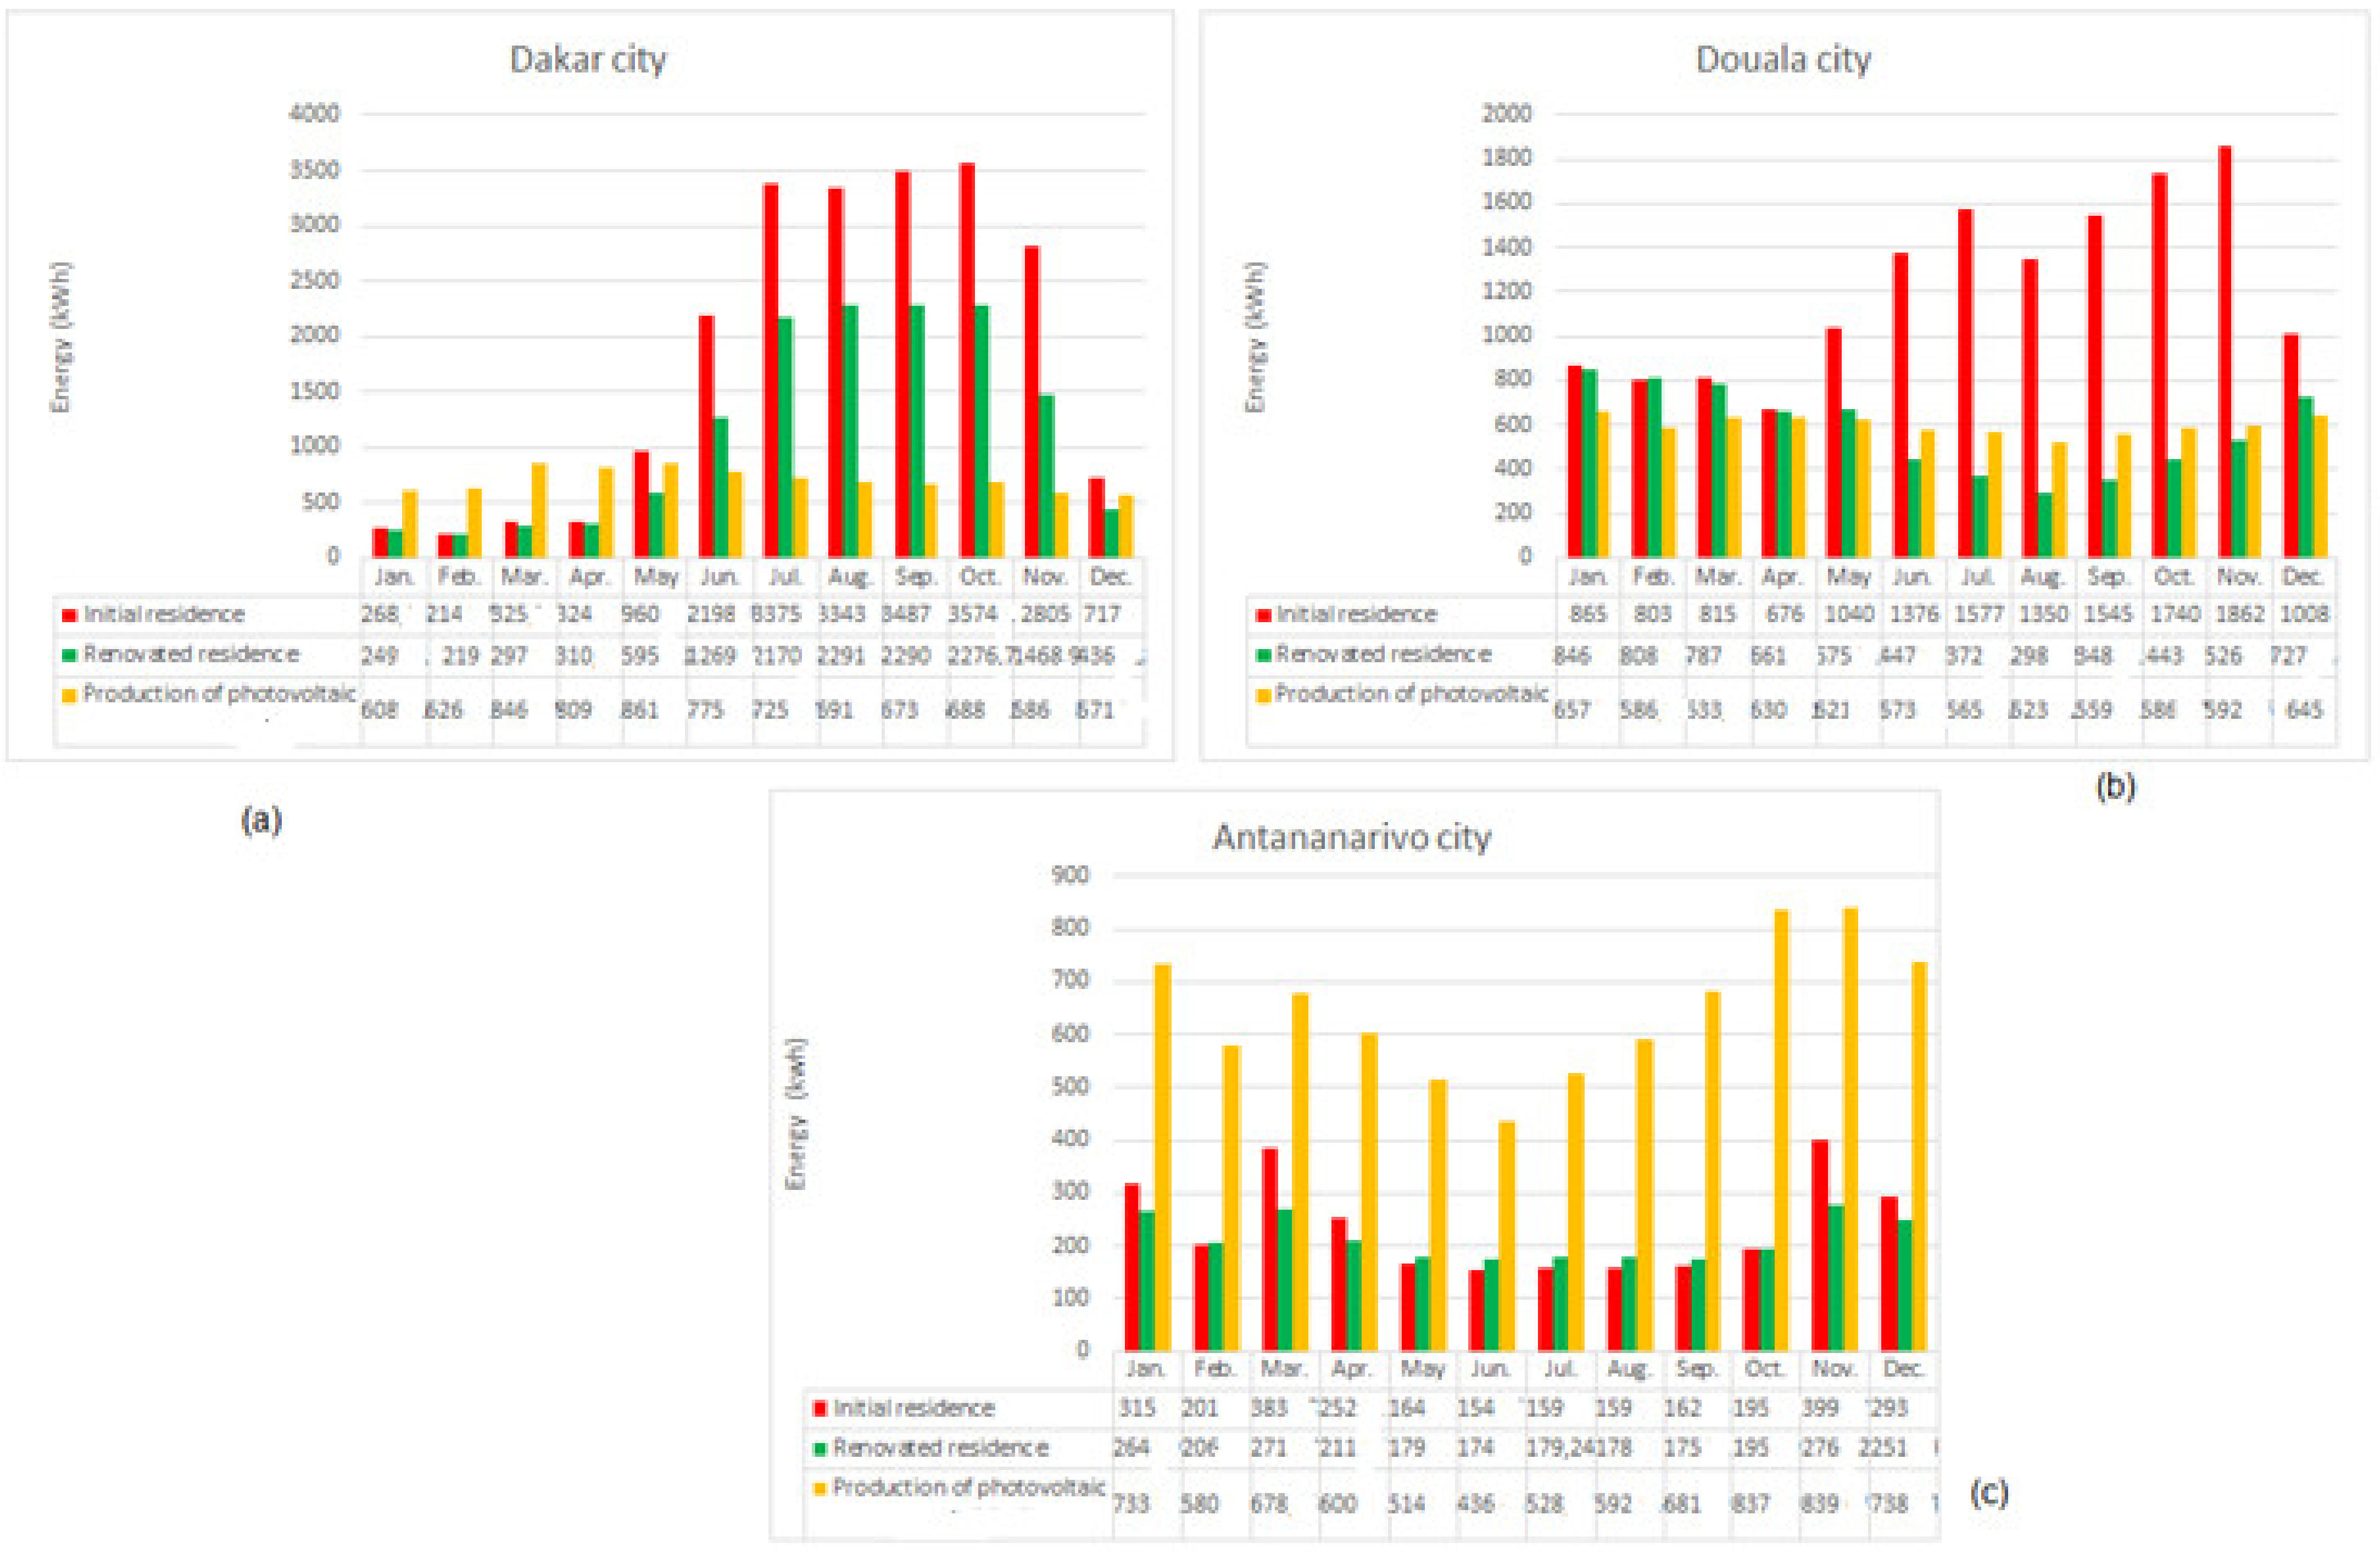
4.1. Case of Residence Building Located in the Tropical Region
4.1.1. Analysis of Indoor Conditions and Energy Consumption in Tropical Regions
4.1.2. Cost Analysis
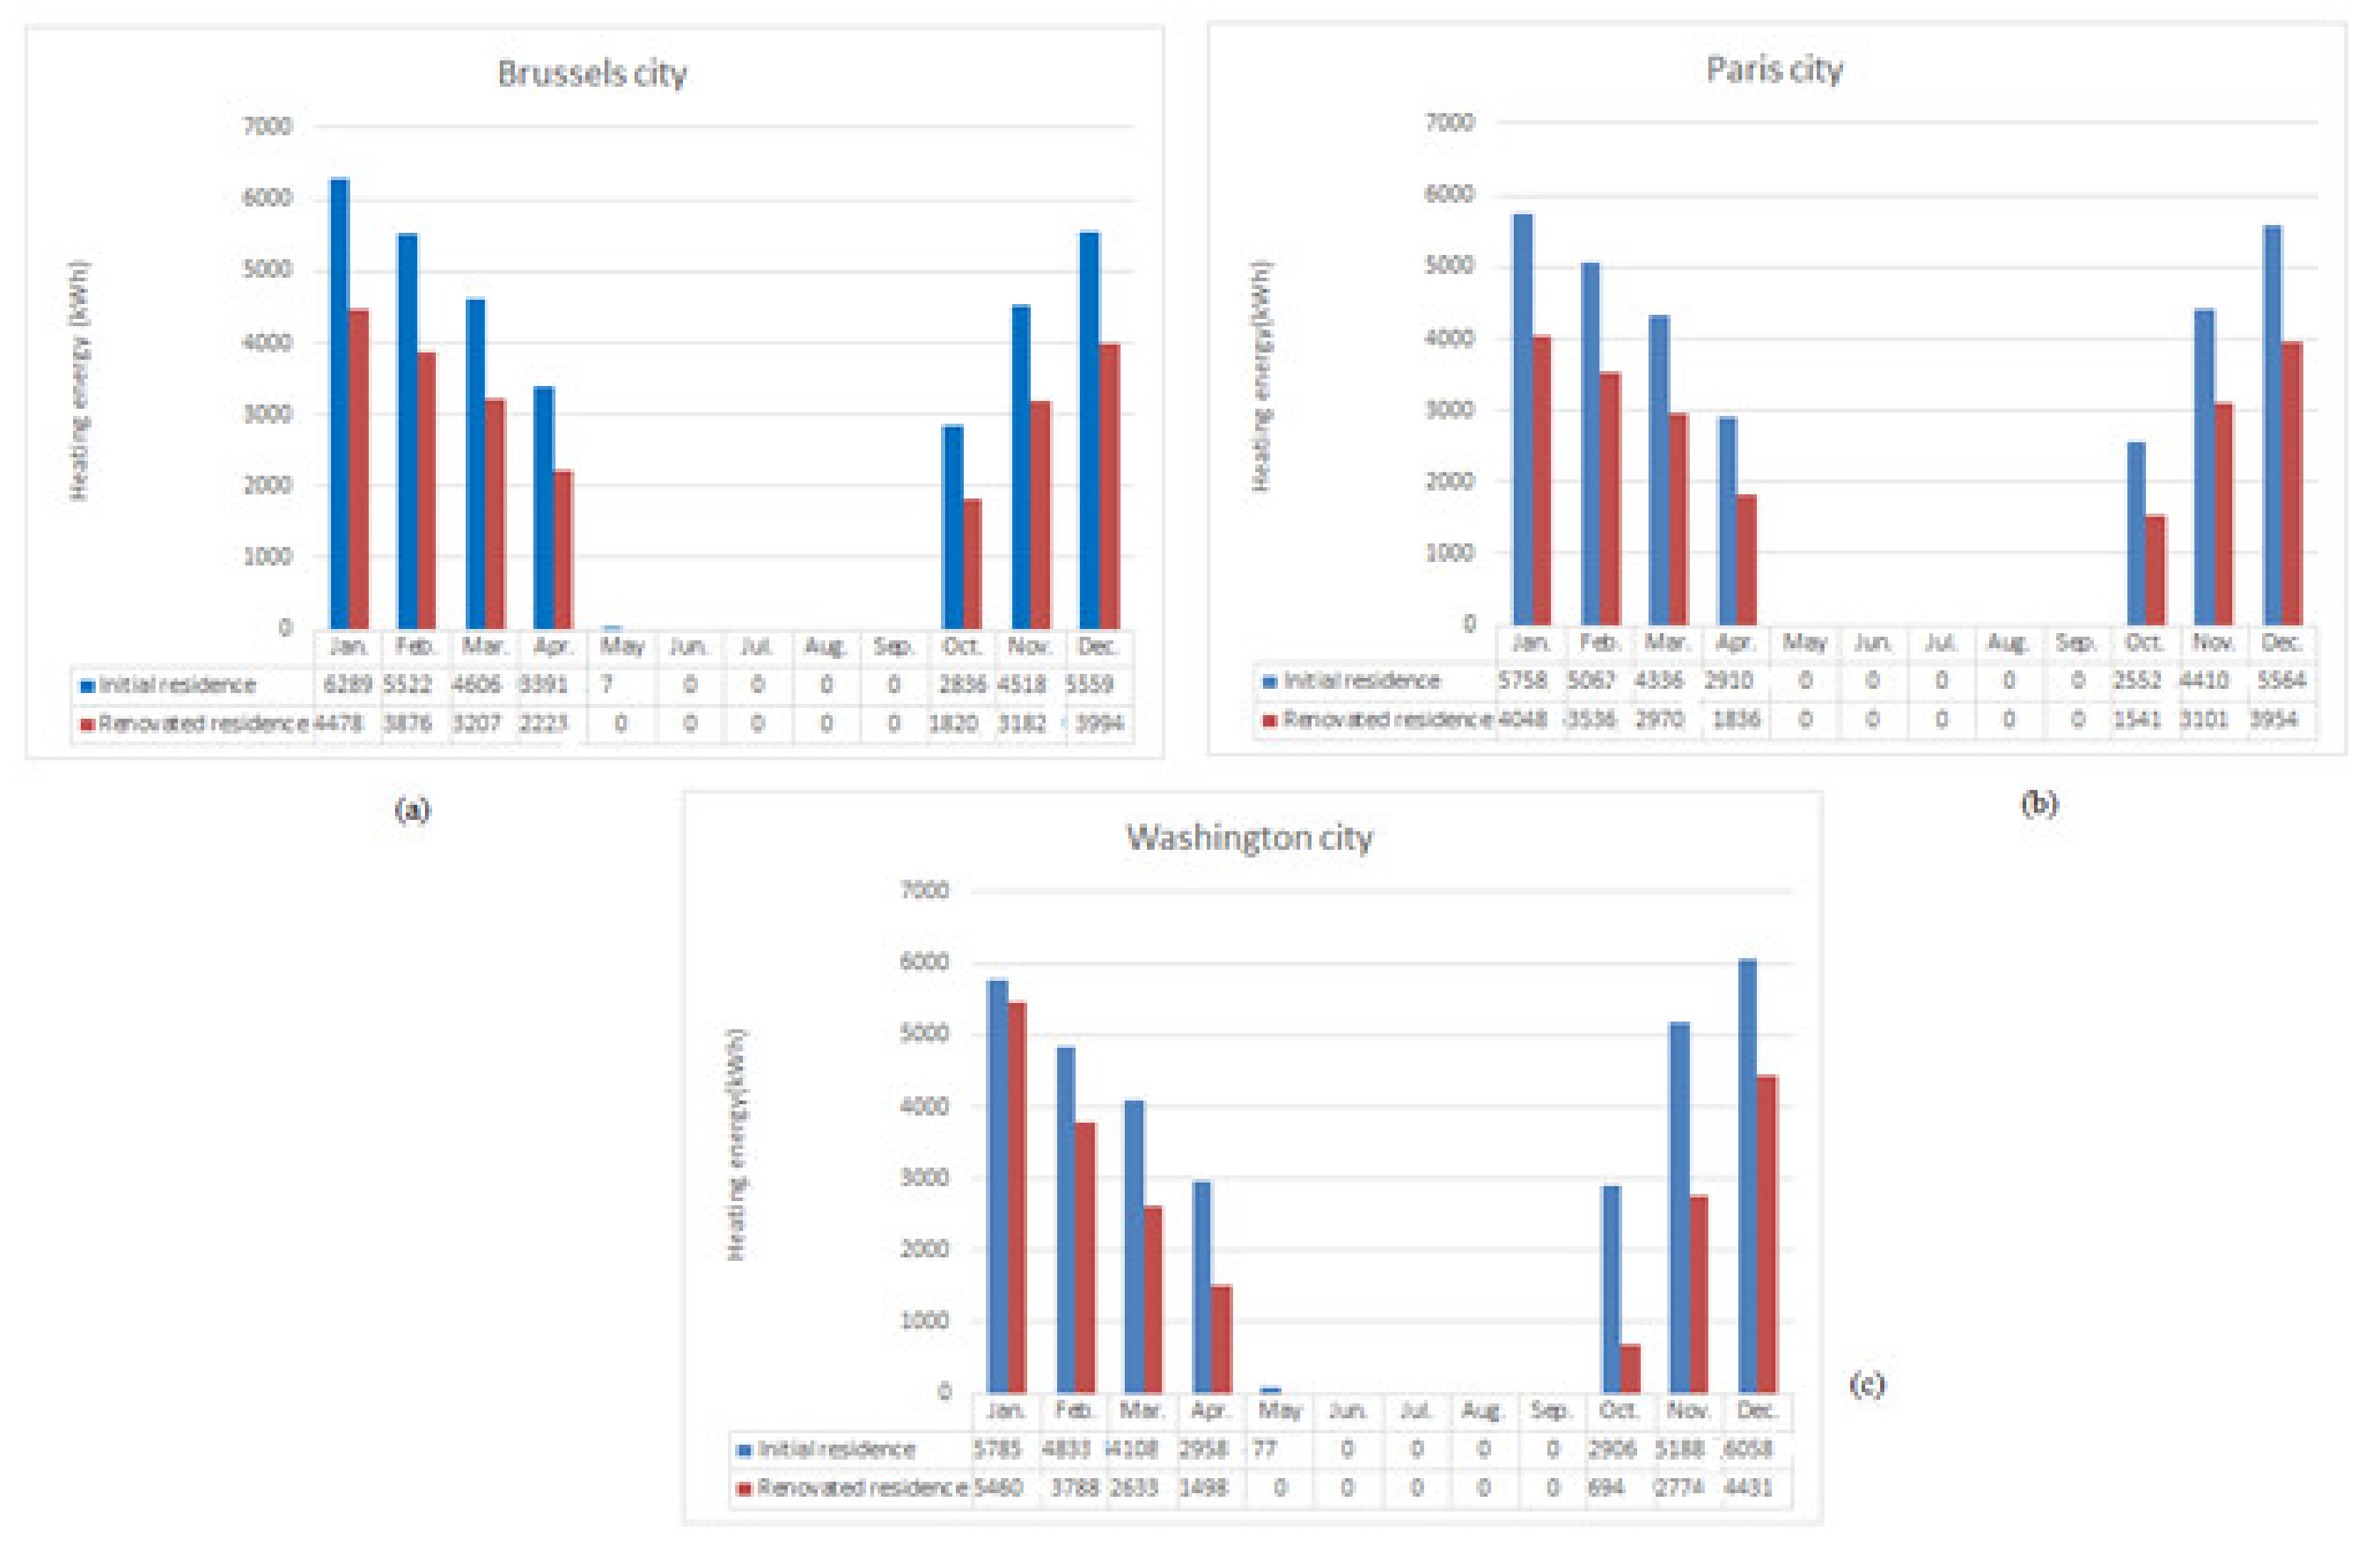
4.2. Case of Residence Building Located in the Temperate Region
4.2.1. Analysis of Indoor Conditions and Energy Consumption
4.2.2. Cost Analysis
5. Conclusions
Author Contributions
Funding
Institutional Review Board Statement
Informed Consent Statement
Data Availability Statement
Conflicts of Interest
References
- Liu, Z.; Davis, S.; Feng, K.; Hubacek, K.; Liang, S.; Anadon, L.; Chen, B.; Liu, J.; Yan, J.; Guan, D. Targeted opportunities to address the climate—Trade dilemma in China. Nat. Clim. Chang. 2015, 1, 5. [Google Scholar] [CrossRef]
- Crippa, M.; Oreggioni, G.; Guizzardi, D.; Muntean, M.; Schaaf, E.; Lo Vullo, E.; Solazzo, E.; Monforti-Ferrario, F.; Olivier, J.G.J.; Vignati, E. Fossil CO2 and GHG Emissions of Allworld Countries—2019 Report; Publications Office of the European Union: Luxembourg, 2019. [Google Scholar]
- Torcellini, P.; Pless, S.; Deru, M.; Crawley, D. Zero energy buildings: A critical look at the definition. In Proceedings of the 2006 ACEEE Summer Study on Energy Efficiency in Buildings, Pacific Grove, CA, USA, 14–18 August 2006. [Google Scholar]
- Nematchoua, M.K.; Yvon, A.; Roy, S.E.J.; Ralijaona, C.G.; Mamiharijaona, R.; Razafinjaka, J.N.; Tefy, R. A review on energy consumption in the residential and commercial buildings located in tropical regions of Indian Ocean: A case of Madagascar island. J. Energy Storage 2019, 24, 100748. [Google Scholar] [CrossRef]
- Feuille de Route des Acteurs de la Construction à Bruxelles: Vers une Économiecirculaire. Available online: https://www.circulareconomy.brussels/wp-content/uploads/2019/06/BE_beCircular_feuille-de-route-CD_def_FR1.pdf (accessed on 15 November 2020).
- Agence Parisienne du Climat. Batiments. Available online: https://www.apc-paris.com/plan-climat/batiments (accessed on 15 November 2020).
- U.S. Energy Information Administration. U.S. Energy-Related Carbon Dioxide Emissions. 2019. Available online: https://www.eia.gov/environment/emissions/carbon/ (accessed on 13 July 2021).
- Nematchoua, M.K. From existing neighbourhoods to net-zero energy and nearly zero carbon neighbourhoods in the tropical regions. Sol. Energy 2020, 211, 244–257. [Google Scholar] [CrossRef]
- Sameti, M.; Haghighat, F. Integration of distributed energy storage into net-zero energy district systems: Optimum design and operation. Energy 2018, 153, 575–591. [Google Scholar] [CrossRef]
- Shaw-Williams, D.; Susilawati, C.; Walker, G.; Varendorff, J. Towards net-zero energy neighbourhoods utilising high rates of residential photovoltaics with battery storage: A techno-economic analysis. Int. J. Sustain. Energy 2020, 39, 190–206. [Google Scholar] [CrossRef]
- Brown, H.S.; Vergragt, P.J. Bounded socio-technical experiments as agents of systemic change: The case of a zero-energy residential building. Technol. Forecast. Soc. Chang. 2008, 75, 107–130. [Google Scholar] [CrossRef]
- Yi, H.; Srinivasan, R.S.; Braham, W.W.; Tilley, D.R. An ecological understanding of net-zero energy building: Evaluation of sustainability based on emergy theory. J. Clean. Prod. 2017, 143, 654–671. [Google Scholar] [CrossRef]
- Szalay, Z.; Zöld, A. Definition of nearly zero-energy building requirements based on a large building sample. Energy Policy 2014, 74, 510–521. [Google Scholar] [CrossRef]
- Zhou, Z.; Feng, L.; Zhang, S.; Wang, C.; Chen, G.; Du, T.; Li, Y.; Zuo, J. The operational performance of “net zero energy building”: A study in China. Appl. Energy 2016, 177, 716–728. [Google Scholar] [CrossRef]
- Srinivasan, R.; Braham, W.W.; Campbell, D.E.; Curcija, C.D. Re (De) fining Net Zero Energy: Renewable Energy balance in environmental building design. Build. Environ. 2012, 47, 300–315. [Google Scholar] [CrossRef]
- Robert, A.; Kummert, M. Designing net-zero energy buildings for the future climate, not for the past. Build. Environ. 2012, 55, 150–158. [Google Scholar] [CrossRef]
- Pikas, E.; Thalfeldt, M.; Kurnitski, J. Cost optimal and nearly zero energy building solutions for office buildings. Energy Build. 2014, 74, 30–42. [Google Scholar] [CrossRef]
- Pulido Arcas, J.A.; Rubio-Bellido, C.; Perez-Fragallo, A.; Orpeza-Perez, I. Net zero energy buildings and low carbon emission, a case of study of Madagascar Island. In Zero-Energy Buildings—New Approaches and Technologies; IntechOpen: London, UK, 2020. [Google Scholar]
- SPW Energie. Dépliant—Exigences PEB. 2017. Available online: https://energie.wallonie.be/fr/exigences-peb.html?IDC=9136 (accessed on 17 November 2020).
- Les Criteres du Passif. Available online: https://www.maisonpassive.be/?Les-criteres-du-passif (accessed on 21 November 2020).
- Comment le Tarif de L’électricité Est-Il Fixé en 2021? Available online: https://www.comparateur-energie.be/blog/prix-electricite-belgique/#evolution (accessed on 13 July 2021).
- Wikipedia. The Free Encyclopedia. Available online: https://en.wikipedia.org/wiki/Washington (accessed on 13 July 2021).
- Nematchoua, M.K.; Orosa, J.A.; Buratti, C.; Obonyo, E.; Rim, D.; Ricciardi, P.; Reiter, S. Comparative analysis of bioclimatic zones, energy consumption, CO2 emission and life cycle cost of residential and commercial buildings located in a tropical region: A case study of the big island of Madagascar. Energy 2020, 202, 117754. [Google Scholar] [CrossRef]
- DUALSUN. Available online: https://news.dualsun.com/co-en/12/2014/what-is-the-optimal-orientation-and-tilt-angle-for-solar-panels/ (accessed on 13 July 2021).
- Nematchoua, M.K.; Tchinda, R.; Orosa, J.A. Adaptation and comparative study of thermal comfort in naturally ventilated classrooms and buildings in the wet tropical zones. Energy Build 2014, 85, 321–328. [Google Scholar] [CrossRef] [Green Version]
- ASHRAE Guideline 14-2002: Measurement of Energy and Demand Savings; ASHRAE: Atlanta, GA, USA, 2002.
- Nematchoua, M.K.; Ricciardi, P.; Buratti, C. Statistical analysis of indoor parameters an subjective responses of building occupants in a hot region of Indian ocean; a case of Madagascar island. Appl. Energy 2017, 208, 1562–1575. [Google Scholar] [CrossRef] [Green Version]
- Nematchoua, M.K.; Noelson, J.C.V.; Saadi, I.; Kenfack, H.; Andrianaharinjaka, A.-Z.F.; Ngoumdoum, D.F.; Sela, J.B.; Reiter, S. Application of phase change materials, thermal insulation, and external shading for thermal comfort improvement and cooling energy demand reduction in an office building under different coastal tropical climates. Sol. Energy 2020, 207, 458–470. [Google Scholar] [CrossRef]
- Nematchoua, M.K.; Mahsan, S.; Sigrid, R. Strategies and scenarios to reduce energy consumption and CO2 emission in the urban, rural and sustainable neighbourhoods. Sustain. Cities Soc. 2021, 72, 103053. [Google Scholar] [CrossRef]
- Nematchoua, M.K.; Roshan, G.R.; Tchinda, R.; Nasrabadi, T.; Ricciardi, P. Climate change and its role on forecasting the Energy demand in buildings, Case study of Douala City, Cameroon. J. Earth Syst. Sci. 2015, 124, 269–281. [Google Scholar] [CrossRef]
- Nematchoua, M.K.; Nishimwe, A.M.-R.; Reiter, S. Towards Nearly Zero-Energy Residential Neighbourhoods in the European Union: A case study. Renew. Sustain. Energy Rev. 2021, 135, 110198. [Google Scholar] [CrossRef]
- Fortman, D.J.; Brutman, J.P.; De Hoe, G.X.; Snyder, R.L.; Dichtel, W.R.; Hillmyer, M.A. Approaches to sustainable and continually recyclable cross-linked polymers. ACS Sustain. Chem. Eng. 2018, 6, 11145–11159. [Google Scholar] [CrossRef] [Green Version]
- Zhu, Y.; Yan, Y.; Zheng, F.; Ge, J.; Gu, Y. Research on the Renovation of Historical Buildings and Improvement of the Residential Environment of Hangzhou Zhuyangxin Plaster Store. J. Asian Arch. Build. Eng. 2010, 9, 395–402. [Google Scholar] [CrossRef]
- Aktas, Y.D.; Wang, K.; Zhou, Y.; Othman, M.; Stocker, J.; Jackson, M.; Hood, C.; Carruthers, D.; Latif, M.T.; D’Ayala, D.; et al. Outdoor Thermal Comfort and Building Energy Use Potential in Different Land-Use Areas in Tropical Cities: Case of Kuala Lumpur. Atmosphere 2020, 11, 652. [Google Scholar] [CrossRef]
- Nematchoua, M.K.; Reiter, S. Evaluation of bioclimatic potential, energy consumption, CO2-emission, and life cycle cost of a residential building located in Sub-Saharan Africa; a case study of eight countries. Sol. Energy 2021, 218, 512–524. [Google Scholar] [CrossRef]
- Olonscheck, M.; Holsten, A.; Kropp, J. Heating and cooling energy demand and related emissions of the German residential building stock under climate change. Energy Policy 2011, 39, 4795–4806. [Google Scholar] [CrossRef]


| Type of Building Construction | Building Energy Performance (2014) | Building Energy Performance (2017) | Nearly Zero-Energy Building (2021) |
|---|---|---|---|
| Overall level of thermal insulation (kWh/m2year) | ≤35 | ≤35 | ≤35 |
| Overall energy performance of the building (residential building) (kWh/m2year) | ≤80 | ≤65 | ≤45 |
| Overall energy performance of the building (commercial building) (kWh/m2year) | ≤80 | € (65–90) | € (45–90) |
| Primary energy demand (kWh/m2year) | ≤130 | ≤115 | ≤85 |
| Passive Building | Criteria |
|---|---|
| Heating energy (kWh/m2year) | ≤15 |
| Primary energy (kWh/m2year) | ≤120 |
| Air tightness (vol/h) | ≤0.6 |
| Annual overheating hours (>25 °C) | ≤5% |
| Parameters (Renovated Residence = After Applying Renovation, Passive Strategy, and Green Energy) | Building Located in the Tropical Region | Building Located in the Temperate Region | ||
|---|---|---|---|---|
| Initial State | After Renovation | Initial State | After Renovation | |
| Height (m) | 3.5 | 3.5 | 3.5 | 3.5 |
| Area (m2) | 342.0 | 342.0 | 342.0 | 342.0 |
| Activity template | Domestic House | Domestic House | TM_3-Bed Living Kitchen | TM_3-Bed Living Kitchen |
| Occupancy density (people/m2) | 0.0230 | 0.0230 | 0.0303 | 0.0303 |
| Activity (met) | 0.9 | 0.9 | 0.9 | 0.9 |
| Clothing (Clo) | 0.5–1.0 | 0.5–1.0 | 0.5–1.0 | 0.5–1.0 |
| DHW: consumption rate (l/m2-day) | 0.53 | 0.53 | 0.72 | 0.52 |
| Fresh air (l/s-person) | 10 | 10 | 10 | 10 |
| Lighting: target luminance (lux) | 100 | 100 | 125 | 100 |
| Computer: power density(W/m2) | 0.200 | 0.180 | 0.200 | 0.105 |
| Other equipment: power density (W/m2) | 3.58 | 3.58 | 3.58 | 3.58 |
| Occupancy schedule | 24/7 | 24/7 | 24/7 | 24/7 |
| Construction template | Project construction template | Project-construction template | Project construction template | Project construction template |
| Air tightness (vol/h) | 0.5 | 0.5 | 0.5 | 0.5 |
| Glazing template | Project glazing template | Project glazing template | Project glazing template | Project glazing template |
| Glazing type | Preferred height 1.5 m, 30% glazed Thickness: 5.5 cm | Preferred height 1.5 m, 30% glazed Thickness: 5.5 cm | Preferred height 1.5 m, 30% glazed Thickness: 5.5 cm | Preferred height 1.5 m, 30% glazed Thickness: 5.5 cm |
| Local shading | No | 1.0 m overhang | No | 1.0 m overhang |
| Lighting template | Incandescent | LED | Incandescent | LED |
| Lighting control | No | Yes | No | Yes |
| Lighting schedule | 24/7 | Mon.–Sun. 6 p.m.–7 a.m. | 24/7 | Mon.–Sun. 6 p.m.–7 a.m. |
| HVAC template | Fan coil unit (4-pipe) Air Cooler chiller | Fan coil unit (4-pipe) with district cooling | Oil heating | Fan coil unit (4-pipe) with district heating+ cooling |
| HVAC Schedule | 12/7 | 6/7 | 24/7 | 24/7 |
| Heating: Fuel | No | No | Natural gas, COP = 0.9 | Natural gas, COP = 0.9 |
| Cooling: Fuel | Electricity from grid | Electricity from green energy | Electricity from grid | Electricity from green energy |
| Other ventilation | Natural ventilation (NV) | Natural ventilation (NV) | Natural ventilation (NV) | Natural ventilation (NV) |
| Month | January | February | March | April | May | June | July | August | September | October | November | December | |
|---|---|---|---|---|---|---|---|---|---|---|---|---|---|
| Original Residence building | Antananarivo | 25.21 | 24.83 | 25.47 | 24.64 | 23.45 | 21.74 | 20.75 | 21.10 | 23.27 | 24.51 | 25.56 | 25.12 |
| Douala | 26.66 | 26.59 | 26.36 | 26.13 | 26.17 | 25.80 | 25.35 | 25.04 | 25.10 | 25.62 | 26.05 | 26.54 | |
| Dakar | 24.66 | 24.84 | 25.18 | 25.19 | 26.00 | 26.64 | 27.04 | 26.98 | 27.20 | 27.20 | 26.91 | 25.90 | |
| Residence after renovation | Antananarivo | 25.25 | 25.02 | 25.33 | 24.48 | 23.27 | 21.75 | 20.75 | 21.03 | 23.08 | 24.56 | 25.44 | 25.21 |
| Douala | 26.19 | 26.24 | 26.10 | 25.88 | 25.89 | 25.49 | 25.14 | 24.96 | 25.08 | 25.41 | 25.52 | 26.04 | |
| Dakar | 24.78 | 24.96 | 25.21 | 25.30 | 25.82 | 26.46 | 26.92 | 26.91 | 27.05 | 27.02 | 26.71 | 25.75 | |
| Cities | Antananarivo | Douala | Dakar | Total | |
|---|---|---|---|---|---|
| Residence in the initial state | Energy demand (kWh) | 3149.31 | 10,276.65 | 21,593.81 | |
| Carbon emission rate (kg CO2) | 1722.95 | 7366.85 | 13,085.86 | ||
| Renovated residence (applying: renovation + passive strategies + PV) | Surface of installed photovoltaic panels (m2) | 16 | 34 | 58 | |
| Cooling energy (kWh) | 0.00 | 0.00 | 0.00 | ||
| Energy demand (kWh) | 2564.80 | 6944.28 | 13,874.95 | 0 | |
| Green energy generated (kWh) | −2565.00 | −6944.30 | −13,875.01 | ||
| Carbon emission rate (kg CO2) | −3149.30 | −140.51 | 3278.49 | ||
| Currency and Exchange Rate | |
|---|---|
| Currency Symbol | $ |
| Applicable construction labour Hours and local cost index | |
| Regional material cost index | 0.06 |
| Hourly labour rate worker | $0.23–3.01 |
| Hourly labour rate craftsman | $0.21–1.9 |
| Discount factor (capital cost) and inflation | |
| Discount rate (cost of capital) | 18.0% |
| General inflation rate | 8.0% |
| Energy inflation rate | 6.2% |
| Water inflation rate | 5.2% |
| EOL as % of capex | 1.5% |
| Initial state of the building | Parameters | Values |
| Residence area | 342 m2 | |
| Annual heating requirements | 0 | |
| building life cycle | 50 years | |
| Price of the closed building structural work | 30,000 € including VAT | |
| Electricity price | 0.15 € per kWh | |
| Electricity consumption | 2564.8 kWh per year | |
| Electricity cost | 19,236 € for 50 years | |
| Residence building+ PV installed | The price of the closed building structural work | 32,400 € including VAT |
| PV cost | 2400 € | |
| Saving cost | 16,836 € for 50 years | |
| Payback | 6.23 years |
| Month | Jan. | Feb. | Mar | Apr | May | Jun. | Jul. | Aug | Sep. | Oct. | Nov | Dec | |
|---|---|---|---|---|---|---|---|---|---|---|---|---|---|
| Original residence | Brussels | 16.42 | 16.56 | 17.42 | 18.09 | 16.94 | 18.65 | 21.56 | 21.19 | 17.65 | 18.57 | 17.41 | 16.85 |
| Paris | 16.74 | 16.81 | 17.53 | 18.30 | 18.20 | 20.33 | 22.53 | 23.12 | 19.50 | 18.69 | 17.53 | 16.87 | |
| Washington | 15.90 | 16.66 | 17.83 | 18.60 | 20.72 | 23.80 | 25.02 | 24.32 | 22.23 | 20.08 | 17.78 | 16.60 | |
| Renovated residence | Brussels | 15.87 | 15.93 | 16.61 | 17.36 | 15.75 | 17.63 | 20.55 | 20.00 | 16.53 | 17.94 | 16.78 | 16.24 |
| Paris | 16.11 | 16.05 | 16.74 | 17.62 | 17.02 | 19.24 | 21.64 | 22.16 | 18.12 | 18.03 | 16.76 | 16.03 | |
| Washington | 16.13 | 16.26 | 16.89 | 17.45 | 14.16 | 16.87 | 21.10 | 21.19 | 19.19 | 17.70 | 16.23 | 16.18 | |
| Cities | Brussels | Paris | Washington | |
|---|---|---|---|---|
| Initial building | Cooling electricity (kWh/m2) | 1.02 | 2.46 | 2.48 |
| Heating and domestic hot water (Gas) (kWh/m2) | 37.71 | 34.96 | 33.20 | |
| Electricity demand (kWh/m2) | 25.46 | 24.90 | 22.06 | |
| Carbon emission rate (kg CO2/m2) | 18.64 | 18.39 | 16.89 | |
| Revised building | Surface of installed photovoltaic panels (m2) for a building area of 342 m² | 58.00 | 45.00 | 42.00 |
| Green electricity produced by gas cogeneration (kWh/m2) | 40.96 | 38.99 | 37.03 | |
| Heating and domestic hot water (Gas cogeneration) (kWh/m2) | 37.71 | 34.96 | 33.20 | |
| Cooling electricity (kWh/m2) | 0 | 0 | 0 | |
| Electricity demand (kWh/m2) | 20.36 | 18.77 | 14.54 | |
| Green electricity generated (kWh/m2) | −17.11 | −14.74 | −10.71 | |
| Carbon emission rate (kg CO2/m2) | −2.60 | −0.11 | 2.17 | |
| Buildings | Parameters | Values |
|---|---|---|
| Initial state of the building | Initial investment | 350,000 € including VAT |
| Area | 342 m2 | |
| Annual heating requirements (case of Brussels) | 13.81 kWh/m2 | |
| Electricity price | 0.25 €/kWh | |
| Residence building + PV installed | The price of the closed building structural work | 385,000 € |
| Price of energy demand (cooling+ heating+ electricity+ domestic hot water) | 9163.5 € per year | |
| Payback | 3.8 years |
Publisher’s Note: MDPI stays neutral with regard to jurisdictional claims in published maps and institutional affiliations. |
© 2021 by the authors. Licensee MDPI, Basel, Switzerland. This article is an open access article distributed under the terms and conditions of the Creative Commons Attribution (CC BY) license (https://creativecommons.org/licenses/by/4.0/).
Share and Cite
Nematchoua, M.K.; Orosa, J.A.; Ricciardi, P.; Obonyo, E.; Sambatra, E.J.R.; Reiter, S. Transition to Zero Energy and Low Carbon Emission in Residential Buildings Located in Tropical and Temperate Climates. Energies 2021, 14, 4253. https://doi.org/10.3390/en14144253
Nematchoua MK, Orosa JA, Ricciardi P, Obonyo E, Sambatra EJR, Reiter S. Transition to Zero Energy and Low Carbon Emission in Residential Buildings Located in Tropical and Temperate Climates. Energies. 2021; 14(14):4253. https://doi.org/10.3390/en14144253
Chicago/Turabian StyleNematchoua, Modeste Kameni, José A. Orosa, Paola Ricciardi, Esther Obonyo, Eric Jean Roy Sambatra, and Sigrid Reiter. 2021. "Transition to Zero Energy and Low Carbon Emission in Residential Buildings Located in Tropical and Temperate Climates" Energies 14, no. 14: 4253. https://doi.org/10.3390/en14144253
APA StyleNematchoua, M. K., Orosa, J. A., Ricciardi, P., Obonyo, E., Sambatra, E. J. R., & Reiter, S. (2021). Transition to Zero Energy and Low Carbon Emission in Residential Buildings Located in Tropical and Temperate Climates. Energies, 14(14), 4253. https://doi.org/10.3390/en14144253