Article

Evaluation of Sustainable Energy Development Progress in EU Member States in the Context of Building Renovation

by
Rita Remeikienė
1,*,
Ligita Gasparėnienė
1,
Aleksandra Fedajev
2,
Marek Szarucki
3,
Marija Đekić
4 and
Jolita Razumienė
5
1
Public Safety Academy, Mykolas Romeris University, LT-08303 Vilnius, Lithuania
2
Engineering Management Department, Technical Faculty in Bor, University of Belgrade, 19210 Bor, Serbia
3
Department of Strategic Analysis, Cracow University of Economics, 31-510 Krakow, Poland
4
Faculty of Business Economics and Entrepreneurship, 11000 Belgrade, Serbia
5
Agency for Science, Innovation and Technology, LT-01108 Vilnius, Lithuania
*
Author to whom correspondence should be addressed.
Energies 2021, 14(14), 4209; https://doi.org/10.3390/en14144209
Submission received: 7 June 2021 / Revised: 22 June 2021 / Accepted: 28 June 2021 / Published: 12 July 2021

Abstract

:
The main goal of setting energy efficiency priorities is to find ways to reduce energy consumption without harming consumers and the environment. The renovation of buildings can be considered one of the main aspects of energy efficiency in the European Union (EU). In the EU, only 5% of the renovation projects have been able to yield energy-saving at the deep renovation level. No other study has thus far ranked the EU member states according to achieved results in terms of increased usage in renewable sources, a decrease in energy usage and import, and reduction in harmful gas emissions due to energy usage. The main purpose of this article is to perform a comparative analysis of EU economies according to selected indicators related to the usage of renewable resources, energy efficiency, and emissions of harmful gasses as a result of energy usage. The methodological contribution of our study is related to developing a complex and robust research method for investment efficiency assessment allowing the study of three groups of indicators related to the usage of renewable energy sources, energy efficiency, and ecological aspects of energy. It was based on the PROMETHEE II method and allows testing it in other time periods, as well as modifying it for research purposes. The EU member states were categorized by such criteria as energy from renewables and biofuels, final energy consumption from renewables and biofuels, gross electricity generation from renewables and biofuels and import dependency, and usage of renewables and biofuels for heating and cooling. The results of energy per unit of Gross Domestic Product (GDP), Greenhouse gasses (GHG) emissions per million inhabitants (ECO2), energy per capita, the share of CO2 emissions from public electricity, and heat production from total CO2 emissions revealed that Latvia, Sweden, Portugal, Croatia, Austria, Lithuania, Romania, Denmark, and Finland are the nine most advanced countries in the area under consideration. In the group of the most advanced countries, energy consumption from renewables and biofuels is higher than the EU average.

1. Introduction

The term “energy efficiency” in its broad sense is associated with the rational use of energy resources [1]. Recently, however, the meaning and significance of this term have expanded considerably—in addition to the purely economic aspect of the use of energy (i.e., the aspect of resource-saving), the term “energy efficiency” has started covering the issues of inefficient and sometimes even irrational energy consumption detrimental to both consumers and the environment. In this context, the main goal of setting energy efficiency priorities is to find ways to reduce energy consumption without harming consumers and the environment.
To achieve the EU’s long-term energy and climate goals, the European Commission [2] adopted the EU sustainable development strategy, aimed at tapping the ecological and social potential of the economy and developing the actions that are necessary to be undertaken so that a continuous long-term improvement of the EU population’s quality of life would be achieved through the efficient use of resources. The general objectives set in the strategy were predominantly environmental (climate change prevention, use of clean energy, sustainable consumption and production, and sustainable use of natural resources) [2]. Based on the aims established in the strategy, the relevant legislative landscape was formed. The climate and energy targets for 2020 were set in the Climate and Energy Package—a set of laws passed in 2020 that required the cut in greenhouse gas emissions by 20% (in comparison to the levels of 1990) to raise production of energy from renewable resources by 20%, and improve energy efficiency by 20% by 2020 [3]. Within the 2030 Climate and Energy Framework, which sets the EU-wide targets and policy objectives for the period 2021–2030, greenhouse gas emissions must be reduced by at least 40% (compared to the levels of 1990), the minimum share of renewable energy must amount to 32% of the total energy use of the EU, and energy efficiency must improve by at least 32.5% [4].
The renovation of buildings can be considered one of the main aspects of energy efficiency in the EU. According to the statistics provided by the European Commission, energy consumption of buildings accounts for around 40% of the total energy consumption, and exploitation of buildings generates more than one-third of CO2 emissions within the EU [5]. This is the largest energy end-use sector. The statistical data provided within the ODYSSEE-MURE project on energy efficiency and policy monitoring [6] indicate that “final energy consumption of buildings has increased by around 1%/year since 1990 and by 2.4%/year for electricity at EU level” (p. iv), and annual unit consumption per m2 amounted to around 220 kWh/m2 in 2009. Based on the statistics above, the renovation of buildings is one of the tools for achieving the EU’s long-term energy and climate goals. Since the largest part of the EU’s current building stock was built prior to the energy performance standards, the renovation of buildings offers a high potential for energy saving [7].
Building renovation policy in the EU is based on the Directives on the energy performance of buildings (EPBD) and energy efficiency (EED). Also, research and innovation projects are implemented through the intelligent energy Europe (IEE), 7th framework programme (FP7), European structural and investment funds (ESIF), and the more recent Horizon 2020 program, which continues the support that has already been given through the IEE and FP7. The above-mentioned measures create the preconditions for integrally renovating buildings, following the principles of balancing and urban planning, and allow adopting the most relevant cross-sector solutions to achieve a synergy effect. Nevertheless, the estimations of the European Commission [7] propose that neither the rate nor the depth of the current energy renovation (0.4–1.2% depending on a member state) lives up to the energy savings potential in terms of renovating buildings. Despite the EU-wide systemic measures, there are still many problems with building renovation in practice. According to [8], thus far, only 5% of the renovation projects have been able to yield energy-saving at the deep renovation level. Although renovation solutions are available, renovation processes are expensive and prolonged, and a variety of technical complexities hinders the achievement of energy-saving goals within the EU. Thus, although the renovation of buildings has a great potential for energy saving, much of this potential remains untapped. For this reason, it is relevant to research how advanced the EU member states are in exploiting their energy-saving potential through the renovation of buildings.
Previous literature contains a number of the studies that identify the drivers and barriers to the energy-efficient renovation of buildings in the EU [5,9,10,11,12,13,14], but to the best of our knowledge, no other study has thus far ranked the EU member states according to achieved results in terms of increased usage in renewable sources, a decrease in energy usage and import, and reduction in harmful gas emissions due to energy usage. Hence, the main purpose of this article is to perform a comparative analysis and evaluate the sustainable energy development progress in the EU member states in the context of building renovation. The defined purpose was detailed into the following objectives: (1) to review the findings of previous studies on the major drivers and barriers to the energy-efficient renovation of buildings in the EU; (2) to present and substantiate the research methodology; (3) to rank the EU member states on the mentioned indicators. The methods of the research include comparative literature analysis, PROMETHEE II, and entropy method.

2. The Major Drivers and Barriers to the Energy-Efficient Renovation of Buildings in the EU: Literature Review

Several studies [8,15,16] indicate that energy-efficient renovation of buildings is not on par with its potential, and, according to the Buildings Performance Institute Europe’s (BPIE’s) [11] data, due to the insufficient monitoring, it is even difficult to estimate whether the target of a 3% annual rate is being achieved.
To intensify the pace and scope of the energy-efficient renovation of buildings, as recently proposed in the Climate and Energy Strategy for 2050 developed by the European Commission [17], in particular, it is relevant to identify what factors are driving this process and what barriers impede its running. As it was noted by Beillan et al. [9], many problems arise because buildings, either public or private, possess different characteristics, market stakeholders are of extremely diffuse character, the process of renovation contains unique technical specificities, both house owners and contractors lack the information about the innovative methods of work and potential efficiency gains, funding instruments are insufficient and/or hardly available, etc.
The major drivers and barriers to the energy-efficient renovation of buildings in the EU systematized based on literature analysis are provided in Table 1.
The information in Table 1 shows that the drivers to the energy-efficient renovation of buildings in the EU can be categorized as economic, financial, political, information and communication-related, socio-cultural, and environmental.
The category of the economic drivers covers boosting the real estate value and residents’ profit (lower bills). By employing on-site surveys (qualitative interviews), Beillan et al. [9] analyzed the weight of particular socio-economic factors (willingness and skills of stakeholders, regulation and incentives, norms and values) in the house renovation decision-making process in five European countries (Germany, Switzerland, Italy, Spain, and France) and found that the main drivers to the renovation of residential buildings are the prospects to raise the real estate (housing) value and renovation-associated benefits (lower bills and greater comfort for dwellers). The study revealed that boosting the real estate value through retrofitting is a more influential driver for renovating apartment blocks than detached houses, while the benefits of cost-saving and greater comfort are more important to owners of detached houses.
The significance of economic drivers (which can be collectively referred to as increased profit for a stakeholder) is highlighted in many previous studies on the issue under consideration, and most of them disclose the large potential of savings [7,18,19].
In the category of the financial drivers, the amount and nature of the financial support available are recognized as the key factors significantly affecting an owners’ decision to start renovation projects, especially collective ones [9]. In this context, the major role is played by the relevant and timely provision of such financial instruments as subsidies, grants for research, innovation and demonstration projects, and tax incentives [10].
In the category of the political drivers, improvement of the process and regulatory framework, i.e., establishment of mandatory building codes, energy performance standards, and energy efficiency obligation schemes [10], can be distinguished as the most influential. Bjorneboe et al. [21] also suggest the provision of the long-term regulation on the maximum energy consumption allowed per house.
In the category of the information and communication-related drivers, the significance of the availability of the relevant information is emphasized in particular. The information for both property owners and contractors can be provided by local advisory bodies, professional consultants, or project managers; by ensuring that the information is disseminated through the media, the stakeholders can find it attractive to analyze the information themselves [9]. Artola et al. [9] also propose invoking awareness-raising and information campaigns, issuing EU energy performance certificates, and pursuing energy labeling schemes.
In the category of the socio-cultural drivers, the prospects to boost the real estate value and cost-saving were found to be closely linked to the population’s social and cultural values in terms of socio-economic well-being [7] manifesting itself, for instance, through greater comfort or enhancing one’s image when living in a renovated house. The survey conducted by the European Commission [7] revealed that motivation to perform energy renovations might depend on consumers’ age (younger consumers have more confidence in the success of renovation projects) or income (consumers with higher income are more motivated).
Finally, in the category of the environmental drivers, the stakeholders can be driven by the idea that they contribute to protection from global warming and help to raise the proportion of renewable energy used [7].
Regarding the barriers to the energy-efficient renovation of buildings in the EU, the literature analysis helped to categorize them as economic, financial, political, information and communication-related, technical and industrial, administrative and regulatory, and supply-side.
In the category of economic barriers, researchers primarily emphasize the negative role of high expenses and the opaqueness of costs. According to Artola et al. [9], the costs that become a burden for property owners and landlords include assessment costs, installation costs, financing costs, costs of understanding regulations, and hidden costs. For authorities, these costs refer to information, set-up, administrating, and monitoring costs. The costs being high, not all stakeholders can afford them, even if a part of the costs is covered by the EU funds [7].
In the category of the financial barriers, property owners are discouraged by insufficient financial support available or are reluctant to borrow funds for renovations because they are afraid to incur large debt obligations, especially when the share of national funding under the relevant programs is cut, which means higher personal indebtedness in the long run and is particularly unattractive to low- and even middle-income homeowners [12]. The long payback period from investments in renovation is another discouraging factor [16]. The survey conducted by the EU Commission [7] also revealed that one of the barriers is tenants’ distrust of landlords in terms of equal distribution of financial benefits, i.e., tenants are often concerned that the bulk of the benefits will be reaped by landlords. Thus, current investment in the renovation of buildings remains at the suboptimal level [16].
In the category of political barriers, the key barrier is a lack of incentives and changing policies. Stakeholders often complain about confusing political signals concerning building renovation: funding from national budgets can be reduced when national governments are trying to deal with occurring economic and financial crises by suspending or eliminating energy-efficiency programs [9], the regulations of the renovation process, as well as ambitions of performance requirements, maybe changing unreasonably quickly for both stakeholders and contractors to keep pace [10], or a country may lack regulatory constraints and incentives in the area under consideration. Artola et al. [9] and Economidou [24] also note that renovation cannot reach the desired scale because there is no single unified definition of energy renovation, but simply it is widely acknowledged that renovation must lead to energy savings after the intervention works. Thus, renovation can encompass a variety of interventions in a building, starting from modernization and ending with routine upgrades [25], which impedes both submissions of the applications for funding and contracting.
Insufficient communication about the advantages of the deep renovation as well as insufficient technical capacity/knowledge to promote, plan, and implement deep renovations are the key obstacles reported in the category of information and communication [10]. Sesana and Salvalai [13] also argue that a lack of transparency, caused by a deficiency of information, undermines investors’ confidence, while Streimikiene and Balezentis [19] link insufficiency of information to the inability to make collective decisions on renovation, especially in multi-flat buildings.
The socio-cultural barriers are related to social norms, i.e., public perception of the standards of thermal, acoustic, and light comfort, diverging customers’ priorities (e.g., floor space, a building’s aesthetic value), and the preconceived attitudes towards (in)efficiency (e.g., molding, inflammable insulation) [7]. As it was noted by D’Oca et al. [12], diverging attitudes and pre-conceptions hinder unanimity on renovation intervention (especially in multi-flat buildings with many owners).
In the category of technical and industrial barriers, the literature helped to identify such a primary obstacle as a lack of innovative technical solutions [10]. In many cases, architecture, location, and other specific characteristics of a building complicate renovation projects because there are no effective, innovative solutions for how to insulate a building, how to renovate its ventilation systems, etc. Even if basic technical solutions are available, they do not always pay off, and even after the renovation, the energy efficiency of a building is lower or shorter-term than planned. D’Oca et al. [12] emphasize the negative impact of a lack of consistent and standardized or integrated solutions, i.e., building renovation technologies and techniques are not ensured to comply with new and different building standard requirements. The researchers also note that stakeholders can be discouraged by the safety risk, i.e., the risk that a building can be damaged while conducting deep renovation processes (e.g., retrofitting).
In the category of administrative and regulatory barriers, the existing legal framework in each country may hinder deep renovation. Overlaps between laws, complex administrative processes, and a lack of legislation concerning the split incentives between tenants and owners are some of the barriers reported under this category [11]. The survey conducted by the European Commission [7] revealed the complicated dealings of house owners with contractors and sub-contractors (mainly caused by a lack of competence from one or both contracting parties).
Finally, insufficiently structured and specialized supply-side issues can become a barrier being unable to provide high-quality services [9], initiation of a project can be delayed due to the lack of skilled and qualified energy-efficient retrofit professionals [10,11,12], or the works can be disrupted due to fragmentation of the supply chain [10].
Conducting a thorough literature analysis helped to identify that the strongest drivers to the energy-efficient renovation of buildings in the EU are economic and financial, although consumers also care about their comfort, personal benefits (e.g., prestige), and environmental contribution. Improvement of the process and regulatory framework, as well as the availability of the information, are influential drivers at the institutional level. Insufficiency and unavailability of economic and financial incentives create key barriers to the energy-efficient renovation of buildings prevalent among consumers, while the lack of well-designed national strategies along with changing policies, varying ambitions, and a lack of transparency are notable at the institutional level. On the supply side, energy-efficient renovation of buildings in the EU is not on par with its potential due to the lack of innovative and consistent technical solutions and insufficiently structured and specialized supply.
According to the statistics of the 2014–2020 cohesion policy funds for energy efficiency in buildings, the budget for buildings (total sum of residential and public buildings) was absorbed as follows (top-10 fund absorbers): the Czech Republic (EUR 991.407,171), Germany (EUR 892.832,893), Greece (EUR 555.777,677), Portugal (EUR 586.542,944), Slovakia (EUR 586.275,034), Lithuania (EUR 496.564,799), Ireland (EUR 84.500,000), Malta (EUR 9.955,116), and Austria (EUR 5.893,940). 
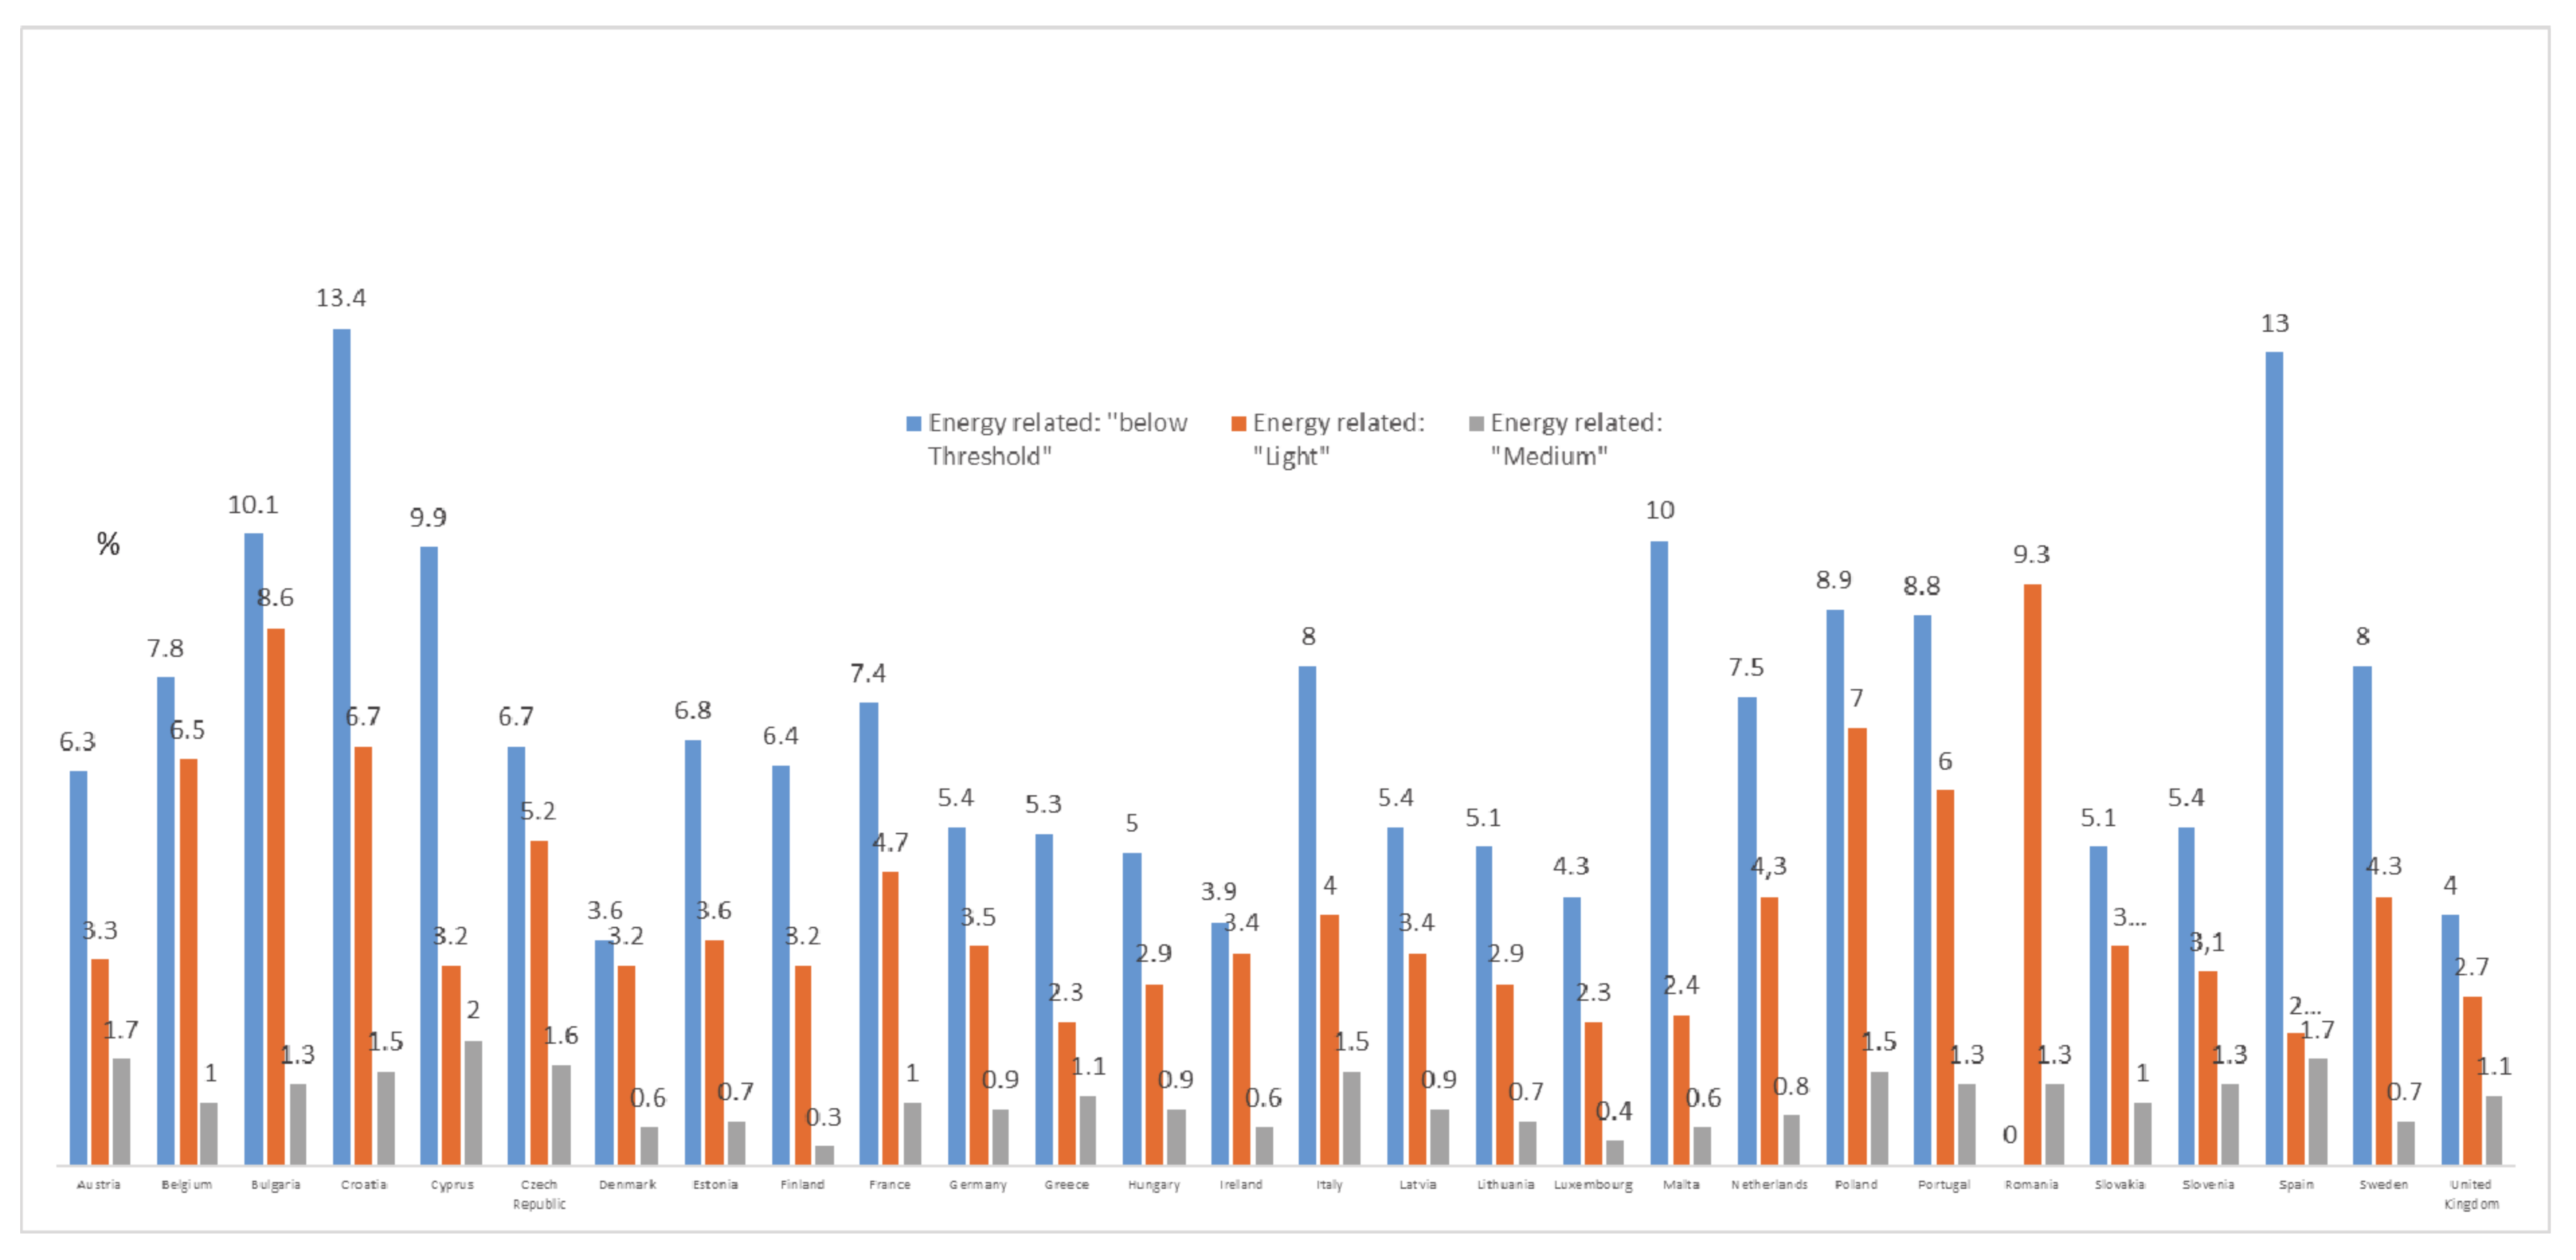
Figure 1 depicts energy renovation in residential buildings [32] by its rate as a percentage.
The statistics above indicate that by the energy renovation rate (“Below Threshold”, “Light”, “Medium”, “Deep”), energy renovation in residential houses in the EU is largely at the “Below Threshold” level. An energy renovation is classified as a renovation “Below Threshold” in cases in which the primary energy demand of a building has been reduced by x < 3% savings compared to the primary energy demand of the building in the calendar year before the energy renovation. Hence, the renovation only insignificantly (by 3%) contributes to energy efficiency. An energy renovation is classified as a light renovation in cases in which the primary energy demand of a building (based on calculated or measured performance) has been reduced by 3% ≤ x ≤ 30% savings compared to the primary energy demand of the building in the calendar year before the energy renovation. The most advanced countries at this level are Romania (9.3%), Bulgaria (8.6%), Belgium (6.5%), Poland (7%), and Croatia (6.7%). An energy renovation is classified as a medium renovation in cases in which the primary energy demand of a building (based on calculated or measured performance) has been reduced by 30% < x ≤ 60% compared to the primary energy demand of the building in the calendar year before the energy renovation. The EU average at this level is only 1.1%. Deep renovation has the potential to reduce the energy consumption of the building stock by 36% until 2030, but, according to the statistics, the average “deep” rate of the EU is only 0.1%.

3. Data and Methodology

3.1. Data

To take an insight into the implementation of the main EU (European Union) directives and other policy documents targeting sustainable energy development and the efficiency of allocated funds utilization, data on the usage of renewable energy sources, energy efficiency, and clean energy usage (ecological indicators) are employed. The indicators are selected according to the most commonly used indicators in sustainable energy development studies [33,34,35,36]. The following indicators from European Commission’ energy datasheets [37] are considered:
  • Production of energy from renewables and biofuels—This indicator represents the share of primary indigenous energy production from renewables and biofuels of total energy production (R1)
  • Final energy consumption of renewables and biofuels—This indicator includes the share of energy consumed by end-users, such as households, industry, and agriculture that is produced from renewables and biofuels in the total final consumption. It is the energy that reaches the final consumer’s door and excludes that which is used by the energy sector itself (R2)
  • Gross electricity generation from renewables and biofuels—This indicator refers to the share of electrical energy produced by transforming energy from renewables and biofuels in the total electricity production (R3)
  • RES-H&C or renewable heating and cooling (%)—This ratio is defined as the share of final gross consumption of energy from renewable sources for heating and cooling in the total final consumption of energy for heating and cooling (R4)
  • Energy intensity (GAE/GDP2015) (toe/M€’15)—This indicator represents the gross available energy per unit of GDP chain-linked volumes 2015. It indicates the effectiveness with which energy is being used to produce GDP (ECON1)
  • Energy per capita (GIC/pop) (kgoe/capita)—This indicator represents the gross available energy per inhabitant expressed in kg of oil equivalent per capita (ECON2)
  • Import dependency (%)—This is the ratio between net imports and the sum of gross inland consumption and international maritime bunkers. Values above 100% indicate that stocks are accumulated (ECON3)
  • CO2 emissions from public electricity and heat production—This indicator represents the share of emissions stemming from the burning of fossil fuels produced by public electricity and heating companies in total CO2 emissions (ECO1)
  • GHG emissions (greenhouse gases) from energy usage per mil. inhabitants—The indicator measures total national emissions of the so-called ‘Kyoto basket’ of greenhouse gases, including carbon dioxide (CO2), methane (CH4), nitrous oxide (N2O), and the so-called F-gases per million inhabitants (ECO2).
The first four indicators enable accessing the level of usage of renewable resources and biofuels or clean energy sources as it was defined by the EU sustainable development strategy. Considering that a significant part of the strategy is focused on the reduction of energy usage and import to enable sustainable growth and development, energy intensity, energy per capita, and import dependency are inserted as the criteria of multi-criteria analysis. Finally, the last two indicators have been introduced considering that the renovation of buildings in the context of the EU sustainable development strategy should reduce the ecological effects of energy usage relating, before all, to CO2 emissions from public electricity and heat production and GHG emissions from energy usage. All data are collected from the Eurostat database [37]. Mentioned data are used for further analysis by the PROMETHEE II method and entropy method.

3.2. Methodology

According to the data, European commission buildings cause approximately 40% of EU energy consumption and 36% of the greenhouse gas emissions, making them the single largest energy consumer in Europe. The renovation of existing buildings can enable meeting the objectives of the energy performance of the buildings directive, energy efficiency directive, EU green paper on a European strategy for sustainable, competitive, and secure energy, and clean energy for all Europeans package. Key EU directives, which have impacts on sustainable energy development, promote the usage of renewable energy sources, energy efficiency, and atmospheric pollution reduction.
Having in mind that ongoing sustainable development generates ever-more-complex decision-making problems, the application of multi-criteria decision-making (MCDM) methods is an inevitable part of the analysis in this area [38,39]. One of the most commonly used MCDM methods is the PROMETHEE II method [40], and after careful consideration of various research approaches, keeping in mind the research problem specifics, we selected this method. Namely, taking into account that it enables ranking of alternatives according to all observed criteria, it is widely used in the analysis of any aspect of sustainability as a multidimensional concept [41,42,43,44,45]. Also, the decision on usage this method is made based on its advantages. Ülengin [46] emphasize three advantages of PROMETHEE II method: its user-friendly outranking methodology, efficient application to real-life planning problems and the completeness of ranking. Additional advantage PROMETHEE II method usage is the possibility of graphic interpretation [47].
The first step in the application of this method is the definition of the decision-making problem, which implies the definition of the direction of preference, weight coefficient, preference function, and appropriate thresholds, according to the selected preference function. All alternatives are expressed in the preference level calculated based on the differences between each pair of alternatives in the context of individual criteria. The higher difference represents the high importance of a certain alternative concerning an observed criterion. The preference level is calculated by a preference function that can assume values of 0 to 1 [48]. The positive and negative preference flow is calculated for each alternative, and based on them, we get the net preference flow (as a difference between these two flows). As a final step, the ranking of observed alternatives is performed according to the value of net preference flow, which can take values ranging from −1 to 1.
For the efficient application of the PROMETHEE II method, it is necessary to define appropriate weight coefficients that represent the importance of each criterion for the final rankings of alternatives. To reduce subjectivity during analysis, especially when MCDM methods are used for comparative analysis of some macroeconomic problems, the objective defined weight coefficients are usually used. There are different methods for the objective definition of weight coefficients, and one of them is the entropy method, which is used in this paper. The advantage of this method is the fact that it considers the differences among alternatives regarding each considered indicator. Therefore, it can eliminate the influence of subjectivity in defining the weights, as it objectively reflects the index information evaluation object. The entropy method calculates weights based on the information entropy of the criteria. It is based on the measurement of the amount of useful information within the dataset provided. The high difference among the alternatives on the same indicator, as a result of small entropy, points out that this indicator provides more useful information, so the weight of this indicator should be defined correspondingly high. Opposite to that, if the difference among alternatives is lower, the entropy is higher, so the weight of the considered indicator would be smaller [49]. The first step in the application of the entropy method is the formulation of a decision matrix. In some cases, this matrix should be normalized, using appropriate formula depending on the direction of preference. Normalization aims to eliminate the difference of criteria in dimension and order of magnitude [50]. After normalization, information entropy is calculated, which is used in the next step for the calculation of weights. It is important to note that criteria where differences among alternatives are higher, information entropy is lower, and weight coefficient is higher. On the other hand, the lower difference among decision options in certain criteria is, the lower the information entropy is, the lower the weight coefficient is. Another important characteristic of obtained weight coefficients is that their sum amounts to 1.

4. Results and Discussion

4.1. Ranking of EU Countries by High-Performers, Middle-Performers, and Low-Performers for 2014

The first step in the analysis is to rank EU economies based on the considered indicators using the PROMETHEE method to identify how EU countries performed at the beginning of the programming period. Considering that this method requires the definition of weight coefficient, the entropy method was employed, and the obtained weights for 2014, together with other parameters of multi-criteria analysis, are presented in Table 2.
As it can be seen from Table 2, the indicators regarding the usage of renewable energy sources should be maximized, while energy efficiency and ecological indicators should be minimized. It should be noted that the highest weight coefficient is obtained for the production of energy from renewables and biofuels (R1), indicating that the highest differences among EU countries are recorded in this area. Somewhat lower, but still relatively high, weight coefficients are obtained for final energy consumption of renewables and biofuels (R2), gross electricity generation from renewables and biofuels (R3), and import dependency (ECON3), and they also indicate that differences among EU countries were high regarding these indicators in 2014. A slightly lower value of weight coefficient is obtained for the last indicators related to the usage of renewables and biofuels for heating and cooling. On the other hand, the lowest weight coefficient is obtained for energy intensity (ECON1), pointing out that EU countries have relatively similar usage of energy per unit of GDP. The differences in GHG emissions per million inhabitants (ECO2) and energy per capita (ECON2) are also low, as well as the share of CO2 emissions from public electricity and heat production in total CO2 emissions, although the value of weight is somewhat higher than that of the previous three indicators. Generally observed, it can be concluded that despite large differences in the usage of renewable energy sources and dependence on energy imports, energy consumption and emissions of harmful gases caused by energy use did not differ significantly among EU countries in 2014.
Based on defined parameters and an evaluation matrix, the rankings of EU countries were performed using the Visual PROMETHEE software (Visual Decision Inc. Montreal, Canada (academic version)), and the results are presented in Table 3.
The results presented in Table 3 indicate that Latvia is the best performer according to all considered indicators. Other than Latvia, a positive net preference flow is obtained for Sweden, Portugal, Croatia, Austria, Lithuania, Romania, Denmark, Finland, Italy, Slovenia, and Spain, indicating that those countries have greater advantages than limitations regarding the considered criteria. The countries where limitations overcame advantages, resulting in a negative preference flow, are Hungary, France, Luxemburg, Estonia, Cyprus, Bulgaria, Germany, Slovak Republic, Greece, Ireland, Malta, Czech Republic, Poland, Belgium, and the Netherlands. The application of Visual PROMETHEE software ensures the creation of some useful graphical representations. One of them is the so-called Rainbow diagram (see Figure A1 in Appendix A). This diagram is useful because it presents the advantages and disadvantages of each alternative (in this case, countries). The advantages are presented above histograms, while the disadvantages are placed below the histogram. It is obvious from Figure A1 that the top twelve ranked countries have more advantages than disadvantages, resulting in their favorable position in the final rankings. Latvia, as the first ranked country, is a good performer in all the observed aspects except for the level of energy intensity. At the very bottom of the rankings, there is Belgium, with advantages only regarding the low level of ecological indicators and energy intensity.
To obtain a deeper analysis of the considered issue, EU countries are divided into three groups according to ranking results—high-performers (from 1st to 9th position), middle-performers (from 10th to 18th position), and low-performers (from 19th to 27th position). The general characteristics of the formed groups of countries are presented in Table 4, as well as EU-level data.
According to the results from Table 4, it can be concluded that in the group of high-performers, the usage of renewables and biofuels was much higher than the EU average in 2014. The average share in energy production was 33.1% higher, in final consumption 58% higher, in electricity generation 70.2%, and in heating and cooling 68%. The minimum values of these indicators were much higher than the minimum values in the remaining two groups. If energy efficiency indicators are considered, it can be concluded that energy consumption in terms of energy intensity and energy per capita was lower than the EU average (10.3% and 4.5%, respectively). The import dependency was also much lower in comparison to the EU average (17.8%). The maximum values of energy intensity and import dependency were significantly lower than the other two groups. The maximum value of energy per capita was lower than in the group of middle-performers. The ecology indicators are also lower than the EU average. The average share of CO2 emissions from public electricity and heat production in total CO2 emissions was 26.6% lower, while the average value of GHG emissions from energy usage was 27.2% lower than the EU average. The maximum value of mentioned ecological indicators was much lower in comparison to the EU average.
The middle-performers had an almost similar share of renewables and biofuels in the production of energy to the EU average, while the average share in final consumption was 13.8% lower, average share in electricity generation was 22.2% lower, and average share in heating and cooling was 7.5%. The average energy usage was higher than the EU average in terms of energy intensity (9.7%), energy per capita (5.4%), and import intensity (8.2%). It is important to note that for the first two energy efficiency indicators, average and maximum values were much higher than in the group of low-performers. If import dependency is considered, it can be concluded that the difference in average and maximum values between middle-performers and low-performers was very low. The average value of ecology indicators was relatively higher than the EU average. The average share of CO2 emissions from public electricity and heat production in total CO2 emissions was 6.4% higher, while the average value of GHG emissions from energy usage was 13.3% higher than the EU average.
The obtained results for low-performers point out that the usage of renewables and biofuels were on average significantly lower than the EU average in the area of energy production (31.4%), final consumption (44.2%), electricity generation (47.9%), and heating and cooling (60.5%). It is important to note that, in comparison to the high-performers, the minimum value of mentioned indicators were 2.7 times lower in terms of production, 3.6 times lower in terms of final consumption, 11.7 times lower in terms of electricity generation, and even 89 times lower in terms of heating and cooling. The differences in comparison to the EU average relating to energy efficiency indicators were almost insignificant in terms of energy intensity and energy per capita, while the value of import dependency was 9.7% higher than the EU average. When it comes to ecological indicators, it can be seen from Table 4 that the average share of CO2 emissions from public electricity and heat production in total CO2 emissions was 20.1% higher, and the average value of GHG emissions from energy usage was 14.0% higher than the EU average.
In order to better display the differences across derived groups, the difference in comparison to the EU average regarding all observed indicators is also presented graphically in Figure 2.
Figure 2 clearly indicates that the most pronounced differences among derived groups of countries were those regarding the indicators relating to the usage of renewable energy sources, while relatively insignificant divergence is recorded for energy efficiency indicators.

4.2. Ranking of EU Countries by High-Performers, Middle-Performers, and Low-Performers for 2018

To evaluate the achieved results in considered areas in 2018, which were certainly to a large extent the effect of investments in buildings renovation from a cohesion fund, the same procedure was conducted for the 2018 data. First of all, the parameters of multi-criteria analysis were defined. The new weight coefficients were calculated for indicators recorded in 2018, and all parameters are presented in Table 5.
As can be seen from Table 5, the direction of preference and preference function is the same as in Table 2, while weight coefficients differ from those for 2014, indicating the changes across EU countries regarding considered criteria. The differences in usage of renewables and biofuels in energy production, electricity generation, and heating and cooling have become more pronounced, having in mind that calculated weight coefficients for these indicators are higher than in 2014. On the other hand, the differences relating to the share of so-called clean energy in final consumption remained almost the same. Obtained weight coefficients for the energy intensity, energy per capita, and GHG emission from energy usage have not changed significantly, while differences in import dependency and share of CO2 emissions from public electricity and heat production in total CO2 emissions have been reduced.
Using defined parameters of multi-criteria analysis and an evaluation matrix for 2018, the rankings for 2018 were obtained, and the results are presented in Table 6 using the Visual PROMETHEE software.
The results in Table 6 indicate that Latvia and Sweden retained their positions from 2014. Other than these two countries, the positive net preference flow was obtained for Croatia, Lithuania, Portugal, Austria, Denmark, Finland, Romania, and Italy. These countries had a positive net preference flow also in 2014, and most of them just changed their position in comparison to previous rankings. It is interesting to note that, in contrast to 2014, Spain and Slovenia have negative preference flows in 2018, and they joined Luxemburg, Cyprus, Greece, Malta, France, Estonia, Bulgaria, Germany, Hungary, Slovakia, Ireland, Belgium, Czech Republic, Poland, and the Netherlands, which retained the last position in 2018.
Using the Visual PROMETHEE software, the Rainbow diagram for 2018 was created, and the advantages and disadvantages of each alternative are presented (see Figure A2 in Appendix A). It can be concluded that Latvia had the same disadvantage as in the previous rankings—high energy intensity. The lowest-ranked Netherlands, on the other hand, had only two advantages represented by low energy intensity and share of CO2 emissions from public electricity and heat production in total emissions. It is interesting to note that formerly last ranked Belgium had the same limitations as the Netherlands, but they are much less pronounced. Furthermore, this country lost its relatively favorable position regarding a low level of GHG emissions in comparison to 2014.
To obtain a better understanding of the reasons for such results, the general characteristics of formed groups of countries are presented in Table 7.
Based on the results included in Table 7, it can be concluded that in the group of high-performers, the average usage of renewables and biofuels is significantly higher than the EU average. Their share in energy production was 32.3% higher, in final consumptions 52.5% higher, in electricity production 60.5% higher, and heating and cooling 55.4% higher than the EU average. The minimal values in this group are significantly higher than in the group of middle-performers and low-performers, indicating that countries in this group had made significant progress in this area. Countries from this group succeeded in improving the state in the energy efficiency area, considering that average energy intensity was 11.1% lower, energy per capita 4.2% lower, and import dependency 16.1% lower than the EU average. The maximum value of mentioned indicators was significantly lower than in the group of middle-performers, while in comparison to low-performers, only the maximum value of energy per capita was significantly higher than in low-performers. The emissions of harmful gases were also reduced, keeping in mind that the average share of CO2 emissions from public electricity and heat production in total CO2 emissions was 25.4% lower, and the average value of GHG emissions from energy usage was 24.9% lower than the EU average. It is interesting to note that the maximum values of mentioned indicators were almost half that of the group of middle-performers, while differences in comparison to low-performers were much less pronounced.
In the group of middle-performers, the only share of renewables and biofuels in production was 18.6% higher than the EU average, while their share in final consumption, electricity generation, and heating and cooling was somewhat lower than the EU average (19.1%, 16.2%, and 6.4%, respectively). The average energy usage in terms of energy intensity was slightly decreased (3.9%), while average energy per capita was 2.1% higher, and average import dependence was 17.1% higher than the EU average. Considering ecological indicators, it can be concluded that the average share of CO2 emissions from public electricity and heat production in total CO2 emissions was 12.3% higher, and the average value of GHG emissions from energy usage was 11.4% higher than the EU average.
The EU countries that are classified as the low-performers group have a significantly lower average share of renewables and biofuels in production, final consumption, electricity generation, and heating and cooling than the EU average. It is interesting to note that only regarding the share of renewables and biofuels in electricity generation, the minimum value in this group is higher than in middle-performers. The energy intensity was 14.9% higher than the EU average, while the other two energy efficiency indicators were almost equal to the EU average. The value of ecology indicators was increased slightly more than in the middle-performers group.
To get a clear picture of identified differences across derived groups, the difference in comparison to the EU average regarding all of the observed indicators are also presented graphically in Figure 3.
It can be concluded from Figure 3 that the state is almost unchanged compared to 2014, considering that again the highest differences were regarding the usage of renewable energy sources, and the lowest were recorded for energy efficiency indicators.
To evaluate general progress in the considered areas, the changes at the EU level in the observed period and the EU average in 2014 and 2018 are presented in Table 8.
From Table 8, it can be concluded that modest progress was made if the average values are taken into account. The share of renewables and biofuels in production increased by 7.4%, in final consumption by 4.8%, in electricity generation by 12.2%, and in heating and cooling by 13.7%. Regarding energy efficiency, mixed results were achieved. The energy intensity was decreased by 5.5%, while energy per capita and import dependency were increased by 3.4% and 4.3%, respectively. Finally, the situation in the area of ecology was improved, keeping in mind that the average share of CO2 emissions from public electricity and heat production in total CO2 emissions was reduced by 11.3%, the average value of GHG emissions from energy usage was 2.7% higher than the EU average. To better show the progress during the period, the relative change of considered indicators from Table 8 are graphically presented in Figure 4.
In this research, the EU member states were categorized by such criteria as energy from renewables and biofuels, final energy consumption from renewables and biofuels, gross electricity generation from renewables and biofuels, import dependency, and usage of renewables and biofuels for heating and cooling. The results of energy per unit of GDP, GHG emissions per million inhabitants (ECO2), energy per capita, the share of CO2 emissions from public electricity, and heat production in total CO2 emissions revealed that Latvia, Sweden, Portugal, Croatia, Austria, Lithuania, Romania, Denmark, and Finland are the nine most advanced countries in the area under consideration. In the group of the most advanced countries, energy consumption from renewables and biofuels is higher than the EU average. Categorization of the countries proposed in this article is in line with Simionescu et al.’s [51] clustering based on the share of renewable energy in electricity in 2017: the first cluster covers Austria, Denmark, Estonia, Portugal, Romania, Croatia, Latvia, Sweden, and Lithuania. The slight difference is that in this research, Estonia falls into the group of middle-performers. The governments of the lowest performers (Bulgaria, Germany, Hungary, Slovakia, Ireland, Belgium, the Czech Republic, Poland, and the Netherlands) are recommended to examine the good practices of their peers and adjust these practices at the national level. For instance, Lithuania is committed to obtaining 45% of its energy consumption from renewable energy sources by 2030 and 80% by 2050. Residents of apartment buildings have several options for contributing to environmental sustainability. The first is the installation of thermal solar collectors that accumulate solar energy for water heating. Residents can also install photovoltaic solar module power plants that generate electrical energy throughout the day or employ wind farms that can supply electricity to the common use areas in an apartment building. Although Lithuania is not a windy country, even with an average wind speed of 5 m/s, a wind farm is capable of producing a sufficient amount of electricity. Geothermal heating is another RES gaining popularity within the EU. The estimations indicate that up to 98% of the radiated solar energy is accumulated on the Earth’s surface, so this method allows the accumulated energy to be used for a building’s heating, water, or air heating. The method is completely environmentally friendly and is therefore considered one of the most ecological contemporary heating solutions.

5. Conclusions

The obtained results may lead to several theoretical and methodological contributions, as well as practical and policy implications. In terms of theory development, our results based on the comparative analysis have revealed how the studied indicators changed in 2018 compared to the results of 2014. The developed theoretical framework provides opportunities to continue studies providing data in three categories of countries based on their performance in relation to energy efficiency caused by the investments in buildings’ renovation. Of importance is to look deeper into the factors determining the level of efficiency in separate EU countries, as well as into drivers and barriers leading the process of the energy-efficient renovation of buildings. Such studies could explain in detail the peculiarities of our results, commenting on the reasons influencing the movement of individual EU countries between low-performers, middle performers, and high performers in terms of energy efficiency.
The methodological contribution of our study is related to developing a complex and robust research method for investment efficiency assessment allowing for the three groups of indicators related to the usage of renewable energy sources, energy efficiency, and ecological aspects of energy. It was based on the PROMETHEE II method and allows testing it in other time periods, as well as modifying it for research purposes.
As practical contributions of the current research, it is worth mentioning managerial implications that may be useful for laying down ground rules for developing and implementing strategies for building renovations on the governmental level of public authorities—among others, developing informational campaigns for the general public, as well as considering policies targeted at eliminating barriers and supporting driving forces for energy-efficient housing renovation. Policymakers should carefully consider the place in the rankings of their country related to the energy efficiency of renovated buildings and take steps towards moving it to a high-performer, or ensuring stability, in case their country is already present in this category.
To fasten the pace and scope of building renovations, it is necessary to develop policy innovation for building renovation. It generally refers to an approach aiming at creating added value and improving the effectiveness and efficacy of an existing policy to achieve the desired outcome, such as engaging the public in policy development, introducing suitable incentives, new evaluation methods, and innovative ways of funding. Various elements of a policy can be regarded as innovative: the renovation rate, a new tax break on renovation works, how the policy is designed, its application procedure, public/private partnership, and how it is being governed (how it is managed, who makes decisions).
Our results based on the proposed research methodology and indicators have several limitations that offer opportunities for future research. The major limitation of the study is data unavailability for some important indicators in this area. This is why some of the indicators regarding building renovation have not been included (the last available data for those indicators are from 2016), and analysis has been based on data for 2018 (some of the included data are not available for 2019).

Author Contributions

Conceptualization, R.R. and L.G.; methodology, A.F. and M.Đ.; formal analysis M.S. and A.F., writing—original draft preparation, L.G., M.S., and J.R.; writing—review and editing, M.S., R.R., and J.R.; funding acquisition, M.S. and M.Đ. All authors have read and agreed to the published version of the manuscript.

Funding

This work was supported by the Cracow University of Economics under Grant No. 4/ZZA/2021/POT.

Institutional Review Board Statement

Not applicable.

Informed Consent Statement

Not applicable.

Data Availability Statement

Data will be available on request.

Conflicts of Interest

The authors declare no conflict of interest.

Appendix A

Figure A1. Rainbow diagram for 2014.
Energies 14 04209 g0a1
Figure A2. Rainbow diagram for 2018.
Energies 14 04209 g0a2

References

  1. Vatin, N.; Petrichenko, M.; Nemova, D.; Staritcyna, A.; Tarasova, D. Renovation of educational buildings to increase energy efficiency. Appl. Mech. Mater. 2014, 633, 1023–1028. [Google Scholar] [CrossRef]
  2. The European Commission. EU Sustainable Development Strategy. 2001. Available online: https://ec.europa.eu/environment/sustainable-development/strategy/index_en.htm (accessed on 5 March 2021).
  3. The European Commission. 2020 Climate & Energy Package. 2020. Available online: https://ec.europa.eu/clima/policies/strategies/2020_en (accessed on 7 March 2021).
  4. The European Commission. 2030 Climate & Energy Framework. 2020. Available online: https://ec.europa.eu/clima/policies/strategies/2030_en (accessed on 10 March 2021).
  5. Moseley, P. Energy Efficiency: Building Renovation Challenge—Practical Approaches. Available online: https://ec.europa.eu/easme/sites/easme-site/files/practical_approaches_to_the_buildings_renov_challenge.pdf (accessed on 15 April 2021).
  6. The ODYSSEE-MURE Project: Energy Efficiency Trends in the EU. 2011. Available online: https://ec.europa.eu/energy/intelligent/projects/sites/iee-projects/files/projects/documents/overall-indicator-brochure.pdf (accessed on 20 April 2021).
  7. The European Commission. Comprehensive Study of Building Energy Renovation Activities and the Uptake of Nearly Zero-Energy Buildings in the EU. Final Report. 2019. Available online: https://ec.europa.eu/energy/sites/ener/files/documents/1.final_report.pdf (accessed on 15 May 2021).
  8. Sebastian, R.; Gralka, A.; Olivadese, R.; Arnesano, M.; Revel, G.M.; Hartmann, T.; Bindal-Gutsche, C. Plug-and-Play Solutions for Energy-Efficiency Deep Renovation of European Building Stock. Proceedings 2018, 2, 1157. [Google Scholar] [CrossRef] [Green Version]
  9. Beillan, V.; Huber, A.; Battaglini, E.; Goater, A.; Mayer, I.; Trotignon, R. Barriers and Drivers to Energy-Efficient Renovation in the Residential Sector: Empirical Findings from Five European Countries. 2011. Available online: https://www.eceee.org/library/conference_proceedings/eceee_Summer_Studies/2011/5-saving-energy-in-buildings-the-time-to-act-is-now/barriers-and-drivers-to-energy-efficient-renovation-in-the-residential-sector-empirical-findings-from-five-european-countries/ (accessed on 15 March 2021).
  10. Artola, I.; Rademaekers, K.; Williams, R.; Yearwood, J. Boosting Building Renovation: What Potential and Value for Europe? 2016. Available online: https://www.europarl.europa.eu/RegData/etudes/STUD/2016/587326/IPOL_STU (accessed on 24 April 2021).
  11. Buildings Performance Institute Europe (BPIE). Barriers that Hinder Deep Renovation in the Building Sector. 2017. Available online: https://euagenda.eu/upload/publications/untitled-95927-ea.pdf (accessed on 23 May 2021).
  12. D’Oca, S.; Ferrante, A.; Ferrer, C.; Pernetti, R.; Gralka, A.; Sebastian, R.; Op’t Veld, P. Technical, Financial, and Social Barriers and Challenges in Deep Building Renovation: Integration of Lessons Learned from the H2020 Cluster Project. Buildings 2018, 8, 174. [Google Scholar] [CrossRef] [Green Version]
  13. Sesana, M.M.; Salvalai, G. A review on Building Renovation Passport: Potentialities and barriers on current initiatives. Energy Build. 2018, 173, 195–205. [Google Scholar] [CrossRef] [Green Version]
  14. Brown, D.; Sorrell, S.; Kivimaa, P. Worth the risk? An evaluation of alternative finance mechanisms for residential retrofit. Energy Policy 2019, 128, 418–430. [Google Scholar] [CrossRef]
  15. Rosenow, J. The need for comprehensive and well-targeted instrument mixes to stimulate energy transitions: The case of energy efficiency policy. Energy Res. Soc. Sci. 2017, 33, 95–104. [Google Scholar] [CrossRef]
  16. Bertoldi, P.; Economidou, M.; Palermo, V.; Boza-Kiss, B.; Todeschi, V. How to finance energy renovation of residential buildings: A review of current and emerging financing instruments in the EU. WIREs Energy Environ. 2020, 10, 1–26. [Google Scholar] [CrossRef]
  17. The European Commission. 2050 Long-Term Strategy. 2020. Available online: https://ec.europa.eu/clima/policies/strategies/2050_en (accessed on 21 April 2021).
  18. Lechtenbohmer, S.; Schuring, A. The potential for large-scale savings from insulating residential buildings in the EU. Energy Effic. 2011, 4, 257–270. [Google Scholar] [CrossRef]
  19. Streimikiene, D.; Balezentis, T. Willingness to Pay for Renovation of Multi-Flat Buildings and to Share the Costs of Renovation. Energies 2020, 13, 2721. [Google Scholar] [CrossRef]
  20. Bertone, E.; Sahin, O.; Stewart, R.A.; Zou, X.W.; Alam, M.; Hampson, K.; Blair, E. Role of financial mechanisms for accelerating the rate of water and energy efficiency retrofits in Australian public buildings: Hybrid Bayesian network and system dynamics modeling approach. Appl. Energy 2018, 210, 409–419. [Google Scholar] [CrossRef] [Green Version]
  21. Bjorneboe, M.G.; Svendsen, S.; Heller, A. Initiatives for the energy renovation of single-family houses in Denmark evaluated on the basis of barriers and motivators. Energy Build. 2018, 167, 347–358. [Google Scholar] [CrossRef]
  22. Fantozzi, F.; Gargari, C.; Rovai, M.; Salvadori, G. Energy Upgrading of Residential Building Stock: Use of Life Cycle Cost Analysis to Access Interventions on Social Housing in Italy. Sustainability 2019, 11, 1452. [Google Scholar] [CrossRef] [Green Version]
  23. Ramirez-Villegas, R.; Eriksson, O.; Olofsson, T. Assessment of renovation measures for a dwelling area—Impacts on energy efficiency and building certification. Build. Environ. 2016, 97, 26–33. [Google Scholar] [CrossRef]
  24. Economidou, M. Energy Renovation. 2016. Available online: https://e3p.jrc.ec.europa (accessed on 21 April 2021).
  25. D’Agostino, D.; Zangheri, P.; Castellazzi, L. Towards nearly zero energy buildings in Europe: A focus on retrofit in non-residential buildings. Energies 2017, 10, 117. [Google Scholar] [CrossRef]
  26. van Oorschot, J.; Hofman, E.; Halman, J.I.M. Upscaling large-scale deep renovation in the Dutch residential sector: A case study. Energy Procedia 2016, 96, 386–403. [Google Scholar] [CrossRef] [Green Version]
  27. Salvadori, G.; Fantozzi, F.; Rocca, M.; Leccese, F. The Energy Audit activity focused on the Lighting Systems in Historical Buildings. Energies 2016, 9, 998. [Google Scholar] [CrossRef] [Green Version]
  28. Wong, I.L.; Kruger, E. Comparing energy efficiency labelling systems in the EU and Brazil: Implications, challenges, barriers and opportunities. Energy Policy 2017, 109, 310–323. [Google Scholar] [CrossRef] [Green Version]
  29. Fantozzi, F.; Leccese, F.; Salvadori, G.; Tuoni, G. Energy demand analysis and energy labelling of new residential buildings in Tuscany (Italy). In Ecosystems and sustainable Development VII; WIT Press: Southampton, UK, 2009; pp. 217–229. [Google Scholar]
  30. Brown, N.W.O.; Malmqvist, T.; Bai, W.; Molinari, M. Sustainability assessment of renovation packages for increased energy efficiency for multi-family buildings in Sweden. Build. Environ. 2013, 61, 140–148. [Google Scholar] [CrossRef]
  31. Jensen, P.A.; Masiesa, E.; Berg, J.B. Sustainable Building Renovation: Proposals for a Research Agenda. Sustainability 2018, 10, 4677. [Google Scholar] [CrossRef] [Green Version]
  32. European Court of Audits. Energy Renovation in Residential Buildings by Its Level (Average 2012 – 2016), November 2020. Available online: https://op.europa.eu/webpub/eca/special-reports/energy-efficiency-11-2020/en/ (accessed on 13 May 2021).
  33. Streimikiene, D.; Šivickas, G. The EU sustainable energy policy indicators framework. Environ. Int. 2008, 34, 1227–1240. [Google Scholar] [CrossRef]
  34. Siksnelyte, I.; Zavadskas, E.K.; Bausys, R.; Streimikiene, D. Implementation of EU energy policy priorities in the Baltic Sea Region countries: Sustainability assessment based on neutrosophic MULTIMOORA method. Energy Policy 2019, 125, 90–102. [Google Scholar] [CrossRef] [Green Version]
  35. Wang, Q.; Zhan, L. Assessing the sustainability of renewable energy: An empirical analysis of selected 18 European countries. Sci. Total Environ. 2019, 692, 529–545. [Google Scholar] [CrossRef]
  36. Fotiou, T.; de Vita, A.; Capros, P. Economic-engineering modelling of the buildings sector to study the transition towards deep decarbonisation in the EU. Energies 2019, 12, 2745. [Google Scholar] [CrossRef] [Green Version]
  37. Eurostat. Energy Datasheets: EU Countries. Available online: https://ec.europa.eu/info/news/eu-energy-datasheets-latest-data-now-available-2020-feb-24_en (accessed on 13 May 2021).
  38. Mardani, A.; Jusoh, A.; Zavadskas, E.K.; Cavallaro, F.; Khalifah, Z. Sustainable and renewable energy: An overview of the application of multiple criteria decision-making techniques and approaches. Sustainability 2015, 7, 3947. [Google Scholar] [CrossRef] [Green Version]
  39. Diaz-Balteiro, L.; González-Pachón, J.; Romero, C. Measuring systems sustainability with multi-criteria methods: A critical review. Eur. J. Oper. Res. 2017, 258, 607–616. [Google Scholar] [CrossRef]
  40. Dachowski, R.; Gałek, K. Selection of the Best Method for Underpinning Foundations Using the PROMETHEE II Method. Sustainability 2020, 12, 5373. [Google Scholar] [CrossRef]
  41. Makan, A.; Fadili, A. Sustainability assessment of large-scale composting technologies using PROMETHEE method. J. Clean. Prod. 2020, 261, 121244. [Google Scholar] [CrossRef]
  42. Antanasijević, D.; Pocajt, V.; Ristić, M.; Perić-Grujić, A. A differential multi-criteria analysis for the assessment of sustainability performance of European countries: Beyond country ranking. J. Clean. Prod. 2017, 165, 213–220. [Google Scholar] [CrossRef]
  43. Vivas, R.; Sant’anna, Â.; Esquerre, K.; Freires, F. Measuring sustainability performance with multi criteria model: A case study. Sustainability 2019, 11, 6113. [Google Scholar] [CrossRef] [Green Version]
  44. Strantzali, E.; Aravossis, K.; Livanos, G.A. Evaluation of future sustainable electricity generation alternatives: The case of a Greek island. Renew. Sustain. Energy Rev. 2017, 76, 775–787. [Google Scholar] [CrossRef]
  45. Neofytou, H.; Nikas, A.; Doukas, H. Sustainable energy transition readiness: A multicriteria assessment index. Renew. Sustain. Energy Rev. 2020, 131, 109988. [Google Scholar]
  46. Ülengin, F.; Topcu, Y.I.; Şahin, Ş.Ö. An integrated decision aid system for Bosphorus water-crossing problem. Eur. J. Oper. Res. 2001, 134, 179–192. [Google Scholar] [CrossRef]
  47. Živković, Ž.; Arsić, M.; Nikolić, Đ. The University of Belgrade on ARWU list-Part I: The impact of individual faculties on the achieved position using PROMETHEE-GAIA method. Serb. J. Manag. 2017, 12, 171–187. [Google Scholar] [CrossRef] [Green Version]
  48. Brans, J.P.; De Smet, Y. Multiple Criteria Decision Analysis. In PROMETHEE Methods; Springer: New York, NY, USA, 2016; pp. 187–219. [Google Scholar]
  49. Zou, Z.H.; Yi, Y.; Sun, J.N. Entropy method for determination of weight of evaluating indicators in fuzzy synthetic evaluation for water quality assessment. J. Environ. Sci. 2006, 18(5), 1020–1023. [Google Scholar] [CrossRef]
  50. Chen, P. Effects of normalization on the entropy-based TOPSIS method. Expert Syst. Appl. 2019, 136, 33–41. [Google Scholar] [CrossRef]
  51. Simionescu, M.; Strielkowski, W.; Tvaronavičienė, M. Renewable Energy in Final Energy Consumption and Income in the EU-28 Countries. Energies 2020, 13, 2280. [Google Scholar] [CrossRef]
Figure 1. Energy renovation in residential buildings by its rate as a percentage [32] (Source: European court of audits, 2020).
Energies 14 04209 g001
Figure 2. The differences regarding the observed indicators in comparison to the EU average across derived groups of countries in 2014.
Energies 14 04209 g002
Figure 3. The differences regarding the observed indicators in comparison to the EU average across derived groups of countries in 2018.
Energies 14 04209 g003
Figure 4. The changes in EU average during the period 2014–2018.
Energies 14 04209 g004
Table 1. Drivers and barriers to the energy-efficient renovation of buildings in the EU.
DriversAuthor(s), YearBarriersAuthor(s), Year
EconomicEconomic
Boosting real estate value[7,9]High expenses and opaqueness of costs[7,9,10,14]
Lower bills (saving)[7,9,18,19]
FinancialFinancial
Amount and nature of financial support available[9]Inadequate funding sources, inadequate state support[7,12,19,20]
Subsidies, grants, tax incentives[10,11,21]Long pay-back period[16,22]
PoliticalPolitical
Improvement of the process and regulatory framework[10,21]Lack of incentives and national strategies[9,11]
Changing policies and varying ambitions of performance requirements, environmental standards[9,10,23]
Multiple definitions for renovation[10,24,25]
Information and communicationInformation and communication
Availability of the information [9]Lack of households’ information on available solutions, saving potential, costs[9,16,26,27]
Energy performance certificates, labeling schemes[10,21,28,29]Lack of transparency[13]
Socio-culturalSocio-cultural
Greater comfort[9,19,30]Social norms[12,31]
Personal benefits (e.g., image)[7,9]Diverging priorities[12]
Preconceived attitudes towards efficiency and saving[7]
EnvironmentalTechnical and industrial
Contribution to protection from global warming[7]Lack of innovative technical solutions[7,10,12]
Promotion of renewable energy[7]Lack of consistent and standardized solutions[12]
Possible damage to buildings[12]
Administrative and regulatory
Complicated administrative requirements, time costs[7,11]
Complicated dealing with contractors and sub-contractors[7]
Overlapping laws[11]
Supply-side
Insufficiently structured and specialized supply[9]
Lack of knowledge and skills possessed by construction professionals[10,11,12]
Fragmentation of the supply chain[10]
Source: Compiled by the authors.
Table 2. The parameters of multi-criteria analysis for 2014.
R1R2R3R4ECON1ECON2ECON3ECO1ECO2
Direction of preferencemaxmaxmaxmaxminminminminmin
Weight coefficient0.1790.1360.1350.1190.0650.0710.1370.0900.068
Preference functionUsualUsualUsualUsualUsualUsualUsualUsualUsual
Table 3. Ranking of EU countries for 2014.
RankCountryNet Preference Flow (Phi)Positive Preference Flow (Phi+)Negative Preference Flow (Phi−)
1Latvia0.66170.83080.1692
2Sweden0.56020.78010.2199
3Portugal0.50040.75020.2498
4Croatia0.48420.74210.2579
5Austria0.39080.69540.3046
6Lithuania0.36820.68410.3159
7Romania0.25420.62710.3729
8Denmark0.19670.59830.4017
9Finland0.16410.58210.4179
10Italy0.07570.53780.4622
11Slovenia0.07560.53780.4622
12Spain0.00120.50060.4994
13Hungary−0.07920.46040.5396
14France−0.09470.45260.5474
15Luxemburg−0.13060.43470.5653
16Estonia−0.1440.4280.572
17Cyprus−0.15590.4220.578
18Bulgaria−0.19020.40490.5951
19Germany−0.22920.38540.6146
20Slovak Republic−0.24530.37740.6226
21Greece−0.26470.36760.6324
22Ireland−0.27620.36190.6381
23Malta−0.31920.34040.6596
24Czech Republic−0.33920.33040.6696
25Poland−0.35170.32410.6759
26Belgium−0.39550.30220.6978
27Netherlands−0.51730.24130.7587
Table 4. The characteristics of derived groups of countries in 2014.
GroupsStatisticsCriteria
R1R2R3R4ECON1ECON2ECON3ECO1ECO2
High-performers Latvia, Sweden, Portugal, Croatia, Austria, Lithuania, Romania, Denmark, FinlandMean60.518.857.642.7151.13185.845.222.14.9
Min20.811.238.726.767.81583.412.29.63.6
Max99.627.782.664.5203.66300.874.935.98.1
The difference compared to the EU average (in %)33.158.070.268.0−10.3−4.5−17.8−26.6−27.2
Middle-performers Italy, Slovenia, Spain, Hungary, France, Luxemburg, Estonia, Cyprus, BulgariaMean44.710.326.323.5184.73516.559.532.17.6
Min16.53.57.37.184.62411.911.16.04.1
Max90.817.449.245.0408.77685.196.573.216.9
The difference compared to the EU average (in %)−1.7−13.8−22.2−7.59.75.48.26.413.3
Low-performers Germany, Slovakia, Greece, Ireland, Malta, Czech Republic, Poland, Belgium, NetherlandsMean31.26.617.610.0169.33310.660.336.27.6
Min7.63.13.30.364.92077.729.413.95.1
Max100.012.426.919.5261.14834.297.757.79.4
The difference compared to the EU average (in %)−31.4−44.2−47.9−60.50.6−0.89.720.114.0
Table 5. The parameters of multi-criteria analysis for 2018.
R1R2R3R4ECON1ECON2ECON3ECO1ECO2
Direction of preferencemaxmaxmaxmaxminminminminmin
Weight coefficient0.1970.1340.1610.1380.0620.0690.0990.0700.071
Preference functionUsualUsualUsualUsualUsualUsualUsualUsualUsual
Table 6. Ranking results for 2018.
RankCountryNet Preference Flow (Phi)Positive Preference Flow (Phi+)Negative Preference Flow (Phi−)
1Latvia0.66630.83320.1668
2Sweden0.52980.76490.2351
3Croatia0.48100.74050.2595
4Lithuania0.43860.71930.2807
5Portugal0.43050.71530.2847
6Austria0.39780.69890.3011
7Denmark0.32000.66000.3400
8Finland0.27760.63880.3612
9Romania0.18810.59410.4059
10Italy0.08830.54420.4558
11Slovenia−0.02130.48940.5106
12Spain−0.02330.48830.5117
13Luxemburg−0.03050.48470.5153
14Cyprus−0.04650.47670.5233
15Greece−0.05960.47020.5298
16Malta−0.12030.43990.5601
17France−0.14270.42870.5713
18Estonia−0.14270.42860.5714
19Bulgaria−0.14690.42660.5734
20Germany−0.21080.39460.6054
21Hungary−0.22620.38690.6131
22Slovakia−0.29260.35370.6463
23Ireland−0.34690.32650.6735
24Belgium−0.41610.2920.708
25Czech Republic−0.43400.28300.7170
26Poland−0.53460.23270.7673
27Netherlands−0.62320.18840.8116
Table 7. The characteristics of derived groups of countries in 2018.
GroupsStatisticsCriteria
R1R2R3R4ECON1ECON2ECON3ECO1ECO2
High-performers Latvia, Sweden, Croatia, Lithuania, Portugal, Austria, Denmark, Finland, RomaniaMean64.519.060.944.9141.63306.448.019.94.9
Min23.612.341.025.462.41719.722.87.33.5
Max99.226.683.365.3193.66328.275.634.07.5
The difference compared to the EU average (in %)32.352.360.555.4−11.1−4.2−16.4−25.4−24.9
Middle-performers Italy, Slovenia, Spain, Luxemburg, Cyprus, Greece, Malta, France, EstoniaMean57.910.131.827.1153.03524.067.230.07.2
Min19.84.69.48.578.81780.71.01.93.1
Max100.016.087.653.7274.77483.497.567.914.7
The difference compared to the EU average (in %)18.6−19.1−16.2−6.4−3.92.117.112.311.4
Low-performers Bulgaria, Germany, Hungary, Slovakia, Ireland, Belgium, Czech Republic, Poland, NetherlandsMean23.98.321.214.7182.93524.857.030.27.4
Min14.53.911.86.147.62695.436.313.04.7
Max38.314.436.033.3377.14839.182.350.99.1
The difference compared to the EU average (in %)−51.0−33.2−44.2−49.014.92.1−0.713.113.5
Table 8. Changes between derived groups in 2014 and 2018.
YearCriteria
R1R2R3R4ECON1ECON2ECON3ECOL1ECOL2
201445.411.933.825.4168.43337.655.030.16.7
201848.812.538.028.9159.23451.757.426.76.5
Change (in %)7.44.812.213.7−5.53.44.3−11.3−2.7
Publisher’s Note: MDPI stays neutral with regard to jurisdictional claims in published maps and institutional affiliations.

