Article

Determination of Nitrogen and Sulphur Mineralization in Batch and Semi-Continuous Anaerobic Digestion Using an Artificial Fiber Bag Technique

by
Jacob Rosholm Mortensen
1,
Alastair James Ward
2,
Martin Riis Weisbjerg
3,
Sasha Daniel Hafner
4 and
Henrik Bjarne Møller
2,*
1
PlanEnergi Nordjylland, Jyllandsgade 1, 9520 Skørping, Denmark
2
Department of Biological and Chemical Engineering, Aarhus University, Blichers Allé 20, 8830 Tjele, Denmark
3
Department of Animal Science, Aarhus University, Blichers Allé 20, 8830 Tjele, Denmark
4
Hafner Consulting LLC, Reston, VA 20191, USA
*
Author to whom correspondence should be addressed.
Energies 2021, 14(14), 4205; https://doi.org/10.3390/en14144205
Submission received: 20 May 2021 / Revised: 7 July 2021 / Accepted: 8 July 2021 / Published: 12 July 2021
(This article belongs to the Section A4: Bio-Energy)

Abstract

:
In the biogas industry, feedstock plans are used to estimate methane production and nutrient content in the digestate, however, these predictions do not consider the mineralized nitrogen fraction of the feedstock, which is useful when determining the quality of the digestate. In this study, the artificial fiber bag technique, which is commonly used to study feedstock degradation in ruminants, was implemented in anaerobic digestion to quantify mineralization of N and S. The artificial fiber bags were used to enclose substrates but with access to inoculum because of small pores in the bags, thereby enabling digestion. The content of the bags was analyzed before and after digestion to quantify residual mass as well as N and S concentration in the substrate. The method was validated through batch anaerobic digestion of a single substrate with and without bags, where the bags showed little influence on methane production and degradation. Semi-continuous anaerobic digestion experiments showed higher substrate degradation and higher N and S release at thermophilic conditions using four different types of feedstocks and proved useful for solid feedstocks but less so for semi-solid feedstock. For N, most of the mineralization occurred during the first 15 days over a trial of 30 days.

1. Introduction

As the world is changing into more sustainable production to limit climate change, the need for renewable, sustainable energy production is becoming crucial. For industrial production with high temperatures and heavy-duty transport, electricity has limitations both in energy content and infrastructure [1]. Renewable gas, of quality similar to natural gas, is therefore of interest, as infrastructure is ready for the implementation. Biogas from anaerobic digestion (AD) is considered a renewable CO2-neutral gas that can be produced from waste products [2]. The biogas must be upgraded to natural gas quality before injection to grid systems or used in transport vehicles [3]. AD is the only mainstream process where energy is produced from waste feedstocks while useful, renewable fertilizers (the digestate) are produced as a by-product [4]. The feedstocks used are mostly manure, agricultural waste, industrial waste and sometimes energy crops (which are not considered sustainable). The agricultural industry accounts for up to 10% of the total European greenhouse gas (GHG) emission, where methane emissions from farms is one of the major causes [5]. AD is a process that greatly reduces GHG emissions from the agricultural industry while extracting energy, and a better nutrient-rich digestate fertilizer compared to fresh manure [6]. Because of a higher degree of mineralized nitrogen (N) in digestate, there is also an increased risk of ammonia emission if the digestate is not further processed to avoid this problem. The mineralized N and sulphur (S) in the digestate are more available to crops compared to organic, protein-bound N and S, as proteins cannot directly be taken up in a plant cell [7]. Furthermore, the C:N ratio decreases during AD due to a loss of C as CO2 and CH4. In industrial AD facilities, feedstock plans are prepared to estimate CH4 production, but also digestate properties are of increasing importance. Farmers are restricted to certain nutrient limits for field spreading and improving digestate properties is important for biogas plants, and especially the conversion of organic nitrogen is important both to have high nitrogen value for the crop production and to reduce the leaching of nitrate to the groundwater [8]. The predictions for nutrient application of anaerobically digested materials are, in industry, often based on the total N fraction in the feedstock and do not consider the mineralization from organic N to inorganic N. Another challenge occurs when biogas plants separates the fiber fraction from the digestate post digestion, resulting in two fractions with different nutrient content. Characterizing the amount of nutrients released to the digestate could help to improve these predictions but would require a thorough feedstock analysis during continuous anaerobic digestion. To enable the analysis, a method must be developed where feedstock can be removed easily from the digester without being mixed up with other feedstock, thereby enabling the study of degradation for a single feedstock in a co-digestion system. In conventional batch assays, it is not possible to effectively separate the substrate from the inoculum, and any analysis of chemical parameters will be to some extent contaminated by the inoculum. Normally, chemical parameters such as S concentration are measured in the combined substrate with inoculum, if measurements after digestion has proceeded are required [9]. The use of artificial fiber bags (AFB) is a widely implemented strategy to study substrate degradation, including protein and starch degradation, in fistulated ruminants [10]. A similar technique could be implemented in AD. The solubilized mass, including N and S release from protein in the feedstock, would solubilize and elute from the AFB, while the non-degraded mass would remain within the AFB. In this study, batch AD experiments were performed with clover grass pulp (CGP) as substrate either enclosed in AFB or not, at inoculum to substrate ratios (ISR) of 2:1 and 1:1 (VS basis). Semi-continuous digestion experiments were also conducted in 160 L reactors using cattle manure as the semi-continuously fed substrate with bagged substrates suspended in the reactor. Substrates used in the semi-continuous experiment were: CGP; cattle manure (CM); Fertigro® (FG, an organic fertilizer, made of pork intestines, produced as a by-product from the production of the anticoagulant Heparin); and the organic fraction of municipal solid waste (OFMSW). The substrates from the AFB were collected after specific time points to quantify mass loss and the N and S concentrations in the residual feedstock over time during digestion. The mass loss from bags compared to time zero was assumed to be solubilized and eventually mineralized. The aim of this study was to develop a method to estimate and quantify degradability, N and S mineralization from different feedstocks. The method should facilitate study of the effect of operating conditions on such parameters. The method should be easy to implement in industrial-like semi-continuous operation where the amount of inoculum is much larger than the biomass added, and where quantification of substrate effects on the digestate composition by chemical analysis is difficult.

2. Materials and Methods

2.1. Artificial Fiber Bag Preparation

In the batch AD experiment, AFB sheets (Dacron) with pores of 38 μm were cut in dimensions of 14 × 25 cm for ISR = 2:1 bottles and 14 × 50 cm for ISR = 1:1 bottles. The AFB were then folded resulting in dimensions of 7 × 25 cm and 7 × 50 cm. These were heat-sealed on two sides by welding using a WN-600 A item no. 12 (Wu-Hsing Electronics CO. LTD, Taichung City, Taiwan). Bag ID was noted on each bag for identification. The 7 × 25 cm AFB were filled with approximately 12 g of fresh mixed grass clover pulp from grass protein production (CGP) (≈2.6 g VS). The 7 × 50 cm AFB were filled with approximately 24 g of fresh CGP (≈5.2 g VS). The AFB were then heat-sealed at the last side by welding. Photographs of the bags can be found in the Supplementary Material Figures S1 and S2.
In the continuous digestion experiment, sheets were cut into dimensions of 20 × 30 cm, folded, and two sides were heat-sealed by welding resulting in bags of 15 × 20 cm. About 25 g total solids (TS) of substrate was placed inside a bag before sealing by welding. 50 g of FG was used instead of 25 g as the material was semi-solid and was expected to digest rapidly. Having higher starting mass would enable better quantification. The substrate ID, date and time point were noted on the bag for identification. A total of 96 AFB were prepared for the experiment (24 for each substrate).
For both experiments, the method relies on the assumption that any mass that leaves the bag has been mineralized, either prior to moving through the 38 µm pores or afterwards.

2.2. Batch Anaerobic Digestion Bottle Setup

To study substrate degradation and N and S mineralization over time in batch AD, bottles were made for destructive sampling at 4 time points. The Sample times were after 3, 7, 14 and 30 days (AFB 2:1), with 30 days as total digestion time. The experiments included 2 different ISR (1:1 and 2:1), but sample times after 3, 7 and 14 days was only made for ISR = 2:1. This resulted in a total of 12 bottles for ISR 2:1 and 3 bottles for ISR 1:1 (AFB 1:1). Controls were made using inoculum as a blank and microcrystalline cellulose as a positive control (EC Number: 232-674-9, Sigma-Aldrich, Søborg, Denmark). The amount of cellulose was reduced to ISR = 3.6 to avoid excessive gas production and thereby risk of bottle explosion. Another set of bottles with ISR = 2:1 was made without the AFB to compare the effect of containing the substrate inside the AFB (no AFB 2:1). A single bottle (no replicate) was made containing only an AFB and inoculum (without substrate) to confirm whether the bag was degraded or not (AFB only). The last two bottles were water controls used to evaluate scale drift with a gravimetric method (Section 2.5). The bottles and their relevant measurement days are summarized in Table 1. All batch bottles, except the water controls, were flushed with N2 for 2 min. ensuring anaerobic conditions. All 27 bottles were placed in a shaken incubator at 52.5 °C and 60 rounds per minute.
The inoculum used for the experiment was a thermophilic inoculum from the main digester of Aarhus University’s Biogas Research Center in Foulum (≈52.5 °C) with a TS and VS of 3.4% and 2.6%, respectively. The inoculum was prepared on site, filtered, and degassed for 2 weeks prior to experiments. Prior to incubation of the experiments, bottle mass, inoculum mass and substrate mass were noted for each individual bottle. Mass loss during incubation was used to detect leaks [11].

2.3. Continuous Reactor Setup

To study the mineralization of N and S, as well as the temperature influence on mineralization and substrate degradation in semi-continuous AD, a setup with two stainless steel 160 L continuous bioreactors, with a working volume of 115 L, were used. The substrates used in this experiment were cattle manure (CM), CGP, FG and OFMSW, the latter from Billund Vand & Energi A/S, Denmark. The conditions of the bioreactors and inoculum source are shown in Table 2.
No accurate biogas measurements were performed in the continuous experiment as the objective was to study substrate degradation. However, the reactors were connected to gas flow meters to ensure that biogas was produced, and that the inoculum was active. About 4.5 kg (fresh mass) of cattle manure was dosed to the reactors as co-substrate every day for 30 days. The AFB with substrate were attached to chains hanging from the top of the reactor ensuring full contact between the bags and the inoculum. A total of 48 bags, 12 of each substrate, were inserted into each reactor.

2.4. Artificial Fiber Bag Washing and Drying Procedure

After retrieving the AFB at a specific time point, each bag was rinsed with tap water and stored at −20 °C before further processing. At the end of the experiment, all bags were collected, thawed and washed in 12 L of tap water at 25 °C for 10 min. This procedure was repeated 4 times to simulate a double rinsing program in a washing machine, but with less probability of bag rupture. All washed bags were then dried at 105 °C for 72 h and then weighed. The dried bags were stored at room temperature under dry conditions until further use.

2.5. Analysis

Biogas production was measured using a gravimetric method with gas analysis by gas chromatography [12]. Bottles were vented after 2, 3, 5, 7, 9, 14, 20 and 30 days. For one replicate from each set of bottles, a 20 mL headspace vial with a crimp top from Agilent (Product number: 5182-0837, Agilent, Santa Clara, CA, USA) was prepared for gas chromatography (GC) analysis to confirm gas composition. This was done using an Agilent 7890A gas analyzer with a dual column system, consisting of a Porapak Q column (Agilent, Santa Clara, USA) and a fused silica column (Agilent, USA) with helium as the carrier gas. Data processing of gravimetric measurements followed Hafner et al. [13] and specific methane production (SMP) was calculated as described in Hafner et al. [14]. Measurement of mass loss during incubation [10] showed that leaks were present in several bottles. Fortunately, gravimetric measurements are not sensitive to leakage, unlike volumetric and manometric alternatives. Calculations were done using the biogas package in R software [15].
The elemental composition (C, H, N) was determined using a Vario Macrocube elemental analyzer (Elementar, Langenselbold, Germany). Each sample was dried first then homogenized using ball mill grinding before analysis. Then, 50 mg of ground sample was mixed with at least 50 mg tungsten to ensure complete combustion. The mixture was placed in a small folded tin-foil container. The container was packed and pressed for analysis in the elemental analyzer. About 20 mg of sulfanilamide was used as control standard. Three replicates of each sample and controls were analyzed.
Total S was determined by turbidimetry after wet washing with magnesium nitrate and perchloric acid. The procedure is described by Eriksen et al. [16].
Total and volatile solids were analyzed by drying at 105 °C and incineration at 550 °C, following standard methods [17].
VFA content was measured by GC using an Agilent CA 95051, with a Hp-Innowax (Agilent, USA) column attached. Prior to analysis, 1.00 g of slurry was mixed with 4 mL of 0.3 M oxalic acid in a 15 mL test tube. The test tube was mixed for 10 min on a rotator. After mixing, the tube was centrifuged at 4700 RPM for 10 min. Then, 2 mL of the supernatant was collected and filtered through a 0.45 μm syringe filter into the specific GC-vials. The GC vials were then placed in the autosampler of the GC and measurements performed by the GC.
Inoculum pH was measured using a pH meter during the alkalinity test. The pH meter was calibrated in a 2-point calibration using buffers of 4.01 (Hamilton, DuraCal, Lot: 111021576, Reno, NV, USA) and 7.00 (Hamilton, DuraCal, Lot: 111022292, Reno, NV, USA) from Hamilton. Total alkalinity (TA) was measured using an 848 Titrino Plus from Metrohm (Product number: 2.848.0010, Metrohm, Herisau, Switzerland). One gram of slurry was diluted with 50 mL of demineralized water before using the instrument. The mixture was titrated by the instrument with 0.1 M HCl. The volume of acid used for EP1 and EP2 was obtained from the 848 Titrano Plus. The partial alkalinity (PA) and TA were calculated from the volume of HCl used for EP1 and EP2.

2.6. Determination of N and S Mineralization

As mentioned in Section 2.5, a Vario Macrocube was used for elemental analysis CHN to quantify the concentration of N (CN) directly as g N/100 g DM. For the S analysis, the S concentration (CS) was also directly measured as g S/100 g DM.
For calculating the N and S mass, the mass of dry matter (mDM) was obtained for each individual bag by weighing on a scale after incubation, washing and drying (see Section 2.5). The mass loss was used to determine the amount of solubilized N and S, which was assumed to be mineralized. The N and S mass remaining (mN and mS, respectively) were calculated by multiplying the concentration of N and S to the residual mass.

2.7. Model Fitting and Kinetic Calculations

Batch AD data were fitted to the Modified-Gompertz model shown in Equation (1):
M ( t ) = B 0 · exp { exp ( R m a x · e B 0 · ( λ t ) + 1 ) }    
where M(t) is the CH4 yield at a given time (mL gVS−1). B0 is the observed maximum CH4 yield (mL gVS−1), Rmax is the maximum CH4 production rate (mL gVS−1 d−1), e is Euler’s number (2.718), λ is the lag phase (d) and t is time (d). The data that were fitted to the model was based on mean values for the specific replicates and model kinetic parameters were obtained by minimizing the error using a sum of squares analysis with the Excel Solver function. Parameters were used to compare the influence of the AFB technique in the batch AD experiments. To test whether the AFB technique had a significant influence on gas yields or kinetics, the three sets of bottles digested for 30 days (ISR = 2 with AFB, ISR = 2 without AFB, and ISR = 1 with AFB) were compared using ANOVA. The gas yields and kinetics of the bottles opened for analysis on days 3, 7, 14 and 30 (ISR = 2 with AFB) were also compared using ANOVA.

2.8. Continuous Experiment Feedstock Characteristics

Prior to performing the semi-continuous anaerobic digestion, all substrates were analyzed for TS, VS, CHNS and BMP. BMP was determined over more than 60 days using the gravimetric method with biogas analysis by gas chromatography [11]. BMP measurement followed the guidelines provided by Holliger et al. [18,19].

3. Results and Discussion

3.1. Validating the Artificial Fiber Bag Technique by Batch Anaerobic Digestion

3.1.1. Comparing Batch Test Biogas Production

Validation of the bag technique was done to study whether the presence of the AFB had an influence on AD, CH4 production and kinetics. From the batch anaerobic digestion, the influence of the technique on digestion of CGP was tested based on specific methane potential curves (SMY). Without AFB BMP was 267 mL gVS−1, 238 mL gVS−1 with AFB (a difference of 10.8%). The standard deviations were 19 and 28 mL gVS−1, respectively. Neither the 30 day biogas nor methane yields were statistically different (p = 0.5044 and p = 0.1525, respectively) when comparing the presence or absence of AFB or ISR ratios. It should be noted that due to the limited number of replicates (three), the statistical power of the tests is low. Thus, despite fairly high probability values, the statistical significances presented here should be treated with caution. Methane production curves and BMP from specific bottles are shown in Figure 1.
In Figure 1, it is shown that the ISR seems to influence the kinetics of the digestion, with low ISR exhibiting slower methane production. The SMY was comparable for both experiments with the presence of the AFB (difference of 5 mL gVS−1 in means), which was expected since it was the same feedstock and inoculum used. There was no additional biogas production from the bottle that contained only an empty AFB compared to the inoculum only bottles. It was therefore concluded that the AFB was non-digestible over 30 days. This was also confirmed by weighing the AFB after the experiment, which showed no mass difference compared to the initial mass (data not shown).
To further compare the influence of the AFB, the data were fitted to Modified-Gompertz models for both methane yield data of the individual replicates and the mean methane yield data.
Kinetic parameters from the modified Gompertz model replicates showed similar modelled BMP for all samples (see Table 3). The lag-phase, (λ), which is the time before a significant amount of gas is produced [20], was longer for ISR = 2:1 with AFB than ISR = 1:1 with AFB (p = 0.042) and was the only statistically significant difference between λ values. Comparing ISR = 2 without AFB to ISR = 2 with AFB, p = 0.665, whereas comparing ISR = 1 with AFB to ISR = 2 without AFB, p = 0.375. The rate of CH4 production (Rmax) is also lower for bottles using the AFB technique. The use of AFB at ISR = 2.1 was significantly lower than not using AFB at ISR = 2:1 (p = 0.043). The Rmax at ISR = 1:1 with AFB was also significantly lower than ISR = 2:1 with AFB (p = 0.002) and also between ISR = 2.1 without AFB and ISR = 1:1 with AFB (p = 0.00005). It was expected that a lower ISR had a lower rate of gas production as there were fewer microorganisms per mass unit of substrate. The CGP used is a lignocellulosic material with low ammonia and salt content and should not inhibit microorganisms at ISR = 1:1 [21]. The somewhat slower digestion was believed to be caused by limited contact between inoculum and substrate because of limited flux of inoculum through the 38 µm pores of the AFB. There could also have been an effect of limited microorganism access to substrate after passing through the bag due to high density of substrate in a relatively small space when packed into the AFB. Changing the bottle and AFB size and dimensions to a larger bottle and bag could maybe solve this issue as a larger surface area of AFB would mean a higher flux of inoculum across the pores, resulting in more inoculum getting in contact with substrate. This hypothesis was not further tested but could potentially solve the issues of the differences in results.
In addition to the above statistical tests, the methane yields of the bottles terminated before day 30 for analysis were also compared to each other and to the bottles that ran for 30 days. The yields of bottles terminated at day 14 were significantly different to those terminated at day 3 on the third measurement day (p = 0.0039) and to those terminated on the seventh measurement day (p = 0.0045). The methane yield data of the bottles terminated after 7 and 14 days were also fitted to Modified-Gompertz models (model parameters not shown) and those terminated at day 7 and day 14 had significantly different Rmax values to those that ran for the full 30 days (p = 0.0453 and p = 0.0028, respectively). Rmax of bottles terminated at days 7 and 14 were also significantly different from each other (p = 0.0023). However, fitting the models to the bottles terminated before 30 days was not expected to be particularly accurate due to the limited amount of data to which the curves were fitted. This was also the reason why it was not possible to fit model curves satisfactorily to the data from bottles terminated at day 3. The reader should be reminded that the statistical power of the tests was low as only three replicates being used.
The very slightly reduced Rmax of the mean methane yield data at ISR = 2:1 when using AFB (64.8 mL gVS−1 d−1 compared to 65.9 mL gVS−1 d−1 when not using AFB) of the bottles that ran for 30 days was considered to not invalidate the technique for further study of mineralization.

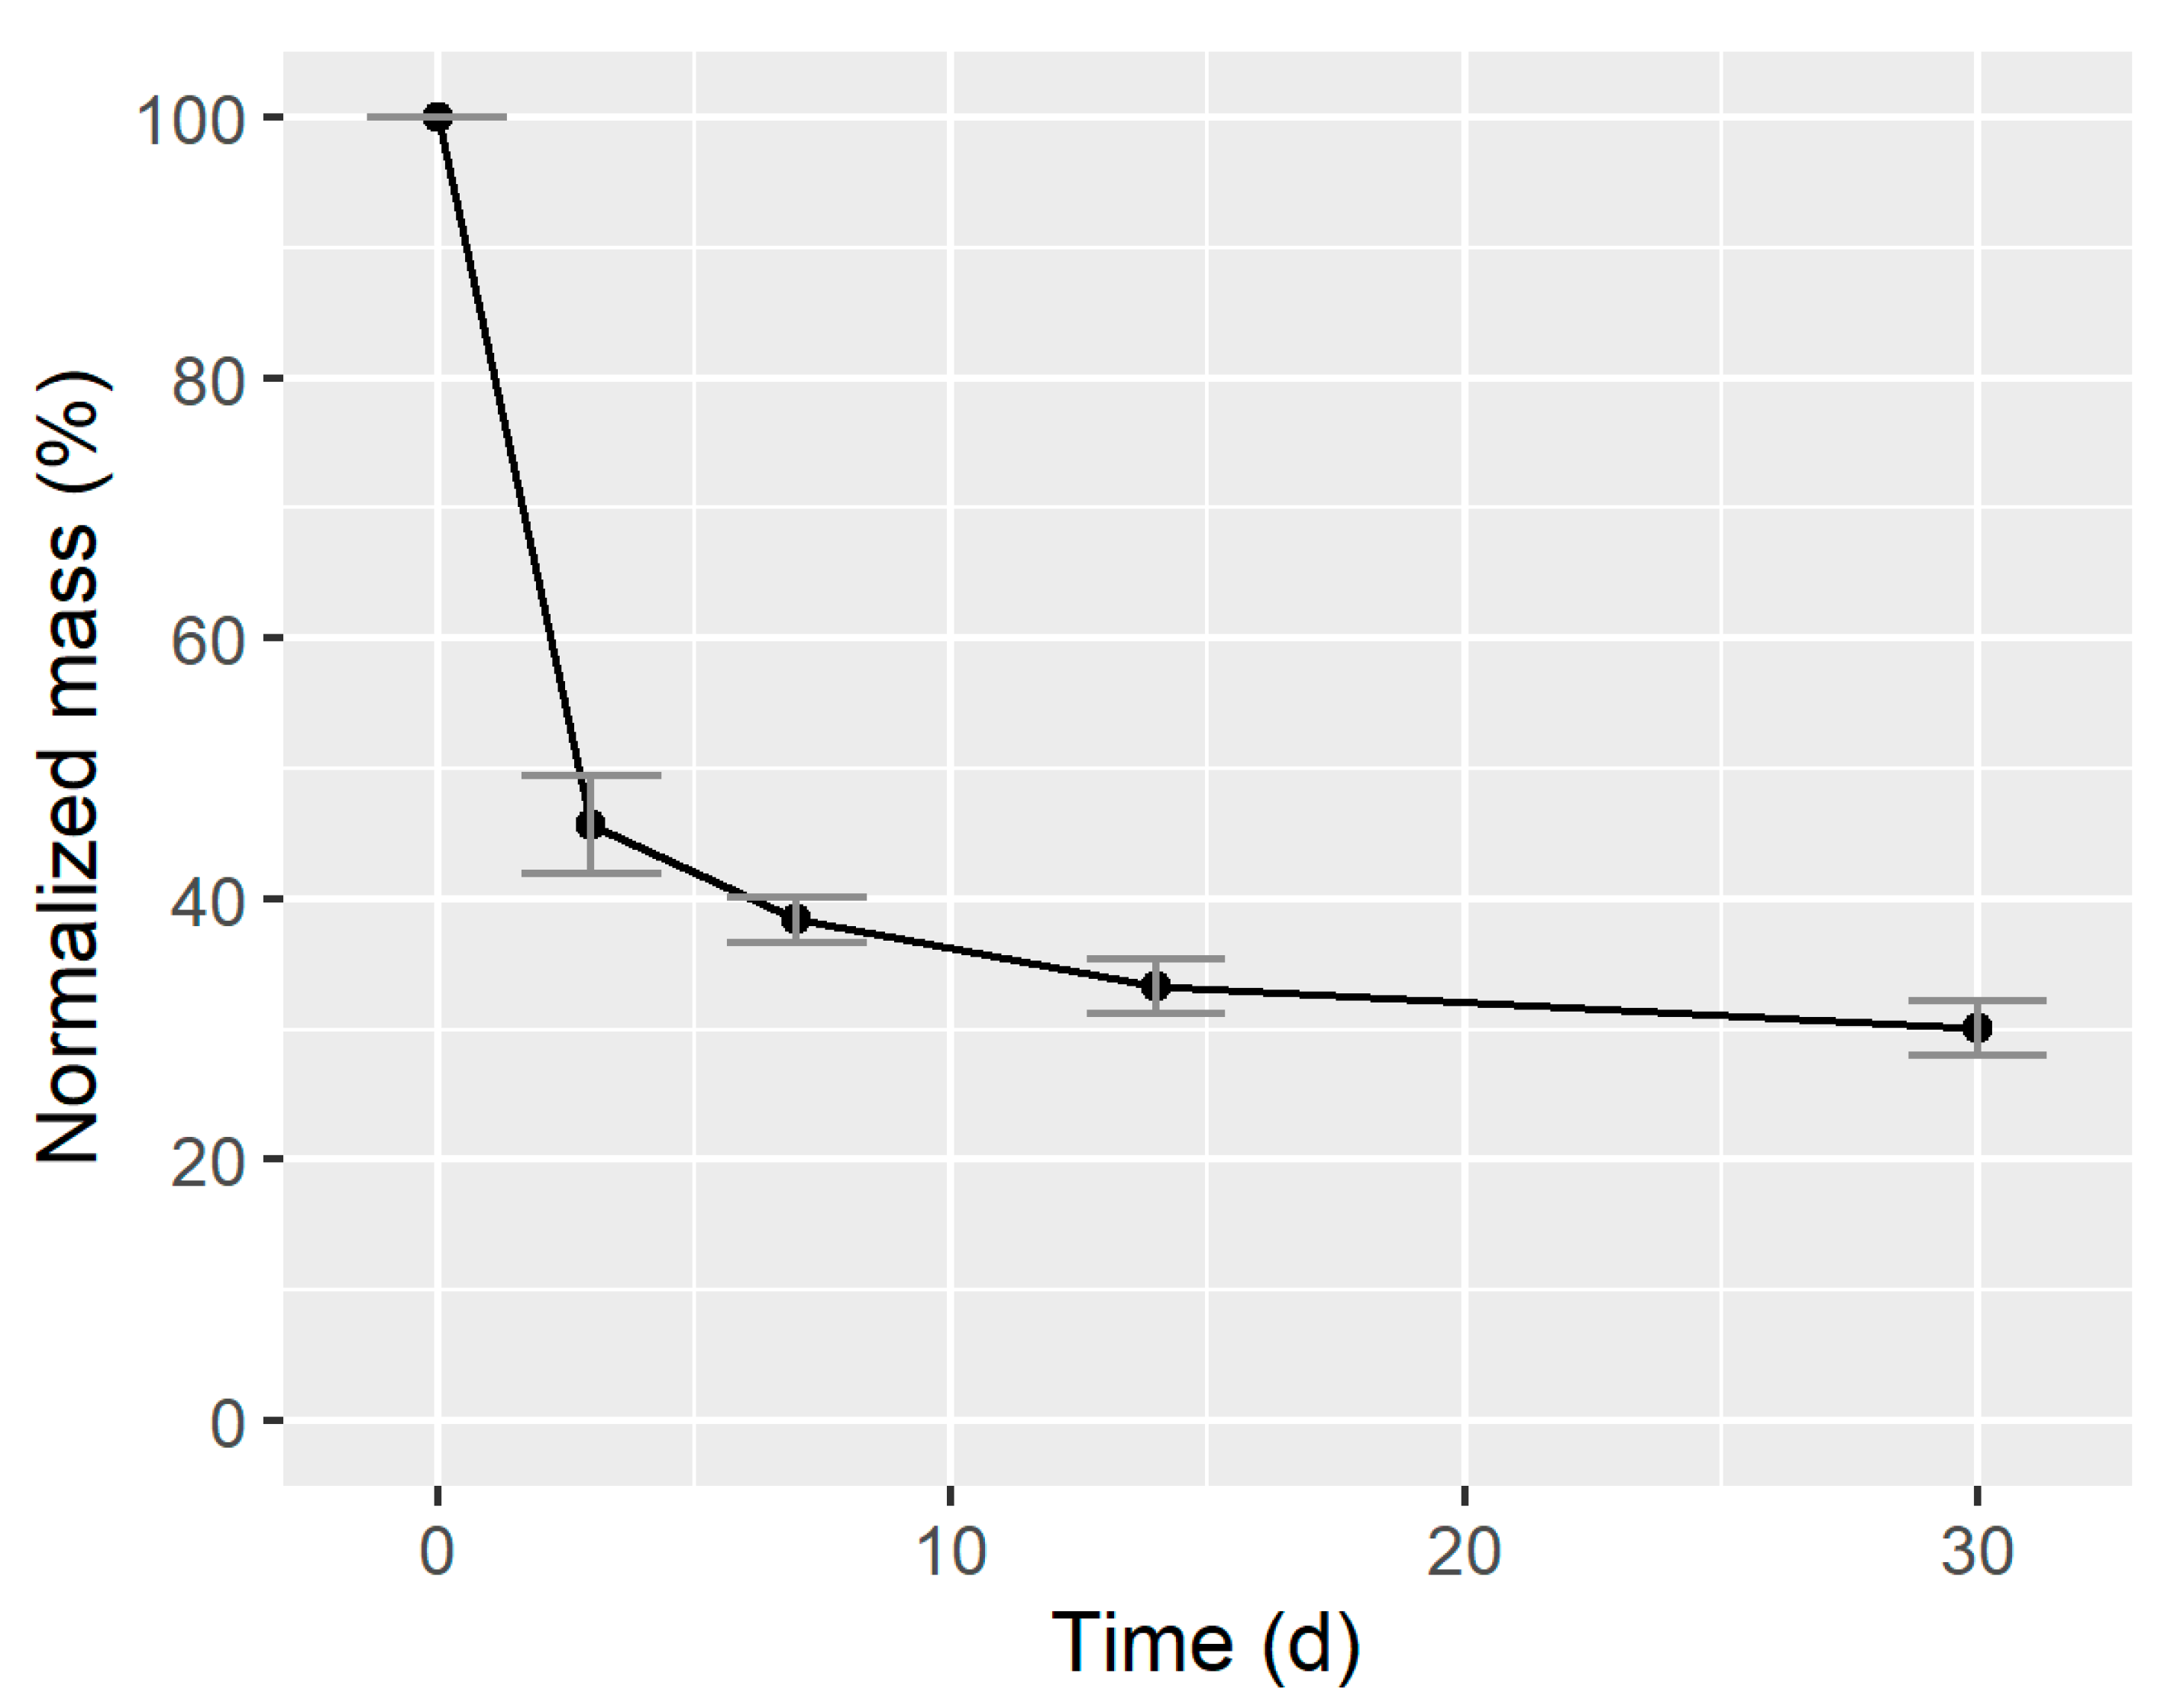
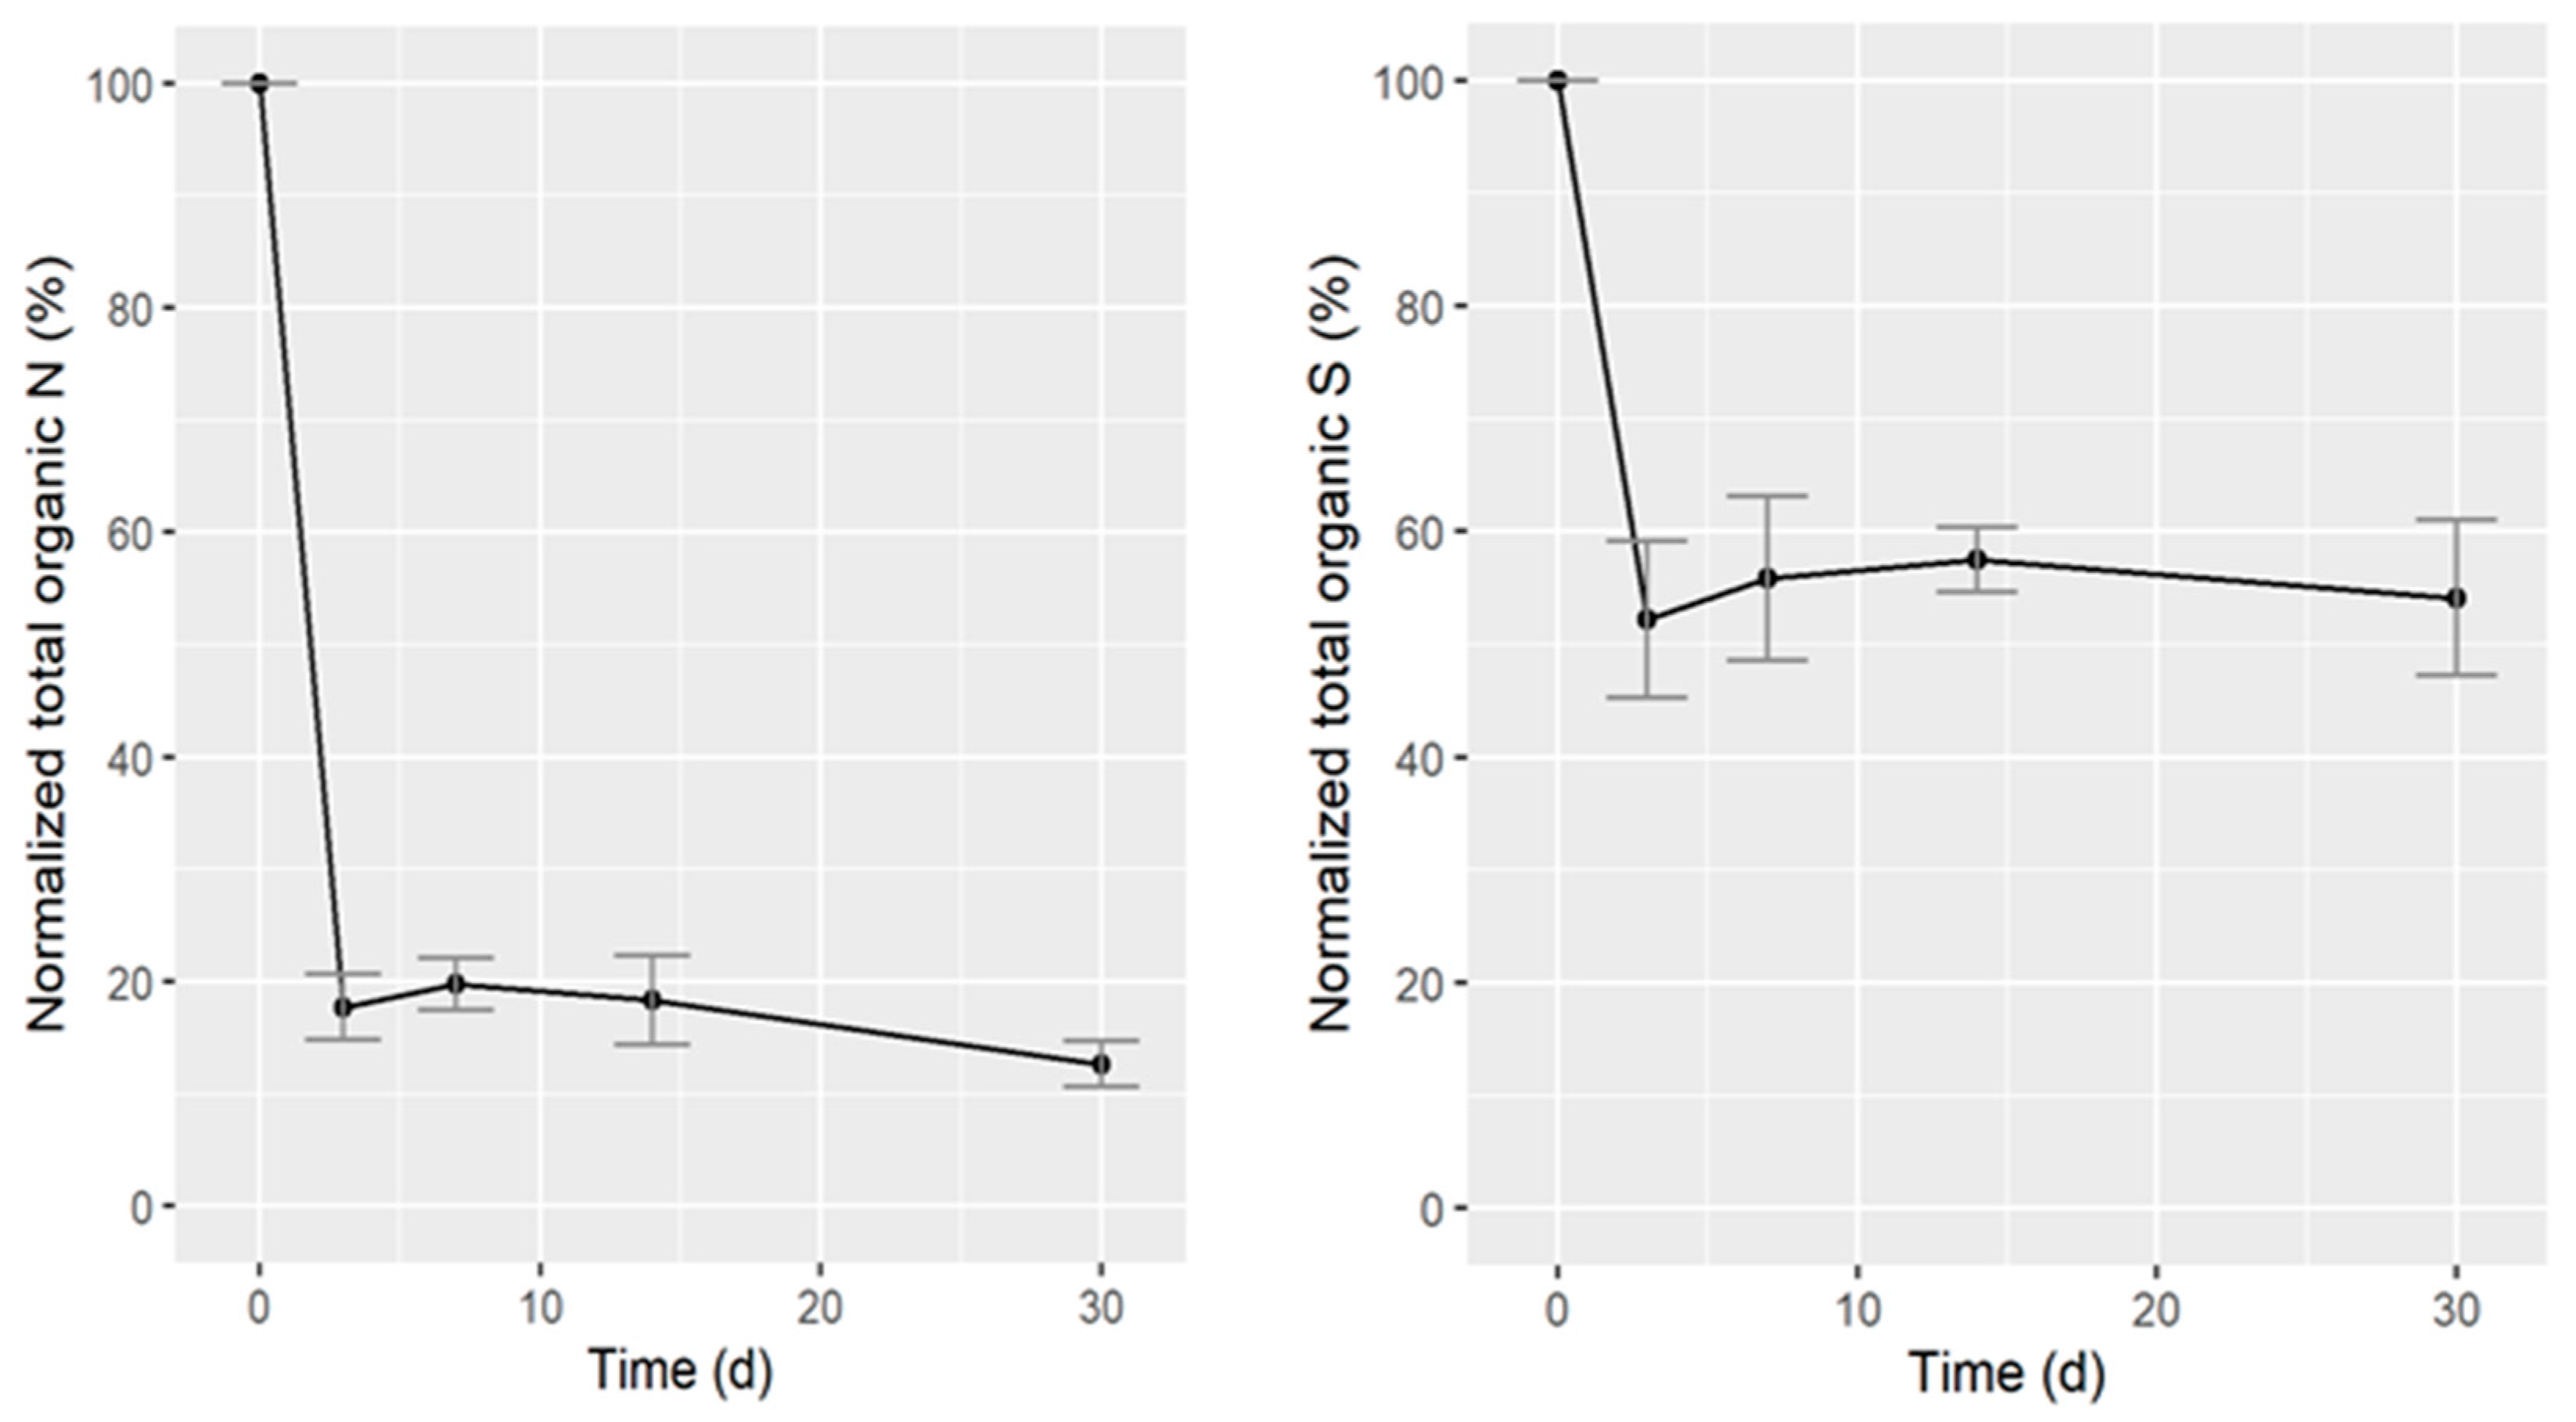
3.1.2. Mineralization in Batch Anaerobic Digestion

The strategy to consider mineralization was to obtain and quantify the mass loss as well as the N and S mass (%) in the feedstock before and after AD. It would therefore require the total mass loss by weighing the AFB before and after digestion and measuring the N and S concentration before and after digestion to obtain the overall mass balance. The mass loss over time is shown in Figure 2.
Overall mass was reduced by a total of 70% for the experiments using the AFB technique. From the experiments not using the AFB technique, data from the gravimetric method showed a similar degradation curve, with a final degradation of CGP of 65% ± 5%. Mass loss during venting includes H and O derived from hydrolytic water consumption (calculated to be about 0.2 g H2O per g substrate VS for all substrates but FG, where net water production is predicted, based on the elemental composition and Buswell and Boyle’s equation [22]) as well as water vapor. Conversely, some produced CO2 typically remains in solution. Therefore, an exact match is not expected. Another contribution to increased mass loss from the weighed bags could be because of material loss due to processing after digestion, e.g., freezing, thawing, washing and drying. Still, the data from the gravimetric method suggest that the material inside the AFB was degraded as much as without the AFB technique. The observed mass loss in Figure 2 was used for the mass balance. The N and S data were measured, and the concentrations applied to the masses remaining in the bags to obtain overall N and S mass, described in Section 2.6.
The N and S mass was obtained by elemental analysis and normalized to the starting mass. N and S curves are shown in Figure 3.
The overall mass had a large decrease during the first 3 days (Figure 2), which also contributes to the reduction in N mass (Figure 3), as the overall N mass was calculated based on a mass balance approach from the mass loss. From the elemental analysis, it was further seen that the average N concentration was reduced from 2.77% to 1.07% (TS-based, data not shown) in 3 days. During the rest of the digestion, the N concentration remained stable at around 1.17%–1.50%. An overall reduction in N mass in the bags was observed to be approximately 87.5% during the 30 days of digestion. The total N mass has a relatively small deviation in measurements between replicates (shown in Figure 3, left), considering the use of both mass loss and elemental analysis, which is often a sensitive analysis. Regarding S mineralization (Figure 3, right), the S concentration, surprisingly, almost doubled, with an increase from 0.11% to 0.20% during digestion (TS-based, data not shown). One measurement at t = 14 d was removed as a confirmed outlier. Since the fraction of S is very low in CGP, the sensitivity of the analysis equipment could influence the result. The increase in S mass is discussed further in Section 3.2.
As mentioned in Section 2, it was assumed that the solubilized material, or particles smaller than 38 µm that leave the AFB, was eventually mineralized. This would need confirmation by sensitive chemical analysis to quantify, as the amount of inoculum was much higher than the used feedstock and therefore would only result in a small overall increase in the concentration of mineralized N and S, mainly as NH4+ or HS.

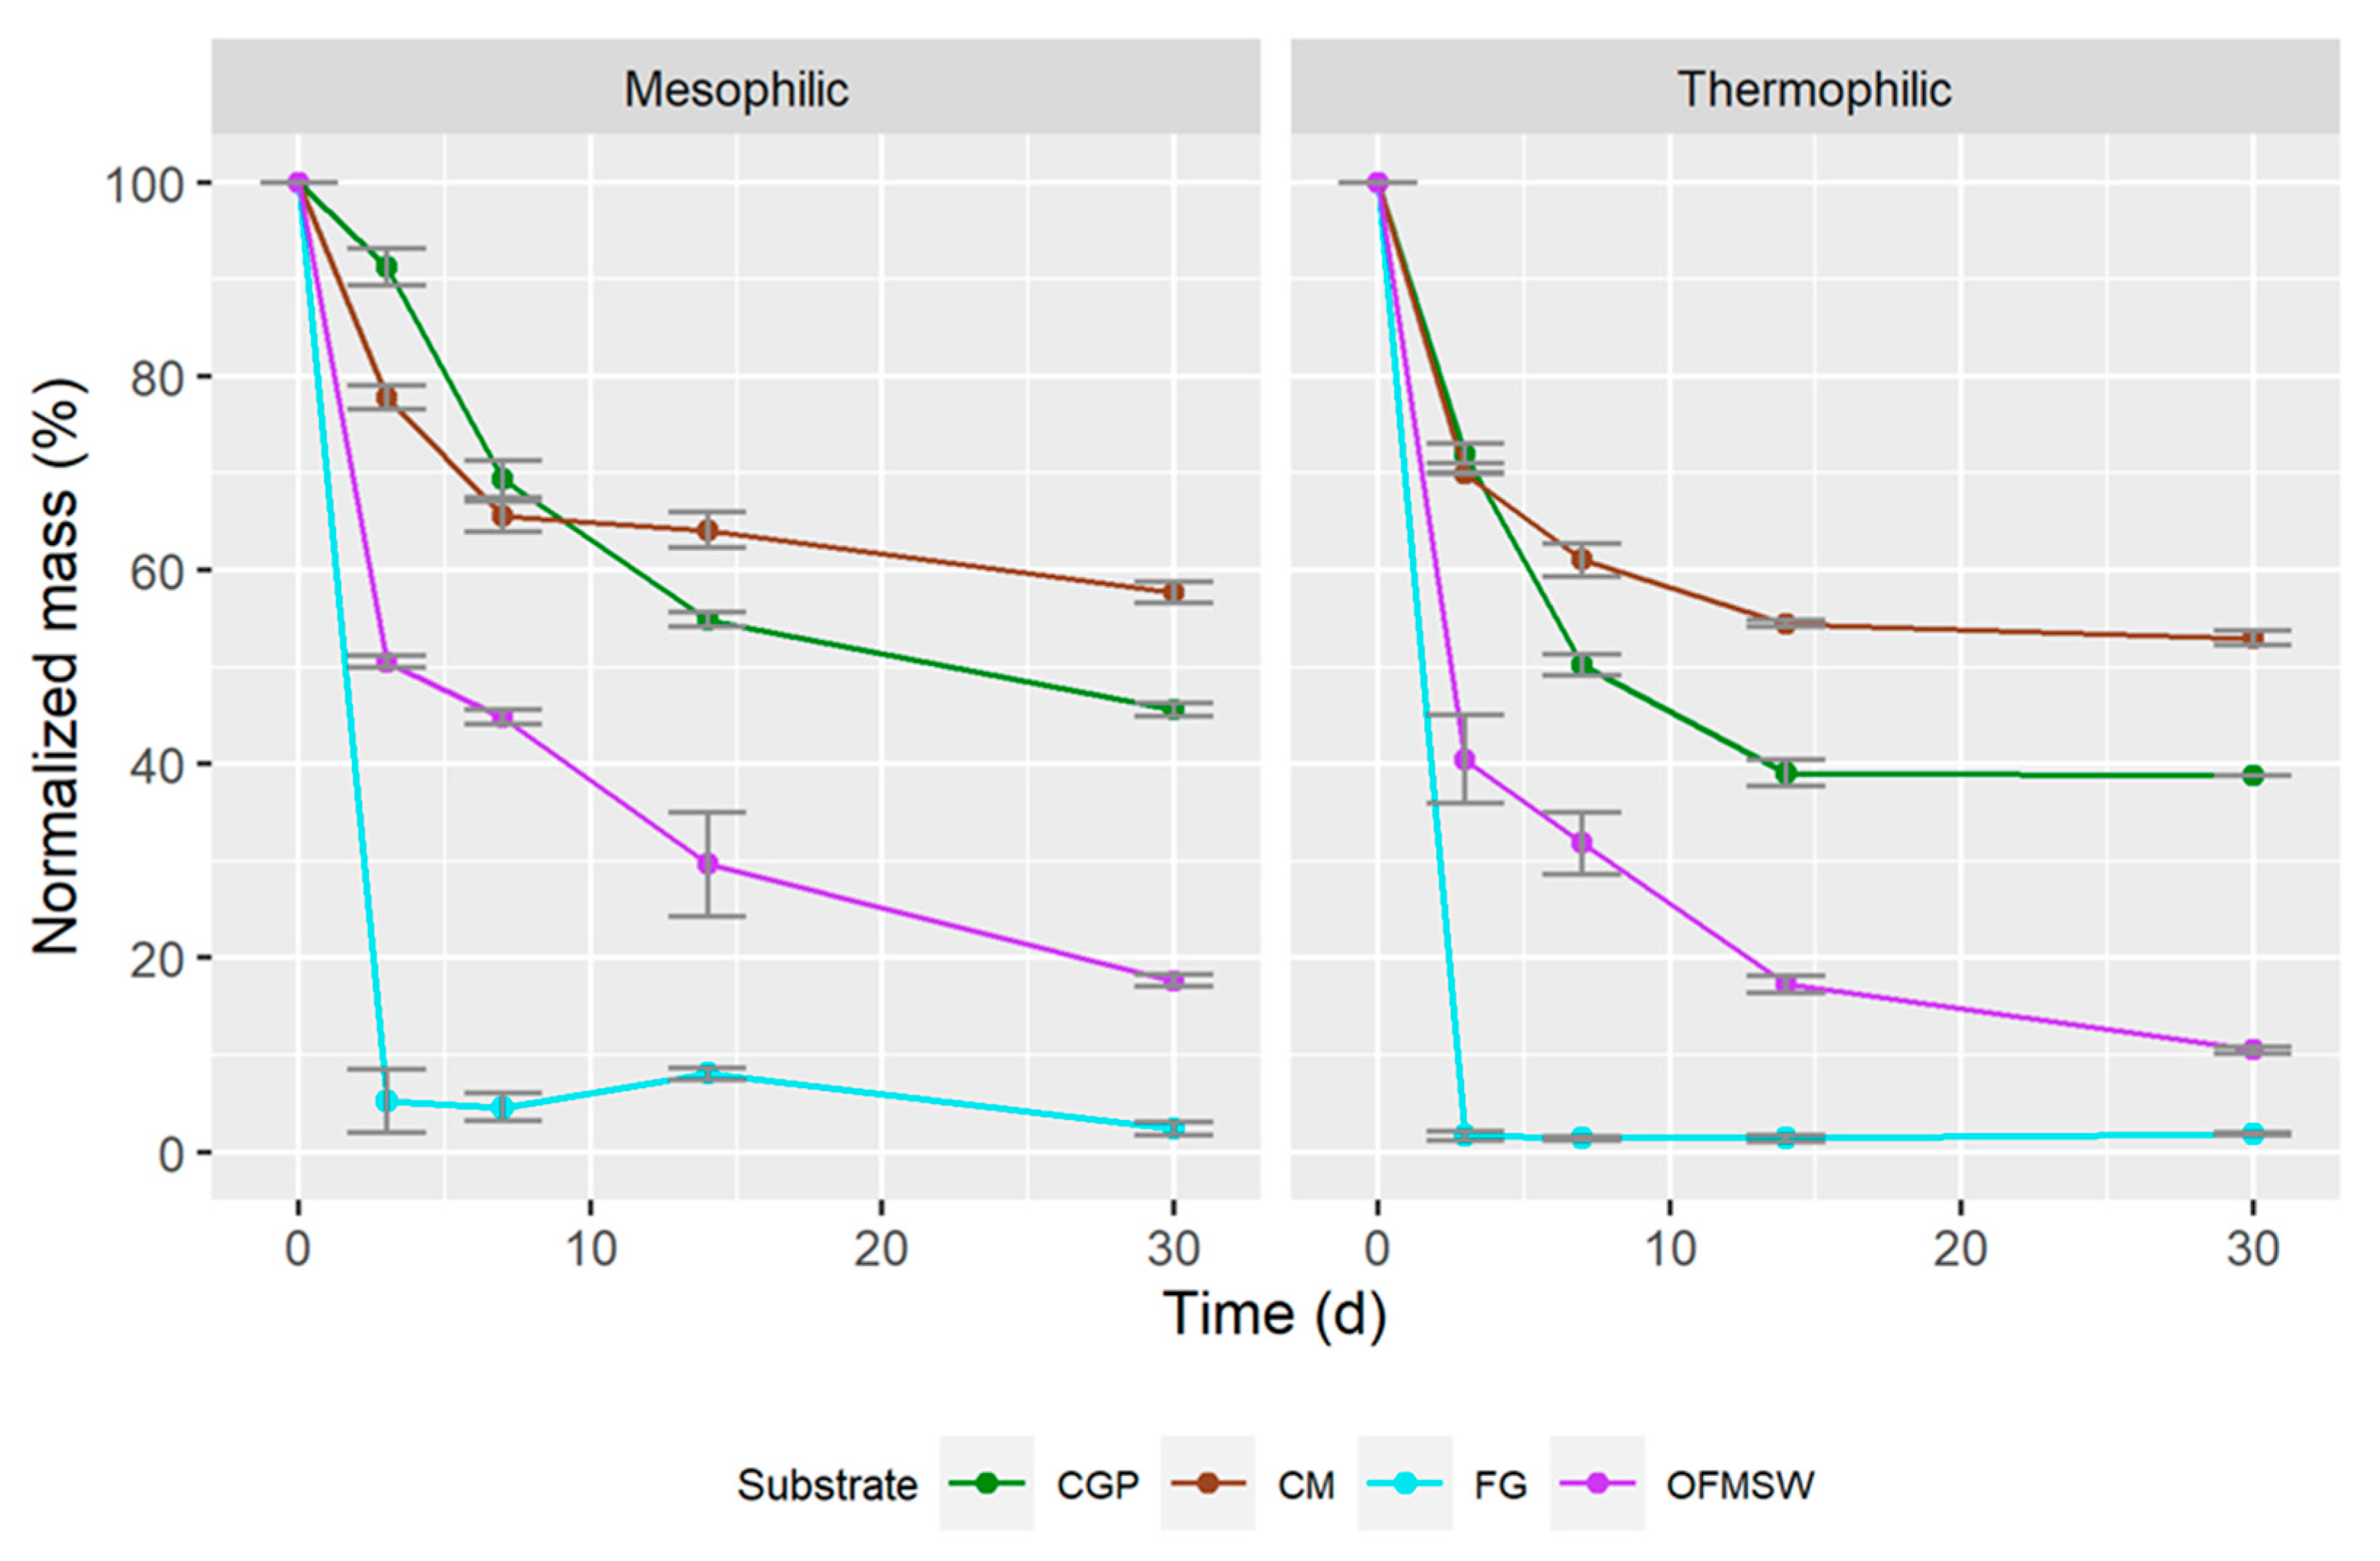
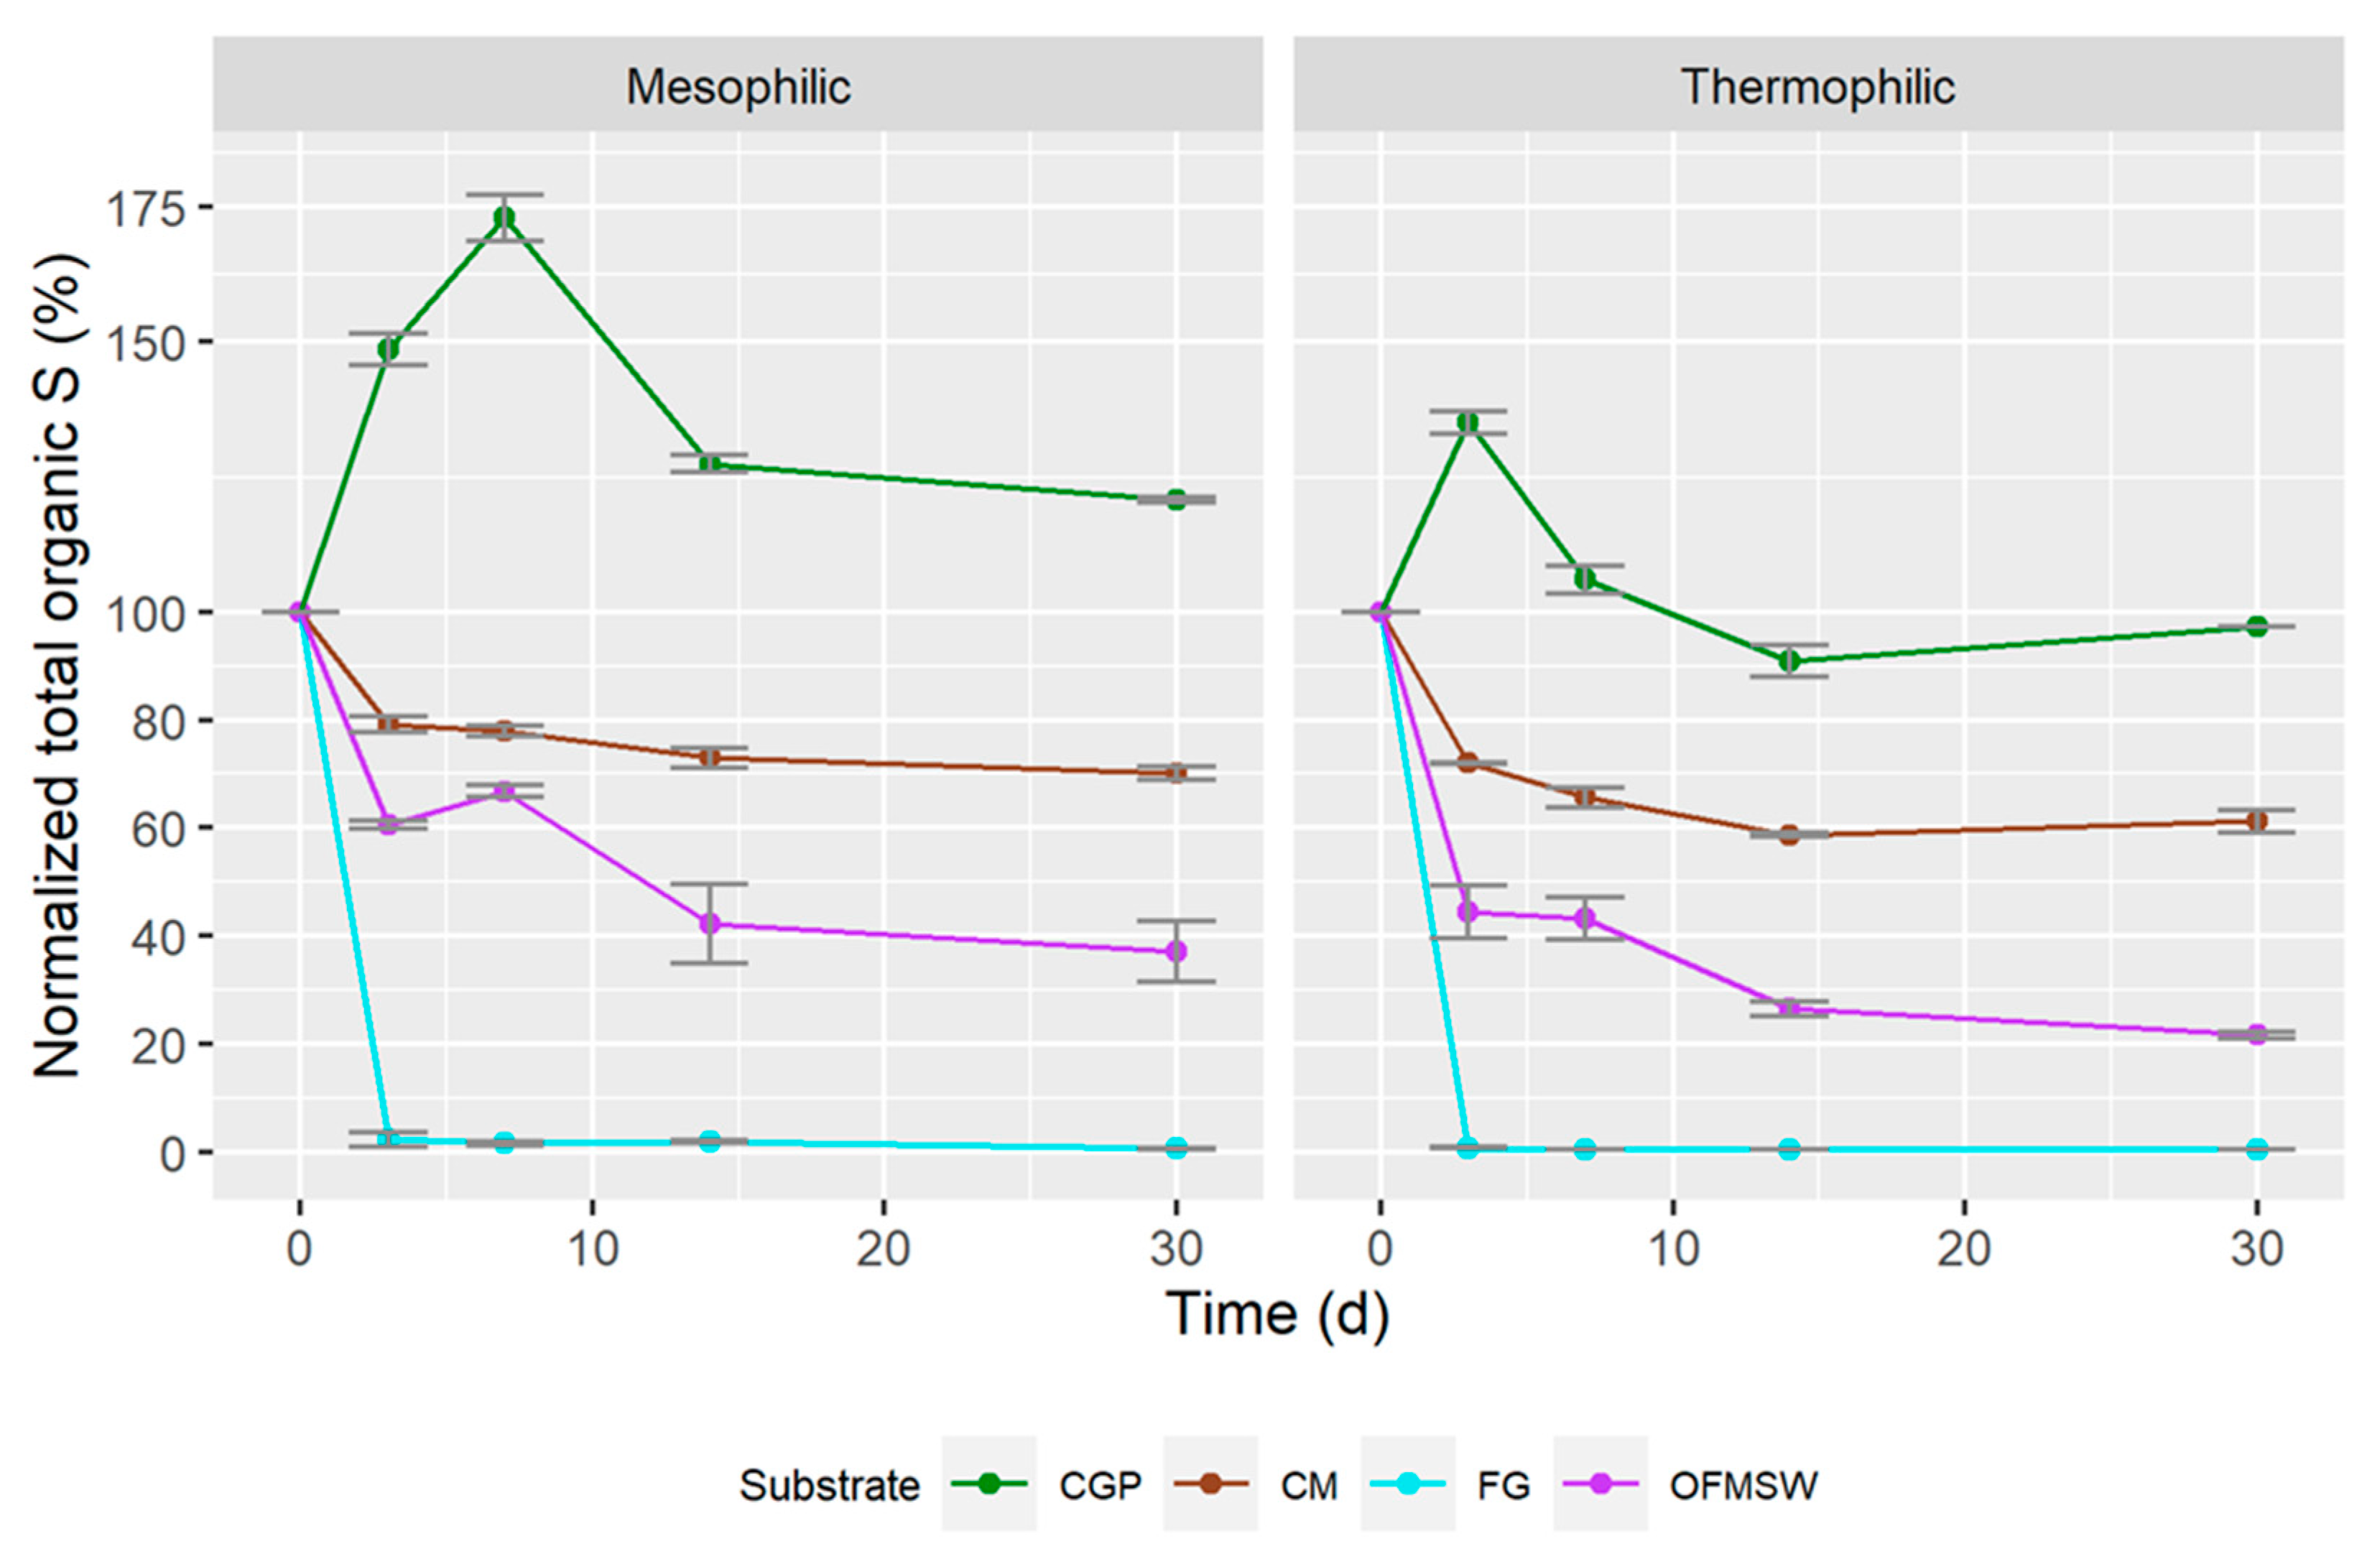
3.2. Semi-Continuous Anaerobic Digestion

Using the same approach as in batch AD, the Dacron bag technique was implemented in a semi-continuous reactor using the four different type of feedstock described in Section 2.3.
The feedstock characteristics are shown in Table 4. The theoretical maximum biochemical methane potential (TBMP) was calculated based on CHNS-O from Boyle’s equation [22]. For the use in the semi-continuous AD experiments all feedstocks were dried prior to use and therefore solid, except FG that was a fatty substrate and therefore semi-solid depending on the temperature. It was intended to use feedstocks high in protein, to make it easier to observe degradation and thereby mineralization. All feedstocks seemed to be appropriate, except FG which was a less typical feedstock and harder to analyze in the laboratory due to its texture. Especially the elemental analysis was not suited for this feedstock which was reflected in the results with very low C and H concentrations for a high-fat substrate, which were expected to be much higher. The TBMP also reflects difficulties as the TBMP is lower than the SMP (Table 4). The SMP curves from the batch AD of FG showed inhibition due to high N and S concentration. Higher BMP could be obtained for FG if longer than 60 days incubations was performed or a higher ISR was used. As FG is not widely used for AD, only few datapoints are currently available. The results for CGP was compared to studies from SEGES and Aarhus University [23]. Which showed higher protein content in raw grass clover. The TBMP was compared to roadside grass from Meyer et al. [24] and was comparable (490 mL gVS−1 for roadside grass vs. 448 mL gVS−1 for CGP). For CM, the N concentration varies from 0.5–4% of the TS depending on the type of cattle, location and diet [25]. The observed SMP was in the lower end compared to other studies [26], however, this could be because the material used was dried manure. The last substrate used was dried organic fraction municipal solid waste (OFMSW) high in N (2.7%) with high SMP (mean of 415 mL gVS−1). OFMSW is becoming more interesting in AD as a larger organic fraction from households can be separated from unwanted components like glass and plastics [27].
The method was used in both mesophilic and thermophilic digestion to compare the influence of operating temperature. Results for mass loss in the remaining bags are shown in Figure 4.
The Dacron bag technique proved very useful in the ability to isolate multiple feedstocks inside two reactors with two different operating conditions. This enabled a direct comparison of digestion patterns even when co-digested with other feedstocks, thereby minimizing the reactors needed to perform the experiments. The bags could easily be removed at different time points with only very short openings of the reactor lid (less than 30 s). Such short opening times should not affect the biology even if small amounts of air would be exposed to the surface of the reactor content. Most of the substrates followed the typical degradation pattern observed in AD (decaying first order kinetics). FG disappeared from the AFB after just 3 days for both mesophilic and thermophilic conditions (Figure 4). This must have been due to the quite low melting point of FG, being semi-solid at room temperature and even more liquid at 40–52 °C. FG is a waste product from the extraction of heparin and has a very high fat content. When comparing the degradation pattern from Figure 4 to the biogas production curve used for the substrate analysis, it was further confirmed that the mass loss could be due to solubilization and not because of quick degradation. This could be confirmed by measuring the melting point however was beyond the scope of this study. No further comment will be made on FG from the semi-continuous AD experiment due to the above-mentioned result, however proved that the technique is mostly suited for solid substrates. For the three solid substrates, expected degradation patterns (1st order) were shown. Generally, the degradation for the thermophilic reactor was faster and an increased degradation was observed for all three feedstocks. After 30 days, thermophilic degradation was around 10% higher than mesophilic (11.1%, 10.1% and 8.0% higher for CGP, CM and OFMSW, respectively). It is commonly known that thermophilic digestion is more rapid, however the yield is comparable over a longer digestion time. A summary of the results is shown in Table 5.
It should be noted that despite the reactors being operated semi-continuously, the substrates held in the bags are not subject to the reactor HRT. Thus, the reactor HRT and solids retention time (SRT) are decoupled and the substrate remaining in the bag is spending longer in the reactor than the bulk fluid. It is possible to adjust the mass losses in the bags to compensate for this effect. In the study conducted by Ward et al. [28], calculations were made to calculate mass loss over time, based on HRT and an assumption of perfect mixing (i.e., complete homogenization of reactor contents). One could apply such calculations of mass loss over time due to washout caused by the continuous operation and apply corrections to the measured masses remaining in the bags. This could be used to improve the method with continuous reactors, but should be used with some caution due to the assumption of perfect mixing.
Regarding mineralization of N and S, the AFB technique was useful as the content of each bag could easily be analyzed after the specific time point. The total organic N and S were obtained as the washing and drying procedure should have removed most of the inorganic N and S. Results for organic N mass in the semi-continuous AD are shown in Figure 5.
From Figure 5, the rate of N mass reduction is high for all substrates from t = 0–3 d, except CGP in mesophilic conditions, and decreases over time afterwards. The operating conditions seem to have a much greater impact on N mass release than overall mass (Figure 4). The overall mineralization of N was approximately 31%, 39% and 12% higher for CGP, CM and OFMSW, respectively with thermophilic conditions compared to mesophilic conditions. As the N concentration was measured directly from the dried feedstock and not as changes in the digestate, the N concentration is independent of the chemical equilibrium that changes towards more ammonia gas in case of higher temperature and pH. Therefore, an increased rate of deamination of proteins in the thermophilic reaction including less recalcitrant biomass to be further broken down is expected. To further illustrate this, the residual N mass at day 30 was compared between thermophilic and mesophilic conditions and was significantly lower for CGP and CM (13.9% and 7.4%, respectively), however, it was 28.4% higher for thermophilic digestion of OFMSW. There was a significant difference when comparing the N concentration of CGP of the batch AD (Section 3.1.2) with the N concentration of CGP from semi-continuous AD. The N concentration difference from CGP was observed to be 137% higher for the semi-continuous AD compared to the batch AD. The influence of co-digestion with cattle manure and other feedstocks could be a factor influencing the N concentration in the fibers of CGP, but it would need additional study for confirmation. As CGP was the sole feedstock used for the batch AD, other feedstocks could not be compared with batch AD. As previously mentioned, it was assumed that the solubilized N would eventually be mineralized over time; however, this theory would need to be validated in future studies.
For the S mineralization, similar trends were observed with a higher fraction of release with thermophilic conditions; the results are shown in Figure 6. The rate of S mass reduction is high for all substrates from t = 0 to t = 3 d and decreases over time afterwards, except for CGP.
Most notable is the increase in total S mass over 30 days for CGP at mesophilic conditions, and the first 7 days for thermophilic conditions. The S concentration (% in residual TS) increased from 0.17% to 0.42% for the mesophilic conditions and from 0.17% to 0.38% for the thermophilic conditions. A slight increase from 0.11–0.20% was observed in the batch AD (Section 3.1.2). The scientific knowledge on the effect of AD on fibrous biomass investigating the S concentration in the fiber is limited. The increase could be the caused by lower breakdown of stronger di-sulfide bonds and less degradation of cysteine and methionine compared to other amino acids during AD [29]. Cysteine and glycine were the amino acids lost the least from nylon bags during degradation in the rumen of certain animal feeds, although this was not the case for other feeds [30]. Only cysteine and methionine contain S in the amino acid structure, whereas all amino acids contain N. The proteins left after pulping will be cell wall proteins, either structural or otherwise held in the cell wall fibers [31]. It has also been shown that pulped clovers and grasses have comparable crude protein values with fresh material, but a higher amino acid concentration, suggesting that the pulping process removed non-protein N more favorably than protein N [31]. Another explanation for the increase in overall S mass could be bacterial growth inside the filter bags consuming inorganic S. Microbial pollution can be slightly reduced using a stomacher in future experiments [32].
The S degradation of CM and OFMSW seemed realistic reaching 40% and 80% degradation in the thermophilic digester, as it has been shown that less than 50% of added S leaves a digester in the digestate [33]. The S concentration also increased during digestion of these feedstock, from 0.63% to 0.73% for CM and 0.26% to 0.54% for OFMSW. All N and S concentrations during the semi-continuous AD experiments are shown in Table 6.
Another strategy to further measure the S mineralization is measuring the H2S and CH3SH concentration in the gas phase. H2S is usually formed from breakdown of cysteine, whereas CH3SH is formed from the breakdown of methionine [34]. The mineralized content in solution could be modelled by the signal from the gas phase, however, this has the same limitations as measuring directly in solution; the difference in signal is only a small fraction compared to the signal blank and requires very sensitive equipment. In this experiment approximately 115 kg of inoculum was used, in each reactor, and approximately 140 kg of cattle manure was used as co-digestion material through the 30 days. This amount would most certainly account for almost the entire signal, as just 25–50 g was used for each AFB. To conduct such experiments, a substrate containing large amounts of S should be used in batch AD with an inoculum with very low S concentration. To sum up, the semi-continuous AD, the overall mass, N mass and S mass for T0 and T30 including the reduction are shown in Table 5.

3.3. Potential and Further Aspects

The Dacron bag technique proved to be useful in its ability to separate feedstocks during AD to obtain certain relevant information from later analysis. In industry, biogas plants are optimized for different feedstocks depending on CH4 potential, price, nutrient content, need for pretreatment, processing cost, degradability, methane concentration (% of total biogas) and much more. The degradability is often measured based on gas potential, where the gas produced is compared to the TBMP. With the presented method, degradability from solid feedstocks becomes much more accurate at a very low cost, as the only equipment needed is a scale, a bottle and a Dacron bag. Regarding nutrients, the technique showed potential to quantify the disappearance of N and S into solution, using elemental analysis and mass loss, creating an overall mass balance, N balance and S balance. The technique was limited to solid feedstocks. There is no immediate solution to fix this issue, as transport through the pores is part of the process. A smaller pore size in the AFB could enable more types of feedstock with smaller particles size to be used in the technique but could influence the digestion kinetics. A downside of a smaller pore size is a lower transport of microbial cells through the pores, thereby decreasing the degradation rate. In an experiment over a long digestion period (>60 days), smaller pores should not influence the overall yield, however, this theory would require testing. In ruminant digestion studies, 12 micron pore size in bags is commonly used [35].

4. Conclusions

The present study demonstrated that the mobile AFB technique can be successfully used to study feedstock degradation and kinetics in anaerobic digestion. The AFB had relatively low influence on biogas production in situations with high ISR and it was shown that the bag itself did not degrade during AD. The method can be used for solid feedstocks such as agricultural solid waste (grasses, silage, etc.) and other solid waste feedstocks (dried OFMSW and dried manure). To conclude whether the method can be used with lower ISR, more experiments comparing bagged and non-bagged substrates would be required. The technique should be limited to solid feedstocks, as the semi-solid Fertigro® melted at reactor temperature. The method was successfully used in a more industrial-like operations and enabled the study of degradation of organic matter, as well as N and S mass reduction, from the presented feedstocks. A higher degree of degradation and N and S mineralization occurred at thermophilic conditions (52 °C) compared to mesophilic conditions (40 °C). The study showed a significant increase in especially the S concentration in residual TS in all feedstocks during the digestion period. Further investigation of whether the N and S is mineralized into solution as inorganic is necessary to confirm that the mass balance approach is reliable. An extended approach that includes measurements of inorganic N and S mass would improve the method.

Supplementary Materials

The following are available online at https://www.mdpi.com/article/10.3390/en14144205/s1, Figure S1: Individual AFB with CGP substrate after retrieval, washing and drying, Figure S2: AFBs attached to a stainless steel chain, before immersion in continuous reactor.

Author Contributions

Conceptualization, J.R.M., S.D.H. and H.B.M.; methodology, J.R.M., M.R.W., S.D.H. and H.B.M.; software, S.D.H.; validation, A.J.W., M.R.W., S.D.H. and H.B.M.; formal analysis, J.R.M., A.J.W. and S.D.H.; investigation, J.R.M.; resources, M.R.W. and H.B.M.; data curation, J.R.M.; writing—original draft preparation, J.R.M.; writing—review and editing, A.J.W., M.R.W., S.D.H. and H.B.M.; visualization, J.R.M.; supervision, S.D.H. and H.B.M.; project administration, S.D.H. and H.B.M.; funding acquisition, H.B.M. All authors have read and agreed to the published version of the manuscript.

Funding

This research was funded by the Green Development and Demonstration Program (GUDP: Climoptic project 34009-18-1384).

Institutional Review Board Statement

Not applicable.

Informed Consent Statement

Not applicable.

Data Availability Statement

Data are available through contact with the corresponding author.

Acknowledgments

The authors of this paper are very grateful to all contributors of the project, including the laboratory technicians and fellow researchers at the Aarhus University Biogas Research Center in Foulum, Denmark. Thanks to Karin Dyrberg from the Department of Agroecology, Aarhus University for the external elemental analysis and sulphur analysis. A special thanks to Cecilie Nielsen at the Department of Engineering, Aarhus University for elemental analysis of all samples. Lastly, a thanks to Kasper Stefanek and Rasmus Bernsdorf from HedeDanmark A/S for providing samples of Fertigro®.

Conflicts of Interest

The authors declare no conflict of interest. The funders had no role in the design of the study; in the collection, analyses, or interpretation of data; in the writing of the manuscript, or in the decision to publish the results.

References

  1. ACEA. Position Paper—Charging and Re-Fuelling Infrastructure Required for Heavy-Duty Vehicles. Automobile Manufacturers Association. 2020. Available online: https://www.acea.auto/publication/position-paper-charging-and-refuelling-infrastructure-required-for-heavyduty-vehicles/ (accessed on 25 November 2020).
  2. Blake, L.I.; Halim, F.A.; Gray, C.; Mair, R.; Manning, D.A.C.; Sallis, P.; Hutchinson, H.; Gray, N.D. Evaluating an anaerobic digestion (AD) feedstock derived from a novel non-source segregated municipal solid waste (MSW) product. Waste Manag. 2017, 59, 149–159. [Google Scholar] [CrossRef] [Green Version]
  3. Allegue, L.B.; Hinge, J. Biogas and Bio-Syngas Upgrading; Danish Technological Institute: Aarhus, Danmark, 2012. [Google Scholar]
  4. Díaz Vázquez, D.; Alvarado-Cummings, S.C.; Meza-Rodriguez, D.; Senés-Guerrero, C.; de Anda, J.; Gradilla-Hernández, M.S. Evaluation of Biogas Potential from Livestock Manures and Multicriteria Site Selection for Centralized Anaerobic Digester Systems: The Case of Jalisco, México. Sustainability 2020, 12, 3527. [Google Scholar] [CrossRef]
  5. EIP-AGRI Focus Group. Reducing Emissions from Cattle Farming; Final Report; European Commission: Brussels, Belgium, 2017. [Google Scholar]
  6. Ward, A.J.; Hobbs, P.J.; Holliman, P.J.; Jones, D.L. Optimisation of the anaerobic digestion of agricultural resources. Bioresour. Technol. 2008, 99, 7928–7940. [Google Scholar] [CrossRef]
  7. Paungfoo-Lonhienne, C.; Lonhienne, T.G.A.; Rentsch, D.; Robinson, N.; Christie, M.; Webb, R.I.; Gamage, H.K.; Carroll, B.J.; Schenk, P.M.; Schmidt, S. Plants can use protein as a nitrogen source without assistance from other organisms. Proc. Natl. Acad.Sci. USA 2008, 105, 4524–4529. [Google Scholar] [CrossRef] [Green Version]
  8. Olesen, J.E.; Møller, H.B.; Petersen, S.O.; Sørensen, P.; Nyord, T.; Sommer, S.G. Bæredygtig Biogas—Klima og Miljøeffekter af Biogasproduktion; 28 s.—DCA rapport nr. 175; Aarhus Universitet, DCA—Nationalt Center for Fødevarer og Jordbrug: Tjele, Danmark, 2020; Available online: https://dcapub.au.dk/djfpdf/DCArapport175.pdf (accessed on 2 December 2020).
  9. Yan, L.i.; Ye, J.; Zhang, P.; Xu, D.; Wu, Y.; Liu, J.; Zhang, H.; Fang, W.; Wang, B.; Zeng, G. Hydrogen sulfide formation control and microbial competition in batch anaerobic digestion of slaughterhouse wastewater sludge: Effect of initial sludge pH. Bioresour. Technol. 2018, 259, 67–74. [Google Scholar] [CrossRef]
  10. Ghoorchi, T.; Lund, P.; Larsen, M.; Hvelplund, T.; Hansen-Møller, J.; Weisbjerg, M.R. Assessment of the mobile bag method for estimation of in vivo starch digestibility. Animal 2013, 7, 265–271. [Google Scholar] [CrossRef] [PubMed] [Green Version]
  11. Hafner, S.D.; Rennuit, C.; Olsen, P.J.; Pedersen, J.M. Quantification of leakage in batch biogas assays. Water Pract. Technol. 2018, 13, 52–61. [Google Scholar] [CrossRef]
  12. Hafner, S.D.; Rennuit, C.; Triolo, J.M.; Richards, B.K. Validation of a simple gravimetric method for measuring biogas production in laboratory experiments. Biomass Bioenerg. 2015, 83, 297–301. [Google Scholar] [CrossRef]
  13. Hafner, S.D.; Richards, B.K.; Astals, S.; Holliger, C.; Koch, K.; Weinrich, S. Calculation of Methane Production from Gravimetric Measurements. Standard BMP Methods Document 203, Version 1.1. 2020. Available online: https://raw.githubusercontent.com/sashahafner/BMP-methods/master/200_BMP_calculations.pdf (accessed on 12 March 2021).
  14. Hafner, S.D.; Astals, S.; Holliger, C.; Koch, K.; Weinrich, S. Calculation of Biochemical Methane Potential (BMP). Standard BMP Methods Document 200, Version 1.7. 2020. Available online: https://raw.githubusercontent.com/sashahafner/BMP-methods/master/203_gravimetric_calculations.pdf (accessed on 12 March 2021).
  15. Hafner, S.D.; Koch, K.; Carrere, H.; Astals, S.; Weinrich, S.; Rennuit, C. Software for Biogas Research: Tools for Measurement and Prediction of Methane Production. SoftwareX 2018, 7, 205–210. [Google Scholar] [CrossRef]
  16. Eriksen, J.; Sørensen, P.; Elsgaard, L. The fate of sulfate in acidified pig slurry during storage and following application to cropped soil. J. Environ. Qual. 2008, 37, 280–286. [Google Scholar] [CrossRef] [Green Version]
  17. APHA. Standard Methods for the Examination of Water and Wastewater, 21st ed.; APHA: Washington, DC, USA, 2005. [Google Scholar]
  18. Holliger, C.; Astals, S.; de Laclos, H.F.; Hafner, S.D.; Koch, K.; Weinrich, S. Towards a standardization of biomethane potential tests: A commentary. Water Sci. Technol. 2021, 83, 247–250. [Google Scholar] [CrossRef] [PubMed]
  19. Holliger, C.; de Laclos, H.F.; Hafner, S.D.; Koch, K.; Weinrich, S.; Astals, S.; Alves, M.; Andrade, D.; Angelidaki, I.; Appels, L.; et al. Requirements for Measurement of Biochemical Methane Potential (BMP). Standard BMP Methods Document 100, Version 1.9. 2021. Available online: https://www.dbfz.de/en/BMP (accessed on 12 March 2021).
  20. Li, P.; Li, W.; Sun, M.; Xu, X.; Zhang, B.; Sun, Y. Evaluation of Biochemical Methane Potential and Kinetics on the Anaerobic Digestion of Vegetable Crop Residues. Energies 2018, 12, 26. [Google Scholar] [CrossRef] [Green Version]
  21. Koch, K.; Hafner, S.D.; Weinrich, S.; Astals, S. Identification of Critical Problems in Biochemical Methane Potential (BMP) Tests from Methane Production Curves. Front. Environ. Sci. 2019. [Google Scholar] [CrossRef]
  22. Boyle, W.C. Energy recovery from sanitary landfills—A review. In Microbial Energy Conversion; Schlegel, H.G., Barnea, S., Eds.; Elsevier: Amsterdam, The Netherlands, 1977; pp. 119–138. [Google Scholar]
  23. Fog, E. Protein Feed from Clover Grass for Pigs and Poultry. Results from Danish Innovation Projects; Technical Report Presented at Agromania: Herning, Denmark, 27–30 November 2018. [Google Scholar]
  24. Meyer, A.K.P.; Ehimen, E.A.; Holm-Nielsen, J.B. Bioenergy production from roadside grass: A case study of the feasibility of using roadside grass for biogas production in Denmark. Resour. Conserv. Recycl. 2014, 93, 124–133. [Google Scholar] [CrossRef] [Green Version]
  25. Paul, S.; Onduru, D.; Wouters, B.; Gachimbi, L.; Zake, J.; Ebanyat, P.; Ergano, K.; Abduke, M.; van Keulen, H. Cattle Manure Management in East Africa: Review of Manure Quality and Nutrient Losses and Scenarios for Cattle and Manure Management; Wageningen UR Livestock Research, Technical Report No. 258; Staff Publications: Long Island City, NY, USA, 2009. [Google Scholar]
  26. Møller, H.B.; Moset, V.; Brask, M.; Weisbjerg, M.R. Feces composition and manure derived methane yield from dairy cows: Influence of diet with focus on fat supplementation and roughage type. Atmos. Environ. 2014, 94, 36–43. [Google Scholar] [CrossRef]
  27. ECOGI. Pre-Treatment of Biomass for Anaerobic Digestion; ETV Test Report, Project No.: 1005; ETA: Copenhagen, Danmark, 2015. [Google Scholar]
  28. Ward, A.J.; Feng, L.; Moset, V.; Moller, H.B. Estimation of methane yields in continuous biogas reactors using kinetic and mass flow models Estimation of Methane Yields in Continuous Biogas Reactors Using Kinetic and Mass Flow Models. Chem. Eng. Technol. 2018, 41, 761–767. [Google Scholar] [CrossRef]
  29. Park, J.; Park, S.; Kim, M. Anaerobic degradation of amino acids generated from the hydrolysis of sewage sludge. Environ. Technol. 2014, 35, 1133–1139. [Google Scholar] [CrossRef] [PubMed]
  30. Skiba, B.; Weisbjerg, M.R.; Hvelplund, T. Rumen and total intestinal tract digestibility of protein and amino acids from different roughages, determined in situ. J. Anim. Feed Sci. 1996, 5, 347–363. [Google Scholar] [CrossRef]
  31. Damborg, V.K.; Stødkilde, L.; Jensen, S.K.; Weisbjerg, M.R. Protein value and degradation characteristics of pulp fibre fractions from screw pressed grass, clover, and lucerne. Anim. Feed Sci. Technol. 2018, 244, 93–103. [Google Scholar] [CrossRef]
  32. Hvelplund, T.; Weisbjerg, M.R. In situ techniques for the estimation of protein degradability and postrumen availability. In Forage Evaluation in Ruminant Nutrition; Givens, D.I., Oven, E., Axford, R.F.E., Omed, H.M., Eds.; CAB International: Wallingford, UK, 2000; pp. 233–258. [Google Scholar]
  33. Massé, D.I.; Croteau, F.; Masse, L. The fate of crop nutrients during digestion of swine manure in psychrophilic anaerobic sequencing batch reactors. Biores. Technol. 2007, 98, 2819–2823. [Google Scholar] [CrossRef] [PubMed]
  34. He, R.; Yao, X.; Chen, M.; Ma, R.; Li, H.; Wang, C.; Ding, S. Conversion of sulfur compounds and microbial community in anaerobic treatment of fish and pork waste. Waste Manag. 2018, 76, 383–393. [Google Scholar] [CrossRef] [PubMed]
  35. Krämer, M.; Weisbjerg, M.R.; Lund, P.; Jensen, C.S.; Pedersen, M.G. Estimation of indigestible NDF in forages and concentrates from cell wall composition and organic matter digestibility. Anim. Feed Sci. Technol. 2012, 177, 40–51. [Google Scholar] [CrossRef]
Figure 1. Comparison of specific methane yields with/without the AFB technique. The yield over time is shown for CGP. Error bars show standard deviation (n = 3). Only one replicate was made for AFB only.
Energies 14 04205 g001
Figure 2. Overall mass loss from bags from the batch anaerobic digestion experiment using CGP as substrate. Error bars show standard deviation (n = 3).
Energies 14 04205 g002
Figure 3. Total N and S mass of digested CGP in bags over time, normalized to the initial N and S mass. Error bars show standard deviation (n = 3).
Energies 14 04205 g003
Figure 4. Total mass remaining in Dacron bags over time in continuous experiment. Two different conditions (mesophilic, left and thermophilic, right) are shown with four different substrates. Substrates used are clover grass pulp (green), cattle manure (brown), Fertigro® (blue) and organic fraction municipal solid waste (purple). Error bars show standard deviation (n = 3).
Energies 14 04205 g004
Figure 5. Total nitrogen remaining in Dacron bags over time in continuous experiment. Two different conditions (mesophilic, left and thermophilic, right) are shown with four different substrates. Error bars show standard deviation (n = 3).
Energies 14 04205 g005
Figure 6. Total S remaining in Dacron bags over time in continuous experiment. Two different conditions (mesophilic, left and thermophilic, right) are shown with four different substrates. Error bars show standard deviation (n = 3).
Energies 14 04205 g006
Table 1. Batch assay experimental bottles with measurement days (M) and day of opening (O).
Number of BottlesMeasurement Days
23579142030
Inoculum control3MMMMMMMM
Cellulose control3MMMMMMMM
ISR = 2:1 AFB3MM/O
ISR = 2:1 AFB3MMMM/O
ISR = 2:1 AFB3MMMMMM/O
ISR = 2:1 AFB3MMMMMMMM/O
ISR = 2:1 no AFB3MMMMMMMM/O
ISR = 1:1 AFB3MMMMMMMM/O
AFB only1MMMMMMMM/O
Water control2MMMMMMMM
Table 2. Continuous reactor conditions.
Reactor 1Reactor 2
ConditionMesophilicThermophilic
Temperature (°C)4052
Inoculum sourceMaabjerg Bioenergy 1AU Foulum 2
Inoculum pH8.26 ± 0.068.21 ± 0.03
Inoculum alkalinity (g CaCO3eq L−1)15.28 ± 0.1011.71 ± 0.06
Inoculum total VFA (g L−1)1.52 ± 0.090.82 ± 0.06
Inoculum NH4+-N (g L−1)3.97 ± 0.032.07 ± 0.15
HRT (d)2525
1 A biogas plant based north of Holstebro, Denmark. 2 A research biogas plant (Aarhus University) based in Foulum, Denmark.
Table 3. Extracted Modified-Gompertz methane kinetic parameters for replicates and the mean methane yield data. Note that the mean data parameters were obtained by fitting to the mean yield curves rather than being means of the replicate model parameters.
Model Fit (Pearson R2)B0
[mL gVS−1]
λ
[d]
Rmax
[mL gVS−1 d−1]
No AFB 2:1 (rep 1)0.9992580.2367.8
No AFB 2:1 (rep 2)0.9973010.0067.6
No AFB 2:1 (rep 3)0.9972930.0070.5
No AFB 2:1 (mean data)0.9982790.0065.9
AFB 1:1 (rep 1)0.9992520.0038.9
AFB 1:1 (rep 2)0.9992700.0042.7
AFB 1:1 (rep 3)0.9982750.0041.6
AFB 1:1 (mean data)0.9992840.0044.0
AFB 2:1 (rep 1)0.9992790.0765.8
AFB 2:1 (rep 2)0.9982530.1957.9
AFB 2:1 (rep 3)0.9992540.0858.9
AFB 2:1 (mean data)0.9992790.1164.8
Table 4. Composition and elemental analysis of cattle manure (CM), clover grass pulp (CGP), Fertigro® (FG) and organic fraction municipal solid waste (OFMSW). Elemental composition (CHNS), protein and VFA is based on TS. TS, VS and Ash are based on fresh matter.
SubstrateTS (%)VS (%)Ash (%)C (%)H (%)N (%)S (%)O b (%)Crude Protein (%)VFA (g L−1)BMP, 63 d (mL gVS−1)TBMP a (mL gVS−1)
CM6.75.21.543.85.52.60.646.015.94.9195 ± 3391
CGP23.521.91.646.86.12.50.142.915.8na210 ± 7448
FG17.410.76.721.96.93.81.559.223.90.4–2.3299 ± 17176
OFMSW12.710.81.948.17.12.70.240.017.02.7415 ± 7498
a TBMP is the theoretical maximum BMP based on the CHNS values. The TBMP is calculated by Buswell and Boyle’s equation [22]. b Calculated as: %O = 100% − %C − %H − %N − %S − %Ash.
Table 5. Overview of total average mass reduction, N and S mineralization in semi-continuous AD.
Mesophilic
Total Mass (g)Total N (g)Total S (g)
CGP T025.00.630.04
CGP T3011.40.380.05
Reduction54.4%39.6%−25%
CM T025.00.620.16
CM T3014.40.490.11
Reduction42.4%21.0%31.3%
FG T050.01.780.78
FG T301.200.020.04
Reduction97.6%99.4%94.9%
OFMSW T025.00.630.07
OFMSW T304.40.150.02
Reduction82.4%76.2%63.0%
Thermophilic
Total Mass (g)Total N (g)Total S (g)
CGP T025.00.630.04
CGP T309.70.270.04
Reduction61.2%57.6%2.8% (decimals)
CM T025.00.640.16
CM T3013.20.420.10
Reduction47.2%34.4%37.5%
FG T050.01.820.80
FG T300.90.010.00
Reduction98.2%86.2%99.6%
OFMSW T025.00.650.07
OFMSW T302.60.090.01
Reduction89.6%86.2%79.9%
Table 6. Mean values for N and S concentrations in percent of total feedstock measured by elemental analysis at different time points (0, 3, 7, 14 and 30 days).
Mesophilic
T0T3T7T14T30
CGP %N2.532.672.732.883.37
CGP %S0.170.270.410.380.44
CM %N2.553.013.183.273.43
CM %S0.640.640.700.710.75
FG %N3.832.722.201.961.61
FG %S1.510.610.510.360.42
OFMSW %N2.722.522.472.523.24
OFMSW %S0.260.310.390.360.54
Thermophilic
T0T3T7T14T30
CGP %N2.532.873.142.602.79
CGP %S0.170.310.350.380.42
CM %N2.553.053.263.243.19
CM %S0.640.640.680.680.74
FG %N3.831.520.670.640.89
FG %S1.510.630.380.400.35
OFMSW %N2.722.212.242.593.24
OFMSW %S0.260.290.360.400.55
Publisher’s Note: MDPI stays neutral with regard to jurisdictional claims in published maps and institutional affiliations.

