Article

The Equivalent Thermal Conductivity of the Micro/Nano Scaled Periodic Cubic Frame Silver and Its Thermal Radiation Mechanism Analysis

School of Energy Science and Engineering, Harbin Institute of Technology, Harbin 150001, China
*
Author to whom correspondence should be addressed.
Energies 2021, 14(14), 4158; https://doi.org/10.3390/en14144158
Submission received: 19 May 2021 / Revised: 3 July 2021 / Accepted: 5 July 2021 / Published: 9 July 2021

Abstract

:
Currently, there are few studies on the influence of microscale thermal radiation on the equivalent thermal conductivity of microscale porous metal. Therefore, this paper calculated the equivalent thermal conductivity of high-porosity periodic cubic silver frame structures with cell size from 100 nm to 100 µm by using the microscale radiation method. Then, the media radiation characteristics, absorptivity, reflectivity and transmissivity were discussed to explain the phenomenon of the radiative thermal conductivity changes. Furthermore, combined with spectral radiation properties at the different cross-sections and wavelength, the radiative transmission mechanism inside high-porosity periodic cubic frame silver structures was obtained. The results showed that the smaller the cell size, the greater radiative contribution in total equivalent thermal conductivity. Periodic cubic silver frames fluctuate more in the visible band and have better thermal radiation modulation properties in the near infrared band, which is formed by the Surface Plasmon Polariton and Magnetic Polaritons resonance jointly. This work provides design guidance for the application of this kind of periodic microporous metal in the field of thermal utilization and management.

Graphical Abstract

1. Introduction

Since the discovery of microscale thermal radiation effects by Tian et al. [1,2] in the 1960s, these phenomena have attracted scholars’ attention worldwide. Particularly in recent years, with the increasing maturity of the microscale processing and measurement technology, whose thermal radiation properties and modulation methods in the direction of solar radiation, photoelectric conversion, infrared detection, optical imaging, infrared stealth, etc. have become a research hotspot with a highly practical application value. Within the microscale, the heat transfer between two or more close objects can far exceed blackbody radiation, where the Planck blackbody radiation law cannot function anymore. Therefore, the explanation of the heat transfer phenomenon of macroscopic objects is no longer applicable for the object whose characteristic size is comparable to or smaller than the wavelength of thermal radiation [3]. In comparison to macroscopic radiation, the phenomena like Surface Plasmon Polaritons (SPPs) [4,5,6], Phonon Polariton Effect [7,8], Photonic Band-gap Effect [9], Photon Tunneling Effect [10], etc. produced in the field of microscale thermal radiation.
Various scholars have focused on the research of the thermal radiation properties of periodic microstructures. Lee et al. [11,12] calculated the emissivity of silver structures using rigorous coupled-wave analysis and found that the emissivity can reach large emission peaks at resonant frequencies with excited magnetic polarization. Wang et al. [13] investigated the effect of complex grating structures on thermal radiation properties using a time-domain finite-difference method. Qiu et al. [14] researched thermal radiation properties of random rough surfaces. Huang et al. [15,16] analyzed the thermal radiation properties of circular microcavity arrays and grating-coupled thermochromic materials, as well as the infrared negative refractive index properties of microstructures. Xuan’s group [17,18] discussed the effect of near-field thermal radiation on graphene, and graphene’s thermal control properties with different material surfaces covered. Liu et al. [19,20] analyzed the spectral radiation characteristics of the microscale rough ligament surface inside the open-cell nickel foam.
However, scholars pay more attention on the study of surface or media thermal radiative properties, instead of the equivalent thermal conductivity of microscale porous metal. Therefore, in this paper, the equivalent thermal conductivity of periodic cubic frame silver structures was calculated by the finite element method, where porosities are 0.896, 0.784, 0.684 and 0.500, respectively and cell size between 100 nm and 100 µm. In order to explain the effect of microscale effects on the equivalent radiative thermal conductivity, the further work analyzed the absorption, reflection and transmission capabilities of each model. Moreover, the electric field direction and magnetic field intensity distribution at the appearance of absorption and reflection peaks in the near-infrared band are analyzed, thereby giving a reasonable explanation for the thermal radiation properties of periodic cubic frame silver microstructures.

2. Mathematical Methods

Finite element method (FEM) [21,22,23] as a highly adaptable numerical method used wildly in the calculation of thermal radiation properties of microstructures. By dividing a continuous three-dimensional region into a finite number of small regions, FEM applied to any physical field described by differential equations theoretically, based on the variational principle. The following work was carried out by using FEM.

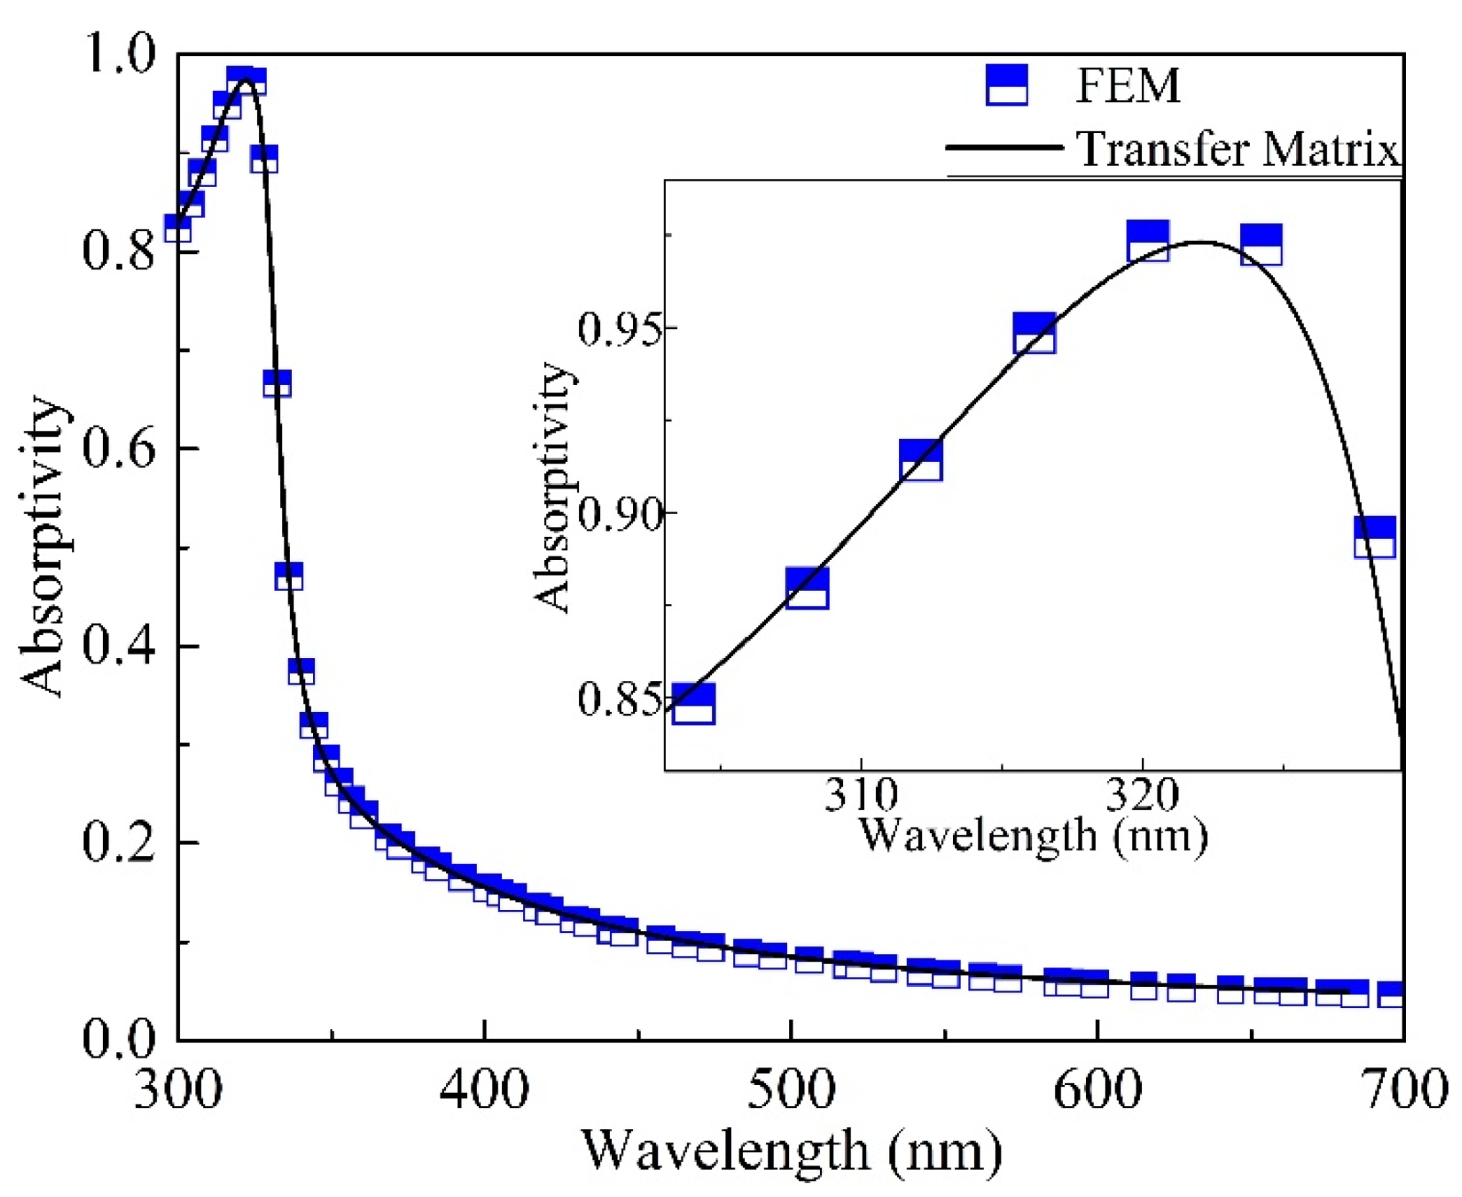
2.1. Absorptivity, Reflectivity and Transmissivity

The research of microscale thermal radiation is generally presented in terms of electromagnetic theory [24], with describing the distribution of electromagnetic field by Maxwell equations in vacuum as [24]:
{ × H = D t + J × E = B t B = 0 D e = ρ
where B indicates the magnetic flux density, Wb/m2; D stands for the electric flux density while De is the electric displacement vector, C/m2; E presents the electric field, V/m; H is the magnetic field, A/m; J indicates the current density, A/m2; t is the time, s, ρ is the volume charge density, C/m3. To obtain the Maxwell equations in media instead of vacuum, the material equations are needed as [24]:
{ D e = ε E B = μ H J = σ E
where ε indicates the permittivity, F/m; μ is permeability, H/m; σ indicates the conductivity, S/m. Bring Equation (2) into Equation (1), the obtained Maxwell equations in media as Equation (3) [24]:
{ × H = ε E t + σ E × E = μ H t H = 0 E = ρ ε
By considering only a cubic microstructure, the absorption capacity of an object can be expressed in terms of the ratio of the rate of absorbed energy to the incident energy, which is the absorption cross section. In electromagnetic theory, the absorption cross section Q(a) is indicated as [25]:
Q ( a ) = W ( a ) | S ( i ) | = Re Σ { E ( i ) × H ( s ) + E ( s ) × ( H ( i ) H ( s ) ) } n d A Re { E ( i ) × H ( i ) }
where E(s) and H(s) indicate the scattered electric and magnetic fields, respectively, E(i) and H(i) the incident electric and magnetic fields, respectively, * indicates the conjugate complex vector, W(a) indicates the absorption rate, 〈⋅〉 represents the system average, and S(i) indicates the incident energy flow, also known as the Poyntingvector. When the microelements form a periodic monolayer structure, the absorption capacity can be represented by the absorption rate [25]:
α A = 1 ( S ( r ) + S ( t ) ) n d A S ( i ) n d A
where S(r) indicates the reflected energy flow and S(t) indicates the transmitted energy flow. αA indicates the absorption rate. Correspondingly, the reflectivity αR and transmissivity αT are represented in Equation (6) as follows [25]:
α R = S ( r ) n d A S ( i ) n d A   and   α T = S ( t ) n d A S ( i ) n d A
In this paper, the Equations (5) and (6) would use to calculate the absorption, reflection and transmittance of periodic cubic silver structures.
In this research, the transfer matrix method (TMM) is used to verify the correctness of the FEM calculation in Section 3.1, which is almost exact analytical solution. The media numbers on both sides of the Air-Silver-Air structure are 0 to I + 1. When the wavelength λ incident on the multilayer films, the transmission matrix of the medium as follows [26]:
M i = [ cos ζ i j n i sin ζ i j n i sin ζ i cos ζ i ]
where ζ i = knidi, is the effective phase shift thickness of the film layer, di is the thickness of this layer, n stand its refractive index, and the wave vector k = 2π/λ. The transfer matrix of the multilayer is [26]:
M = i = 1 t M i = ( m 11 m 12 m 21 m 22 )
Therefore, the electric and magnetic fields on both sides of the multilayer membrane structure can be calculated in Equation (9) [26]:
[ E 0 H 0 ] = M 1 M 2 M 3 M t = ( m 11 m 12 m 21 m 22 ) [ E t + 1 H t + 1 ]
where E0, H0, Ei+1, and Hi+1, respectively represent electromagnetic fields at the outer surface of the multilayer films. When the electromagnetic wave is incident vertically, the reflection coefficient r and transmission coefficient t of the multilayer film structure are [26]:
r = ( m 11 + m 12 n t + 1 ) n 0 ( m 21 + m 22 n t + 1 ) ( m 11 + m 12 n t + 1 ) n 0 + ( m 21 + m 22 n t + 1 )
t = 2 n 0 ( m 11 + m 12 n t + 1 ) n 0 + ( m 21 + m 22 n t + 1 )
The αA, αR and αT can be further obtained from the reflectance and transmittance as follows [26]:
α R = | r | 2 ,   α T = n t + 1 n 0 | t | 2   and   α A = 1 α R α T

2.2. The Equivalent Thermal Conductivity
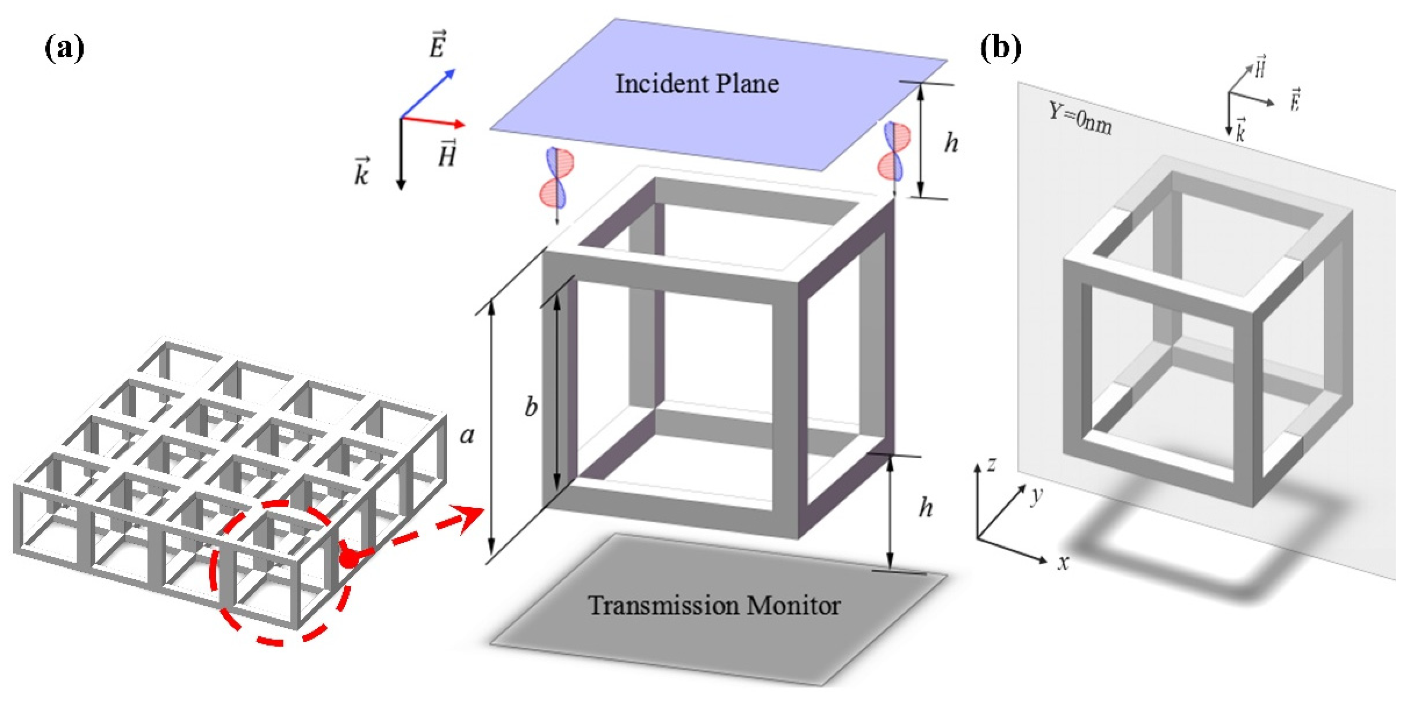
Based on Equation (4), the spectral absorption coefficient βα and a spectral scattering coefficient βs can be calculated as follows [27]:
β a = Re Σ { E ( i ) × H ( s ) + E ( s ) × ( H ( i ) H ( s ) ) } n d A N Re { E ( i ) × H ( i ) }
β s = Re Σ { E ( s ) × H ( s ) } n d A N Re { E ( i ) × H ( i ) }
where A is the unit cross-sectional area and N is the number of particles per unit volume.
The spectral extinction coefficient βe can be calculated as follows [27]:
β e = β a + β s
According to the optical thickness approximation, the equivalent radiative thermal transfer equation is as follows [27]:
κ rad = 16 σ SB T m 3 3 β e , R
where σSB is the Stefan-Boltzmann constant, κrad is the radiative equivalent thermal conductivity and βe,R is the Rosseland average extinction coefficient, which can be calculated as [24]:
1 β e , R = 0 1 β e f ( λ , T ) d λ 0 f ( λ , T ) d λ
where λ is the wavelength, f(λ,T) is the spectral distribution of Planck blackbody emission, given by [24]:
f ( λ , T ) = e b , λ T = C 1 λ 5 ( e C 2 / λ T 1 )
where eb,λ is the blackbody spectral intensity, C1 = 2πhc2 is the first radiation constant, C2 = hc/kB is the second radiation constant and h is the Planck constant [28]. Therefore, Equation (16) would be used to calculate the κrad in the following calculation.
According to Fourier’s law, the governing equations of the thermal conduction progress of a three-dimensional object can be established during the transient temperature field T(x, y, z, t) as [27,29]:
ρ c T t x ( κ x T x ) y ( κ y T y ) z ( κ z T z ) = q A
where κx, κy, and κz are the thermal conductivities of the object along the x, y and z directions, all three values of which are equal to κs for isotropic materials, A’ is the area. In this research, the thermal conductivities of pure Ag at room temperature (T = 300 K) were adopted from Young’s [30] experimental measurements, that is κs = 406 W/(m·K); ρ is the density of the object kg/m3; c is the specific heat capacity of the object J/(kg·K) and q is the density of the thermal source in the object, W/m2. According to Fourier’s law, for the heat flux qn through differential element, the Equation (20) is obtained [29]:
q n = κ cond T n
where κcond is the equivalent conductive thermal conductivity, n presents the heat transfer direction. It should note that, the thermal conduction progress without consider radiation. The total equivalent thermal conductivity κtotal is obtained by [28]:
κ t o t a l = κ c o n d + κ r a d
Therefore, the Equation (21) would be used to calculate the κtotal in the following calculation.

3. Physical Model

In this paper, the three-dimensional geometric model established with simplified cubic hollow as shown in Figure 1. Silver was selected as the material of the infinite plate and periodic cubic structure for its good physical properties, with regardless of the oxidation condition and the effect of the changes in the n, k value of the material. The cubic skeleton material chosen is metallic silver which is extensively used in photonic crystals. In consideration of the effect of wavelength on n, k, this curve was obtained by interpolating the experimental points measured by Yang et al. [31] using Bessel spline function as shown in Figure 2.

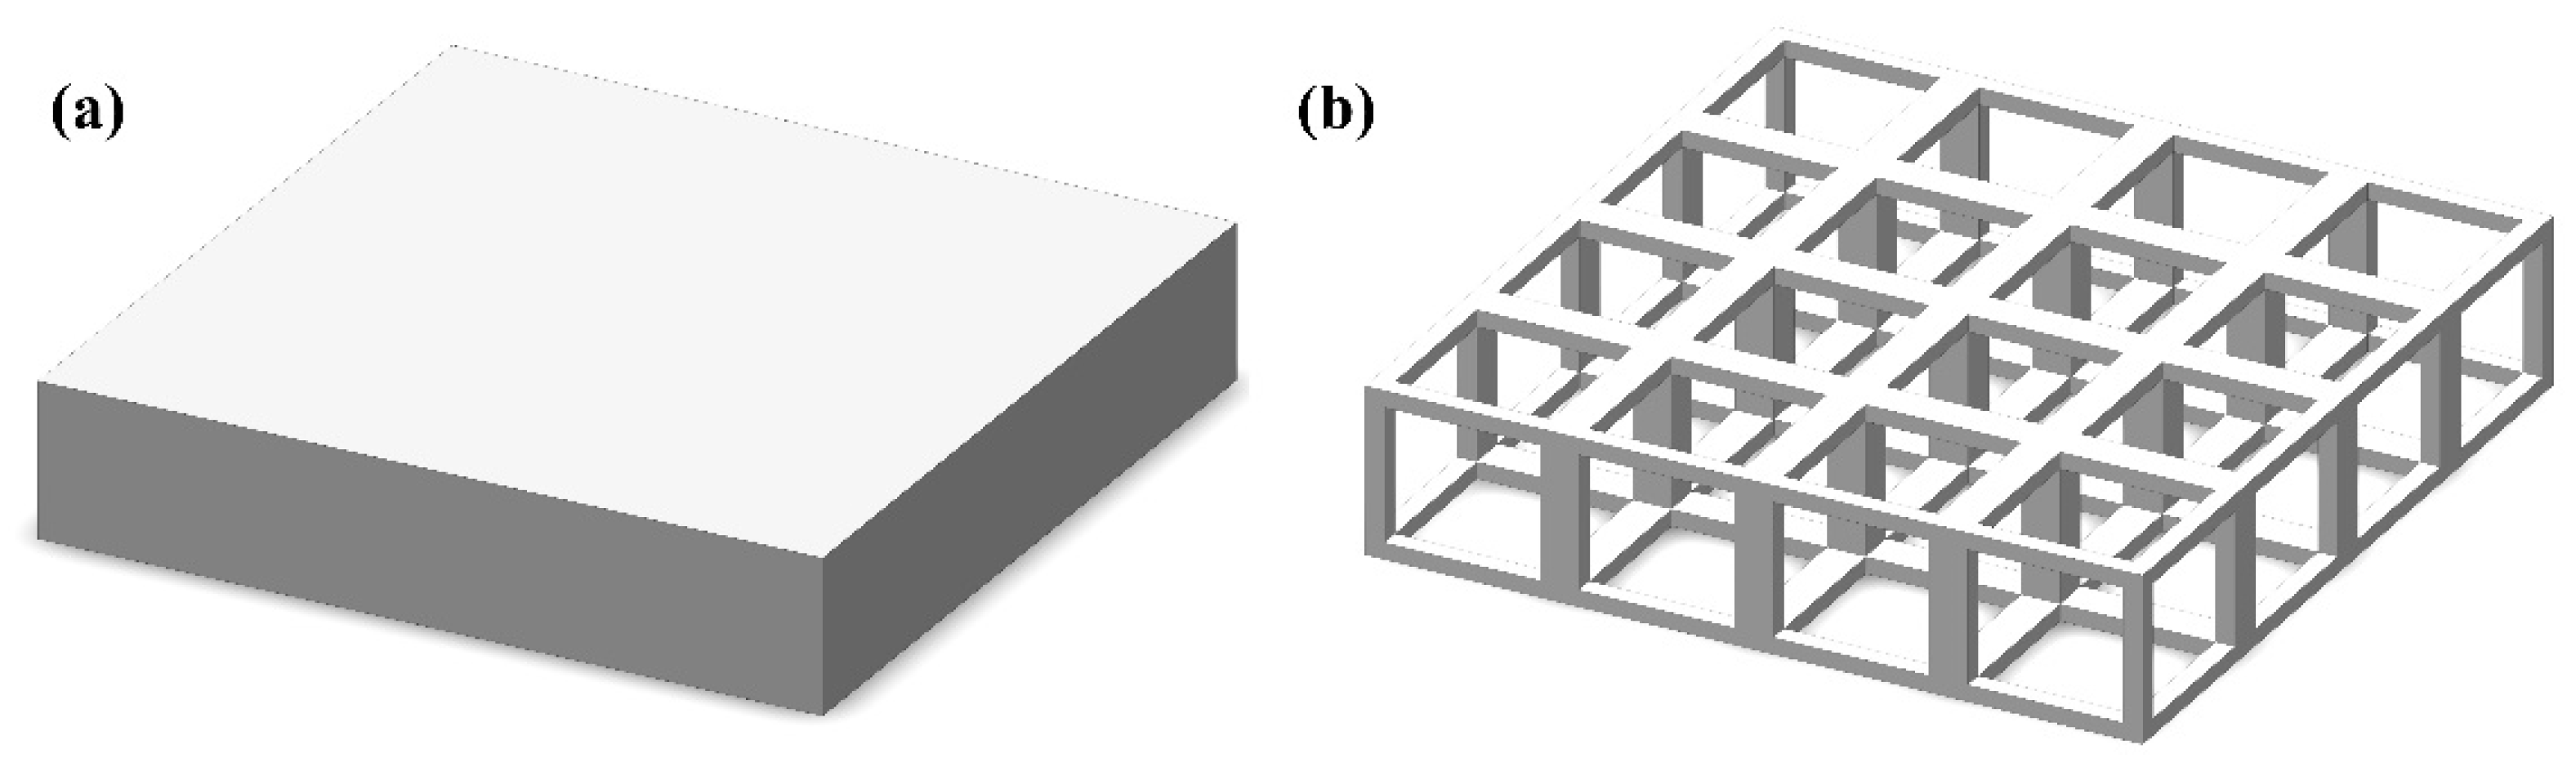
3.1. Calculation Domain of Infinity Silver Plate

In order to verify the numerical simulation method, the infinite silver plate with thickness of 500 nm is calculated using the transmission matrix and finite element method, respectively, and the absorption curves are plotted using the obtained results as shown in Figure 3. In this section, Transverse Electromagnetic Wave (TEW) is used for vertical incidence. Due to the excitation effect of metals at far-infrared wavelengths at the microscale, it is impossible to obtain a more regular modulated wavelength range, therefore the wavelength range is taken as visible and mid-infrared wavelengths, which are 300 nm–3 μm.
As shown in Figure 3, the calculated results using FEM almost overlap with the absorptance curve obtained by the Transfer Matrix method (TMM), which is almost an exact analytical solution. The absorptivity increases with wavelength and then decreases sharply, with a maximum peak at 0.32 μm, with a maximum absorptivity of 0.98, which indicates that the absorption capacity of the flat plate increases with wavelength and then decreases sharply. It is consistent with the trend that the imaginary part of the complex permittivity of Ag first decreases and then increases and reaches a minimum at 0.32 μm, as shown in Figure 2. Since the two curves are almost the same, the FEM calculation result is consistent with the analytical solution. Therefore, the following calculations are all carried out using the finite element method.

3.2. Computational Domain of the Periodic Cubic Structure

As shown in Figure 4, the computational domain of the periodic cubic is taken to be unit cubic connected structure with unit cubic cell length a and an internal cubic pore cell length b. Therefore, the effective cell size can be calculated by dp = [(18 ab2 − 12 b3)/π]1/3 and the porosity can be obtained by φ = (3 ab22 b3)/a3. The incident surface to the top of the cubic is set at a distance h = 250 nm, with periodic boundary conditions on all surfaces except the top and bottom, respectively, which are set as the emitting and receiving ports, where the incident magnetic field strength H = 1 A/m is given, plus a perfect absorption layer. Furthermore, the integral calculation band of thermal radiation was 2.6 μm < λ < 90 μm. The incidence angles were divided into 20,000-unit angles from 0 to 90°, and the frequency interval was 2 × 10¹² Hz, which was used in the following calculations to ensure the calculation accuracy.
In order to verify the independence of the computational model, a dimensionless number Me is defined, Me = λ/δ1/2, where λ denotes the incident wave wavelength and δ denotes the characteristic length of elements the unit calculated domain. By adjusting the δ, the absorption with wavelength for different accuracy pairs in the visible wavelength band is plotted as well as the error as shown in Figure 5. It can be obtained from Figure 5, as the value of Me increases, the absorbance curve keeps changing. When Me ≥ 5, the change of the absorption curve is no longer obvious with the increase of Me. Therefore, the smallest error is obtained when the Me ≥ 5, which is the domain dividing into 740,000 hexahedral elements at least. As a result, the domain would be divided into around 740,000 elements in the following calculations to ensure smaller errors.

4. Results and Discussion

4.1. The Equivalent Thermal Conductivity

In order to discuss the thermal radiation proportion in the total heat transfer process more intuitively, the equivalent thermal conductivity was chosen in this section as the evaluation index to analyze the changes of the three kinds of equivalent thermal conductivities with the cell size and porosity. Four group of higher porosities models φ = 0.896, φ = 0.784, φ = 0.684 and φ = 0.500 were calculated at T = 300 K, respectively, with the temperature interval was selected as 1 K. In addition, the integral calculation band of thermal radiation was 2.6 μm < λ < 90 μm. The thermal conductivity of pure Ag was set as κs = 406 W/m·K followed Yong’s [29] research. The spectral refractive index n and spectral extinction coefficient k were adopted from Yang’s experimental measurements [31], as seen in Figure 2. The κtotal, κcond and κrad were calculated from Equations (12) and (15), respectively as a function of the size of the structure, as shown in Figure 6.
As shown in Figure 6, the κcond is not significantly impacted by changes in cell size dp, while the κcond increased with the φ decreased. This is because as the φ decreases, the proportion of the gas phase thermal conductivity increases, which ultimately leads to a decrease in the overall κcond. For models φ = 0.784, φ = 0.684 and φ = 0.500, as the structure size increases, the thermal radiation and total heat transfer decrease first and then increase, while at φ = 0.896, as the structure size increases, the thermal radiation and total heat transfer decrease first and then increase to a peak before decreasing. It is because when the aperture size is comparable to the peak Planck blackbody radiation, the microscale effect is enhanced so that the total extinction coefficient decreases, resulting in the peak in Figure 6a. When a < 1 μm, the larger the porosity for the same size, the larger the share of the κtotal in the κrad, and the same trend of change in the κrad and the κtotal. Meanwhile, when φ = 0.896, dp < 1 μm, the κrad plays a dominant role in the κtotal. Hence, on the basis of this set of models, the next section shall concern the reasons for this phenomenon from the perspective of the thermal radiation medium properties.

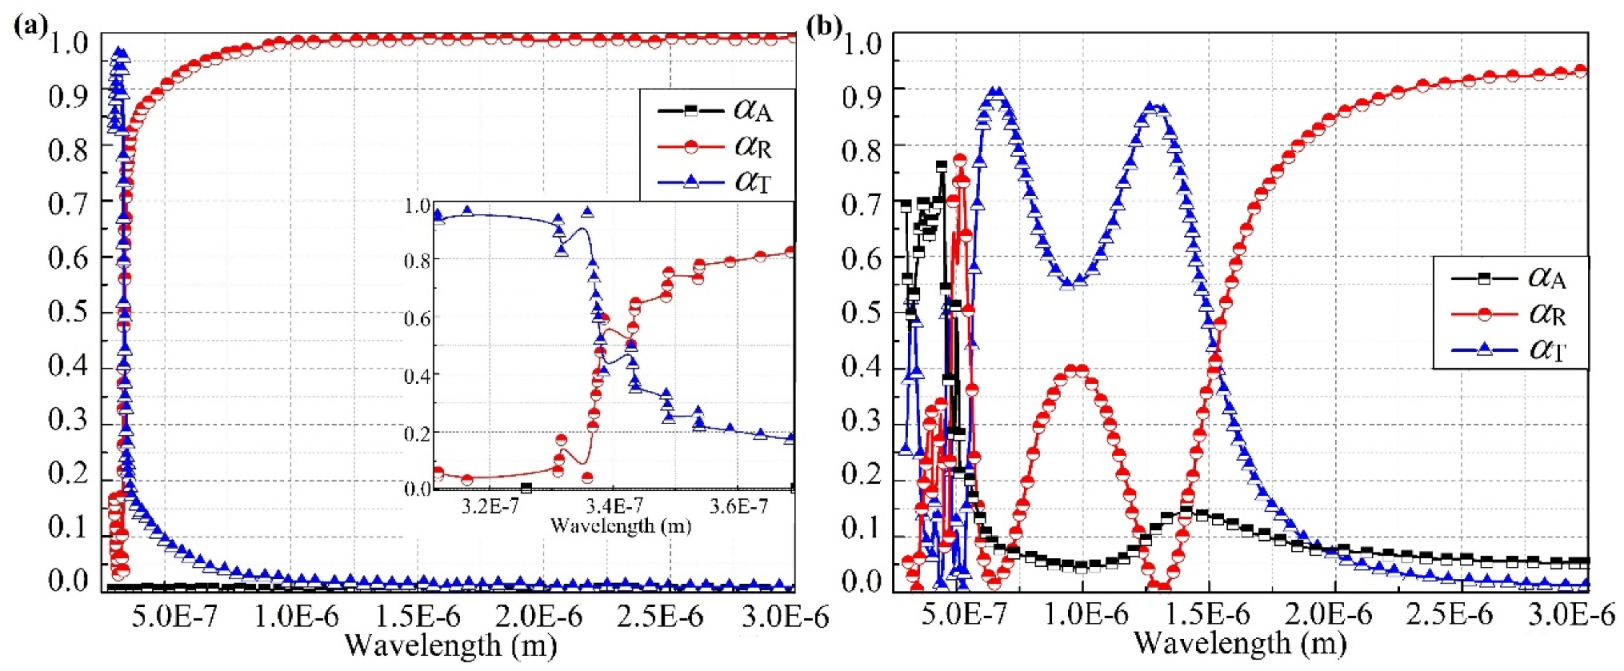
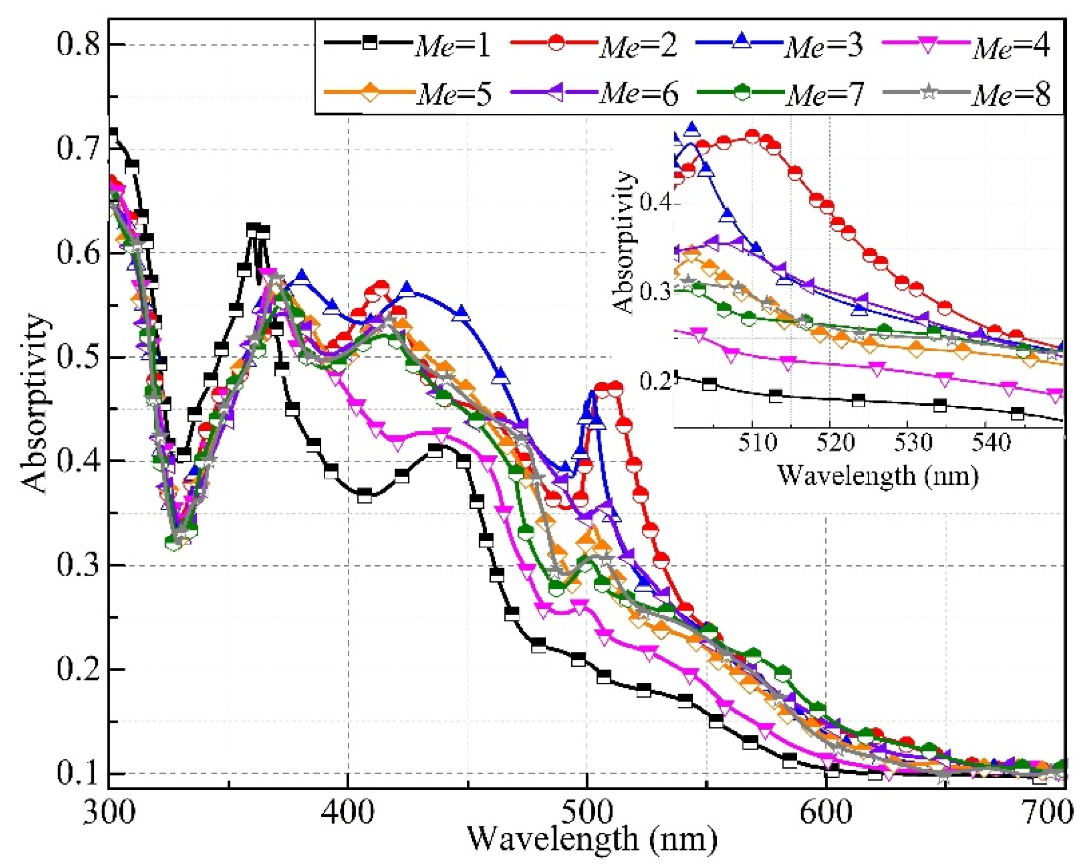
4.2. Absorptivity, Reflectivity and Transmissivity

In order to research the phenomenon of the large share of κrad at micro/nano sizes, a model with cell length a = 500 nm, an internal control cell length of b = 400 nm and porosity φ = 0.896 is taken as an example for this paper, and the analysis of the thermal radiation properties of the medium at wavelengths comparable to the size of the structure is carried out specifically.
Firstly, the section calculates the absorptivity, reflectivity and transmissivity of infinitely large flat and periodic high porosity cubic frame structures at wavelengths in the visible and near infrared, as shown in Figure 7. For structures with finite large flat plates are shown in Figure 7a. When the wavelength is smaller than the size of the structure in the propagation direction, the reflectivity is lower and the absorption is the first to increase until it plummets close to 1. However, when the wavelength is larger than the size of the structure in the propagation direction, the absorption decreases to close to 0, at which point the reflectivity approaches 1. The transmissivity is always close to 0, and the curves of absorption and reflectivity level off when the wavelength is two times larger than the size in the propagation direction. When the wavelength approaches the size of the structure in the direction of propagation, the absorption decreases abruptly, and the reflectivity increases abruptly. This is close to the distribution curve of the real part of the dielectric constant of metallic silver, and in the infrared band the dielectric constant of silver is greater than 1, close to total reflection, which is consistent with a reflectivity close to 1 in the infrared band.
As shown in Figure 7b, the reflection, absorption and transmission rates of the periodic high porosity cubic frame structure in the visible and mid-infrared wavelengths differ significantly from those of an infinite flat plate of the same thickness. At visible wavelengths, the oscillation of the periodic cubic frame structure with a structure size of 500 nm is more severe, while its absorption, reflection and transmission rates do not show monotonicity in their variation with wavelength. At wavelengths greater than 2 μm, the absorption, reflection and transmission rates of this structure are close to those of the flat plate structure. However, the absorption of the structure increases first and then decreases in the near infrared band, with a maximum value of 0.178 at 1.425 μm wavelength, after which it decreases to a level close to 0.05. Although this absorption is not high, it is a significant modulation of the absorption compared to the zero absorption of the flat structure in this band. Meanwhile, the peaks and troughs of the reflectivity and transmissivity of the structure in the NIR band correspond to the same wavelength. The reflectivity has two troughs at 0.7 μm and 1.28 μm, where the reflectivity is nearly 0. The transmissivity has two peaks, which correspond to a transmissivity of nearly 0.9, respectively. The reflectivity peaks coincide with the transmissivity peaks, where the reflectivity reaches a maximum of 0.4 at a wavelength of 0.96 μm, and the transmissivity is at a minimum of 0.525. In order to better investigate the NIR band modulation properties of periodic high porosity microstructures, the following is a mechanistically sound explanation of the spectral radiation properties at the reflectivity and absorptivity peaks in this band, respectively.

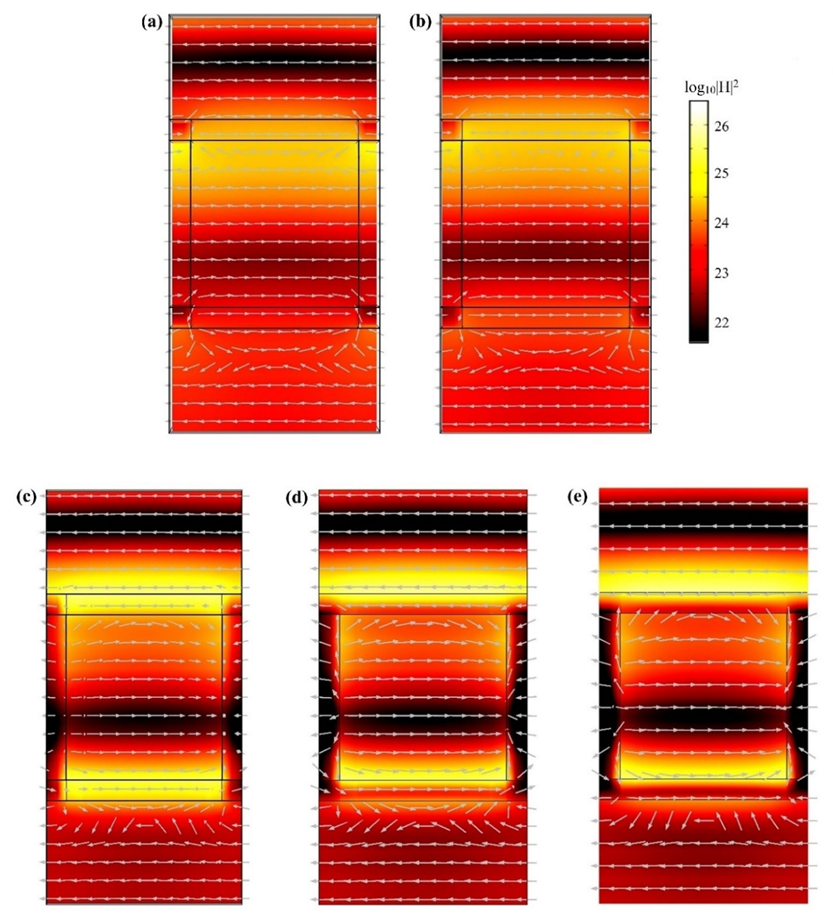
4.3. Spectral Radiation Properties at the Reflectivity Peak

In order to clearly illustrate the electric field direction and magnetic field strength, at different locations of cross sections within the calculated cell at the reflectivity and absorptivity peaks, cross sections are now taken at Y = 0 nm, Y = 100 nm, Y = 200 nm, Y = 225 nm and Y = 250 nm, respectively, as shown in Figure 4, with the centre of the cell as the origin, along the vertical one magnetic field direction. Where the black wire frame indicates the plane obtained by targeting the plane to the material, that is the area within the frame indicates the magnetic and electric field distribution within the material.
It can be seen from Figure 8, the distribution of the electric field direction and magnetic field intensity for each cross-section at the peak of absorptivity, which is at a wavelength of 0.96 μm. Where the direction of electric field transmission inside the cubic frame structure changes at the cross-section Y = 0 nm and Y = 100 nm cross sections. Due to the coupling of the induced magnetic field formed by induction with the incident magnetic field an inverse magnetic resonance is formed, this resonance is a change in the direction of the electric field transmission inside. Due to the small size of the structure a closed circuit cannot be formed, but the induced magnetic field formed by it weakens the magnetic field there; thus the magnetic field strength at the four cubic sections is lower. The phenomenon is most pronounced in the section above the structure. At the Y = 200 nm cross-section, this plane is just above the surface of the cubic frame structure. As shown in Figure 8c, the direction of the electric field near the surface of the prism is deflected and the resonance can be observed at the surface of the prismatic structure. It decays rapidly in the interior, which is typical Surface Plasmon Polariton (SPP). The SPP resonance is generated by the incident magnetic field coupled to a locally induced electric field and shows an exponential decay of the surface swift electromagnetic waves propagating along the interface between the free space and the structure and forming a resonance with the plasma excitations on the surface of the silver cubic frame structure. In comparison with Figure 8c–e, it can be observed that the SPP resonance is more pronounced the closer the central section of the cubic cell.

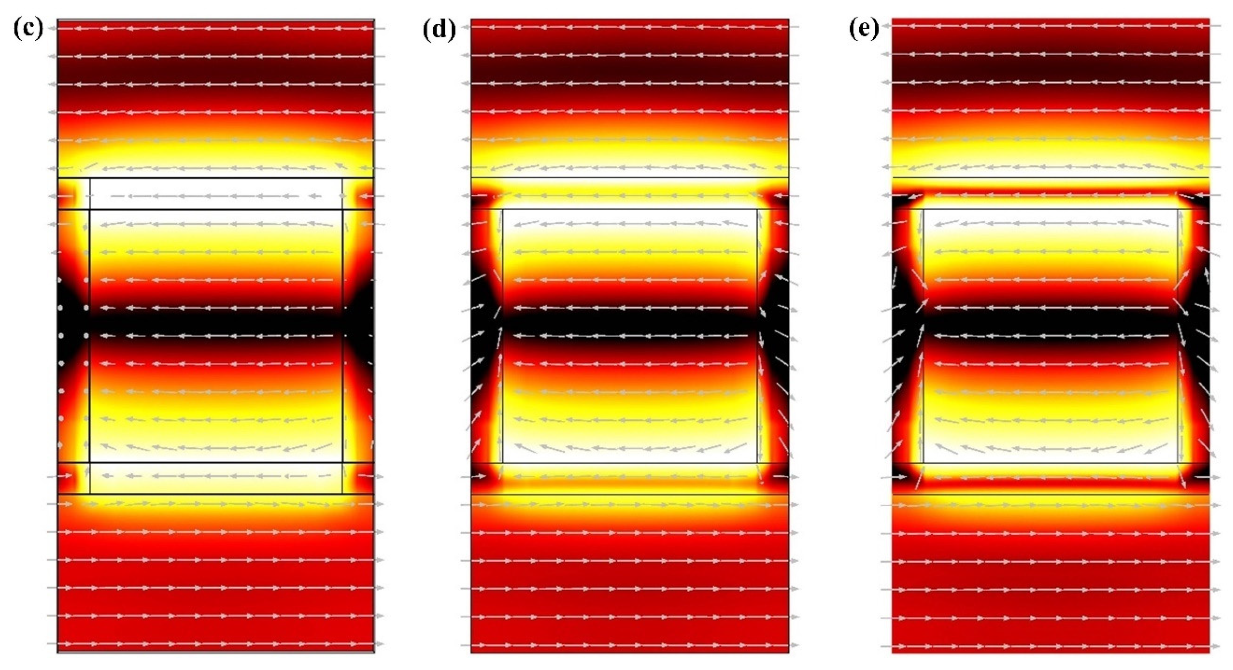
4.4. Spectral Radiation Properties at the Absorptivity Peak

In order to study the peak absorptivity of the cubic frame structure, cross sections were taken at positions Y = 0 nm, Y = 100 nm, Y = 200 nm, Y = 225 nm and Y = 250 nm at a wavelength of 1.425 μm as shown in Figure 3, respectively, and the logarithmic distribution of the electric field direction and magnetic field intensity of each cross section was investigated, and cloud plots were made.
As shown in Figure 9, the distribution of the electromagnetic field at each cross-section is broadly similar to Figure 8, where the surface plasma resonance effect triggers an enhancement and weakening of the induced magnetic field, with a significant attenuation at the centre along the propagation direction compared to Figure 8. When the electromagnetic wave is incident on the surface of the periodic cubic frame, it is known from the law of flutters that a time-varying electromagnetic wave will form an induced current inside the cavity. This current subsequently generates an induced magnetic field in the opposite direction, which couples with the incident magnetic field to form an anti-magnetic resonance. This resonance is known as the and Magnetic Polaritons (MPs) resonance, which forms a parallel electric field direction current inside the internal cavity. Meanwhile, comparing the absorption and reflection peaks in Figure 7, it can be seen that the absorption peak at a wavelength of 1.425 μm is wider, which is typical of the magnetic polarization excitation phenomenon. Moreover, the excitation phenomenon does not change with the angle of incidence, which is of great importance in industrial production.

5. Conclusions

This paper has calculated the equivalent thermal conductivity of periodic cubic frame silver with porosities of 0.896, 0.784, 0.684 and 0.500, respectively and cell size from 100 nm to 100 µm using the finite element method. In order to explain the effect of microscale effects on the equivalent radiative thermal conductivity, this work further investigated the reflectivity, absorptivity and transmissivity of periodic cubic frame silver at the incident band of 300 nm–3 µm. Then, the magnetic field strength and electric field direction were analyzed at different cross sections in the band at the peak of absorptivity and reflectivity, in order to explaining the thermal radiation transmission mechanism. The conclusions are consulted as follows:
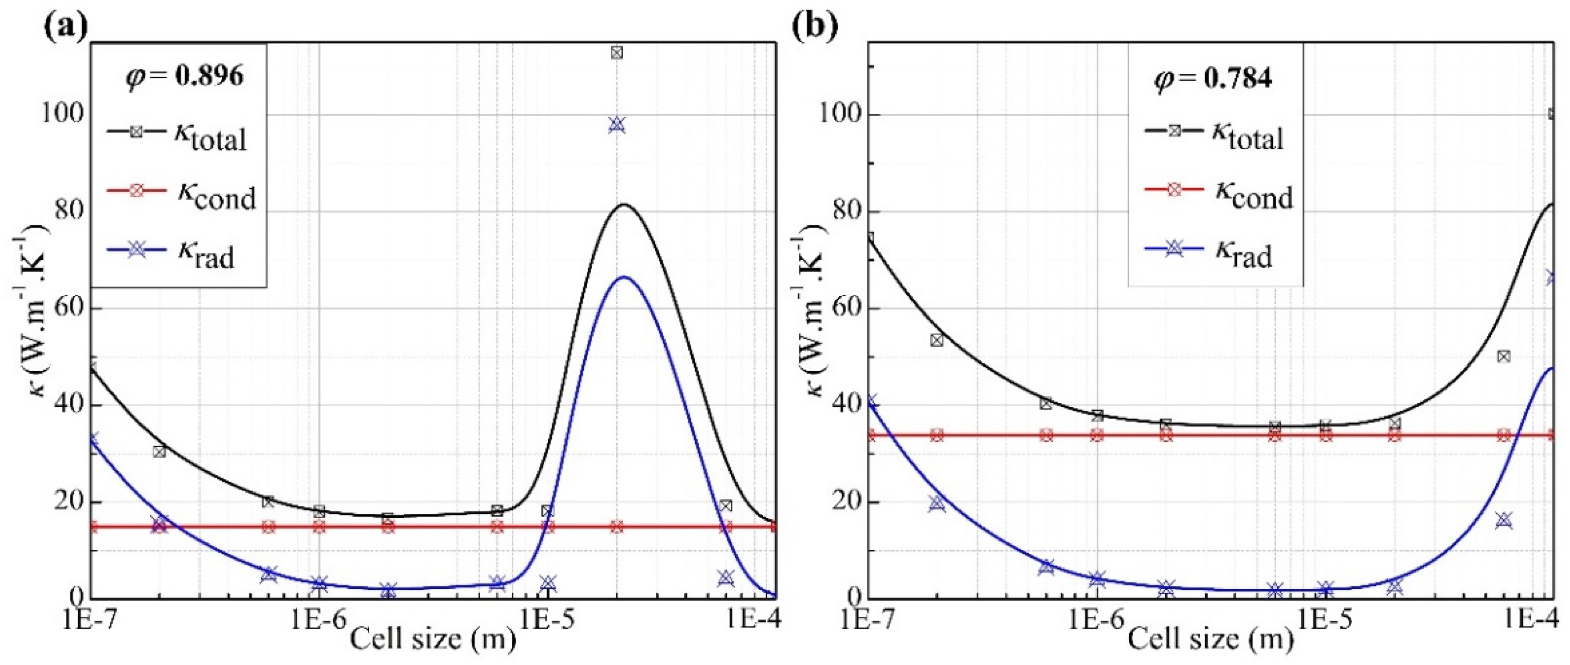
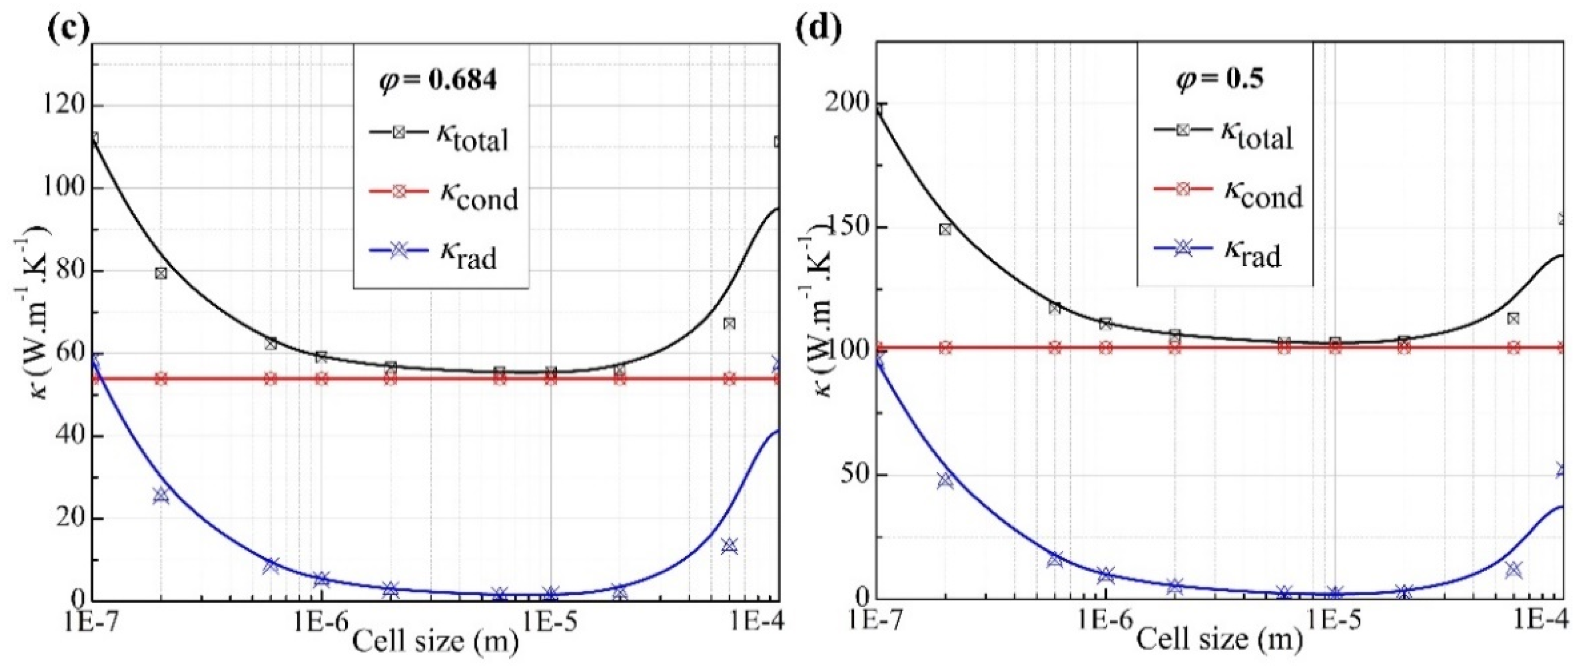
  • In the equivalent thermal conductivity of a periodic cubic frame structure, the smaller the cell size of the structure, the larger the proportion of thermal radiation. When the structure size is comparable to the characteristic wavelength, the equivalent radiative thermal conductivity increases sharply.
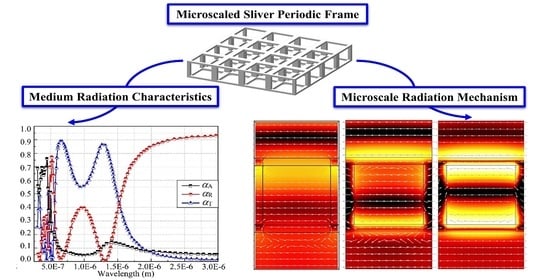
  • Periodic cubic frame sliver has better thermal radiation properties in the near infrared band while fluctuates a lot in the visible band.
  • The reflection of the periodic cubic frame sliver enhanced at 680 nm–1.28 μm, with the strongest reflectivity happened at 960 nm wavelength; and the absorption enhanced at a wavelength band of 1 μm–1.7 μm, as the strongest absorption happened when wavelength is 1.425 μm.
  • The thermal radiation mechanism of periodic cubic frame structure was explained by the SPP and MPs resonance jointly form a resonance in the near infrared band, while the cavity formed inside the MPs excitation of the absorption peak phenomenon.

Author Contributions

Conceptualization, H.Z. and H.Y.; methodology, H.Y.; investigation, H.W.; data curation, D.Z.; writing—original draft preparation, H.Y.; writing—review and editing, D.Z. and H.W.; funding acquisition, H.Z. All authors have read and agreed to the published version of the manuscript.

Funding

This research was funded by National Natural Science Foundation of China, grant number 51776050, the National Key R&D Program of China, grant number 2020YFB1901900, and the China Scholarship Council, grant number 201806120171.

Institutional Review Board Statement

Not applicable.

Informed Consent Statement

Not applicable.

Data Availability Statement

The data that support the findings of this study are available from the corresponding author upon reasonable request.

Conflicts of Interest

The authors declare no conflict of interest.

Nomenclature

Aunit cross-sectional aream2
Aaream2
aunit cubic cell lengthm
Bmagnetic flux densityWb/m2
binternal cubic pore length m
cspecific heat capacity(J·kg)/K
dthicknessm
Delectric displacement vectorC/m2
Eelectric field vectorV/m
Hmagnetic field vectorA/m
hincident distancem
Jcurrent densityA/m2
kspectral extinction coefficient-
kBBoltzmann constantJ/K
Medimensionless number-
nrefractive index-
nheat flow vector
Nparticle numbers-
rreflection coefficient
Rinternal pore radiusm
Sincident energy flow W
TtemperatureK
ttimes
ttransmission coefficient
Qcross-sectionm2
qdensity of heat sourceW/m2
Vvolumem3
Wrate-
x,y,zcoordinate direction-
αcoefficient-
βcoefficient-
δgrid sizem
ρvolume charge density/densityC/m3 kg/m3
κthermal conductivityW/(m·K)
εpermittivityF/m
ħPlanck constant divided by 2 πJ·s
σSBSteven-Boltzmann constant-
λwavelengthm
φporosity-
μpermeabilityH/m
Subscript
Aabsorption
aabsorption
condconduction
eextinction
pPore/ cell size
Rreflection
rradius direction
radthermal radiation
sscattering
Ttransmission
totaltotal heat transfer
Vvolume
wequivalent wall size
Superscript
*complex vector
aabsorption
iincident
sscattering

References

  1. Tien, C.L. Microscale Energy Transfer; CRC Press: Boca Raton, FL, USA, 1997. [Google Scholar]
  2. Cravalho, E.G.; Tien, C.L.; Caren, R.P. Effect of small spacings on radiative transfer between two dielectrics. J. Heat Transf. 1967, 89, 351–358. [Google Scholar] [CrossRef]
  3. Mulet, J.P.; Joulain, K. Enhanced radiative heat transfer at nanometric distances. Micro. Therm. Eng. 2002, 6, 209–222. [Google Scholar] [CrossRef]
  4. Bikbaev, R.G.; Vetrov, S.Y.; Timofeev, I.V. Hybrid Tamm and surface plasmon polaritons in resonant photonic structure. J. Quant. Spectrosc. Radiat. Transf. 2020, 253, 107156. [Google Scholar] [CrossRef]
  5. Nakkach, M.; Duval, A.; Ea-Kim, B.; Moreau, J.; Canva, M. Angulo-spectral surface plasmon resonance imaging of nanofabricated grating surfaces. Opt. Lett. 2010, 35, 2209–2211. [Google Scholar] [CrossRef]
  6. Ge, C.X.; Wu, Z.S.; Bai, J.; Gong, L. Effect of nanoscale roughness on optical trapping properties of surface plasmon polaritons exerted on nanoparticle. J. Quant. Spectrosc. Radiat. Transf. 2018, 219, 339–349. [Google Scholar] [CrossRef]
  7. Hafeli, A.K.; Rephaeli, E.; Fan, S.; Cahill, D.G.; Tiwald, T.E. Temperature dependence of surface phonon polaritons from a quartz grating. J. Appl. Phys. 2011, 110, 043517. [Google Scholar] [CrossRef]
  8. Van Zwol, P.J.; Joulain, K.; Ben-Abdallah, P.; Chevrie, J. Phonon polaritons enhance near-field thermal transfer across the phase transition of VO2. Phys. Rev. B 2011, 84, 161413. [Google Scholar] [CrossRef] [Green Version]
  9. Painter, O.; Lee, R.K.; Scherer, A.; Yariv, A.; O’Brien, J.D.; Dapkus, P.D.; Kim, I. “Two-dimensional photonic band-gap defect mode laser. Science 1999, 284, 1819–1821. [Google Scholar] [CrossRef] [PubMed] [Green Version]
  10. Chen, Y.Y.; Liao, H.Y.; Shi, J.L.; Wang, Q. Unusual photon tunneling in the frustrated total internal reflection structure including indefinite metamaterials. J. Opt. 2010, 12, 292–295. [Google Scholar] [CrossRef]
  11. Lee, B.J.; Wang, L.P.; Zhang, Z.M. Coherent thermal emission by excitation of magnetic polaritons between periodic strips and a metallic film. Opt. Express. 2008, 16, 11328–11336. [Google Scholar] [CrossRef]
  12. Lee, B.J.; Zhang, Z.M. Coherent thermal emission from modified periodic multilayer structures. J. Heat Transf. 2007, 129, 17–26. [Google Scholar] [CrossRef]
  13. Wang, A.H.; Hsu, P.F.; Chen, Y.B.; Cai, J.J. Effects of nanoscale features on infrared radiative properties of heavily doped silicon complex gratings. Sci. China Technol. Sci. 2010, 53, 2207–2214. [Google Scholar] [CrossRef]
  14. Qiu, J. Infrared Radiative Properties of Micro Scale Structures of Near-Surface. Ph.D. Dissertation, Harbin Institute of Technology, Harbin, China, 2012. [Google Scholar]
  15. Huang, J.G. Research on the Control Methods of Infrared Thermal Radiation Characteristics of Micostructured Surface. Ph.D. Dissertation, Nanjing University of Science and Technology, Nanjing, China, 2015. [Google Scholar]
  16. Huang, J.G.; Xuan, Y.M.; Li, Q. Narrow-band spectral features of structured silver surface with rectangular resonant cavities. J. Quant. Spectrosc. Radiat. Transf. 2011, 112, 839–846. [Google Scholar] [CrossRef]
  17. Liu, X.; Xia, H.; Xuan, Y. Effects of near-field photon tunneling on the performance of photon–enhanced thermionic emission energy conversion. J. Quant. Spectrosc. Radiat. Transf. 2019, 222, 223–228. [Google Scholar] [CrossRef]
  18. Zheng, Z.; Wang, A.; Xuan, Y. Spectral tuning of near-field radiative heat transfer by graphene-covered metasurfaces. J. Quant. Spectrosc. Radiat. Transf. 2018, 208, 86–95. [Google Scholar] [CrossRef]
  19. Liu, B.; Xia, X.L.; Sun, C.; Chen, X. Analysis on spectral radiative properties of micro-scaled rough ligament surface inside open-cell nickel foam. Int. J. Heat Mass Transf. 2019, 145, 118773. [Google Scholar] [CrossRef]
  20. Liu, B.; Xia, X.L.; Zhang, X.; Sun, C. Spectral radiative properties of skeleton inner structure of ceramic foam based on ordered opal structure model. J. Quant. Spectrosc. Radiat. Transf. 2019, 224, 279–288. [Google Scholar] [CrossRef]
  21. Wang, C.H.; Yi, H.L.; Tan, H.P. Discontinuous finite element method for vector radiative transfer. J. Quant Spectrosc. Radiat. Transf. 2017, 189, 383–397. [Google Scholar] [CrossRef]
  22. Yu, H.; Zhang, H.; Dai, Z.; Xia, X. Design and analysis of low emissivity radiative cooling multilayer films based on effective medium theory. ES Energy Environ. 2019, 6, 69–77. [Google Scholar] [CrossRef]
  23. Wang, C.H.; Qu, L.; Zhang, Y.; Yi, H.L. Three-dimensional polarized radiative transfer simulation using discontinuous finite element method. J. Quant. Spectrosc. Radiat. Transf. 2018, 208, 108–124. [Google Scholar] [CrossRef]
  24. Zhang, Z.M. Nano/Microscale Heat Transfer; McGraw-Hill: New York, NY, USA, 2007. [Google Scholar]
  25. Bohren, C.F.; Huffman, D.R. Absorption and Scattering of Light by Small Particles; John Wiley & Sons: Weinheim, Germany, 2008. [Google Scholar]
  26. Rui, X.; Wang, G.; Zhang, J. Transfer Matrix Method for Multibody Systems: Theory and Applications; John Wiley & Sons: Hoboken, NJ, USA, 2018. [Google Scholar]
  27. Yu, H.; Zhang, H.; Xia, X. A fractal-skeleton model of high porosity macroporous aluminum and its heat transfer characterizes. J. Therm. Anal. Calorim. 2020, 1, 1–10. [Google Scholar] [CrossRef]
  28. Yu, H.; Zhang, H.; Buahom, P.; Liu, J.; Xia, X.; Park, C.B. Prediction of thermal conductivity of micro/nano porous dielectric materials: Theoretical model and impact factors. Energy 2021, 121140. [Google Scholar] [CrossRef]
  29. Huang, H.C.; Usmani, A.S. Finite Element Analysis for Heat Transfer: Theory and Software; Springer Science & Business Media: Berlin, Germany, 2012. [Google Scholar]
  30. Young, D.H. University Physics, 7th ed.; Addison Wesley: Boston, MA, USA, 1992. [Google Scholar]
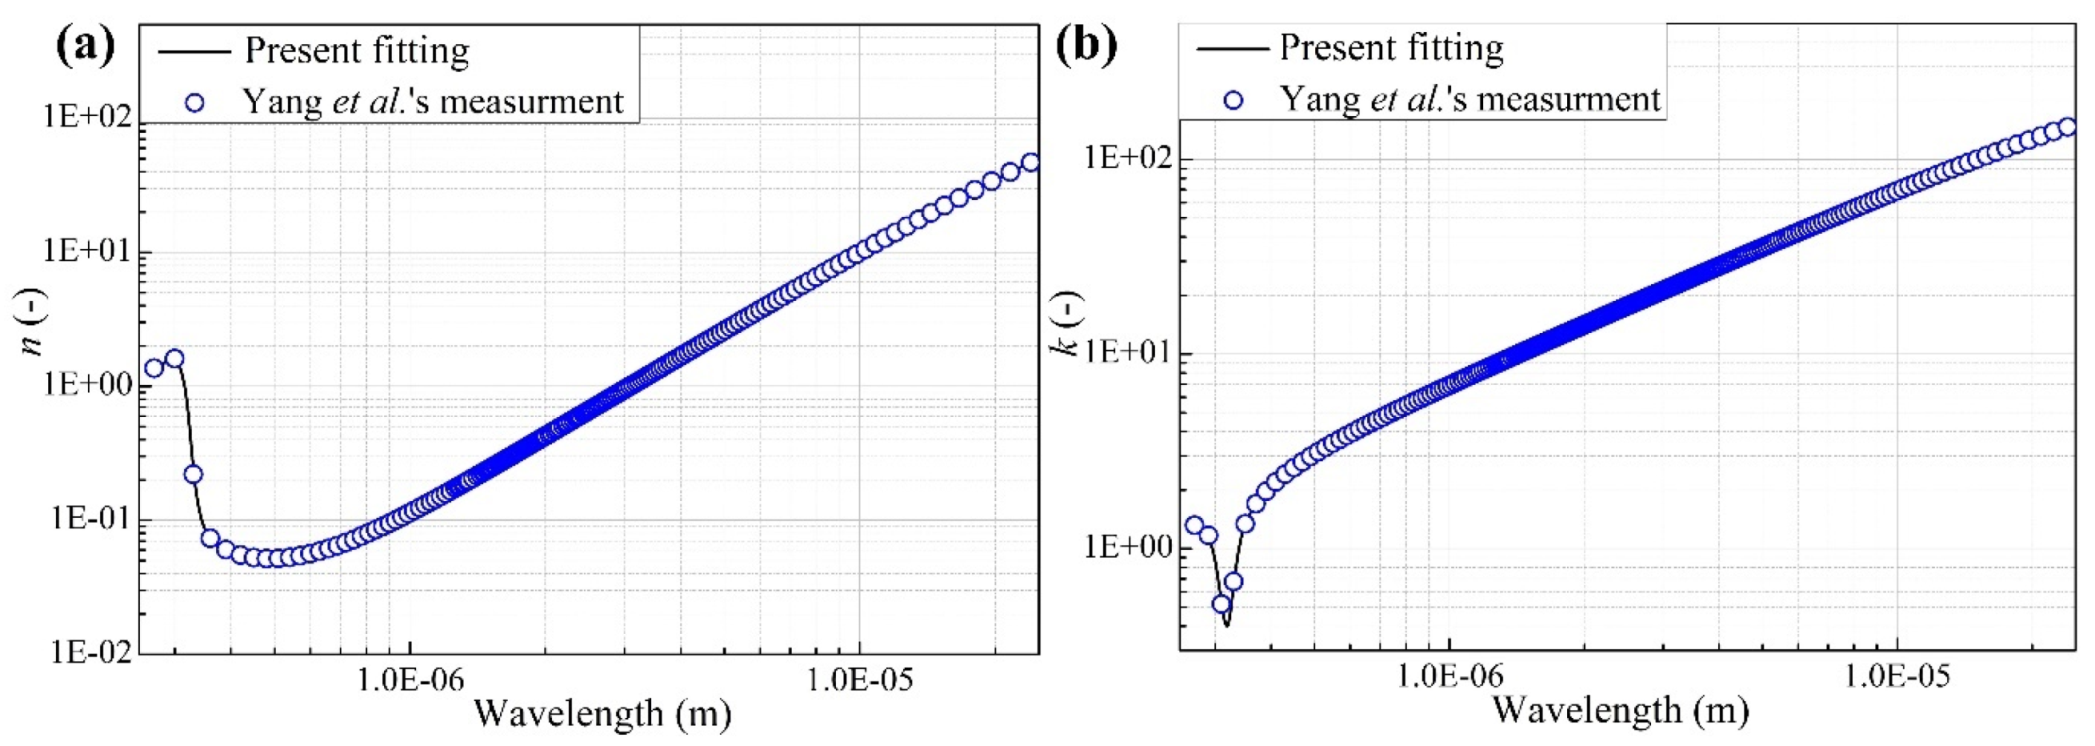
  31. Yang, H.U.; D’Archangel, J.; Sundheimer, M.L.; Tucker, E.; Boreman, G.D.; Raschke, M.B. Optical dielectric function of silver. Phys. Rev. B 2015, 91, 235137. [Google Scholar] [CrossRef] [Green Version]
Figure 1. (a) Silver plate; (b) periodic cubic frame silver structure.
Energies 14 04158 g001
Figure 2. The optical constants of silver versus wavelength: (a) refractive index; (b) extinction index.
Energies 14 04158 g002
Figure 3. Absorptivity of infinite silver plate calculated by FEM and TMM.
Energies 14 04158 g003
Figure 4. (a) Computational domain; (b) the research section diagram perpendicular to the direction of the magnetic field.
Energies 14 04158 g004
Figure 5. The Me precision analysis of computational model.
Energies 14 04158 g005
Figure 6. Equivalent thermal conductivity of high-porosity periodic cubic frame silver structure: (a) φ = 0.896; (b) φ = 0.784;(c) φ = 0.684; (d) φ = 0.500.
Energies 14 04158 g006aEnergies 14 04158 g006b
Figure 7. (a) The absorptance, reflectivity and transmissivity of Infinite plate; (b) The absorptance, reflectivity and transmissivity of periodic cubic frame silver.
Energies 14 04158 g007
Figure 8. Magnetic and electric fields intensity distribution at the different compute region at the wavelength of 0.96 μm: (a) Y = 0 nm, (b) Y = 100 nm, (c) Y = 200 nm, (d) Y = 225 nm, (e) Y = 250 nm.
Energies 14 04158 g008
Figure 9. Magnetic and electric fields intensity distribution at the different compute region at the wavelength of 1.425 μm: (a) Y = 0 nm, (b) Y = 100 nm, (c) Y = 200 nm, (d) Y = 225 nm, (e) Y = 250 nm.
Energies 14 04158 g009aEnergies 14 04158 g009b
Publisher’s Note: MDPI stays neutral with regard to jurisdictional claims in published maps and institutional affiliations.

