Article

Thermal Decomposition of Olive-Mill Byproducts: A TG-FTIR Approach

1
Department of Process and Environmental Engineering, Faculty of Mechanical Engineering, Opole University of Technology, 5 Mikołajczyka Str., 45-271 Opole, Poland
2
Department of Thermal Engineering and Industrial Facilities, Faculty of Mechanical Engineering, Opole University of Technology, 5 Mikołajczyka Str., 45-271 Opole, Poland
3
Department of Biosystems Engineering, Faculty of Agriculture, Adnan Menderes University, Aydin 09020, Turkey
4
Department of Mathematics and IT Applications, Faculty of Production Engineering and Logistics, Opole University of Technology, 31 Sosnkowskiego Str., 45-271 Opole, Poland
*
Author to whom correspondence should be addressed.
Energies 2021, 14(14), 4123; https://doi.org/10.3390/en14144123
Submission received: 17 May 2021 / Revised: 24 June 2021 / Accepted: 29 June 2021 / Published: 8 July 2021
(This article belongs to the Special Issue Residual Biomass Conversion to Bioenergy)

Abstract

:
In this study, the combustion of olive byproducts was investigated using the TG-FTIR technique. Different types of olive biomass were considered: twigs, leaves, olive-mill waste from the two-phase decanting method, and wastewater from the three-phase system. The reaction regions, ignition, and burnout temperatures at different heating rates were determined using TG/DTG analysis and the thermogravimetry results. Comprehensive combustion, ignition, burnout, and flammability indexes were also calculated. The highest combustion index values were obtained for waste from the three-phase system, followed by the two-phase decanting method, then with leaves and small twigs. The order of the index values indicated that the sample from the three-phase process ignited more quickly and yielded faster. The changes in activation energy calculated using different model-free isoconversional methods—Friedman, Ozawa–Flynn–Wall, and Kissinger–Akahira–Sunose—fell within the range of 130–140 kJ/kmol. FTIR analyses presented differences in the exhaust gas composition for specific combustion temperature ranges.

1. Introduction

The Turkish olive oil industry is the second-largest olive cultivator in the world, and is also among the top five in terms of olive-oil production [1]. In the 2016/2017 season, the average production of olive oil worldwide was 2,539,000 metric tons.
The larger producers in the European community are Spain (1,286,600 metric tons; 50.67% of the world’s production), Italy (182,300 metric tons; 7.18%), and Greece (195,000 metric tons; 7.68%). It is estimated that 177,000 metric tons of olive oil are produced in Turkey, accounting for 6.97% of the world’s production [2].
Currently, the olive-growing area in Turkey is 845,542 hectares in size with 169 million olive trees, and over the last five crop years, the average production reached 527,000 tons of table olives and 1,700,000 tons of olive oil [3]. Olive production is concentrated in the western part of Turkey (region of Aegean, Marmara, Mediterranean, and southeast Anatolia).
Olive producers are mostly small-scale producers and family enterprises. There are approximately 320,000 family enterprises working in olive and olive-oil production; approximately 481 of them are certified olive processing and packing enterprises, and 1794 are certified olive-oil producers [4]. Olive-tree cultivation and the olive-processing industry produce large amounts of byproducts, and these require specific management regarding their disposal.
It has been estimated that pruning alone produces 25 kg of byproducts (twigs and leaves per tree annually) [5]. The production of olive oil generates both solid and liquid residues, and the amount of residue produced differs depending on the technology applied for the extraction of olive oil. Nowadays, the techniques used to produce olive oil have mostly changed from traditional pressing and three-phase (oil–water–paste) continuous systems to two-phase systems to produce less waste [6,7]. In Turkey, however, all of these processes are used. There are 1005 olive-oil mills, of which 515 use continuous, 102 use super presses, and 580 use hydraulic-press systems [4].
At the end of the three-phase system process, three fractions are generated: an oil fraction (about 18%), a solid residue fraction (40%), and an oil and wastewater liquid fraction (48%). The solid residue is referred as olive husk, olive pomace, or three-phase olive-mill waste (3POMW) [5,7]. The two-phase system produces an oil fraction (18%) and a solid/water mixture (82%) (two-phase olive-mill waste; 2POMW) [5,7].
In accordance with the principles of sustainable development [8], for all types of waste, prior to their application in processes, an assessment of their parameters and the impact of their waste on the environment should be performed [9,10].
The parameters of olive-mill waste depend on various factors, such as the olive variety, climate and cultivation conditions, olive storage time, and extraction method [11]. The solid residues derived from the two- and three-phase centrifugation processes are significantly different.
The moisture content of olive-mill waste depends on the olive-oil-extraction technology applied. Olive cake obtained from the traditional press system contains 20–25% moisture [3], and exhausted olive cake contains approximately 10% [5]. In contrast, the moisture content of olive-mill waste is in the range of 55–70% for the two-phase process and 40–45% for the three-phase process [7].
The main components of olive-mill waste are cellulose, hemicellulose, and lignin, as well as fat and protein, which can be present in significant quantities. Olive residues contain a small amount of ash: 2.5–8.9% for 2POMW [12] and up to 25% for 3POMW [13]. Mineral analysis results indicated that the major element in 2POMW and 3POMW was potassium, followed by calcium and sodium [7,14].
The olive-mill byproducts can be characterized by higher average heating values in the range of 19–21 MJ/kg, presenting a favorable aspect in terms of their application for energy purposes. The calorific value of olive-mill waste can be compared with those of wood or soft coal.
Olive byproducts can be used for livestock feeding, land application, and biochemical conversion through two processes: anaerobic digestion and fermentation or extraction of valuable products [7,11]. Thermochemical conversion seems to be one of the most promising routes for its utilization.
Thermoanalytical techniques such as thermogravimetry analysis (TG) and derivative thermogravimetry (DTG) have been applied often to investigate fuel behavior during combustion, pyrolysis, and gasification processes. These methods aid in the evaluation of the reactivity, structure, and composition of the fuel, as well as the total duration of the process, which is essential for modelling the combustion of new fuels in furnaces on an industrial scale.
The kinetic characteristics of the thermal degradation of fuel (burning profile) can provide information about the efficiency prediction, reaction (residence) time, air requirements, and boiler design [15,16].
Numerous studies have conducted thermogravimetric analyses of the pyrolysis and gasification of olive-mill waste [17,18,19], but publications regarding the combustion process are much less common.
Only a few publications [20,21,22] have studied the combustion of olive-mill waste. Some studies have focused on the thermal decomposition of olive-tree biomass [23,24], and authors like Yaman et al. [25], Varol et al. [26] and Yilmaz et. al. [27] have studied the co-combustion of olive-mill waste with other components.
Garcia-Maraver et al. [24] indicated that combustion decomposition of olive leaves, prunings, and olive wood is divided into three stages: drying, oxidative degradation of the biomass, and oxidation of the charred residue. These authors observed a heat transfer limitation when the heating rate increased. For olive-mill byproducts, the authors of [12,28] reported progressive decomposition of cellulose, hemicelluloses, and lignin to volatiles and solid char, followed by the combustion of solid char generated by pyrolysis. Garcia-Ibanez et al. [22] observed that the initial degradation temperature increased as the heating rate increased. Yuzbasi [29] identified the main combustion products of the lignite and olive residue mixture (50/50 wt %)—CO2, CO, CH4, SO2, and COS—on the basis of the TG-FTIR evaluation profile analysis.
In the literature, there are still not enough detailed studies about the different types of olive waste, such as olive biomass and olive-mill byproducts, that have compared their combustion properties to estimate their influences on the burning process during co-combustion in the same combustion chamber.
Tests have been conducted separately; for example, Ducome et al. [12] compared three-phase and two-phase solid residues of different origins, but their tests were mostly concentrated on the application to the gasification process, and Garcia-Maraver et al. [24] tested olive-tree biomass. Therefore, it is essential to carry out a specific thermal analysis using TG-FTIR for all types of olive byproducts to more accurately predict how they behave in real systems at the industrial scale.
The aim of the present work was to compare the oxidative thermal decomposition of four types of olive-mill waste collected from olive-oil production facilities produced by different oil-extraction processes: olive biomass: twigs, leaves, and olive byproducts.
The tests were performed under an air atmosphere using thermogravimetric analyses to determine the conditions of the combustion process required for the application of these byproducts as fuel; for example, in small-scale combustion systems used in rural areas.
Additionally, the thermal behavior and decomposition kinetics of the olive-mill waste were calculated based using a non-isothermal experimental method. The spectra of combustion products determined using the TG-FTIR technique were also analyzed in order to identify the compounds emitted at specific combustion temperatures. Information on the intensity of gas release is particularly important when designing appropriate thermal conditions for a boiler combustion chamber.

2. Materials and Methods

2.1. Materials

Samples of olive-mill waste (OW) were collected from artisanal olive plants located in the Aydin region in northwestern Turkey. In this region, the olive tree Olea europea L (Memecik cv.) is traditionally cultivated to produce oil and table olives. Memecik is a unique variety due to its low acidity because of the loamy sand, lime, and alluvial soil structure in the southern Aegean region.
Four types of olive waste from different stages of olive-oil production and methods were used for this research:
  • Small twigs (OW1), (diameter > 5 mm) separated at the first step of olive-oil production when the olives were cleaned prior to milling;
  • Leaves (OW2), separated on sieves before olive cleaning. It also must be taken into consideration that leaves represented 5% of the weight of olives in the oil extraction;
  • Solid olive-mill residue from the two-phase decanting method (OW3), which was a mixture of kernels and pulp from the olive fruit.
A representative sample was taken after horizontal centrifuge. In this process, olives were first washed and then crushed and ground, and finally decanted to obtain the oil.
  • Olive-mill wastewater liquid fraction with oil from the three-phase decanting method (OW4).
In this process, after the separation of olive biomass, such as leaves and twigs, olives were washed and then crushed and milled. The next step was three-phase decanting, in which olive paste was centrifugated with hot water. Samples were collected after this step.

2.2. Methods

2.2.1. Physico-Chemical Parameters

Raw samples were collected, dried, and milled to obtain suitable materials for the physico-chemical tests. Energy properties, including the higher heating value (HHV), were measured with an IKA C 5000 calorimeter according to EN ISO 18125. The moisture content was determined using an oven-drying method (Memmert dryer, model UFE 400) in accordance with EN ISO 18134. The ash content was performed using a CZYLOK oven, model FCF 12 SM, in accordance with EN ISO 18122. The volatile matter was marked based on EN ISO 18123. The elemental analyzer (Elementar, Vario Macro Cube), which is based on thermal conductivity detection (TCD), was used to perform the final analysis. The carbon (C), hydrogen (H), and nitrogen (N) contents were determined following EN ISO 16948, while the EN ISO 16994 standard was used to establish the total sulfur (S) content. The oxygen (O) concentration was calculated on the basis of the obtained difference.
All analyses were repeated at least twice to guarantee the accuracy and reproducibility of the results.

2.2.2. TG-DTA and TG-FTIR Analyses

A simultaneous thermal analysis (TG-DTA) was carried out using a NETZSCH STA 449 F3 Jupiter device coupled with an FTIR spectrophotometer (Tensor 27, Bruker). We heated 20 mg of air-dried material in an Al2O3 crucible from ambient temperature to 800 °C at three heating rates: 6, 10, and 14 K/min.
The tests were performed in a dry-air atmosphere (N2/O2: 79.1/20.9) with gas-flow rates of 20 mL/min (protective) and 50 mL/min (purge). All measurements were taken at least twice to ensure the reproducibility of the results. The gas products from the combustion of the olive-mill waste were measured using TG-FTIR analysis at a heating rate of 10 K/min in a temperature range of 30–800 °C. The IR spectra were recorded in the spectral region of 600–4000 cm−1 at a resolution of 4 cm−1.
The obtained spectra were evaluated in the spectrometer database (Opus 8.5, Brucker Optiv GmbH)) to assign individual spectra to gas components in accordance with Beer’s law.
All measurements were taken at least twice to ensure the reproducibility of the results. The average difference between particular measurements was <2% for all samples.

2.2.3. Combustion Parameters—Indexes

To evaluate the combustion properties of the olive-mill waste, based on information obtained from the TGA, the following combustion parameters were calculated [30,31,32]:
  • Comprehensive combustion index:
    S = ( R p ) · ( R ν ) T i 2 · T b
  • Ignition index:
    D i = ( R p ) t i · t p
  • Burnout index:
    D b = ( R p ) Δ t 1 / 2 · t i · t b
  • Flammability index:
    C = ( R p ) T i 2
    where Rp is the maximum weight-loss rate (%/min), Rv is the average mass-loss rate (%/min), Ti is the ignition temperature (°C), Tb is the burnout temperature (°C), ti is the ignition time (min), tp is the peak time (min), ∆t1/2 is the time range at half value of Rp (min), and tb is the burnout time (min).

2.2.4. Kinetic Models

The kinetics of the thermal decomposition of the olive-mill waste were based on a non-isothermal experimental method combined with an isoconversional (model-free) mathematical approach using the Friedman (FR), Ozawa–Flynn–Wall (OFW), and Kissinger–Akahira–Sunose methods. The combustion kinetics can be described by the Arrhenius equation:
d α d t = β d α d T = k k ( T ) f ( α ) = A e x p ( E α R · T ) f ( α )
where dα/dt is the rate of conversion from solid-state to volatile product, β (K/min) is the heating rate, T (K) is the reaction temperature, k is the reaction rate constant, and R (8.314 J/mol·K) is a universal gas constant.
The activation energy Eα (J/mol) represents the energy necessary for bond relaxation in the reactants, leading to the formation of an active or transition-state complex in which the reaction takes place.
The pre-exponential factor A (1/s) describes the frequency of reactant collisions that occur with the appropriate orientation for a reaction to occur. The reaction model of the thermodynamic reaction mechanism f (α) describes the relationship between the conversion rate and conversion ratio [33]. The degree of conversion α represents the loss in mass fraction and is defined by the relationship:
α = m i m t m i m f
where mi is the initial mass of the sample, mt is the mass sample at time t, and mf is the sample mass at the end of the process. Equation (5) can be rearranged and integrated into the form:
g ( α ) = A β 0 T e x p ( E R · T ) d T
Methods using Equation (5) for determination of the activation energy, pre-exponential factor, and reaction model are known as differential methods, while those that use Equation (7) are referred to as integral methods. A simple rearrangement of Equation (4) with the natural logarithm produces the Friedman method equation [34]:
l n ( d α d t ) α , i = l n [ f ( α ) · A α ] E α R · T α , i
where index i is the individual heating rate. The value of E can be estimated from the above equation by evaluating the slope of a plot of ln(dα/dt)α,i vs. 1/Tα,i. The Ozawa–Flynn–Wall method (OFW) is a consequence of the application of (7), and the Doyle’s approximation yields [34]:
l n ( β i ) = l n ( A α · E α R · g ( α ) ) 5.3305 1.052 ( E α R · T i ) = l n ( 0.0048 A α · E α R · g ( α ) ) 1.052 ( E α R · T i )
In this case, the activation energy of the reaction can be estimated as a slope of a plot ln(βi)α,i against 1/Tα,i. The Kissinger–Akahira–Sunose (KAS) method can be expressed as follows:
l n ( β T 2 ) = l n   ( A E α R g ( α ) ) E α R T
The pre-exponential factor A was calculated using the method based on the compensation effect, which was discussed briefly in [34].

3. Results and Discussion

3.1. Physico-Chemical Parameters

The energy parameters of the olive-mill waste are presented in Table 1. After comparing the composition of the studied samples to the literature results, we can state that they were similar to those obtained by other authors [7,20].
The moisture content of raw waste was found to be nearly 20% for the olive biomass (OW1 and OW2) and for the olive-mill waste; it was 63.5% for OW3 and over 84% for OW4, which means that pre-drying was required before application in the thermal processes, particularly in the case of combustion. As typical biomass, the samples of olive-mill waste were characterized by high volatile matter and low ash contents. The OW1, OW2, and OW3 samples contained between 3.03 and 5.69% of ash, amounts that were typical for most biomasses [35,36,37], including olive waste. A significantly higher ash content was observed in the OW4 sample (approximately 14% d.m.), a result similar to that obtained by Mirande [20].
The elemental analysis showed comparable C contents in the OW1, OW2, and OW4 samples. A higher C content was found in the OW3 sample, most likely because the material included olive shells and kernels, unlike the OW1 and OW2 samples. The C content was mostly responsible for a higher heating value, which ranged from 18 to 21 MJ/kg in our samples, and was comparable with that of solid agricultural biomass. According to Demirbas et al. [38], it may range from 17 to 24 MJ/kg. When the environmental impact of olive-waste burning is taken into account, special attention must be paid to the nitrogen and sulfur contents in the fuel, since these elements are associated with a higher risk of NOx and SOx emissions, as well as an increased risk of tank corrosion. The materials tested typically showed low sulfur contents combined with higher nitrogen levels, particularly in the case of the OW2 and OW4 samples. A high nitrogen level seemed to encourage NOx formation.

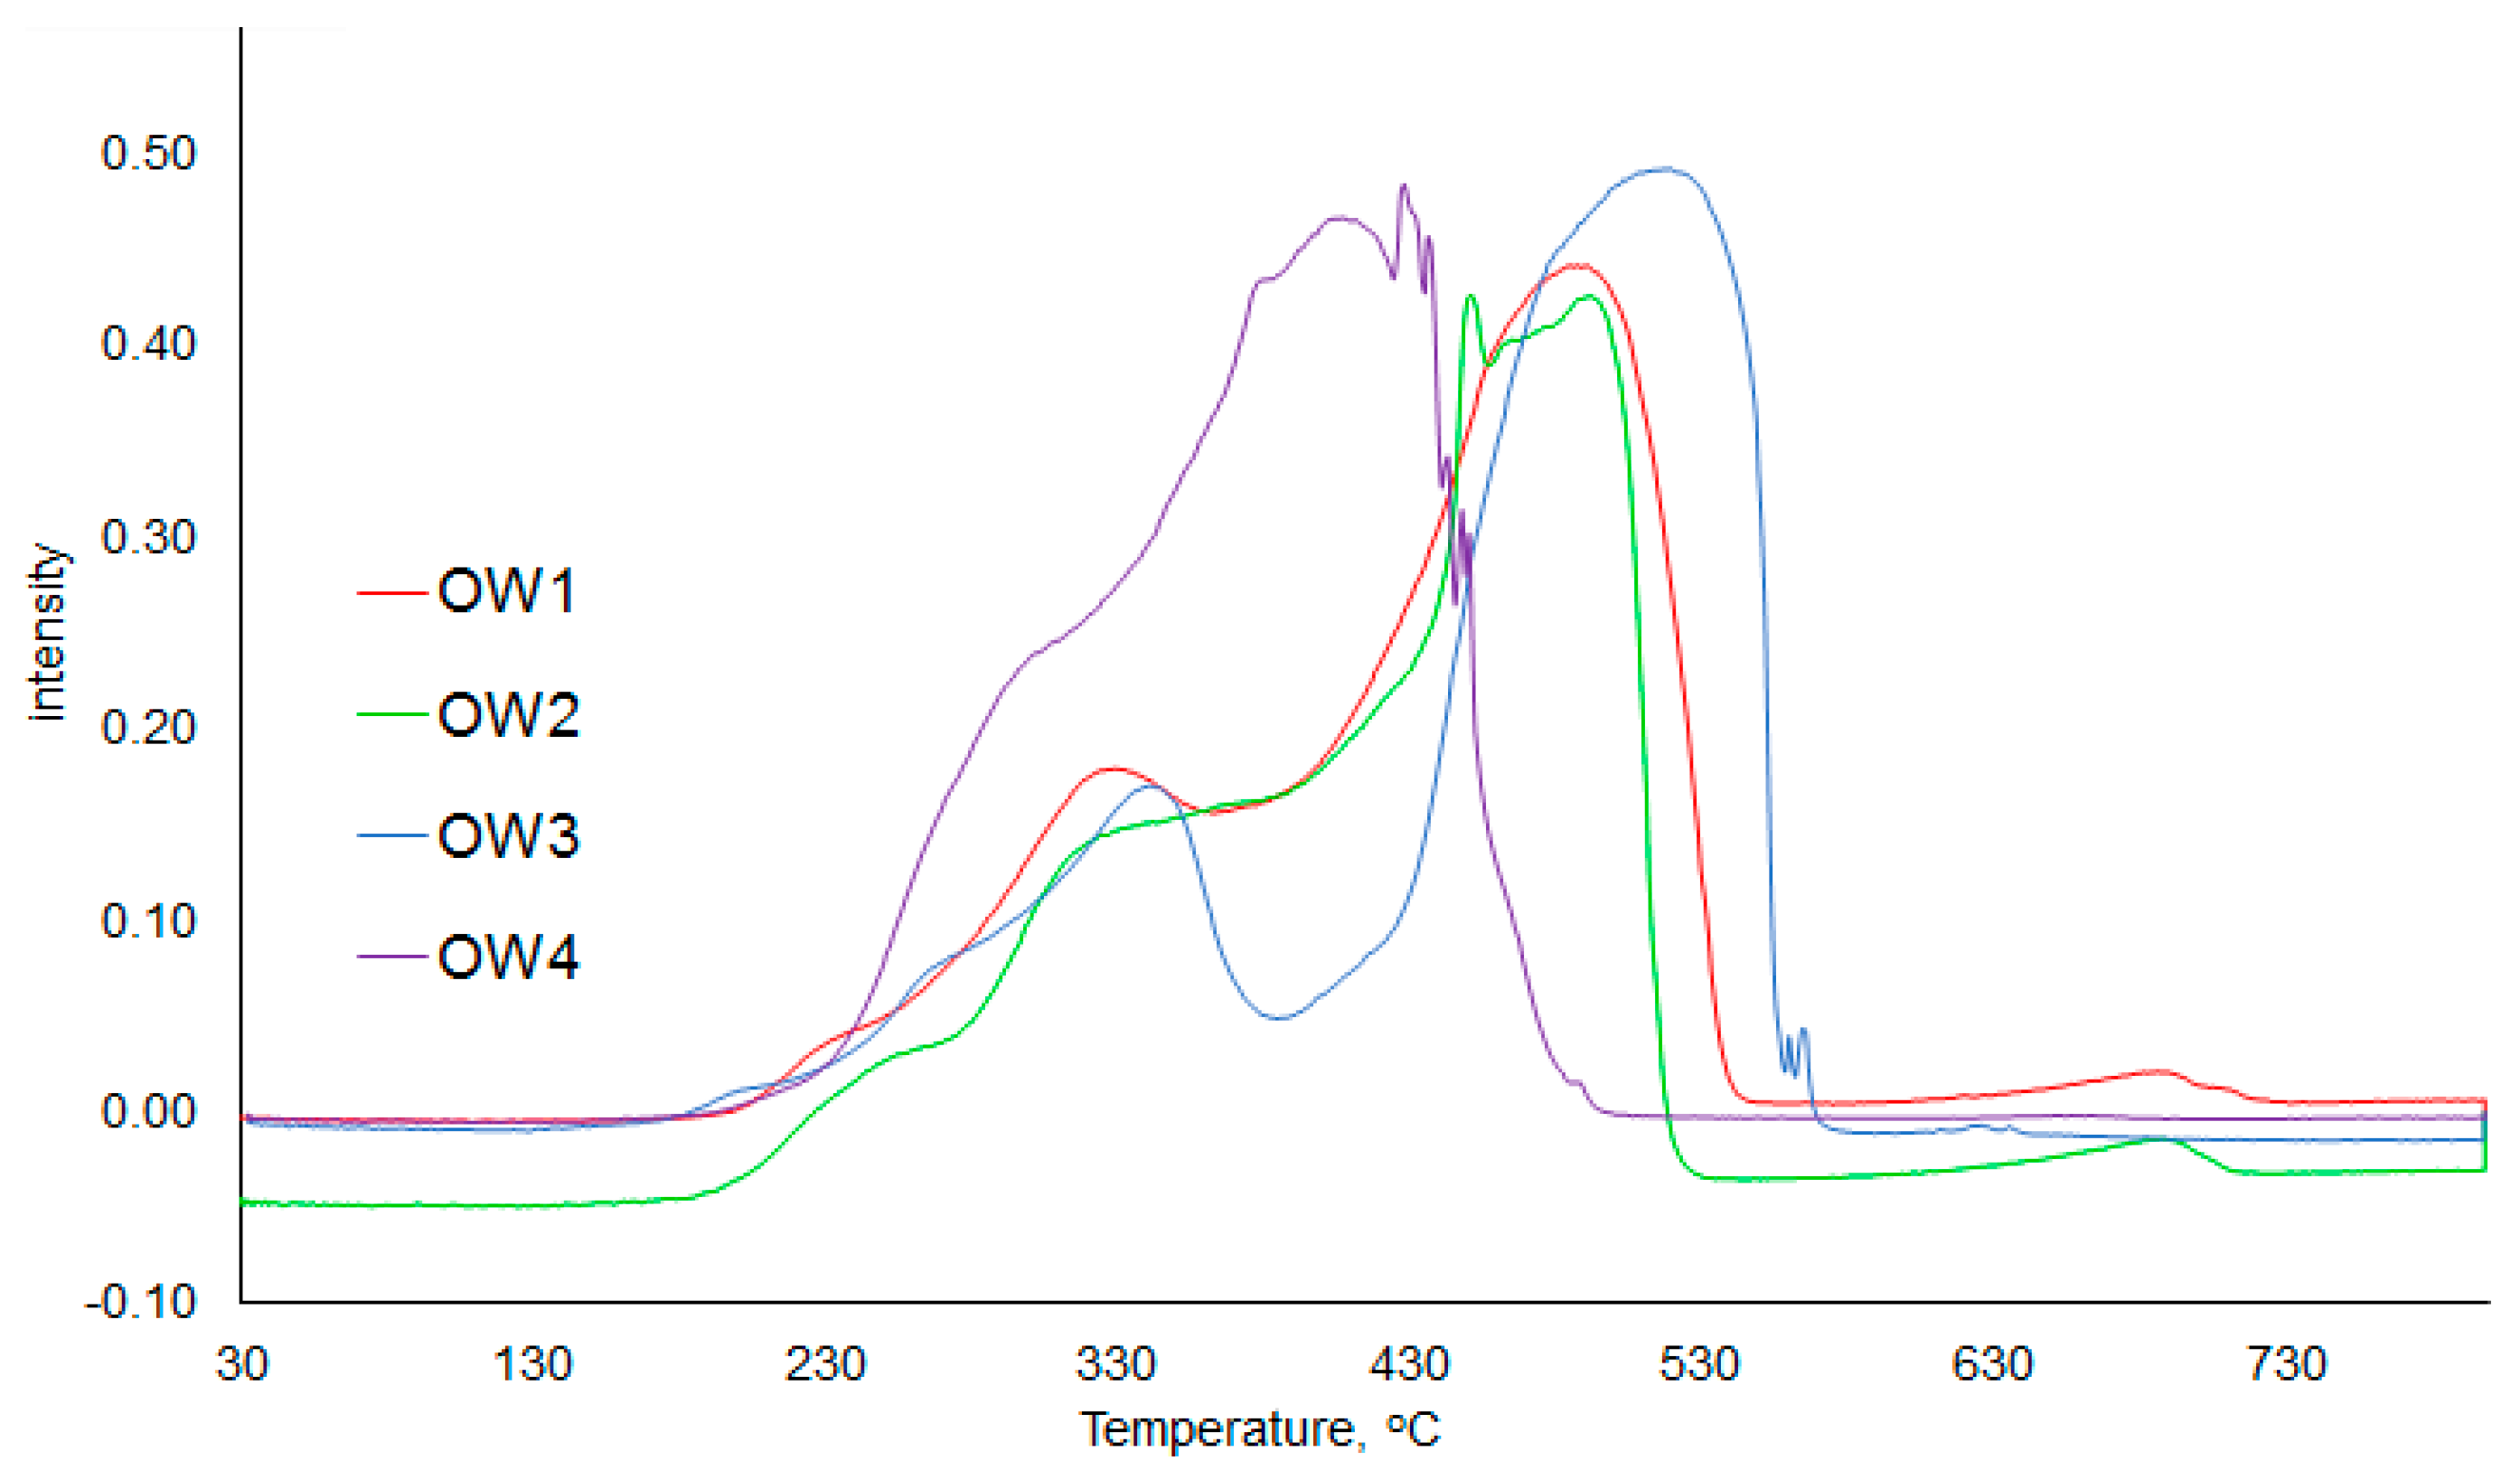
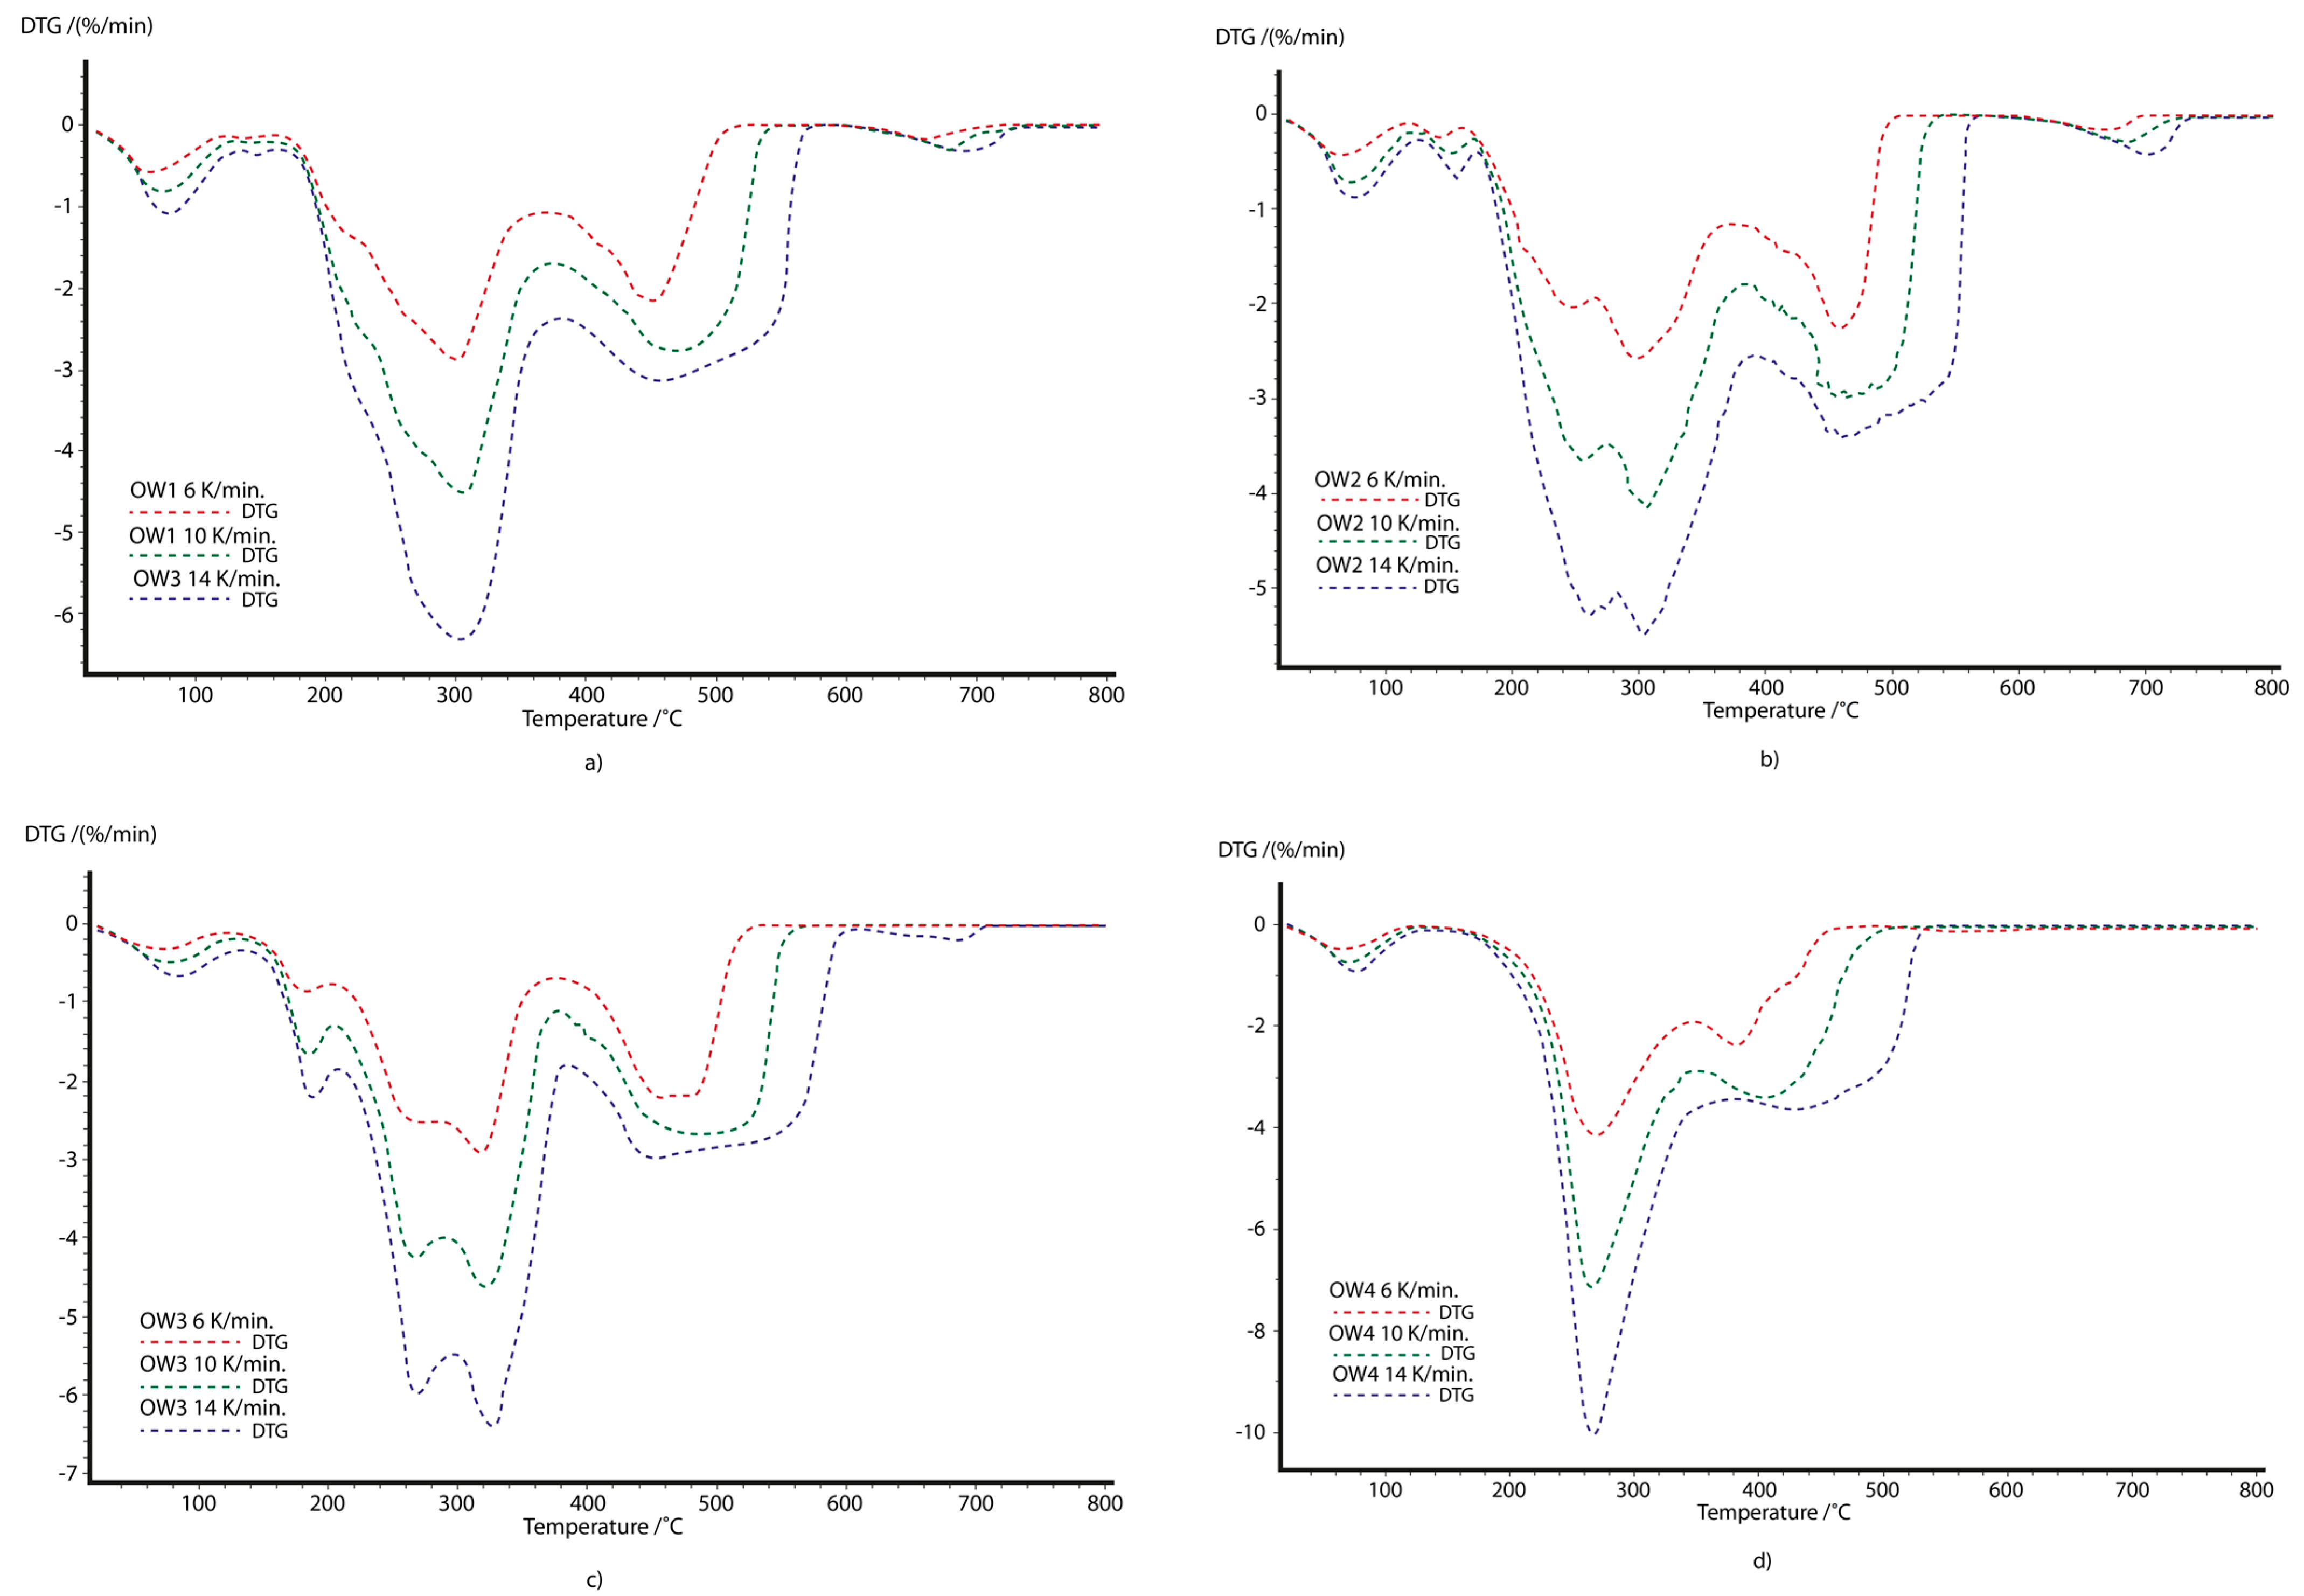
3.2. Thermogravimetric Analysis and Combustion Parameters
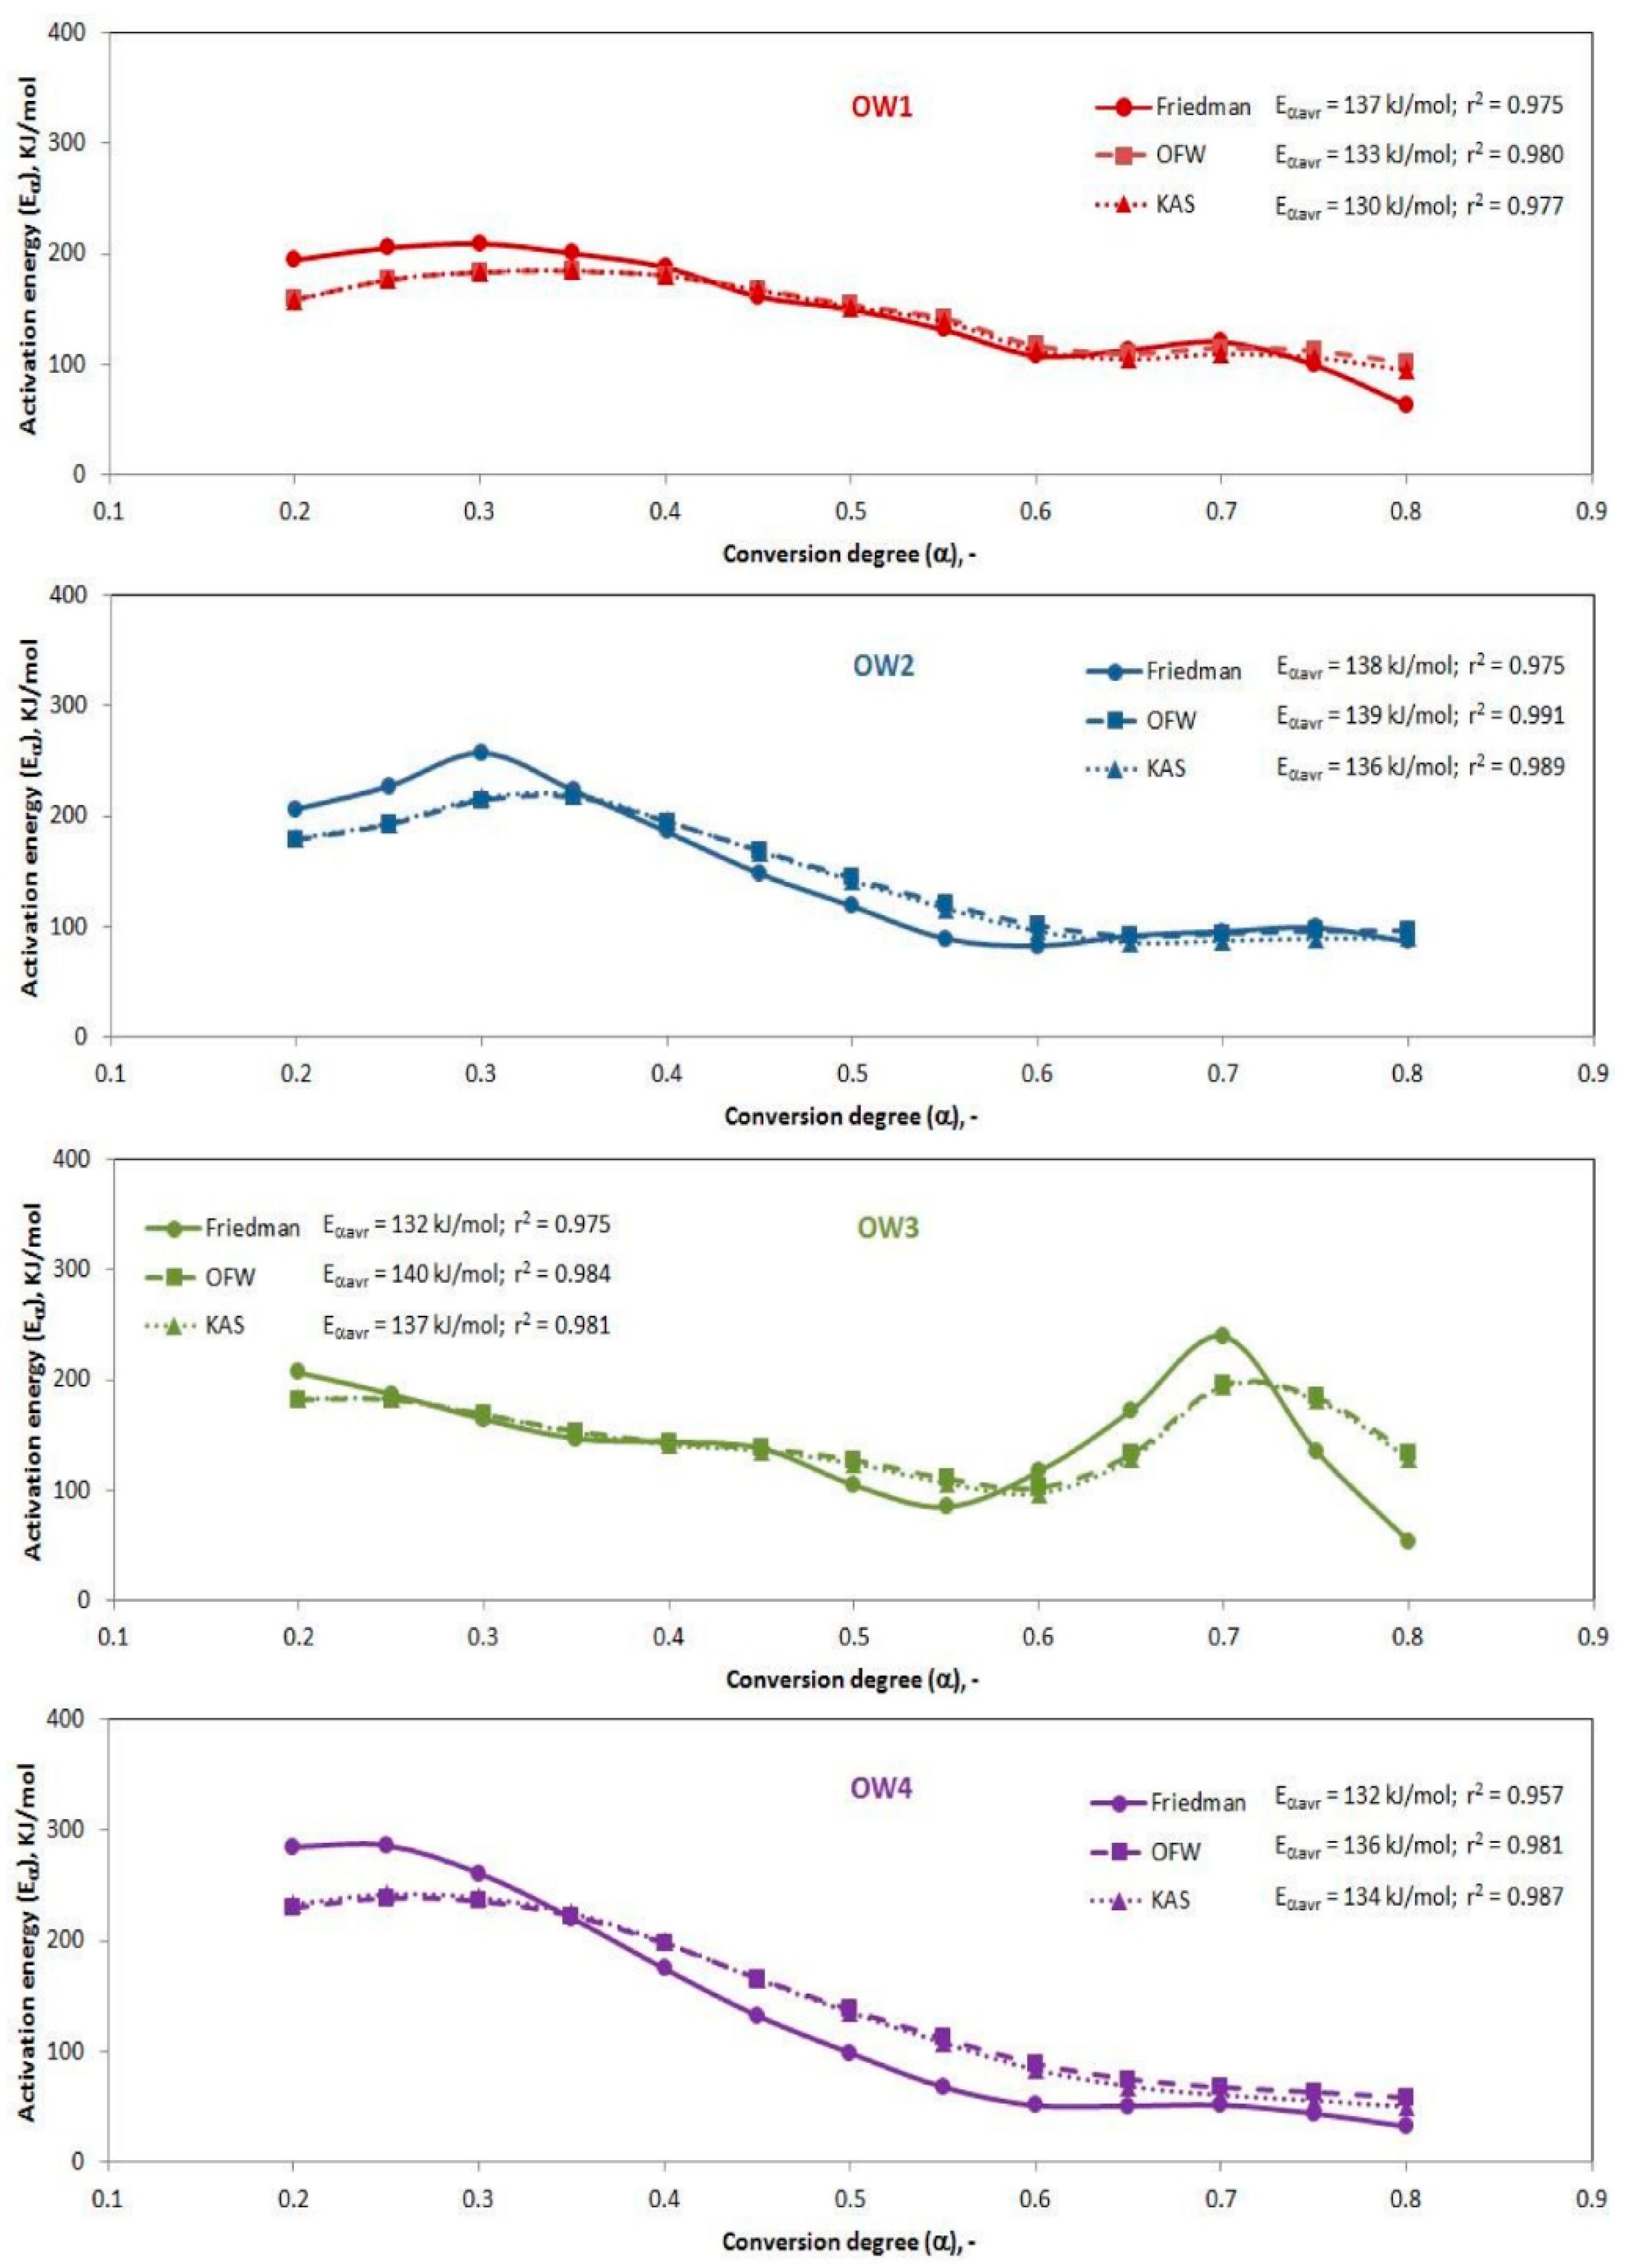
Figure 1 shows the DTG curves of the samples of olive-mill waste with their weight-loss rates in a temperature range of 0–800 °C for all heating rates used. A comparison of the TG/DTG curves of the samples is presented in Figure 2.
The DTG analysis of the sample burning profiles showed typical results for biomasses.
Successive sub-processes (stages) were observed by different authors [24,39,40]: evaporation of moisture, volatile release/char formation, burning of the volatile hydrocarbon in the gaseous space, and the combustion of char particles. The temperature ranges of stages of the tested samples are presented in Table 2.
For each of the samples, a slight mass loss connected with moisture evaporation occurred up to a temperature of approximately 140 °C. The samples demonstrated clear volatilization and char combustion stages. In the temperature range of 139–370 °C, which is described as stage II, few exothermic peaks were noted, and these were related to the volatilization of more or less thermally stable fractions in the samples. The combustion of solid residues (stage III) for the OW1, OW2, and OW3 samples took place in a similar temperature range of approximately 370–600 °C. The OW4 sample differed significantly from the other samples, in which the combustion of fixed carbon occurred earlier, at about 350 °C (at a heating ratio of 6 K/min). This resulted from the high ratio of volatile matter to fixed carbon in this material.
In the case of samples OW1 and OW2, an additional peak was visible above 600 °C, probably due to the decomposition of mineral matter; e.g., minerals such as calcium carbonate, dolomite, and kaolin [40].
On the basis of the DTG curves of the olive-mill waste, it also was possible to determine combustion parameters such as the initial temperature, Ti; the temperature at which combustion ends, Tb (temperature at which sample mass stops changing); and the total combustion time, tb (time interval between when the sample starts to burn, Ti; and the temperature at which combustion ends, Tb). The ignition temperature, Ti, was calculated in accordance with Guo Li et al. [41]. The DTG profile also allowed the characteristic temperature, Tmax, at which the largest weight loss occurred, to be determined. All parameters mentioned above are presented in Table 3.
As reported by Garcia-Ibanez et al. [22], the initial temperature of olive-mill waste at which thermal degradation starts increases as the heating rate increases, and this was observed for all samples in this study. Generally, the initial temperatures obtained for all samples was around 200 °C, with sample OW4 having the highest temperature. The results were consistent with those presented in the literature. Mirinda [20] presented the following ignition temperature values: 220 °C for the olive pit and 183 °C for olive pulp. Garca-Maraver et al. [24] indicated a range from 170 to 193 °C, while Haykiri-Ama [21] found a temperature of 200 °C for olive-mill waste.
The heating rate influences the total combustion time and the temperature at which combustion ends. It was observed that the maximum loss rates and corresponding temperatures also increased in parallel with an increase in the heating rate.
The most significant mass loss took place during the degasification stage, and in the case of the OW1, OW2, and OW3 samples, it reached maximum values of −4.5, −4.13, and −4.65%/min at temperatures ranging from 306 to 405 °C. A decisively faster loss rate of 7.15%/min was observed in the case of the OW4 sample. Even more significantly, it occurred at a clearly lower temperature for the OW4 sample: approximately 269 °C.
This might be attributable to the higher content of volatile matter in the sample, roughly 10–14%, when compared with that of the other samples. The combustion time of the samples was a derivative of the time that combustion first began and ended, which meant that the OW4 sample had the shortest combustion time.
Generally, the delayed ignition temperature and low-end combustion temperature in the OW4 sample resulted in a significant reduction in the total burning time compared with the other samples. Furthermore, the most intensive devolatilization, DTGmax, occurred at lower temperatures than for the other analyzed biomasses. In industrial practice, this means that a sample from the three-phase process requires a shorter residence time and lower temperature for complete thermal conversion. In the case of combustion of the tested wastes; e.g., in biomass grate-firing boilers, it is worth considering the possibility to blend olive biomass fuels OW1 and OW2 with OW4. Properly blended olive-waste compounds should improve the thermal conditions inside the combustion chamber in the sense of lowering the temperature gradient, especially in the area of the refractory furnace walls. The propagation of the ignition front in the bed area determines the release of volatile species and affects the stability of the combustion.
Combustion characteristic parameters such as the comprehensive combustion, S; ignition, Di; burnout, Db; and flammability, C, indexes presented in Table 3 were used to estimate the effectiveness of the process. According to [30,31,32], a high S value indicates that the process is more intensive and faster, while the high value C suggests that the process is more stable, whereas high Db and Di indexes suggest a better combustion performance. It can be stated that the heating rates, β, influence the abovementioned parameters, and for a rate of 14 K/min, the highest values were obtained for the indices. The S, Db, Di, and C values were the highest for OW4, and the tested samples were in the following order: OW4 > OW3 ≥ OW2 ≥ OW1. For example, the S and C indexes of bamboo residues at 10 K/min were in the ranges of 1.98–3.55%2/(min2K2) and 1.67–2.57%/(min2K2), respectively [42], similar to the values calculated for OW1 and OW2 samples, which were typical biomasses.

3.3. Kinetic Models

A kinetic model is essential to predict the thermal behavior of combustible materials. Mathematical methods employing thermodynamic data can be divided into model-free (isoconversional) methods, generating activation energy as a function of the reaction progress without model assumptions, and model-fitting methods, which can be used to determine the kinetic triplet (model, frequency factor, and activation energy) [24]. Isoconversional methods, such as the Friedman (FR), Ozawa–Flynn–Wall (OFW), and Kissinger–Akahira–Sunose (KAS) methods, can be used to determine kinetic parameters without knowledge of the reaction mechanism [24,43].
In this study, three methods—Friedman (FR), Ozawa–Flynn–Wall (OFW), and Kissinger–Akahira–Sunose (KAS)—were used. Changes in the activation energy, Eα, compared with the mass conversion degree are shown in Figure 3.
The plot shows good correlations with high regression coefficients, mostly over 97%, also demonstrating high compatibility in the range of conversion degree (α) of up to 0.8. The average activation energy calculated with the methods used for all tested samples was similar: between 130 and 139 kJ/mol. The activation energy of olive-mill waste was compliant with the results of the combustion of agro-biomass materials obtained by other researchers. Idris et al. [44] reported the activation energy of palm kernel shells, palm mesocarp fibers, and empty fruit bunches as having average values of 139, 118, and 105 kJ/mol, respectively. Ramajo-Escalera et al. [45] obtained a value of 210 kJ/mol for sugar cane bagasse. However, Garcia-Maraver et al. [24] reported lower activation-energy values for leaves, prunings, and wood from olive trees, dividing Eα into the following reaction stages: 1.57 to 11.14 kJ/mol for the first reaction stage (heating rate increase), 24.84–69.11 kJ/mol for the oxidative degradation of biomass, and 57.62 to 107.04 kJ/mol for the oxidation of the charred residue.

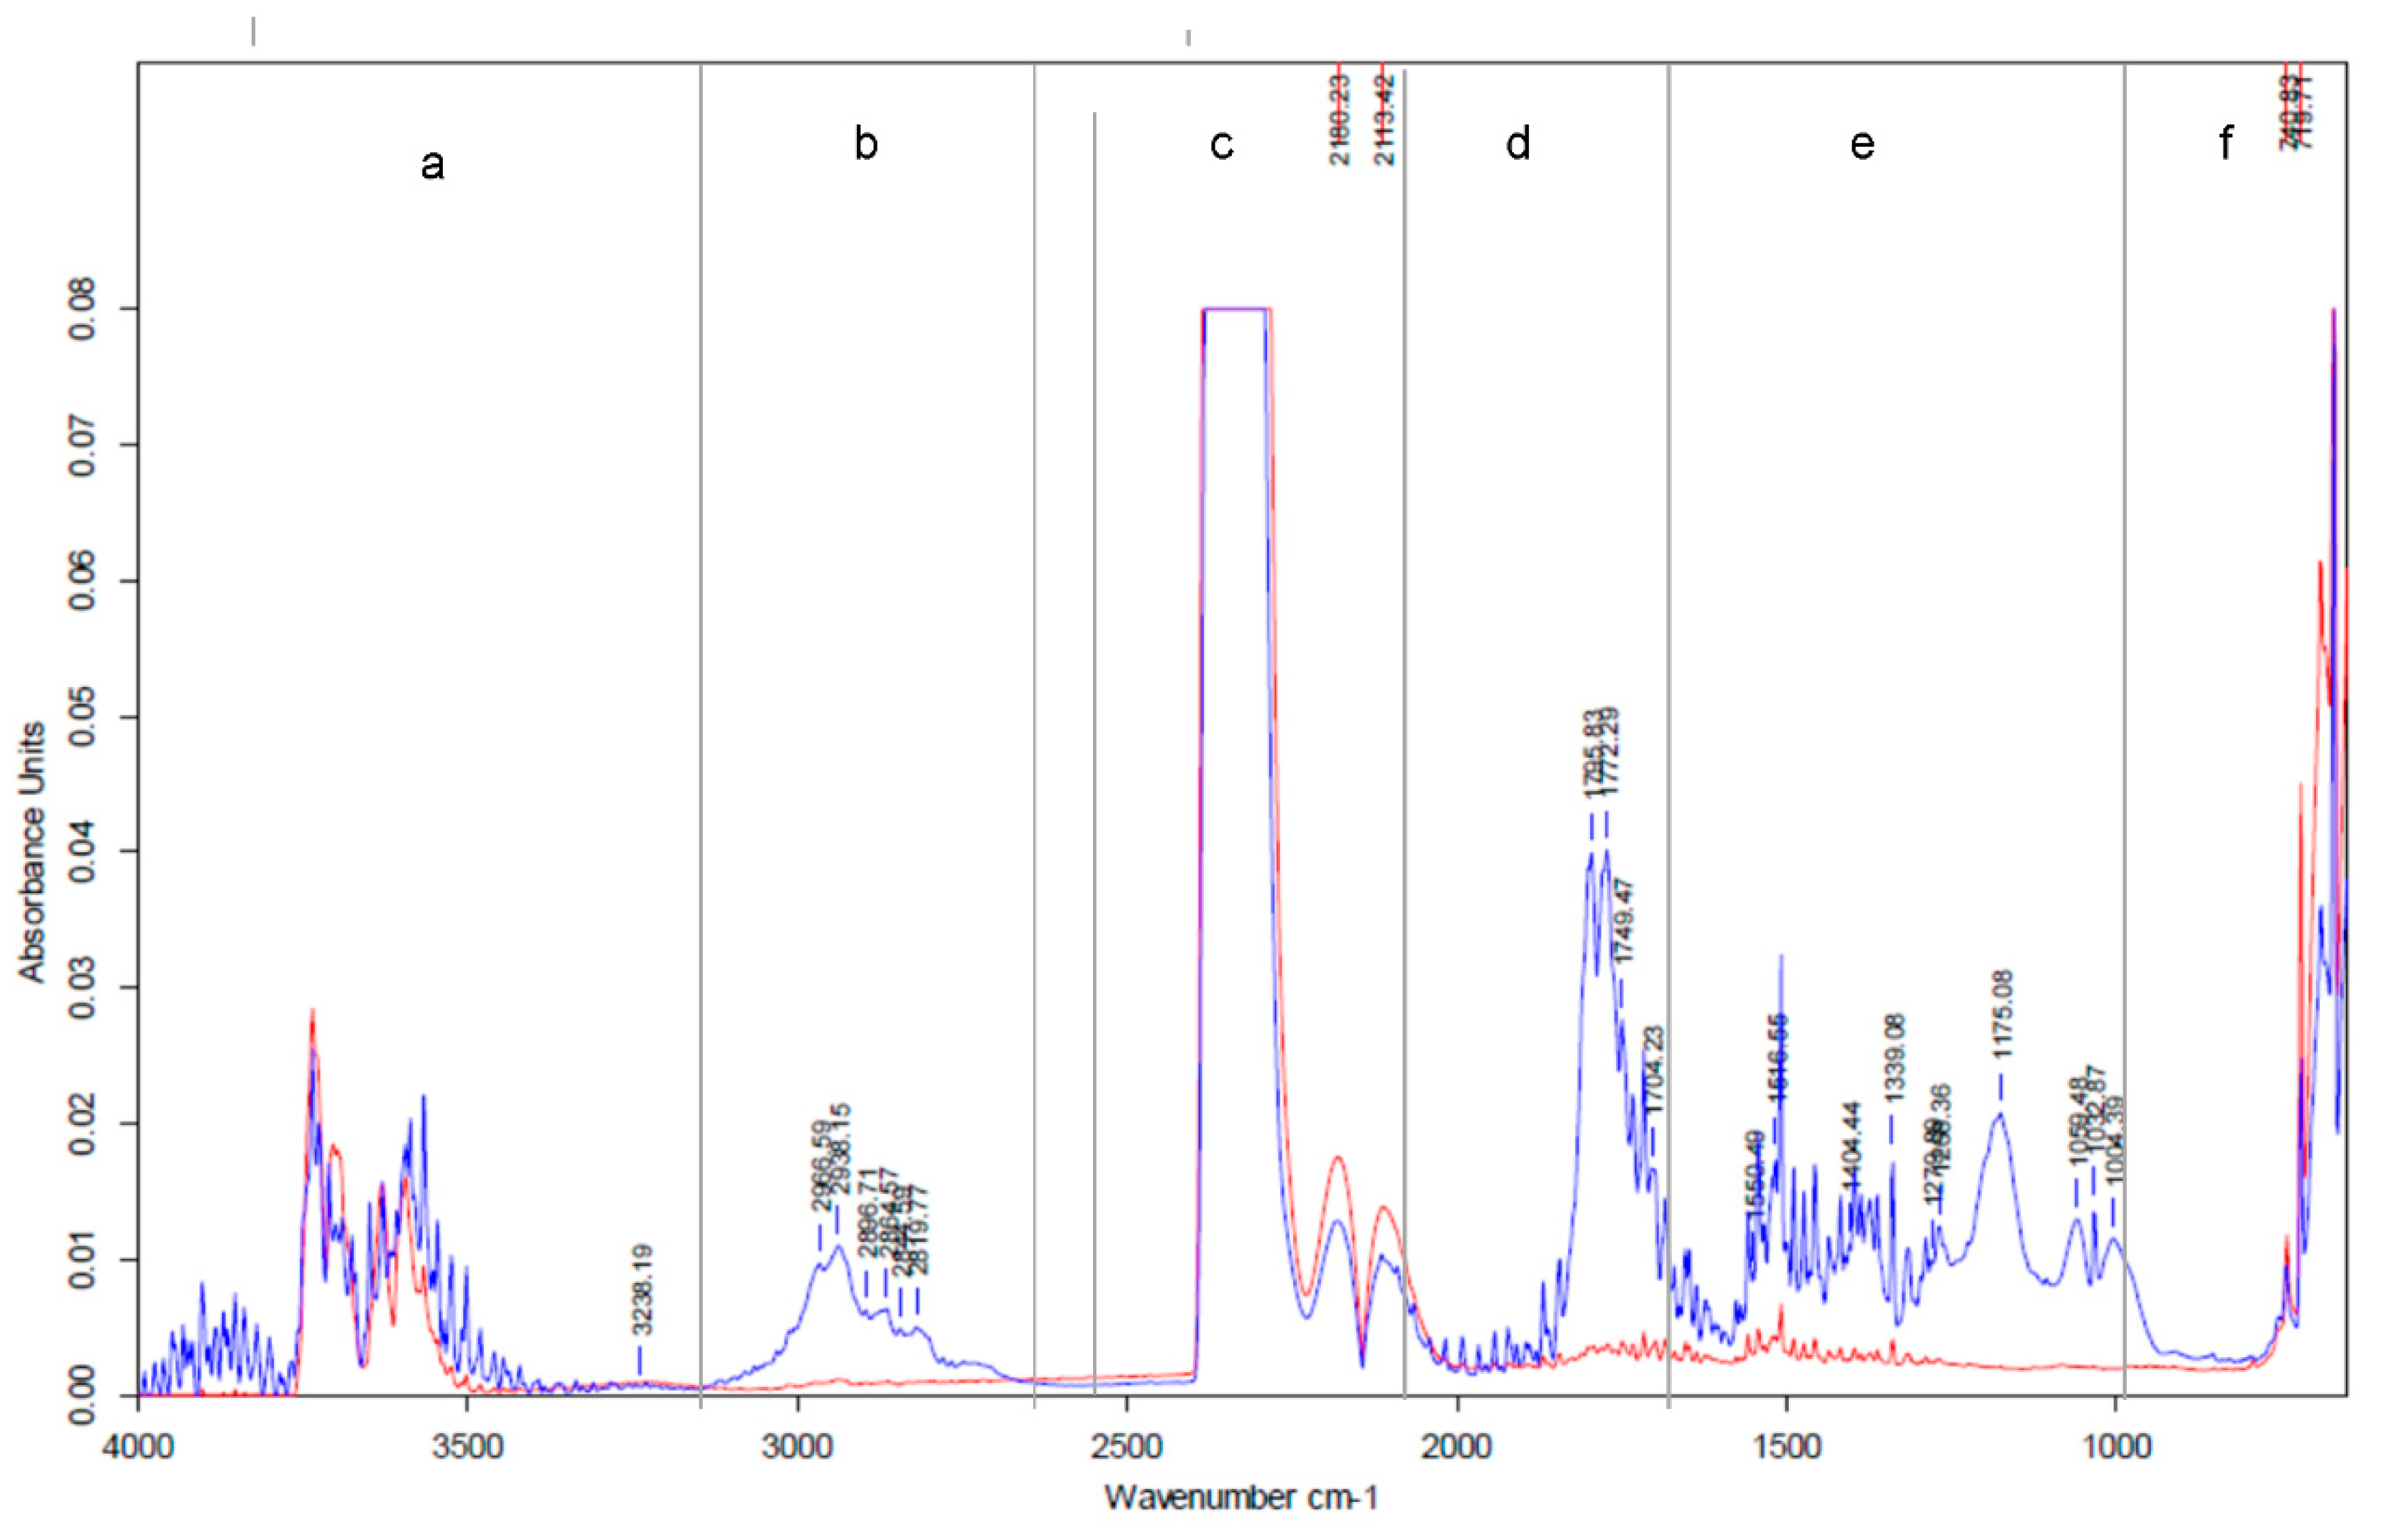
3.4. FTIR Spectra Analysis

Figure 4 shows the Gram–Schmidt profiles illustrating the total intensity of the gaseous products released. A comparison of the test results led to the conclusion that the OW4 sample was most remarkable: when heated, as it began to release gaseous products at a lower temperature and at a considerably higher rate than the other materials. Moreover, the Gram–Schmidt emission profiles show one clear extreme value, and even though it represents the sum of several overlapping processes, a single dominant one can be clearly distinguished. The CO2 emission profile for the OW4 sample appears quite similar to the Gram–Schmidt summary emission profile.
The recorded 3D FTIR spectra of the gases evolved from the olive-waste samples, including information on the infrared absorbance, wave number, and temperature, are shown in Figure 5.
The 3D spectra show two characteristic reaction areas where gaseous substances were emitted during combustion, and these were identified by their characteristic absorbance. The first one occurred at temperatures of 200–380 °C and corresponded to the material degasification area, with a maximum value at temperatures of around 344, 329, 346, and 298 °C for OW1, OW2, OW3, and OW4, respectively. The other reaction took place at temperatures between 400 and 500 °C, with the maximum CO2 value produced at temperatures of 486, 448, 516, and 404 °C for OW1, OW2, OW3, and OW4, respectively.
The spectrum appeared to be much higher in the solid combustion phase than in the degasification phase. There was one exception: the OW4 sample, for which only one peak value was recorded. Six spectra ranges were identified during the combustion process.
Figure 6 and Figure 7 present absorption waves at 3500–4000 cm−1, showing that H2O was most likely produced by cleavage aliphatic hydroxyl groups [46] (stage a). CH4 (3000–2730 cm−1) and C–H vinyl group (3013–3016 cm−1) were identified in stage b. The IR absorbance spectrum of 2400–2320 cm−1 was related to CO2 emissions (stage c).
Most likely, some compounds that produced signals in a spectrum range similar to that of CO2, such as cyanic (2310 cm−1), were also released here. CO was found at 2180–2114 cm−1 on the absorption spectrum. In the waverange of 1800–1400 cm−1 (stage d), organic acid anhydride (1801/1778), carbonates, C–H vinyl groups, C=O ketones (1778 cm−1), esters (1730 cm−1), and the C–H, =CH– banding group (1339 cm−1) were observed. In stage e and f, alcohols, CH stretching bands for ethers (1033 cm−1) and aromatic hydrocarbons (689 cm−1) were also observed.

4. Conclusions

Olive-mill byproducts are potential renewable energy sources produced in Turkey and other countries in the Mediterranean basin. The application of olive-mill waste in energy production could benefit the environment, for example, by solving problems regarding their disposal and energy recovery from waste, reducing carbon emissions, and helping to preserve conventional fuel resources.
The burning profiles of olive-mill waste showed characteristic peaks in the range of temperatures typical for biomass degradation (dehydration, devolatilization, gases, and char combustion). The delayed ignition temperature and low-end combustion temperature of sample OW4 resulted in a significant reduction in the total burning time compared with that of the other olive byproducts. This meant that a product from a three-phase process required a shorter residence time and lower temperature for complete thermal conversion. Moreover, for the OW4 sample, the most intensive volatile liberation occurred at lower temperatures than for the other analyzed samples. The gaseous release during the thermal decomposition of OW4 was more than twice as intensive in the devolatilization stage than in the combustion stage, presenting a single peak in the Gram–Schmidt profile. This behavior affects both the design of the combustion devices and the thermal conditions during the process.
Characteristic combustion parameters, S, Di, Db, and C, were found to occur in the order OW4 > OW3 ≥ OW2 ≥ OW1, which meant that the sample from the three-phase process (OW4) ignited more easily and yielded faster due to its high VM content and low FC.
The average activation energy, Eα, calculated by three model-free isoconversional methods; i.e., Friedman, Ozawa–Flynn–Wall, and Kissinger–Akahira–Sunose, was found to fall within the range of 130–140 kJ/kmol, and demonstrated high compatibility in the conversion degree range of up to 0.8.
An analysis of the FTIR results led to the conclusion that carbon dioxide was the main decomposition product, with water (small quantities), vinyl compounds, and carboxylic compounds (such as esters, ethers, alcohols, ketones) found, among other residues.
Considering the characteristic properties of olive byproducts, it is worth considering mixing them prior to the combustion process, thus improving the thermal conditions inside the combustion chamber. Those findings will be verified by combustion tests on a small-scale commercial boiler.

Author Contributions

Conceptualization, M.W., E.Y., and R.J.; methodology, M.W. and R.J.; software, R.J.; validation, M.W., R.J., and E.Y.; investigation, M.W., R.J., and B.B.; writing—original draft preparation, M.W., R.J., and E.Y.; writing—review and editing, M.W. and R.J.; visualization, R.J. and E.Y.; supervision, M.W. All authors have read and agreed to the published version of the manuscript.

Funding

This research was funded by the Opole University of Technology and Foundation University of Adnan Menderes—Scientific Research Project No. ZRF-15045.

Institutional Review Board Statement

Not applicable.

Informed Consent Statement

Not applicable.

Data Availability Statement

Not applicable.

Conflicts of Interest

The authors declare no conflict of interest.

References

  1. Turkish Statistical Institute. 2014. Available online: http://www.turkstat.gov.tr (accessed on 20 April 2021).
  2. International Olive Oil Council. Available online: http://www.internationaloliveoil.org (accessed on 20 April 2021).
  3. Anonymous. A snapshot of the Turkish olive oil sector. OLIVAE Off. J. Int. Olive Counc. 2016, 123, 4–5. [Google Scholar]
  4. Gurkan, N.P. Main actors in the Turkish Olive and Olive Oil Sector: An innovation system framework. OLIVAE Off. J. Int. Olive Counc. 2016, 123, 9–17. [Google Scholar]
  5. Niaounakis, M.; Halvadakis, C.P. Olive Processing Waste Management: Literature Review and Patent Survey, 2nd ed.; Waste Management Series; Elsevier: Amsterdam, The Netherlands, 2006. [Google Scholar]
  6. Roig, A.; Cayuela, M.L.; Sanchez-Monedero, M.A. An overview on olive mill wastes and their valorisation methods. Waste Manag. 2006, 26, 960–969. [Google Scholar] [CrossRef] [PubMed]
  7. Christoforou, E.; Fokaides, P.A. A review of olive mill solid wastes to energy utilization techniques. Waste Manag. 2016, 49, 346–363. [Google Scholar] [CrossRef]
  8. Mizerna, K.; Król, A.; Mróz, A. Environmental assessment of applicability of mineral-organic composite for landfill area rehabilitation. E3S Web Conf. 2017, 19, 2020. [Google Scholar] [CrossRef] [Green Version]
  9. Wzorek, M. Assessment of leachability of harmful components from alternative fuels prepared with the use of sewage sludge. Ecol. Chem. Eng. S 2012, 19, 617–627. [Google Scholar] [CrossRef] [Green Version]
  10. Mizerna, K.; Król, A. Directions of development of research methods in the assessment of leaching of heavy metals from mineral waste. E3S Web Conf. 2016, 10, 50. [Google Scholar] [CrossRef] [Green Version]
  11. Dermeche, S.; Nadour, M.; Larroche, C.; Moulti-Mati, F.; Michaud, P. Olive mill wastes: Biochemical characterization and val-orization strategies. Process Biochem. 2013, 48, 1532–1552. [Google Scholar] [CrossRef]
  12. Ducoma, G.; Gautiera, M.; Pietraccinia, M.; Tagutchouc, J.P.; Lebouila, D.; Gourdon, R. Comparative analyses of three olive mill solid residues from different countries and processes for energy recovery by gasification. Renew. Energ. 2020, 145, 180–189. [Google Scholar] [CrossRef]
  13. Guida, M.Y.; Bouaik, H.; Tabal, A.; Hannioui, A.; Solhy, A.; Barakat, A.; Aboulkas, A.; El Harfi, K. Thermochemical treatment of olive mill solid waste and olive millwastewater Pyrolysis kinetics. J. Therm. Anal. Calorim. 2016, 123, 1657–1666. [Google Scholar] [CrossRef]
  14. Cliffe, K.R.; Patumsawad, S. Co-combustion of waste from olive oil production with coal in a fluidised bed. Waste Manag. 2012, 21, 49–53. [Google Scholar] [CrossRef]
  15. Junga, R.; Knauer, W.; Niemiec, P.; Tańczuk, M. Experimental tests of co-combustion of laying hens manure with coal by using thermogravimetric analysis. Renew. Energy 2017, 111, 245–255. [Google Scholar] [CrossRef]
  16. Junga, R.; Wzorek, M.; Kaszubska, M. Technical and environmental performance of 10 kW understocker boiler during combustion of biomass and conventional fuels. E3S Web Conf. 2017, 19, 1009. [Google Scholar] [CrossRef] [Green Version]
  17. Garcia, G.B.; Calero de Hoces, M.; Garcia, C.M.; Palomino, M.T.; Gálvez, A.R.; Martín-Lara, M.A. Characterization and modeling of pyrolysis of the two-phase olive mill solid waste. Fuel Process. Technol. 2014, 126, 104–111. [Google Scholar] [CrossRef]
  18. Martin-Lara, M.A.; Ronda, A.; Blazquez, G.; Perez, A.; Calero, M. Pyrolysis kinetics of the lead-impregnated olive stone by non-isothermal thermogravimetry. Process Saf. Environ. 2018, 113, 448–458. [Google Scholar]
  19. Lajili, M.; Guizani, C.; Escudero Sanz, F.J.; Jeguirim, M. Fast pyrolysis and steam gasification of pellets prepared from olive oil mill residues. Energy 2018, 150, 61–68. [Google Scholar] [CrossRef] [Green Version]
  20. Mirinda, M.T.; Cabanillas, A.; Rojas, S.; Montero, I.; Ruiz, A. Combined combustion of various phase of olive wastes in conventional combustor. Fuel 2007, 86, 367–372. [Google Scholar] [CrossRef]
  21. Haykr-Ama, H. Combustion characteristics of different biomass materials. Energy Convers. Manag. 2003, 44, 155–162. [Google Scholar]
  22. García-Ibañez, P.; Sánchez, M.; Cabanillas, A. Thermogravimetric analysis of olive-oil residue in air atmosphere. Fuel Process. Technol. 2006, 87, 103–107. [Google Scholar] [CrossRef]
  23. Álvarez, A.; Pizarro, C.; García, R.; Bueno, J.; Lavín, A. Determination of kinetic parameters for biomass combustion. Bioresour. Technol. 2016, 216, 36–43. [Google Scholar]
  24. Garcia-Maraver, A.; Perez-Jimenez, J.; Serrano-Bernardo, F. Determination and comparison of combustion kinetics parame-ters of agricultural biomass from olive trees. Renew. Energ. 2015, 83, 897–904. [Google Scholar] [CrossRef]
  25. Yaman, S.; Sahan, M.; Haykiri-Açma, H.; Şeşen, K.; Küçükbayrak, S. Production of fuel briquettes from olive refuse and paper mill waste. Fuel Process. Technol. 2000, 68, 23–31. [Google Scholar] [CrossRef]
  26. Varol, M.; Atimtay, A.T.; Bay, B.; Olgun, H. Investigation of co-combustion characteristics of low quality lignite coals and bio-mass with thermogravimetric analysis. Thermochim. Acta 2010, 510, 1–2. [Google Scholar] [CrossRef]
  27. Yilmaz, E.; Wzorek, M.; Akçay, S. Co-pelletization of sewage sludge and agricultural wastes. J. Environ. Manag. 2018, 216, 169–175. [Google Scholar] [CrossRef] [PubMed]
  28. Guizani, C.; Haddad, K.; Jeguirim, M.; Colin, B.; Limousy, L. Combustion characteristics and kinetics of torrefied olive pomace. Energy 2016, 107, 453–463. [Google Scholar] [CrossRef]
  29. Yuzbasi, N.S.; Selçuk, N. Fuel air and oxy-fuel combustion characteristics of biomass/lignite blends in TGA-FTIR. Fuel Process. Technol. 2011, 92, 1101–1108. [Google Scholar] [CrossRef]
  30. Zou, H.; Evrendilek, F.; Liu, J.; Buyukada, M. Combustion behaviors of pileus and stipe parts of lentinus edodes using thermo-gravimetric-mass spectrometry and Fourier transform infrared spectroscopy analyses: Thermal conversion, kinetic, thermodynamic, gas emission and optimization analyses. Bioresour. Technol. 2019, 288, 1481. [Google Scholar] [CrossRef]
  31. Huang, J.; Liu, J.; Chen, J.; Xie, W.; Kuo, J.; Lu, X.; Chang, K.; Wen, S.; Sun, G.; Cai, H.; et al. Combustion be-haviors of spent mushroom substrate using TG-MS and TG-FTIR. Thermal conversion, kinetic, thermodynamic and emission analyses. Bioresour. Technol. 2018, 266, 389–397. [Google Scholar] [CrossRef]
  32. Song, Y.; Liu, J.; Evrendilek, F.; Kuo, J.; Buyukada, M. Combustion behaviors of Pteris vittata using thermogravimetric, kinetic, emission and optimization analyses. J. Clean. Prod. 2019, 237, 117772. [Google Scholar] [CrossRef]
  33. Dhyani, V.; Awasthi, M.K.; Wang, Q.; Kumar, J.; Ren, X.; Zhao, J.; Chen, H.; Wang, M.; Bhaskar, T.; Zhang, T. Effect of composting on the thermal decomposition behavior and kinetic parameters of pig manure-derived solid waste. Bioresour. Technol. 2018, 252, 59–65. [Google Scholar] [CrossRef]
  34. Vyazovkin, S. Isoconversional Kinetics of Thermally Stimulated Processes; Springer Science and Business Media LLC: Berlin/Heidelberg, Germany, 2015. [Google Scholar]
  35. Saidur, R.; Abdelaziz, E.; Demirbas, A.; Hossain, M.; Mekhilef, S. A review on biomass as a fuel for boilers. Renew. Sustain. Energy Rev. 2011, 15, 2262–2289. [Google Scholar] [CrossRef]
  36. Wzorek, M.; Troniewski, L. Application of sewage sludge as a component of alternative fuel. In Proceedings of the 2nd National Congress of Environmental Engineering 2007, Lublin, Poland, 4–8 September 2005; pp. 311–316. [Google Scholar]
  37. Wzorek, M. Physical and chemical properties of fuel containing animal waste. WIT Trans. Ecol. Environ. 2008, 109, 69–77. [Google Scholar]
  38. Demirbas, A.; Pehlivan, E.; Altun, T. Potential evolution of Turkish agricultural residues as bio-gas, bio-char and bio-oil sources. Int. J. Hydrogen Energy 2006, 31, 613–620. [Google Scholar] [CrossRef]
  39. Yang, Y.B.; Sharifi, V.N.; Swithenbank, J. Effect of air flow rate and fuel moisture on the burning behaviours of biomass and simulated municipal solid wastes in packed beds. Fundam. Mech. Biomass Pyrolysis Oxid. 2004, 83, 1553–1562. [Google Scholar] [CrossRef]
  40. Zhu, Y.; Yi, B.; Yuan, Q.; Cao, H.; Yan, S. Combustion characteristics of cattle manure and pulverized coal co-firing under oxy-fuel atmosphere in non-isothermal and isothermal conditions. BioResources 2018, 13, 6465–6479. [Google Scholar]
  41. Guo, L.X.; Guo, M.B.; Xu, L.; Wu, H.Z.; Gang, W.X. Thermogravimetric analysis of the co-combustion of the blends with high ash coal and waste tyres. Thermochim. Acta 2006, 441, 79–83. [Google Scholar]
  42. Hu, J.; Yan, Y.; Evrendilek, F.; Buyukada, M.; Liu, J. Combustion behaviors of three bamboo residues: Gas emission, kinetic, reaction mechanism and optimization patterns. J. Clean. Prod. 2019, 235, 549–561. [Google Scholar] [CrossRef]
  43. Ceylan, S.; Topu, Y. Pyrolysis kinetics of hazelnut husk using thermogravimetric analysis. Bioresour. Technol. 2014, 156, 182–188. [Google Scholar] [CrossRef]
  44. Idris, S.S.; Rahman, N.A.; Ismail, K. Combustion characteristics of Malaysian oil palm biomass, sub-bituminous coal and their respective blends via thermogravimetric analysis (TGA). Bioresour. Technol. 2012, 123, 581–591. [Google Scholar] [CrossRef]
  45. Ramajo-Escalera, B.; Espina, A.; Garca, J.; Sosa-Arnao, J.; Nebra, S. Model-free kinetics applied to sugarcane bagasse combus-tion. Thermochim. Acta 2006, 448, 111–116. [Google Scholar] [CrossRef]
  46. Gao, N.; Li, A.; Quan, C.; Du, L.; Duan, Y. TG–FTIR and PYGC/MS analysis on pyrolysis and combustion of pine sawdust. J. Anal. Appl. Pyrolysis 2013, 100, 26–32. [Google Scholar] [CrossRef]
Figure 1. DTG curves of olive-waste samples: (a) twigs (OW1), (b) leaves (OW2), (c) olive-mill waste from the two-phase process (OW3), and (d) olive-mill waste from the three-phase process (OW4).
Energies 14 04123 g001
Figure 2. TG/DTG curves of olive-waste samples.
Energies 14 04123 g002
Figure 3. Activation energies, Eα, for different mass conversion degrees calculated using the Friedman (FR), Ozawa–Flynn–Wall (OFW), and Kissinger–Akahira–Sunose (KAS) methods at a heating rate of 10 K/min.
Energies 14 04123 g003
Figure 4. Gram–Schmidt profiles for the olive-mill waste.
Energies 14 04123 g004
Figure 5. 3D FTIR diagrams of gases emitted during combustion of the olive-mill waste.
Energies 14 04123 g005
Figure 6. FTIR spectrum of gaseous products for OW1 at temperatures of 344 °C (blue line) and 486 °C (red line).
Energies 14 04123 g006
Figure 7. FTIR spectrum of gaseous products for OW4 at temperatures of 298 °C (blue line) and 404 °C (red line).
Energies 14 04123 g007
Table 1. Energy parameters of olive-mill waste.
SamplesProximate Analysis (wt %)Ultimate Analysis (wt %)LHV
d.m.
MJ/kg
Moisture
w.b.
Ash
d.m.
Volatile Matter
d.m.
Fixed Carbon
d.m.
CHNSO
d.m.
OW119.165.1055.3239.5845.116.340.890.0847.5816.49
OW219.555.6955.0039.3148.416.851.640.1642.9418.63
OW353.493.0351.5745.451.376.620.850.0541.1119.44
OW484.2414.1965.6620.1546.236.121.060.1746.4217.37
Note: w.b.—wet basis; d.m.—dry mass.
Table 2. Energy parameters of olive-mill waste.
SampleStage IIa
°C
Stage IIb
°C
Stage IIc
°C
Stage III
°C
6 K/min
OW1--175–367367–520
OW2-166–267267–371371–506
OW3139–203203–284284–371371–540
OW4--154–347347–476
10 K/min
OW1--177–380380–550
OW2-168–272272–385385–542
OW3139–205205–292292–378378–570
OW4--157–352352–519
14 K/min
OW1--180–385385–580
OW2-170–282282–390390–573
OW3141–209209–297297–384384–606
OW4--160–374374–536
Table 3. Characteristic devolatilization and combustion parameters for the olive-mill waste.
Stage IIaStage IIbStage IIcStage IIc
SampleTiTbtbDTGmaxTmaxDTGmaxTmaxDTGmaxTmaxDTGmaxTmaxS·107Di·102Db·104C·104
°C°Cmin%/min°C%/min°C%/min°C%/min°C%2/(min2K3)%/min3%/min4%/(minK2)
6 K/min
OW122252048.3----−2.89303.8−2.19454.20.830.140.150.59
OW219850649.7--−2.07247.9−2.60299.9−2.27456.20.980.130.150.66
OW320854053.8−0.89182.0−2.53269.7−2.92316.3−2.24459.90.950.130.130.67
OW423047639.8----−4.14270.3−2.41382.91.270.230.270.78
10 K/min
OW122455030.8----−4.50305.7−2.79469.12.070.520.890.90
OW219954232.3--−3.68253.0−4.13405.0−3.02463.72.460.490.821.04
OW320957034.3−1.69185.3−4.23264.0−4.65319.9−2.70479.12.430.500.751.06
OW423451926.8----−7.15268.7−3.45399.23.320.911.591.31
14 K/min
OW122658023.2----−6.33302.0−3.15474.53.091.242.791.24
OW220657324.1--−5.31259.5−5.49303.9−3.43469.24.151.112.461.29
OW321060626.1−2.20188.8−5.99268.8−6.38325.9−2.95482.54.461.182.291.45
OW423553619.7----−10.06269.2−3.67430.76.422.285.271.81
Publisher’s Note: MDPI stays neutral with regard to jurisdictional claims in published maps and institutional affiliations.

