1. Introduction
Development of the grid management’s efficiency is a challenge to each electric power grid operator. The MV cable lines are a specific and very important grid element. Often the most aged part of the MV cable network is the paper insulated lead covered (PILC) cables. In such cable lines, the risk of failure will be the highest in the near future. The aging/degradation process in the individual cable sections and accessories (cable terminations and joints) can be at a different stage resulting in the additional difficulty in the network management [
1,
2,
3,
4].
In recent decades, new diagnostic methods for MV cable systems have been implemented. At present, two basic diagnostic techniques are applied: partial discharges (PDs) measurement and the dielectric loss factor (tangent delta, tan delta, TD) measurement. In available diagnostic systems, the off-line measurements, carried out with the cable line disconnected from the operating voltage, are possible. In such solutions, external voltage sources are applied. Therefore, the test voltage can be regulated and the PD and TD measurements under different voltage values can be carried out. Thus, the value of the PD inception (PDIV) and extinction voltage (PDEV) can also be measured. In diagnostic measurements, the very low frequency (VLF) voltage 0.1 Hz and damped AC (DAC) voltage are most often applied as the test voltage [
5]. Information obtained from the PD and TD measurements can give the knowledge supporting the estimation of the cable and accessories technical conditions [
6]. At present, the problem consists not only in the correct measurements but also in the interpretation of the obtained results and the diagnosis of the cable line technical conditions referred to the owned set of information. Special opportunities to analyse the aging processes in the individual cable lines can arise from the PD measurements, which enable one to find the localisation of the PD appearance [
2,
7,
8,
9]. This is one of the tests enabling one to analyse the data as a function of the cable length [
10,
11,
12,
13].
A universal method is being sought all over the world, which will allow one to estimate the cable’s life expectancy based on the cable insulation condition assessment [
14,
15]. After a certain period of operation of the cable line, it is necessary to have the information about the condition of this insulation. The importance of reliable MV cable network is well understood by the cable network operators. For this, various diagnostic methods are used, but the most important is interpretation of the obtained measurement results [
16,
17]. However, it is necessary to use such measuring methods that do not have a destructive effect on the condition of the cable insulation system. Some of the diagnostic methods used to determine the condition of the cable insulation system can also be used to locate a place of cable line fault [
18]. To be able to assess the current condition of the insulation in a cable line operated for a certain period of time, information about selected parameters that changed from the time of line commission is very useful. Therefore, monitored acceptance tests are increasingly used, especially those in which the voltage test is combined with partial discharge and tan delta analysis [
19,
20,
21,
22].
Diagnostic measurements can be used to test the degradation state of MV cable insulation. The assessment system should be multistage so that it can effectively support the management of this network. Partial assessment methods are described, e.g., in IEEE documents 400.2 and 400.4 [
23,
24]. Increasingly, the health index procedure is used to assess the condition of a cable line [
25,
26,
27,
28,
29]. Research to develop an integrated system for assessing the degradation of the cable insulation is carried out by Energa-Operator SA. In the network, diagnostic tests are carried out in the years 2003–2021 on MV power cables. Within the SORAL project, based on the obtained data, a cable health index for paper insulated lead covered (PILC) and cross-linked polyethylene (XLPE) cables is developed. Scientists from the Poznan University of Technology and experts from Onsite participate in the research. The authors used electrical and chemical measurements to obtain more precise information on the state of tested cables’ insulation. The designed research included PD and tan delta value investigation and such chemical and mechanical parameter measurements like: microscopic observation, material composition by infrared (IR) spectroscopy, differential scanning calorimetry, degree of crystallinity and cross-linking of XLPE insulation, microhardness, oxygen index, tensile strength, elongation at break and modulus of elasticity.
The health index developed in time of the research that is implemented in the IT system. The system gives the possibility to optimise maintenance procedures and replacement of cable lines. Research and development works are cofinanced by the Polish government [
30].
2. The First Stage of Research
Up to 2018, the research works focused on the determination of the key parameters reflecting the advanced aging process in the insulation’s material. The research has been carried out in the pilot area consisting of one thousand MV cable lines of 500 km total length. Over 50% of the investigated network is made of the paper insulated lead covered (PILC) cables [
3]. The research was based on measurements made over a period of over 15 years. PD measurements were performed with the use of DAC test voltages.
Measurement results of more than 450 cable sections were analysed. For these cables, measurements were performed cyclically throughout the research period. In that time, there were electrical failures in 18 sections of the cable lines. The collected data for these cables (technical data, partial discharge measurement results) were analysed in detail and compared with the data of the remaining cables subjected to diagnostic tests. The results of the research allowed one to determine the key parameters influencing the risk of failure. Key factors describing the level of degradation of PILC cable insulation are as follows:
- A.
The analysis has shown that, for 90% of defects of cables, the failure took place when either an increased intensity of PDs or an increased PD level appeared in the cable as compared to the average PDs’ level in the whole cable line.
- B.
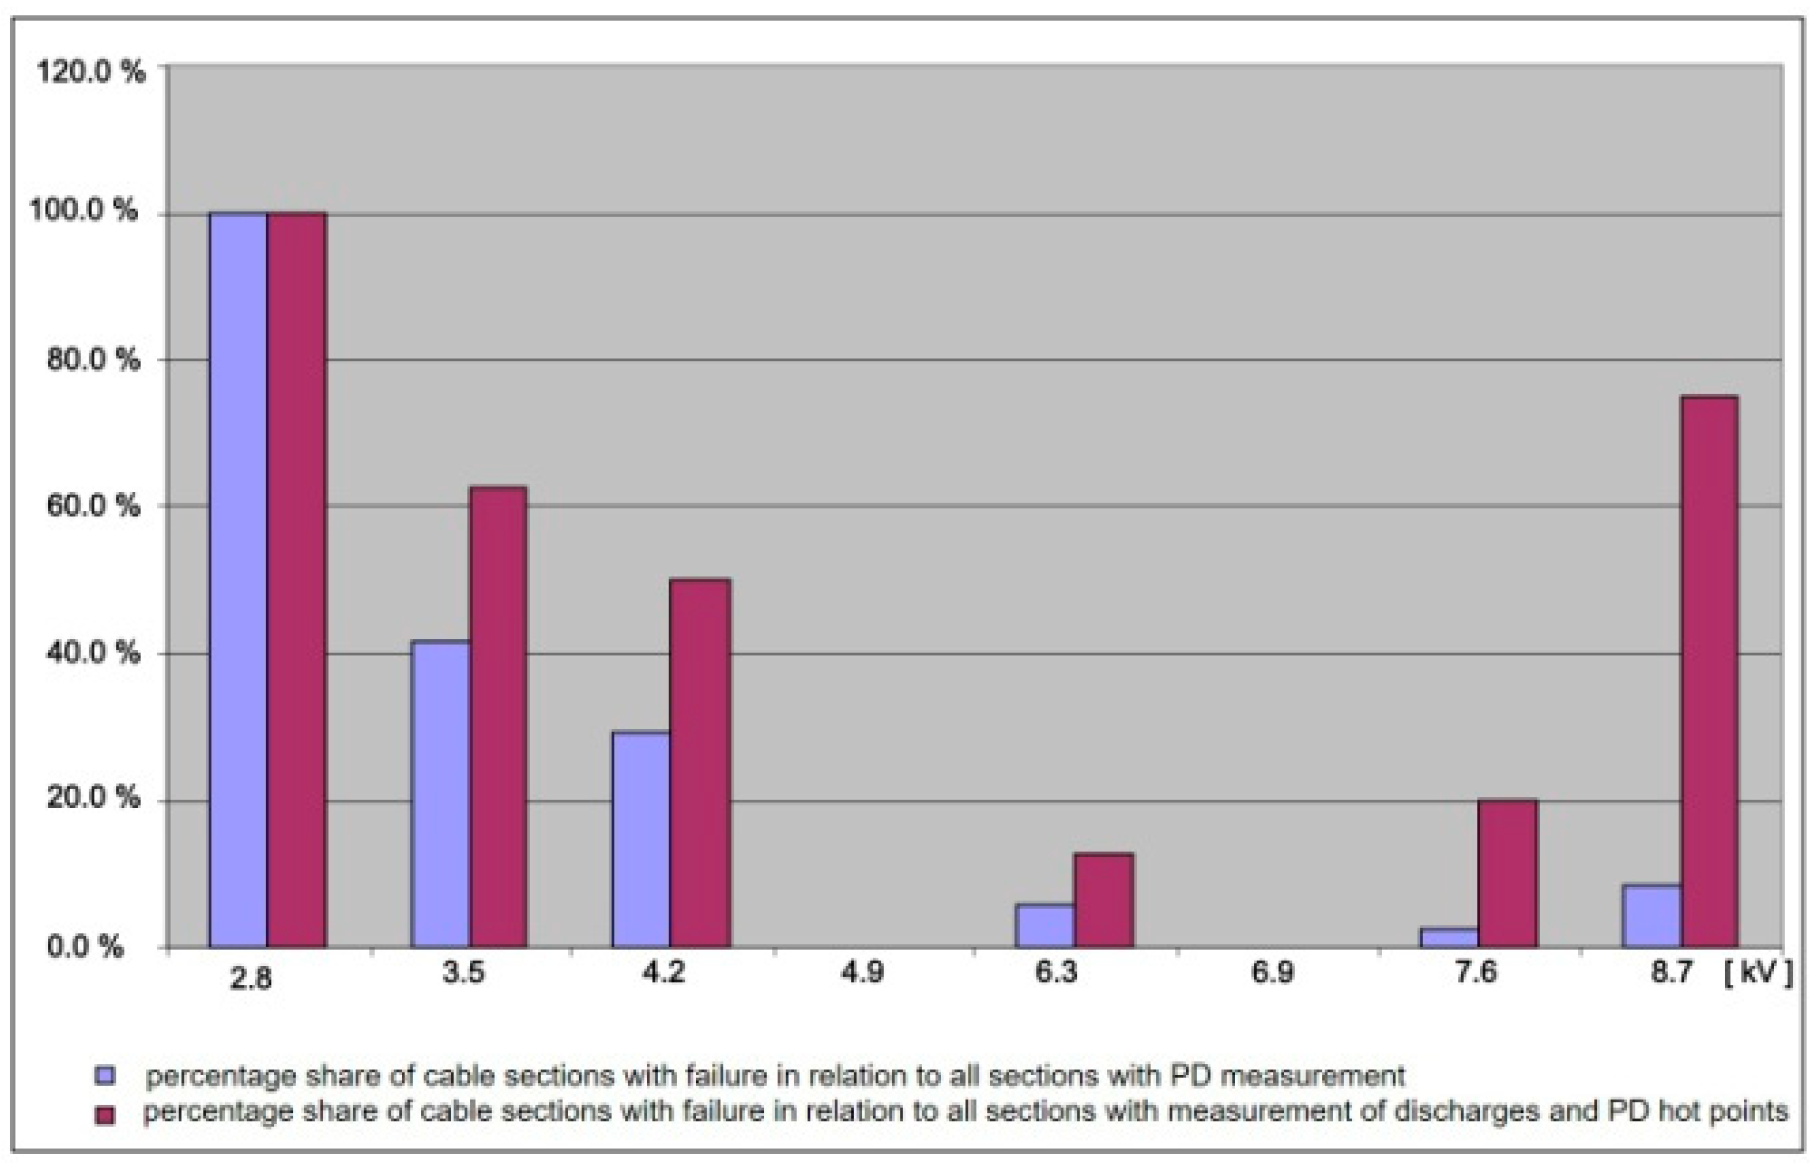
Probability of the cable failure was increased as the PD inception voltage decreases. In
Figure 1 it is shown:
The percentage of damaged cables in the total number of cables in which the PDs have been registered,
The percentage of damaged cables in relation to the cable sections on which an increased intensity of PDs appeared are shown for the groups of cables at an actual level of the PD inception voltage (PDIV).
- C.
The aging of the insulation proceeds with the service life. The probability of failure increased with the age of the cable line. It is necessary to consider this indicator in the risk of failure.
Figure 2 shows the exemplary number of failures that occurred within 10 years in PILC cable lines depending on the year of manufacturing of the cables.
- D.
Detailed analysis of the PD level in the investigated damaged cable sections, at chosen PD inception levels (see
Figure 3) does not indicate that the PD value decides on the future damage of the actual cable section. The measurements marked in red in the group for each level of PDIV refer to the sections of the cable on which the failure occurred. At this stage of research, it was not possible to demonstrate the relationship between the value of partial discharges and the risk of failure.
The knowledge and experience gained during the research served as the basis for further activities described in the further part of the document. The results of the work indicated dependencies that can be used to determine the health index.
3. The Second Stage of Research
The aim of the second stage of the research was to define the health index (HI) describing the relationship between the risk of failure and the data for individual cable lines. Accomplishment of additional diagnostic measurements was an important research element of the project. The number of the cable lines under test was 230. The measurements were done by the new diagnostic system to investigate the partial discharge and dielectric loss factor. The equipment, enabling one to apply two test voltages, i.e., DAC and VLF, used in investigations is shown in
Figure 4.
The diagnostic investigations conducted in the project completed our expertise acquired during earlier diagnostic measurements. Along with historical data, it forms the data sets encompassing a very long time of line operation, i.e., 2003–2020.
The obtained data on the cable network was collected in the digital data base. Data concerning the cable network include technical information on MV cable lines obtained from GIS (geographic information system). They contain detailed information about elements of the cable line (joints, terminations and cable sections).
Figure 5 shows the view of the cable line with information on individual cable sections.
Technical information has been integrated with the results of diagnostic measurements. Data obtained from each measurement have been implemented in the system and information on each PD site has been entered for individual test voltages (apparent charge value and PD place of occurrence).
Figure 6 shows an example of integrated data and visualisations of PD measurement results.
The other layer of integrated data is information on cable failure occurrence. Prepared and verified information on electrical breakdowns were entered into the system. The information about each failure contains the place and time of occurrence—
Figure 7.
The definition of such models for the insulated cable sections, PILC (paper insulated lead covered) and XLPE (cross-linked polyethylene) cables, will be of key importance. The aging processes in two mentioned cable types run in a different way and the values of corresponding parameters measured in diagnostic tests are different. Due to detailed investigations of the chosen cable samples done by the Poznan University of Technology, the aging processes in the PILC and XLPE cables can be estimated. Thus, the results of research work can be verified.
The additional analysis of collected data indicates that the changes in time mainly concern the lowering of the PD inception voltage and the increase in PD intensity. This confirms the previous assessments presented in
Section 2 of this paper. The described scope of work and prepared data allowed to select a group of cable lines in which the lowering of PD inception voltage is visible. These cable lines represent about 15% of all cable lines tested. This group of cables with an increased risk of failure will form the basis for further research.
The acquired data were prepared for analysis in the research part of the work. Therefore, the data are aggregated in a special database and its acquisition is automated by the IT system. Preprocessed data were used in the analyses and statistical investigations. The datasets contain two main categories:
Based on the above-mentioned information the analysis tool was defined. A library of both deterministic and statistical tools was needed to allow the analysis of the above data. From this analysis, it was possible to obtain the boundary values that will be used in the tool to determine the cable health index. The main layout of the required analysis structure is seen in
Figure 8.
The following information was obtained from the GIS and PD mapping:
- 3.
Age of the cable section.
- 4.
PD inception voltage per cable phase for all cable sections.
- 5.
The amplitude of partial discharges at each test voltage level for each phase up to 2Uo.
- 6.
PD concentration at a specific location.
- 7.
Failure history—take into account only electrical failure.
Additional measurements of tan delta with VLF voltages were made in 2019. About 120 cable lines were tested in this way. The following information was stored:
Tan delta values measured at 1.0 Uo, 1.5 Uo and 2.0 Uo for each cable phase.
From the measured values of tanδ, an increase in this value or an increase in the difference Δtanδ for each phase was obtained. This is the difference between the TD value measured at 1.0 Uo and 2.0 Uo.
Both kinds of data are used as input for the statistical analysis of TD.
The statistical analysis was applied to the PD and TD diagnostic properties. To analyse the PD data of PILC cables five datasets were constructed and analysed: PD concentrations of at least five PD pulses, voltage levels in the ranges below 0.5 Uo, 0.5 Uo–1.0 Uo, 1.0 Uo–1.3 Uo, 1.3 Uo–1.7 Uo and above 1.7 Uo.
The five datasets were fitted to the 3-parameter Weibull distributions, which provided the best fit. The datapoints and the fitted Weibull distribution for the exemplary dataset are shown in
Figure 9.
A similar scope of analyses was performed for TD. To analyse the TD data four datasets were constructed: TD at voltage levels at 1.0 Uo, 1.5 and 2.0 Uo, tip up (delta tan delta) given the increase of tan delta between 1.0 and 2.0 Uo.
The statistical functions were used to obtain boundary values for tan delta and partial discharges values. Statistical limits for the index state of the cable in the 5-point scale, with the number and the colour adopted as:
Index 9: very good (green),
Index 8: good (light green),
Index 6: moderate (yellow),
Index 3: poor (orange),
Index 1: very poor (red).
Seven parameters were determined as the result of the data analysis:
PD concentration.
PD inception voltage (PDIV). The PD inception voltage is the lowest voltage where PD activity starts within the cable.
PD amplitude at PDIV. Besides the inception voltage, also the PD amplitude that is measured at this voltage level is of importance. For a very good (green) condition, the measured values at the inception voltage have to be equal or below 20% (B20) of the values of the complete distribution. For a condition to be very poor (red), the measured values have to be higher than 80% (B80) of the fitted distribution.
PD amplitude at 2 Uo. Internal PD is in general dependent on the applied voltage level and will increase with the increasing test voltage level. Therefore, the parameter of the measured PD amplitude at the maximum test voltage level 2 Uo is taken.
Cable age. By analysing the historical failure data of cables in service, it has been seen that the number of failures is higher on cables that are older in age. Therefore, the age is taken into account in the cable health index [
25,
26,
27]. The failures are especially seen on cables that are 30 years and older, especially over 40 years. Therefore, cables with this high age get a poor or very poor indication. The results of electrical and physicochemical tests, carried out in laboratories of the Poznan University of Technology, were used to dimension this parameter. The samples of selected cable section were prepared by the Distribution System Operator DSO (ENERGA-OPERATOR SA) for both types of cables PILC and XLPE. The preparation of samples from the cut sections of the cable line is shown in
Figure 10.
The tested cable sections were subjected to laboratory tests, which included, in addition to tan delta and PD measurements, also microscopic examination of insulation structure, hardness of dielectrics, tensile strength, modulus of elasticity, elongation at break and oxygen index. The obtained results made it possible to evaluate the condition of the insulation system of the tested power cables.
Microscopic examination of the cables included the assessment of the insulation material of the PILC and XLPE cable with the use of the stereoscopic microscope with software for image recording and measurement. No delamination, inclusions and effects of treeing phenomena was found in all tested samples. Determination of hardness was done with the use of the durometer according to the Shore D method. The insulation hardness was determined along the cable on the outer and inner side of the insulation. Measurements of tensile strength and elongation at break were performed according to the ISO standard with the use of the machine that assures the initial stress, stretching and tensile speed for determining the Young’s modulus. For measurement of the oxygen index the minimum concertation for oxygen in a mixture of oxygen and nitrogen was determined to obtain the ignition effect.
The test results show good condition for the samples from various construction periods. This contributed to the decision to adopt a maximum limit value for the cable age of 40 years. The ranges of test results for XLPE cables are presented in
Table 1 (green colour—positive).
- 6.
Electrical failure history. By analysing historical data cable failures in the operation, it was found that the number of failures was higher in older cables. Therefore, in the cable health index, age was taken into account.
- 7.
Tan delta at VLF. Since 2019 tan delta measurements with VLF were performed on mainly the PILC cable lines. The tan delta was measured at three voltage levels: Uo, 1.5 Uo and 2 Uo. Additional difference of the tan delta value measured at Uo and 2 Uo was taken into account. These four values were separately evaluated. The sum was taken of the individual parameters.
The determined boundary parameters for the above components were combined to get the cable health index. This was done by summing up the condition numbers that were obtained. This was done by adding up the resulting state numbers. The total sum obtained was taken to a 5-point scale from very poor (red) to very good (green). The value ranges are shown in
Table 2. The table shows two results, one with the values of all seven parameters, one for the case where tan delta measurements were not made, which is the case for measurements performed a year ago or for cable lines on more than one cable section.
Based on these classes the appropriate action can be defined:
Very good (no action): Cable is in an overall good condition.
Good (monitoring): Cable is in a good condition with some minor deviations.
Moderate (investigation): There are some signs of cable insulation degradation; it is recommended to study the cause of this and monitor the condition.
Poor (action required): The cable is degraded; the cable has a high risk of failure; it is recommended to plan a replacement of the cable line or part of it.
Very poor (immediate action): The cable is very heavily degraded; the risk of failure is very high; it is recommended to plan replacement of the cable circuit or its part in the nearest future.
4. Discussion and Conclusions
The electrical and chemical measurements were done to obtain more precise information on the state of tested cables’ insulation. In addition to PD and tan delta investigations, such chemical and mechanical parameter measurements were made like: microscopic observation, material composition by infrared (IR) spectroscopy, differential scanning calorimetry, degree of crystallinity and cross-linking of XLPE insulation, microhardness, oxygen index, tensile strength, elongation at break and modulus of elasticity.
The results of the first stage of research work showed the key relationships between the data obtained from diagnostic measurements, technical data and the risk of failure of PILC cables. This became the basis for raising funds for another large scope of field research aimed at defining the health index (HI) for PILC and XLPE cables. At this stage, within the project, the planned goal was achieved and HI was defined.
Two key elements were achieved in the realised project: HI was developed and a digital database for the calculation of HI was built.
The key stage currently being implemented is the construction of an IT system that will support the management of the MV cable network using the achievements of the described research.
The IT system SORAL will be an expertise-based tool leading to the change in the strategy of the MV cable network management. The currently applied corrective maintenance (CM) strategy will be replaced by the condition based maintenance (CBM) one, based on the preventive activities related to the MV cable lines technical conditions. Due to the system, the preventive activities limiting the failure number become possible. The activities will focus on the replacement of the network elements of the highest failure risk. The MV cable lines replacement can be planned referring to the analysis of the failure before the failure occurs. The replacement works can be limited to the sections in bad technical conditions and not touch the cable line as a whole. The knowledge about the cable condition enables one to anticipate the future cable lifetime. In the urban area, if the need for a cable replacement can be planned in the indicated time, the modernisation works can be correlated with the works in other domains to costs limitation. The implementation of the project results allows one to improve the reliability and quality of electric energy supply and moreover reduce the average outage duration for the customers (SAIDI—system average interruption duration index) and number of interruptions (SAIFI—system average interruption frequency index).
The information technology (IT) system SORAL will be the main effect of the project. The system will be responsible for:
Input data preparation and preprocessing,
Acquisition of the measurement results and network model,
Computational model service,
Data analysis,
Geographical visualisation of measurements (GIS).
Due to the GIS system, the exchange of data will be carried out according to the common information model (CIM) standard whilst the dedicated interface will be ready to exchange data automatically between the SORAL system and diagnostic equipment, as shown in
Figure 11.
Despite the acquisition and presentation of the current data, the mapping of modifications introduced to the network will be possible with SORAL. Visualisation will comprise both the modifications in the network configuration and the locations where the cable sections are replaced. Thus, the network historical data and the current measuring data and results of computations done at different times correlated with the corresponding network status can be saved and accessed.
Finally, measuring data and information concerning network modifications will be aggregated in the system. Thus, the history of the measurements correlated with a corresponding network configuration can be built. The data will form a base for analysis and systematic upgrading of the models for estimation of the cable network elements condition.
The next advantage of the system is the opportunity to save the changes in the network; both those concerning technical parameters and those lied with its layout and reconfigurations. In effect, the network presentation not only in the current status but also at any chosen time in the past will be possible. Thus, not only the detailed analysis of the historical and current data but also the forecast and prediction of the future events become available.
An important element of the SORAL system is the computational model that will register the events in the network referring to the measurements (partial discharges and the dielectric loss factor). In the future, in addition to the data mentioned above, the environmental factors (temperature, soil type or soil PH) will be considered.
Due to such a set of data, a normalised health index algorithm for individual elements of the cable lines will be implemented and the risk of failure related to the insulation’s condition could be determined.
Author Contributions
Conceptualisation, S.N., A.R. and K.S.; methodology, K.S., S.N. and A.R.; validation, K.S., A.R. and S.N.; formal analysis, K.S., A.R. and S.N.; investigation, S.N., K.S. and A.R.; resources, K.S., A.R. and S.N.; data curation, K.S., A.R. and S.N.; writing—original draft preparation, S.N., A.R. and K.S.; writing—review and editing, A.R., S.N. and K.S.; visualisation, S.N.; supervision, A.R. and K.S.; project administration, S.N.; funding acquisition, S.N. All authors have read and agreed to the published version of the manuscript.
Funding
This research was partially funded by Polish National Centre for Research and Development, application POIR.01.02.00-00-0250/17 and Research Activity of Poznan University of Technology 0711/SBAD/4514.
Institutional Review Board Statement
Not applicable.
Informed Consent Statement
Not applicable.
Data Availability Statement
Data are contained within the paper.
Acknowledgments
Paper prepared in the framework of the project: “SORAL–system for condition monitoring and failure risk assessment of MV cable lines based on off-line diagnostic methods”.
Conflicts of Interest
The authors declare no conflict of interest.
References
- Noske, S.; Rakowska, A.; Siodla, K. Investigation of MV Power Cable Lines Using DAC Method for Assessment of the Technical Conditions of the Lines. In Proceedings of the ICHVE 2018, Athens, Greece, 10–13 September 2018; p. P-TM-10. [Google Scholar]
- Noske, S.; Rakowska, A. Off-line partial discharge measurements as a new data source about the technical condition of MV cables. In Proceedings of the ICHVE 2014, Poznan, Poland, 8–11 September 2014. [Google Scholar]
- Noske, S.; Rakowska, A. Partial discharge measurements as a source of information about the technical condition of PILC insulated MV cables. In Proceedings of the CIRED 2013, Stockholm, Sweden, 10–13 June 2013. [Google Scholar]
- Noske, S.; Rakowska, A. Application of diagnostics based on partial discharge measurements to assess the technical condition of PILC insulated MV cables. In Proceedings of the CIGRE International Conference on Electricity Distribution, Paris, France, 26–31 August 2012. [Google Scholar]
- Mampaey, B.; Lucignano, T.; Ahern, C.; Ainsley, A.; Bochenski, B.; Cabau, M.; Charvet, J.; Donoso, G.; Fossi, A.; Goto, Y.; et al. Maintenance of HV Cable Systems; CIGRE BT No 825; CIGRE: Paris, France, 2021. [Google Scholar]
- Gulski, E.; Rakowska, A.; Siodla, K.; Jongen, R.; Minassian, R.; Cichecki, P.; Parciak, J.; Smit, J. On-Site Testing and Diagnosis of Transmission Power Cables up to 230 kV Using Damped AC Voltages. IEEE Electr. Insul. Mag. 2014, 30, 27–38. [Google Scholar] [CrossRef]
- Noske, S.; Rakowska, A.; Siodla, K. Measurements of partial discharges as source of management knowledge improvement of the power cable network. Prz. Elektrotechniczny Electr. Rev. 2008, 84, 12–15. [Google Scholar]
- Götz, D.; Petzold, F.; Putter, H.; Markalous, S.; Stephan, M.; Oetjen, H. Innovative testing and diagnostic system for medium voltage—Innovative testing and diagnostic system for medium voltage. In Proceedings of the IEEE PES Transmission and Distribution Conference and Exposition, Chicago, IL, USA, 14–16 April 2014; p. 14TD0353. [Google Scholar]
- Zhan, L.; Huang, T. Study of Recognition and Location of Partial Discharges in XLPE Cable under Damped AC Voltage. In Proceedings of the 48 CIGRE Session, Paris, France, 24 August–3 September 2020; p. B1-213. [Google Scholar]
- Nothinger, P.; Stancu, C.; Dumitran, L.; Nothinger, P., Jr.; Rakowska, A.; Siodla, K. Influence of the ageing state of insulation systems on absorption/resorption currents. Rev. Roum. Sci. Tech. Rom. Acad. Sci. 2008, 53, 163–177. [Google Scholar]
- Gulski, E.; Chojnowski, P.; Rakowska, A.; Siodla, K. Importance of sensitive on-site testing and diagnosis of transmission power cables. Prz. Elektrotechniczny Electr. Rev. 2009, 2, 171–176. [Google Scholar]
- Polak, F.; Sikorski, W.; Siodla, K. Location of partial discharges sources using sensor arrays, Proc. of International Conference on High Voltage Engineering and Application. In Proceedings of the ICHVE 2014, Poznan, Poland, 8–11 September 2014; p. P-1-7. [Google Scholar]
- Gulski, E.; Rakowska, A.; Siodla, K.; Chojnowski, P. On-site testing and diagnosis of transmission power cables. Prz. Elektrotechniczny Electr. Rev. 2009, 4, 195–200. [Google Scholar]
- Wheatland, R.; Lee, D.C. Condition Assessment of Aged Medium Voltage Network Cables. In Proceedings of the 10th International Conference on Insulated Cables JICABLE 2019, Versailles, France, 23–27 June 2019; p. D9.1. [Google Scholar]
- Aizenberg, I.; Belardi, R.; Bindi, M.; Grasso, F.; Manetti, S.; Luchetta, A.; Piccirilli, M.C. Failure Prevention and Malfunction Localization in Underground Medium Voltage Cables. Energies 2021, 14, 85. [Google Scholar] [CrossRef]
- Neier, T.; Knauel, J.; Bawart, M.; Kim, S.-M. A new approach for evaluation of cable systems and estimation of remaining life time of MV underground power cables. In Proceedings of the 10th International Conference on Insulated Cables JICABLE 2019, Versailles, France, 23–27 June 2019; p. C1.2. [Google Scholar]
- Neier, T.; Knauel, J.; Bawart, M.; Atipov, D.; Kim, S.-M. A statistical method for statistical appraisal of the power cable conditions based on the TD and PD diagnostics result. In Proceedings of the E3S Web of Conferences, Kazan, Russia, 18–20 September 2019; p. 02014. [Google Scholar]
- Bohme, F.; Pietsch, R.; Kaltenborn, U.; Hensel, M. Cable Fault Location in High Voltage Cables—A new Solution. In Proceedings of the 2019 IEEE PES GTD Grand International Conference and Exposition Asia (GTD Asia), Bang Kong, Thailand, 19–23 March 2019; Available online: https://ieeexplore.ieee.org/document/8715980 (accessed on 17 February 2021). [CrossRef]
- Smit, J.; Van Riet, M.; Staarink, B. Non-destructive after laying test with PD localization. In Proceedings of the 10th International Conference on Insulated Cables, JICABLE 2019, Versailles, France, 23–27 June 2019; p. D3.4. [Google Scholar]
- Boone, W.; Antic, J.; Christensen, P.; Donaghy, R.; Germain, S.; Hvidsten, S.; Mirebeau, P.; Ombello, F.; Parpal, J.-L.; Rakowska, A.; et al. Remaining Life Management of Existing Ac Underground Lines; CIGRE TB No 358; CIGRE: Paris, France, 2008. [Google Scholar]
- Hongyan, C.; Kai, X.L.; Lip, C.M.; Lim, L.K. Condition Monitoring of Distribution Cables using VLF Diagnostic Test with Tangent Delta, Time Domain Reflectometry and Partial Discharge Measurements. In Proceedings of the 21st Conference of the Electric Power Supply Industry, Bangkok, Thailand, 23–27 October 2016. [Google Scholar]
- Bawart, M.; Ferrer, C.; Gamez, J.K.; Villalonge, A.; Ferreres, J.L. Improving Cable System Reliability with Monitored Withstand Diagnostics—Featuring High Efficiency at Reduced Test Time. In Proceedings of the 9th International Conference on Insulated Cables, JICABLE 2015, Versailles, France, 21–25 June 2015; p. C2.3. [Google Scholar]
- IEEE 400.2-2013; Guide for Field Testing of Shielded Power Cables Systems Using Very Low Frequency (VLF) (Less Than 1 Hz); IEEE: Piscataway, NJ, USA, 2013.
- IEEE 400.4-2015; Guide for Field Testing of Shielded Power Cable Systems Rated 5 kV and Above with Damped Alternating Current Voltage (DAC); IEEE: Piscataway, NJ, USA, 2015.
- Dorison, E.; Lesur, F.; Meurice, D.; Roinel, G. Health Index. In Proceedings of the JICABLE 2007, Versailles, France, 24–28 June 2007; p. B.1.4. [Google Scholar]
- Monatanari, G.C.; Seri, P.; Hebner, R.E. A scheme for the Health Index and residual life of cables based on measurement and monitoring of diagnostic quantities. In Proceedings of the 2018 IEEE Power and Energy Society General Meeting PESGM, Portland, OR, USA, 5–9 August 2018. [Google Scholar]
- Aizpurua, J.I.; Stewart, B.; McArthur, S.D.J.; Jajware, N.; Kearns, M. Towards a hybrid power cable health index for medium voltage power cable condition monitoring. In Proceedings of the 37th IEEE Electrical Insulation Conference, Calgary, AB, Canada, 16–19 June 2019. [Google Scholar]
- Meijer, S.; Van Der Wielen, P.; Vermeer, M.; Wetzer, J.; De Haan, E. Underground Power Cable Health Indexing and Risk Management. In Proceedings of the 9th International Conference on Insulated Power Cables JICABLE 2015, Versailles, France, 21–25 June 2015; p. C2.5. [Google Scholar]
- Hampton, N.; Perkel, J.; Williams, D. Asset Management of MV Cables using Data Driven Health Indices for Water Treeing. In Proceedings of the 10th International Conference on Insulated Power Cables JICABLE 2019, Versailles, France, 23–27 June 2019; p. D10-1. [Google Scholar]
- Noske, S.; Zasada-Chruscinska, K.; Grzelka, S.; Kolodziejczyk, K.; Grenda, W. SORAL—System for condition monitoring and failure risk assessment of MV cable lines based on off-line diagnostic methods. In Proceedings of the CIRED 2019, Madrid, Spain, 3–6 June 2019. [Google Scholar]
| Publisher’s Note: MDPI stays neutral with regard to jurisdictional claims in published maps and institutional affiliations. |
© 2021 by the authors. Licensee MDPI, Basel, Switzerland. This article is an open access article distributed under the terms and conditions of the Creative Commons Attribution (CC BY) license (https://creativecommons.org/licenses/by/4.0/).


