1. Introduction
The evolvement of alternative energy technologies is crucial for sustainable development [
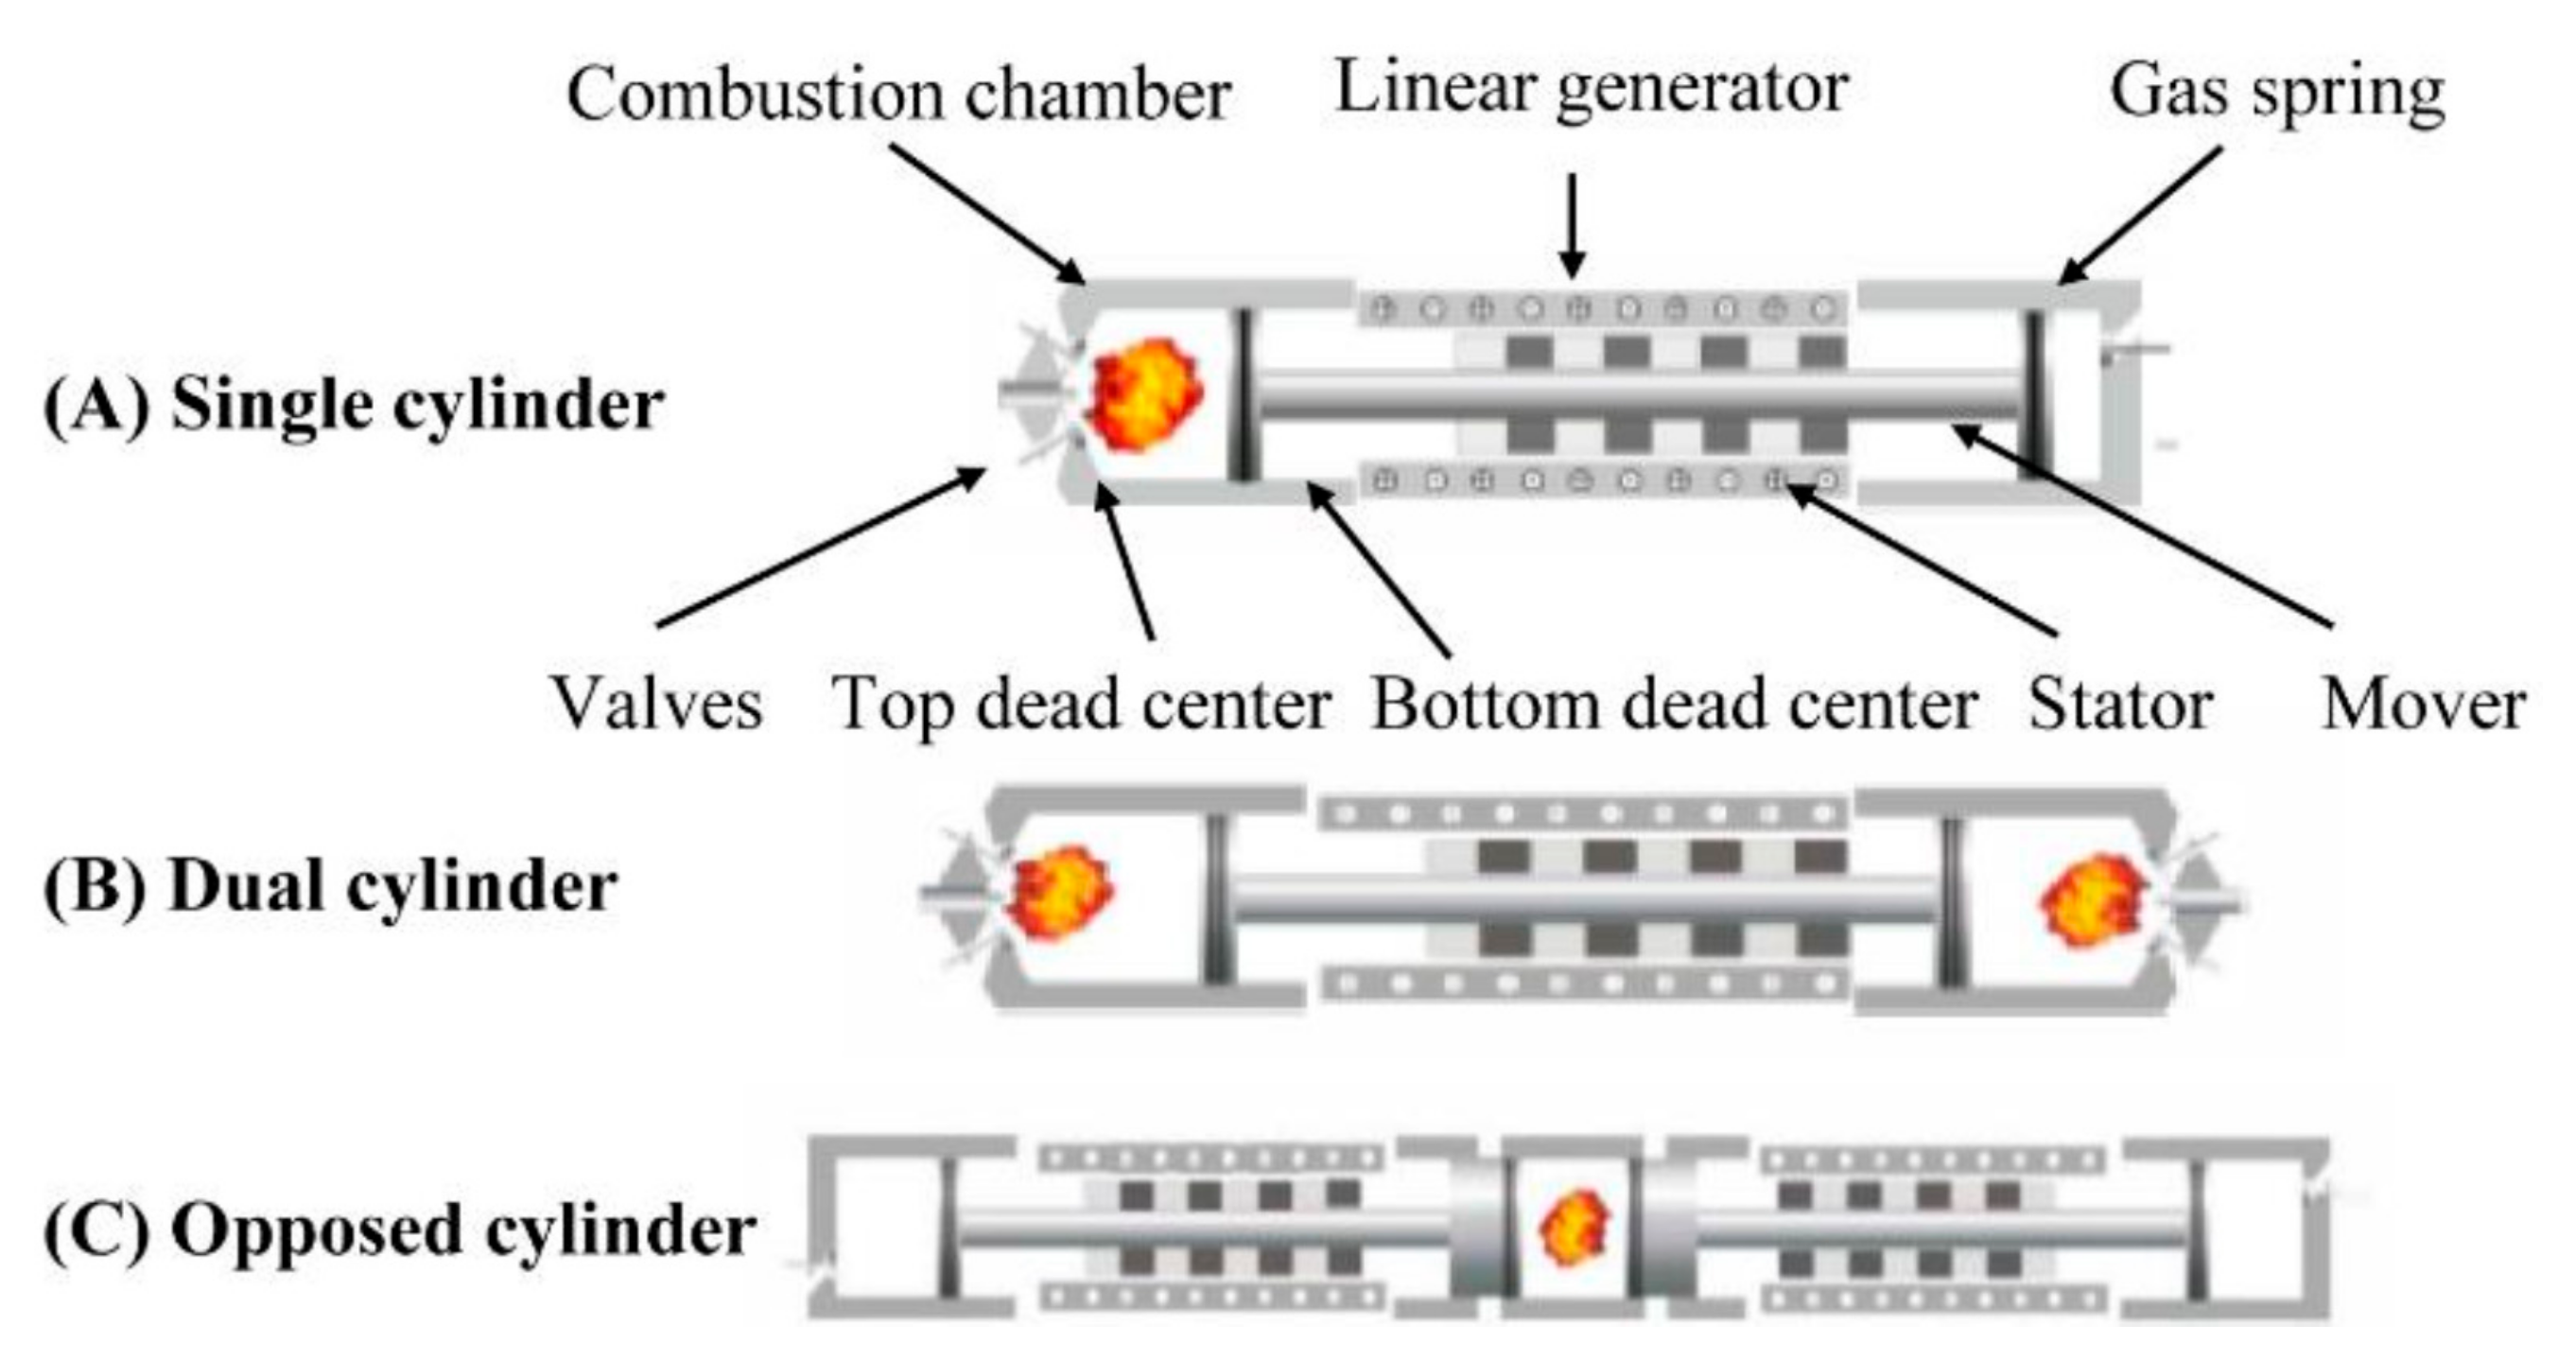
1]. The FPLG is a novel energy converter containing one moveable assembly of the piston(s) linked to a shaft. It generates electrical energy from the linear movement of that assembly (
Figure 1). It has no rotating components like a crankshaft or connecting rod. This results in the reduction of the frictional effects that still exist in the convention internal combustion engine (ICE). Removing the crank-slider mechanism improves mechanical and thermal performance, results in greater power-to-weight ratio, small size and low mass, and less cost for maintenance, and the variable compression ratio makes it suitable to operate on different fuels. This gives rise to its use for the generation of electrical energy in hybrid electric vehicles and portable power-related applications [
2,
3,
4,
5,
6].
The motion of the piston is determined by the crank-slider mechanism in a traditional ICE, which results in fixed endpoints of the piston. Because of the mechanical flywheel, irregularities or variations in the combustion process are greatly reduced. This is due to the feature of storing kinetic energy by mechanical flywheel. It helps to avoid engine misfires and combustion energy variations. In the FPLG, however, the ICE piston is not supported by a mechanical flywheel, which results in instability in the steady-state operation and system failure due to highly varying combustion pressures, including engine misfire [
3,
5,
9,
10,
11]
Previous work by the same authors showed that various values of electrical load current result in different endpoint displacements [
12]. Higher current drawn from the load results in a higher force of braking on the piston assembly, leading to a shorter endpoint displacement. However, simulation was performed from combustion (CC) to bounce (BC) for a single stroke [
13]. In this work, further development of the FPLG simulation model was implemented and several areas of analysis were performed, as listed below:
Full-cycle operation of the FPLG;
No-load operation: effects of piston area, crevice volume and combustion profile on the bounce chamber pressure, piston motion profile and endpoint displacements;
Operation with electrical load: analysis of steady-state operation for multiple load currents and combustion pressure, and finally;
Impact of combustion variance (COV) on a steady-state operation with fixed electrical load.
2. Modeling and Simulation of the FPLG
The single piston configuration of the FPLG was investigated with the combustion chamber on the left and bounce chamber on the right. The linear electric machine (LEM) assembled in between was stationary coil (iron cored) and moving magnet category [
14]. When the FPLG is in steady-state generation mode and the piston is moving from CC to BC, the forces experienced by the piston translator are combustion force Fcomb, compression and expansion forces Fcomp-exp, friction force Ffric, magnetic cogging force Fcog, and electrical braking force Fbraking, which is the result of current drawn from the system [
15].
The dynamic equation is written as [
16,
17]
The free body diagram for the system along with all forces acting on it are shown in
Figure 2. Compression–expansion forces act on the air-bounce chamber. Cogging force (depending on position) arises due to the attraction between the iron core cored stator and permanent magnet (PM) of the translator. This cogging force supports or opposes the piston motion, depending on its position along displacement [
5].
Combustion force on the CC arises due to healthy combustion during steady-state generation mode. When the load relates to the system, it tries to generate a braking force that slows down the piston motion. This braking force depends on the current drawn from the system. According to the Lorentz force law, this electrical braking force is given as [
13]
This force is depends on the amount of current drawn and
Kϕ (
x), which is the spatial flux distribution of the LEM based on displacement derived from Faraday’s law of electromagnetic induction, which is given by [
16,
18]
where
is a spatial flux distribution function of the FPLG. It is based on design parameters of the system such as the iron-cored stator, the PM’s dimension, flux distribution, arrangement of the PM, material of the core [
11,
16]. If resistive load is connected, the current is given by Ohm’s law as
Substituting Equation (5) into Equation (6), we get
Combining Equations (2) and (7), we obtain
Equation (10) shows that electrical braking force depends on flux profile, velocity and load connected.
This paper presents the modeling and optimization of the complete electromechanical system of the FPLG on MATLAB/Simulink. Initially the model was tested for full-cycle operation with and without load by varying structural parameters and combustion factor (CF). We noted that there was some unrealistic behavior in the piston trajectory toward the CC. After improving the model and introducing some natural combustion variations, we noted that the system was behaving naturally. The P-d diagram resembled the experimental results.
The combustion model is made up of a fixed pressure vs. displacement profile, which was originally experimentally obtained. It was improved to achieve the pressure-displacement profile for free-piston combustion. However, the shape will always be the same and the model is basically a fixed pressure profile. The program was modeled for combustion to occur on the left side while the bounce chamber was on the right side.
3. Full-Cycle Operation of the FPLG
To achieve bi-directional piston motion after the initial cycle of combustion and rebound strokes, additional coding was added to the simulation model in Simulink: a switch was implemented which selects between the output of the compression–expansion model and output of the combustion profile model. When the piston reaches the end of its compression stroke in the combustion chamber and starts to change direction, it will exhibit positive velocity, which causes the switch to select the combustion profile model as the output pressure.
This process is repeated every cycle: in the combustion chamber, while the piston is moving with negative velocity (right to left), the switch allows the compression–expansion model to be active and to exert pressure on the piston. When the piston’s velocity starts to become positive (left to right), the switch will activate the combustion profile model so that the combustion process can take place, and the FPLG operates with cyclic motion.
The output of the combustion profile is multiplied by a constant number, referred to as the combustion multiplier (CF), before it is passed on by the selector switch as output pressure. This CF is implemented to enable variation of the combustion magnitude by simple upscaling or downscaling of the nominal combustion profile in the look-up table, to emulate combustion variations in actual operation.
4. No-Load Operation: Variation of Structural Parameter and Combustion Factor (CF)
The present FPLG model was adapted from a previous model that consisted of dual combustion chambers (engine cylinders) of equal size (stroke and bore). The present system, however, is a single-side combustion chamber (CC) with an air-bounce chamber (BC) to serve as a rebound device on the opposite side. Since energy is required to compress the bounce chamber,
for the rebound, the process is directly proportionate to the piston area A and to the displacement x, as shown in Equation (10) [
6]:
Regarding piston area and BC cylinder size, for a certain amount of combustion energy from the CC, if the BC diameter is larger, then the piston travel length will be less since it is directly related to displaced volume in the BC side. A larger diameter means the resultant displacement or stroke will be less. If the diameter is smaller, then the stroke will be longer to give equal volume. This is, in fact, a common design practice for single-engine-cylinder FPLGs: to have the bounce chamber’s diameter much larger than the combustion chamber, to counteract the large combustion force [
2,
19,
20,
21]
Thus, several simulation runs at no-load were carried out with a larger piston area for the BC to verify the expected result of shorter displacement on the BC side.
Figure 3 and
Figure 4 show displacement vs. time and velocity graphs. It is indicated in the graph that the shorter displacement endpoints and misfire result in system stoppage after several times. However, as higher combustion pressure is provided (higher CF value), the piston seems to hit on the cylinder head of the BC. If there is a finite amount of gas in the BC cylinder, however, it should not be possible to compress it to zero volume even with a crevice volume, but this happens due to an excess amount of combustion energies arising because of the high combustion factor (CF) value. The reason for this is the blow-by function. These incidences are shown in the graph in
Figure 4.
The reason for this phenomenon is the existence of crevice volume in the bounce chamber, a common structural feature of an engine cylinder, from the original simulation model for a dual-sided FPLG [
22]. In the present research, a crevice volume is no longer required as there is no combustion taking place in the BC. Because of the crevice volume’s presence, the piston will behave as if to enter the volume provided by the crevice, to continue to build on the pressure and force for the rebound process. This results in the apparent collision with the BC’s head since the absolute maximum displacement does not allow the piston to go further into the BC.
To remove this unacceptable behavior, the crevice volume was removed from the simulation model on the BC side. Maintaining equal piston area (and thus cylinder diameter) for both BC and CC, additional simulations showed that, no matter how high the combustion pressure coming from the CC side, the piston on the BC side will never hit the head. However, the resultant compression pressure in the BC will get extremely high to counteract the high combustion pressure from the CC. In the future, further refinement will be made to the simulation model to enlarge the piston area/cylinder diameter of the BC, to reduce this compression pressure to more realistic levels.
Continuing with no-load operation, without BC crevice volume and with equal piston areas for both CC and BC, graphs of pressure vs. displacement for both CC and BC were generated and observed. Simulation runs were carried out with different combustion factor (CF) values for analysis of pressures, displacement endpoints and system behavior.
Figure 5 shows pressure vs. displacement curves for one complete engine cycle: the combustion chamber (CC) profile is on the left and bounce chamber (BC) profile on the right. The combustion factor (CF) value was set to 0.30. Due to the weak combustion force, the return stroke’s endpoint displacement in the combustion chamber (CC) was not deep enough to achieve high combustion pressure in the subsequent cycles. This resulted in piston oscillation with decreasing endpoints such that operation eventually ceased.
Increasing CF to 0.38 resulted in pressure profiles as shown in
Figure 6. Endpoint displacement in CC was observed to be further inside, but the combustion was still not strong enough to achieve the required compression ratio for sustained operation. It also resulted in oscillating the piston assembly with shorter displacement each time, before the engine eventually stopped.
Increasing the CF further to 0.50, the endpoint displacements in both CC and BC continued to go deeper inside, as can be seen in
Figure 7. It was observed that the compression pressures of the return strokes in CC were so high that the compression profiles intersected and even increased beyond the combustion profiles. The piston was shown to be able to attain the required combustion and compression pressures for continuous and sustained operation. At this value of CF, energy from combustion was enough to provide for the rebound process in the BC, the compression process in the CC and for frictional and system losses, such that continuous operation was achieved.
5. Operation with Electrical Load and Different Fixed Combustion Factors (CFs)
With electrical load connected, and root-mean-square (rms) current of about 8 amps generated by the FPLG, pressure vs. displacement curves for both CC and BC were obtained from the Simulink program as shown in
Figure 8,
Figure 9 and
Figure 10. The graphs represent combustion factor values of 0.5, 1 and 2, respectively. As can be observed in the simulation graphs, the system was very sensitive to changes in parameters.
Previously, without load, by increasing combustion factor, the piston tried to go further inside the CC before it started the next cycle, but with load, it hardly managed to go beyond −30 mm to return for the next cycle. However, with the increase in combustion factor, combustion pressure increased accordingly. If we want to draw more electrical energy, we need to provide more combustion energy to ensure continuous, steady-state operation.
At any steady-state operating point, if the electrical load increases even very slightly, the piston operation will eventually cease after several cycles. To compensate, the combustion factor needs to be increased. Similarly, at any fixed electrical load, if the combustion factor is decreased even slightly, the operation will also eventually die. To compensate for this, the electrical load needs to be reduced.
6. Improvements to FPLG Simulation Model
In
Figure 5 and
Figure 6 above, it is noted that due to weak combustion force, the return stroke’s displacement endpoint in the CC was not deep enough to achieve high compression pressure for the subsequent cycle; in fact, the piston did not even reach the minimum displacement for ignition to occur. It can be seen from the graphs, however, that the pressure profile still jumped up from the compression to the combustion profile. This was due to the condition being set for “combustion to occur”—which is whenever the piston starts to switch velocity from negative to positive, regardless of displacement or pressure. This behavior is surely not acceptable.
In
Figure 7, due to healthy combustion (CF = 0.5), the endpoint displacements in both CC and BC were much deeper inside. At this value of CF, continuous operation was achieved but it was also observed that the compression pressure of the return strokes in the CC were so high that they intersected and increased beyond the combustion pressure profile before finally switching velocity—leading to the dip from compression to combustion profile, which is another unrealistic behavior.
To rectify these unrealistic behaviors,
Figure 11 shows the flow chart indicating the flow of the corrected FPLG model. Firstly, during the return stroke in the CC, if the minimum displacement of −30 mm is not reached, combustion cannot occur, and the piston will just take on the expansion pressure profile when it switches direction. Secondly, if the piston does reach minimum displacement and even compresses further inside the CC, such that compression pressure “tries” to increase higher than combustion profile, the piston will stop at that point, switch direction, and start to take on the combustion profile for the subsequent cycle. If the piston does not reach the minimum displacement of −30 mm, it will continue to take on the compression–expansion profile. When the piston is in the CC during the return stroke (negative velocity), either the velocity starts to become positive, or the compression pressure starts to become equal to or higher than combustion pressure (so that even if the piston is not yet changing its direction of motion, pressure should switch to the combustion profile). The first condition is pre-existing from the previous model—switching to combustion profile whenever piston velocity becomes positive—while the second condition is to avoid the unrealistic case of pressure shifting down from the compression–expansion profile to the combustion profile every time compression starts to become equal or more than combustion, as seen in
Figure 9.
The above conditions will execute only when the first stroke is completed and, in fact, the piston is already well on the return stroke. A counter-function is implemented to count the number of times the piston has crossed the x = 20 mm position. Once the counter reads 1 or larger (implying the first stroke is completed), the program should always implement the conditions described above. Before the first hit crossing, the pressure profile in the CC should result from the combustion model.
Simulation runs were carried out with the improved FPLG model.
Figure 12 shows the resultant graphs of pressure vs. displacement for different CF values (to compare with
Figure 5,
Figure 6 and
Figure 7). It can be observed in
Figure 12a that if piston displacement did not reach −30 mm when it switched direction, combustion did not occur, and the pressure took on the expansion pressure profile rather than combustion. Piston motion ceased eventually due to combustion occurring only once.
With the higher CF in
Figure 12b, the piston could reach −30 mm in the return stroke, resulting in healthy combustion for the next cycle, but was unable to sustain operation. Further increase of the CF to 0.50 resulted in healthy combustion and sustained operation, just as observed in
Figure 12c, but without the presence of intersection between compression and combustion profiles (compression pressure profile did not increase beyond combustion).
When the electrical load was connected, a CF of 0.50 was not enough to achieve combustion in the next cycle (
Figure 13a). Increasing the CF to 1 resulted in sustained operation with healthy combustion with higher pressures in both the CC and BC. When the CF value was further increased to 2, sustained operation was achieved, but with increasingly deeper displacements in the CC in subsequent cycles, indicating excessive energy and an excessively large CF value (
Figure 13b,c).
It was observed that the problem regarding the minimum condition of displacement for combustion to occur and compression did not exceed beyond combustion. It was noted that in each cycle, while going from combustion to bounce chamber, the piston moved from combustion to compression after crossing −30 mm. This was due to the condition set for combustion to occur only when displacement is less than or equal to −30 mm.
To rectify all problems, further improvement was made to the final complete and comprehensive model not only to avoid this problem but also to provide natural combustion variations.
7. Steady-State Operation with Electrical Load and Cyclic Variation of the Combustion Factor (CF)
The final objective of this research was to study the cyclic operation of the FPLG where combustion pressures vary from cycle to cycle as a natural phenomenon—in normal operation, cyclic variation in combustion pressures occur to varying degrees, referred to as the coefficient of variation (COV). Thus, it was very critical that the final simulation model of the FPLG could exhibit this variance in combustion. In the present work, this was achieved by introducing randomness to the value of the combustion factor (CF). For every cycle, a different value for the CF will apply, selected by randomly choosing the CF value within a certain range, which reflects the combustion variation coefficient. The Simulink code shown in
Figure 14 was developed to achieve this objective.
For every cycle, a new value for the CF is introduced after the combustion pressure is reduced to ambient pressure (after the exhaust port is completely opened) so that the combustion stroke should already be completed before the CF is changed to a different value. To ensure this, the CF value is changed at a certain point when the piston has bounced off from the BC for its return stroke toward the CC (right to left motion), which is clearly when the combustion force is no longer acting in the system, but well before the next combustion event takes place. Thus, the program detects both the direction of motion and crossing of the specific displacement (x = 20 mm).
If the CF value is low for one cycle, which means low combustion pressure and energy input to the system, and if in the next cycle the CF value is higher, the system will not die out after a single cycle due to low combustion energy. In contrast, if the combustion energy is very high in one cycle, it does not necessarily lead to continuously increasing amplitude of piston motion. This uncertainty and randomness in combustion energy is a natural phenomenon in internal combustion engine (ICE) operation.
In a conventional crank-slider ICE, the engine’s flywheel plays a very critical role to smooth out the effects of varying combustion energies. Inherently, due to its large moment of inertia, the flywheel serves as a mechanical power buffer or energy storage device for the ICE. Unfortunately, there is no such mechanical device or inherent character of a free-piston linear engine that naturally replaces the function of the flywheel in a conventional ICE. Thus, it was the objective of this research to study the feasibility of controlling the output load current, to counteract the variation in combustion energy.
With the code for cyclic combustion variation shown in
Figure 14 added in the FPLG simulation program, simulation runs were carried out with a nominal CF value of 0.94 and a coefficient of variation (COV) of 10%.
Figure 15 shows the simulation results. As can be seen in the graphs, whenever there was low combustion energy (due to low CF), the endpoint displacement in the BC was lower than the previous cycle, and vice versa. In the beginning, for many cycles even low combustion energy did not lead to system stoppage, due to higher combustion pressure in the subsequent cycle. After t = 0.58 s, though, it could be seen that the CF was low for three consecutive cycles, and finally the minimum amplitude of −30 mm could no longer be achieved, and thus no combustion could occur, which finally caused the operation to cease.
To avoid engine stoppage and achieve sustained operation in the event of successively low CF values, the research next investigated reduction of the output electrical load current, which would reduce the drain of energy from the system and thus allow for more mechanical energy for the operation to continue. Toward this objective, the electrical subsystem was further developed to include the converter block and the control block for automatic control of piston trajectory in the face of varying combustion pressures.
8. Final Improvements to the FPLG Model and Simulation with Different Combustion Variation (COV)
It was observed in the discussion and graphs above that the pressure profile exhibited unrealistic behavior and shape. This was due to the jump of the combustion profile to the compression profile when displacement reached −29 from left to right. The reason for this was already discussed in the above sections. Final improvements were made in the overall model to set realistic displacement conditions for sustained operation and cyclic combustion variations. An analysis of the system under different combustion variations and its effect on system stability was also done.
Figure 16 below shows the part of the program responsible for compression and combustion in specific regions of displacement. This prevents the piston trajectory from jumping to compression when crossing −30 mm displacement during each cycle (from left to right). These graphs were made when a load of around 8 amps was connected.
This condition was designed to make sure that in the region specified there is only compression–expansion. For the displacement below −30 mm, combustion will occur. The randomness shown in
Figure 14 for random cyclic combustion variation was introduced into the final simulation model.
Figure 17 below shows the three different graphs of CC pressure, velocity and emf vs. displacement. These graphs show cyclic combustion variations. These simulations represent sustained operation at around 8 amps load and at CF 0.94 with COV ±10%.
Figure 17a shows the comparison of simulation results for a pressure vs. displacement plot from the experimental results. The experimental profile for pressure vs. displacement was obtained from the LG test at the Center for Automotive Research and Electric Mobility (CAREM), UTP. In that configuration, a compressor was used to induce high-pressure air up to 8 bar, initiating the combustion to assist LG motion toward the end of the stroke [
23,
24], whereas in the current model an atmospheric pressure (1 bar) was applied. For this reason, the pressure profile showed a curvaceous shape more than the sharp ends that are usually expected for free-piston motion. Thus, a minute difference in both profiles was due to the fact that the fixed pressure vs. displacement profile was used, which was experimentally obtained to develop the combustion model. However, the shape will always be the same. So, for combustion model development, the mechanical model was basically a fixed pressure profile, which was obtained experimentally.
Similarly,
Figure 17b,c shows a displacement vs. velocity and an emf vs. displacement graph. Results showed a smaller value of velocity and emf compared to simulation results. This was related to losses due to leakage and throttling during the intake as well as friction for the experimental work [
24] due to high-pressured air toward the end of the stroke [
23].
In this work, it was important to be able to produce a difference in combustion energy from cycle to cycle. Thus, this was achieved solely by varying a multiplier, like a combustion factor, so that the effect of having combustion variance on generation operation could be observed, which was not simulated before. Thus, although the pressure profile will be the same in every cycle (since the profile was experimentally obtained and displacement-based), what was seen in the present simulation was variation in the pressure magnitude (not pressure profile).
Further investigations were carried out for different values of the CF at a COV of ±10% at a load of around 8 amps. This was to study the impact of combustion variations on displacement endpoints and pressure on both sides. Three cases for analysis were chosen based on CF values where different simulation runs were performed. It was observed that the system behaved naturally.
Results for CF and CC pressure vs. time, CF and CC displacement vs. time and CC pressure and BC displacement endpoints vs. time at CF 0.87 ± 10% are shown in
Figure 18. These graphs were plotted at CF 0.87 with COV ±10%.
In accordance with the discussion above, the graph in
Figure 18a shows CF values for each progressive CC pressure. It is obvious from the graph that the higher the CF value, the higher will be the pressure in the upcoming cycle. This is because each CF value was changed just before the event of combustion as per the program algorithm. It was noted that after two consecutive low values from around 0.06 to 0.10 s, there was a sudden fall again in the CF value. As a result, the system was unable to sustain its continuous operation, although after that the CF became high again. This resulted in a stoppage of the system. Due to high combustion pressure arising in the CC, displacement endpoints in the CC moved more deeply inside. This was a consequence of CF values that varied from high to low. This could not be sustained, however, because of two consecutive low values of the CC (
Figure 18b). This increase in the CC pressure caused more displacement endpoints in the BC side, resulting in high BC pressure as well, as shown in
Figure 18c.
Further investigation of the system was made for two more values of CF. This was to ensure the behavior of the system under different combustion conditions. The graphs in
Figure 19 and
Figure 20 also show that for each corresponding CF value, the CC pressure was high, resulting in the bounce chamber pressure also being very high. This resulted in more displacement endpoints of the combustion chamber and bounce chamber.
It can be seen in both figures that during last few cycles the system hardly managed to sustain itself because of the two consecutive low CF values. After this, the system could not have sustained itself even if the CF values were high. It was also observed that the number of cycles in each graph was higher than the previous one.
9. Conclusions
In the present work, the modeling and optimization of the electromechanical subsystem of an FPLG and full-cycle simulation runs of the FPLG were performed to carry out several areas of analysis. With no-load, simulation runs were performed with different fixed combustion pressures at CF values of 0.30, 0.38 and 0.50 to achieve continuous operation. It was observed that if the combustion pressure was below a minimum level, the system would cease after a few oscillations. Above the minimum value, piston endpoint displacements would move increasingly deeper into the BC and CC (oscillations will grow in amplitude) to show the unrealistic behavior of the system. With an electrical load of around 8 amps connected, higher combustion energies with CFs of 0.5, 1 and 2 were required to sustain operation as compared with CF values at no-load. Again, below minimum level, the system ceased after a few cycles and showed unrealistic behavior above that level for CFs of 1 and 2.
The FPLG Simulink model was improved to eliminate unrealistic system behaviors by implementing a minimum displacement of −30 mm for combustion and preventing compression pressure from increasing beyond the combustion profile or jumping to the combustion profile during the return stroke from left of right. The natural phenomenon of combustion variance was introduced with a combustion factor CF of 0.94 and coefficient of variation (COV) of 10% implemented in the program. This produced cyclic variation in combustion pressures, resulting in system stoppage due to consecutively low combustion energy in the last few cycles.
After final improvement of the FPLG simulation model to correct any deficiency, final simulation graphs of CC pressure vs. displacement, displacement vs. velocity and emf vs. displacement were obtained, compared and validated with experimental results. It was noted that the simulated FPLG system exhibited comparable behavior to the experimental profiles. Finally, three graphs of CF and CC pressure vs. time, CF and CC displacement vs. time and CC pressure and BC displacement vs. time were obtained for three different CF values of 0.87, 0.89 and 0.91, all subject to a COV of 10%. Results showed that in the earlier cycles, due to healthy combustion and a sufficiently high CF, operation was stable and the CC endpoint displacement could achieve the minimum value for combustion.
However, it was observed that consecutively low combustion pressures could cause the system to stop, not achieving minimum displacement. Under an otherwise reasonable 10% combustion variance, a linear engine-generator can cease operation after two consecutively low combustion values, due to absence of the moment of inertia and flywheel property of a rotating crank-slider system. This points to the necessity of implementing a control measure such as load current control to ensure sustained operation of the free-piston linear engine-generator.


