1. Introduction
The liberalisation of the electricity sector officially began at the European Union (EU) level with the first legislative Energy Package in 1996. The liberalisation of the electricity sector had started earlier in a number of pioneering countries such as Argentina, Chile, Norway, and the United Kingdom. There were many important reasons for liberalising the electricity sector [
1,
2,
3]. An overarching goal was the creation of long-term benefits for society and the need to bring an appropriate share of these benefits to consumers by placing companies under competitive pressure. Another driver of liberalisation was the reduction of the involvement of the State in the electricity sector. However, liberalisation did not always imply the privatisation of assets; counter examples include Norway, Sweden, New Zealand, and Australia [
2]. An important development was that competition in electricity wholesale markets was deemed workable due to progress in Combined Cycle Gas Turbines (CCGT) technologies, which significantly reduced the efficient scale of electricity generation. Radical reforms often involved the implementation of a set of changes. In that regard, the first European legislative Energy Package required Member States to unbundle the activities of formerly vertically integrated national monopolies. The second Energy Package of 2003 required each Member State to designate an independent regulator. Generally, vertical unbundling and the setting up of an independent regulator was insufficient for introducing competition into wholesale markets. Restructuring often also involved the horizontal splitting up of incumbent generation firms to allow market concentration to be reduced to theoretically and empirically competitive levels [
4]. Maintaining competitive markets requires that incentives for new entry are correct. In this review paper, we take stock of a selection of new entrants to EU electricity markets and provide a detailed description of the relevant European electricity market regulation.
We do not intend to provide an exhaustive historical account of new entrants in European electricity markets. Instead, we select four waves of new entrants that we deem important and exemplary in illustrating how new entrants pushed or are pushing for changes in electricity market design and regulation. These new players are generally believed to improve the sustainability of the electricity sector in environmental, social, or economic terms. First, there are utilities from abroad. The integration across geographical borders was deemed important for enhancing competition in formerly exclusively national electricity markets. Second, there are utility-scale renewables project developers. Climate targets have led to substantial public support for investments in renewable electricity generation since the early 2000s. The integration of renewables into electricity markets has brought new challenges and new opportunities. Third, there are asset-light software companies aggregating the assets of smaller consumers and producers. Digitalisation allowed for the emergence of aggregators which often started as intermediaries between balancing markets and players which can provide balancing services, but which are too small to participate directly in those markets. The flexibility marketed by aggregators is important to cost-efficiently integrate renewables. Fourth, there are communities. Currently, end-users of electricity can unite into different types of communities. At one extreme, manufacturers of smart devices enter the electricity markets via the creation of communities populated by their own technology adopters. At the other extreme, groups of non-professionals are contesting electricity markets by uniting and sourcing (part of) their electricity needs from jointly owned (often renewable) energy sources. In the middle, consumer communities are exchanging electricity via peer-to-peer exchanges. In addition to economic and environmental benefits, these different types of communities can also allow for social value creation [
5,
6]. With every new wave of entrants, we need to reconsider market rules because we learned that well-intentioned rules designed for certain types of market participants may (unintentionally) become obstacles for new entrants.
The main contribution of this paper is to take stock of what we have learned from this process. At the start of the liberalisation process the views of many was that we would deregulate or re-regulate the sector. The role of regulators would, it was believed, then be reduced, but this has not (yet) happened. Indeed, the role of regulators has grown, and they are also increasingly expected to act as dynamic regulators who continuously monitor the needs to change the detailed market rules.
The remainder of this paper has four sections that correspond to the four waves of new entrants. We end the paper with a conclusion.
2. New Entrants from Abroad
We divide this section into three parts. First, we describe the context and the need to integrate wholesale electricity markets across borders. Second, we discuss, in some detail, how electricity markets were gradually integrated. Third, we take stock of what has been achieved and look to the future.
2.1. Context and the Need to Integrate Wholesale Markets
Even after horizontal generation unbundling, national electricity markets often lacked a suitable market structure. Several benchmark reports published by the European Commission between 2001 and 2004 found that national energy markets did not become competitive at a sufficiently fast pace. Moreover, the implementation of the new competitive environment differed a great deal across Member States due to the large margins of choice they were granted in early legislation. Smaller Member States, in particular, struggled to introduce meaningful competition and to create liquid energy wholesale markets. Despite the legislative efforts of the first two Energy Packages (1996 and 2003), European energy markets saw wholesale energy prices go up, persisting entry barriers, and limited possibilities for customer choice in the early 2000s. This situation led the European Commission to open a sector inquiry into the functioning of the gas and electricity markets in the EU following Article 17 of Regulation (EC) No 1/2003.
The sector inquiry found that incumbents rarely entered other national markets as competitors, unless via mergers and acquisitions of foreign generator assets. Market integration, allowing for competition between generators located in different jurisdictions, was hampered by insufficient or unavailable cross-border capacity and different market designs [
7]. These findings confirmed what the Commission had already concluded in 2003, namely that “the entry of suppliers from other Member States is the only realistic way for competition to develop rapidly” [
8]. A regulatory gap for cross-border issues was identified, which urgently needed to be addressed. The major focus of early legislation was on setting the conditions and creating the institutions that were necessary for electricity markets to function [
9]. This included measures for enhancing coordination between national energy regulators and between national Transmission System Operators (TSOs), and for strengthening EU oversight for cross-border issues (cross-border cooperation among TSOs predated the creation of electricity markets, but came in the form of technical cooperation and mutual support to maintain system stability through interconnections in case of emergencies) [
9]. In addition, reserve sharing agreements were often in place. Another shortcoming at the time of the sector inquiry was that the Commission did not generally have the powers to set actions that would directly lead to changes in market structure at the national level. The distribution of competences changed with the Lisbon Treaty (2007) that explicitly conferred upon the EU a shared competence between the EU and the Member States in the field of energy, according to which Member States can act only if the EU does not or has chosen not to. Note that this is without prejudice to the Member States’ rights to define their own energy mix.
Eventually, a solution emerged: increase the geographical scope of the market to reduce the level of concentration and to enhance competition. This was first implemented for wholesale markets. The integration of balancing markets has always lagged behind.
2.2. The Gradual Integration of Wholesale Electricity Markets
The strategy of extending the geographical size of a market by increasing trade across borders brought several challenges with it. These can usefully be broken down into two. First, having enough cross-border transmission capacity in place; and second, efficiently allocating cross-border capacity to maximise competition.
2.2.1. Having Enough Cross-Border Capacity in Place
In 2002, the European Council set a 10% electricity interconnection target, which is defined as import capacity over installed generation capacity in a Member State. The delivery date of this target was eventually set for 2020. In 2014, twelve years later, the European Council endorsed the proposal by the European Commission to extend the target to 15% electricity interconnection by 2030, taking into account the cost aspects and the potential for commercial exchanges in the relevant regions. The adoption of Regulation (EU) No 347/2013 on guidelines for trans-European energy infrastructure (Trans-European Networks-Energy/TEN-E Regulation) was relevant in this regard. The main focus of the TEN-E Regulation was on accelerating the development of strategically important priority projects interconnecting energy networks across the EU, labelled Projects of Common Interest (PCIs). By obtaining PCI status PCIs could also have access to European public funding. While eight Member States have not met the 10% interconnection target for 2020 [
10], several crucial interconnectors have been built with the support of the TEN-E Regulation. By the end of 2019, nearly 40 PCIs were completed, of which seven benefitted from financial support. A total of €3.7 billion in financial support provided by early 2020 leveraged total investments of around €7.9 billion [
11].
2.2.2. Efficiently Allocating Cross-Border Capacity
Historically, the rights to trade across borders were granted to utilities that were often state-owned and vertically integrated. This was due to Power Purchase Agreements (PPAs) with neighbouring utilities that predated the creation of European markets. Such PPAs were sometimes preferred to authorising the construction of new domestic power plants. There were provisions for TSOs as early as the first electricity Directive 96/92/EC to provide non-discriminatory access to different network users. But these historical privileges were kept in place, in the form of long-term PPAs including transmission rights. This situation prevented the entry of new players in the markets. This led to a landmark court case (Case C-17/03, VEMW, APX en Eneco N.v. v. DTE), in which the European Court of Justice ruled that long-term pre-liberalisation transmission capacity reservations were generally not compatible with Community law [
12]. The top-left chart in
Figure 1 illustrates how cross-border transmission capacity was allocated in many different ways in the day-ahead timeframe in 2003, including non-market-based approaches such as priority lists and pro-rata allocation [
13].
Directive (EC) No 1228/2003 of the second Energy Package required the implementation of a market-based approach for the allocation of transmission rights. The implementation of market-based allocation methods included several steps from explicit auctions to implicit auctions [
12]. Progress for the day-ahead timeframe was already visible in 2007, as is shown in the top-right chart of
Figure 1 [
14]. Most transmission rights were allocated separately from energy trading via explicit auctions in which TSOs auctioned the transmission rights to the highest bidder. Coordination issues that arose from the need for traders to predict hourly price differences in different countries led to the gradual replacement of the explicit with the implicit allocation of transmission rights. Implicit allocation meant that the transmission rights were given to power exchanges which could integrate these rights into the clearing of the day-ahead auction. As such, the day-ahead auctions were coupled. Over the past 15 years, implicit allocation has evolved from regional initiatives such as market splitting in the Nordics, trilateral market coupling in Belgium, the Netherlands and France, and volume coupling between Denmark and Germany to today’s Single Day-Ahead Coupling (SDAC).
The SDAC emerged from the trilateral market coupling project and was first known as the Multi-Regional Coupling (MRC) that coupled day-ahead auctions in Belgium, Denmark, Estonia, Finland, France, Germany/Austria, Great Britain (GB), Latvia, Lithuania, Luxembourg, the Netherlands, Norway, Poland (via the SwePol Link), Sweden, Portugal, and Spain in 2014. In the same year, a second coupling project called 4M Market Coupling (4MMC) went live. 4MMC coupled the Czech Republic, Hungary, Romania, and Slovakia. With the adoption of the Commission Regulation (EU) 2015/1222 establishing a Guideline on Capacity Allocation and Congestion Management (CACM GL), the SDAC became binding for all EU Member States and the MRC project has since expanded to involve more countries. Brexit meant the exiting of EU-GB interconnectors and the GB bidding zones from the SDAC in January 2021. The current status of the SDAC is shown on the bottom-left chart in
Figure 1 [
15]. The last step, taken in June 2021, was to extend the geographical scope of the SDAC and to ultimately cover all the EU including the integration of Bulgaria into the MRC and the coupling of the 4MMC and the MRC projects. At the time of writing, only two more borders need to be integrated in SDAC as indicated in yellow in the bottom-left chart in
Figure 1. The adoption of the CACM GL also brought the binding implementation of market coupling in the intraday timeframe. The implementation of the Single Intraday Coupling (SIDC) project is carried out in successive waves as can be seen on the bottom-right chart in
Figure 1 [
16]. At the time of writing, the third, fourth, and fifth waves still need to be implemented.
2.3. Taking Stock and Outlook
At the time of writing, the SDAC covers 27 countries (all EU Member States, except Cyprus and Norway) with 200 M€ average daily value in matched trades [
17]. The SIDC project covers 22 countries, with three more waves of extensions planned for integrating Italy, Greece, and Slovakia and ultimately to cover all EU countries with the exception of Ireland, Cyprus, and Norway. Europe has been successful in creating the largest electricity market in the world by opening formerly national markets and breaking down borders. However, increasing market size creates new issues. Today, open issues in European electricity markets include increasing volumes of redispatch due to an outdated bidding zones configuration. Moreover, the market coupling algorithm EUPHEMIA is reaching its limits with the integration of more and more countries, power exchanges with their own products, and the target to reduce the market time unit from one hour to fifteen minutes.
Nevertheless, the integration of wholesale markets in Europe has led to significant monetary benefits, which can be partly attributed to an increase in competitive pressure from across borders. Market coupling has so far rendered a benefit of approximately €1 billion per year [
18]. Additional welfare benefits of more than €1.5 billion per year are expected from the implementation of market coupling in all (short-term) time frames across EU borders. A large share of the additional benefits is expected to come from the efficient integration of balancing markets [
19]. Indeed, the level of integration in that timeframe is still low compared to day-ahead and intraday markets, despite significant efforts having been made in the last years. Following provisions in the Commission Regulation (EU) 2017/2195 establishing a Guideline on Electricity Balancing (EB GL), European TSOs have started to set up European platforms for the exchange of balancing energy. Strong commitment and coordination among TSOs will be needed to ensure their effective and successful implementation.
3. Utility-Scale Renewables
In this section we discuss the second wave of new entrants in the form of utility-scale renewable energy developers. We divide the section into three parts. First, we describe the context and need to revise national market designs to accommodate the new entrants. Second, we discuss in more detail how product and market design was revised. Third, we take stock of what has been achieved and look to the future.
3.1. Context and the Need for a Revision of National Market Designs
The first few liberalisation steps had no or limited focus on Renewable Energy Sources (RES). According to Article 2(1) of Directive (EU) 2018/2001, renewable energy refers to energy from renewable non-fossil sources, namely wind energy, solar energy (both solar thermal and solar photovoltaic), geothermal energy, ambient energy, tide energy, wave and other ocean energy, hydropower, biomass, landfill gas, sewage treatment plant gas, and biogas. In this text, we focus on variable RES such as wind and solar energy. Directive 2001/77/EC was the first to set indicative national targets for the use of RES in the energy sector by 2010 and laid the legislative basis for RES support schemes in Europe. An evaluation report by the European Commission [
20] based on national progress reports revealed slower progress than expected in the pursuit of reaching the EU-wide indicative target of a 12% share of RES in gross domestic energy consumption by 2010 (This would have led to a share of only 18–19% of electricity production from RES for the EU-15 by 2010 as compared to the share of 22% targeted by the Directive. The 22% target was revised to 21% for the EU-25 following the accession of ten new Member States in 2004). Most Member States had implemented support systems to increase the share of electricity production from RES in the form of feed-in tariffs, quota obligations and/or green certificates. However, these financial support mechanisms were considered insufficient for the effective take-off of RES in the light of other persisting barriers. These barriers included: complex licensing procedures; lack of RES integration in planning; and a lack of transparency in grid connection procedures. Together with the increasing threat posed by climate change and the urgency to ensure supply security, these disappointing earlier RES policies led to the adoption of the 2009 EU Climate and Energy Package (also known as “2020 Package”). This included the renewable energy Directive 2009/28/EC. This Directive set the target of a 20% share of RES in the EU’s gross final energy consumption by 2020 and allocated binding and differentiated national targets to individual Member States.
From the outset the idea was to eventually integrate variable RES, such as wind and solar photovoltaic (PV) generation, into the electricity markets. However, to remain attractive for investors, RES were not directly exposed to the full force of markets in many Member States. Subsidy schemes limited the exposure of many RES to market prices, even though some were expected to sell their electricity on the wholesale market: e.g., under quota systems, feed-in premia or contracts for differences. RES would initially also often be exempt from balance responsibility. Forecasting their production in real-time thus became the task of TSOs, who did not necessarily have the right incentives to limit the imbalances [
21]. In general, due to their intermittent nature, increasing the share of RES was expected to result in an increased need for balancing energy (and other ancillary services) [
22,
23]. However, the sector inquiry of 2005/2006 found that balancing markets were not well-functioning in most Member States. The concentration in balancing markets were found to be even higher than in the underlying wholesale markets. Several national balancing markets were rather technical mechanisms based on long-term bilateral deals between traditional generators and the TSO. An example of the concentration levels in balancing energy markets (upward and downward) for three Member States can be seen in
Figure 2 [
24]. It can be seen from
Figure 2 that in Austria and Belgium there was one Balancing Service Provider (BSP) supplying about 90% or more of the activated upward and downward balancing energy between 2003 and 2005. In Czech Republic, there were more BSPs active in the market, yet the dominant BSP supplied more than 55% of all balancing energy. The high concentration levels gave generators scope for exercising market power or effectively ruled out the implementation of (short-term) market-based arrangements in the balancing timeframe. Increased balancing costs would be paid partly by the balance responsible parties (BRPs) via the imbalance settlement and partly by all grid users via transmission tariffs.
The adoption of the Third Energy Package in 2009 and the successive adoption of the electricity network codes and guidelines, especially the EB GL and the Commission Regulation (EU) 2017/1485 establishing a Guideline on Electricity Transmission System Operation (SO GL), created the framework of technical, operational and market rules. These have since governed the functioning of balancing markets and facilitated their harmonisation. Though deemed an effective solution, the integration of balancing markets to reduce the level of concentration was not expected to happen quickly. The slow pace was due to the large differences across national balancing market designs and strong dependence on operational practices. Balancing markets and products first had to be harmonised. To gradually reduce concentration levels on the shorter term, it was important that harmonisation allowed for the entry of utility-scale RES into balancing markets, where entry has proven to be much more complex than in the wholesale markets.
3.2. Product Revision and Market Design
We first discuss balance responsibility and the changes in market design that were needed to lower the volume and costs of imbalances for the new entrants. Then we give three examples of how the entry barriers for new entrants into the balancing markets were lifted. Please note that many of the revisions of the product and market design were also relevant for the entry of industrial demand response (DR).
3.2.1. Lowering the Volume and Costs of Imbalances
First, there will be, in real-time, a difference between the volume allocated to a balance responsible party (BRP) and his or her contractual position for a given imbalance settlement period. The imbalance settlement mechanism is to ensure that BRPs support the electricity system’s balance in an efficient way and to incentivise market participants in keeping and/or helping to restore the system balance. It applies to all parties that are financially responsible for their imbalances, a responsibility from which RES were initially exempted to facilitate their take-off. The idea was, over the long run, to subject RES to balance responsibility. However, first the development of more liquid intraday markets to allow RES producers to trade away their imbalances near real-time and a revision of the imbalance settlement rules were required.
Regarding intraday markets, the length of the traded products is crucial. In this regard, Regulation (EU) 2019/943 requires that market participants be provided with the opportunity to trade in energy in time intervals at least as short as the imbalance settlement period (ISP) in both day-ahead and intraday markets. For example, in [
25] it is argued that the introduction of an intraday auction with 15-min products in Germany in 2014 helped to allow more precise scheduling of RES and other generation technologies, which led to a significant reduction in overall balancing costs. Another important parameter is the intraday gate closure time (IDGCT). The closer gate closure is to real-time, the better RES will be able to update their forecasts and trade away their imbalances on the intraday market. In turn, these trades contribute to higher liquidity in the intraday market and a better deployment of flexible resources. The CACM GL requires the cross-zonal IDGCT to be at most one hour before the start of the relevant market time unit, while the intrazonal (in most cases, national) IDGCT can be different and much closer to real-time. Currently, the gate closure of intrazonal intraday markets can be up to five minutes before delivery: as is the case in the Netherlands and Belgium [
26]. In addition, transparent ‘near real-time’ information about the system state is of importance since it allows market participants to estimate potential imbalance settlements and, as such, incentivises market participants to balance their positions in the intraday markets.
Regarding the imbalance settlement mechanism, the major discussion revolved around the application of single versus dual imbalance pricing. Under dual pricing, when the individual imbalance of a BRP is in the same direction as the system imbalance, thus the imbalance aggravates the system imbalance, the imbalance settlement is linked to the cost of balancing energy. However, the reverse price, meaning the price a BRP sees when his or her individual imbalance is in the opposite direction of the system imbalance and is thus helping to restore the system balance, is often linked to, or capped by, a reference or day-ahead market price. It is generally accepted in the academic literature that single pricing is the superior method as it provides an incentive for BRPs to support the system balance [
27,
28,
29,
30]. From the perspective of smaller players, dual pricing is discriminative as it treats larger players preferentially because they can aggregate imbalances within their portfolio to lower their total balancing costs [
28]. Further, and especially relevant for RES and DR, is the fact that one could argue that dual pricing implies a penalty for random imbalances, which do not necessarily bring the system into danger. More precisely, imagine a grid user with random uncontrollable imbalances fluctuating around zero, which are completely uncorrelated with the system imbalance. At the same time the system imbalance is also randomly fluctuating around zero. In this case, under single pricing, the total imbalance cost of that BRP will net out, while under dual pricing the total imbalance cost will be positive. This issue has also been settled in the EB GL, namely Article 52 states that single pricing should be applied. Yet under certain conditions a TSO may propose the regulatory authority to implement dual pricing.
3.2.2. Lifting Entry Barriers for Balancing Markets
In this section, we give three examples on how the entry barriers for the new entrants were lifted in the balancing markets.
First, one simple yet important example of an entry barrier for new entrants is the minimum bid size requirement. Balancing markets were historically dominated by flexible gas or hydro-power plants of several hundreds of megawatts (MWs), while RES is generally smaller in size. The same holds true for industrial DR. In the day-ahead market the minimum bid size is not considered to be restrictive. However, minimum bid sizes in balancing markets are often much higher and typically range between one and ten MWs. However they can go as high as 20 MWs: for example, for manual frequency restoration reserves (mFRR) in the Netherlands in 2018 [
31].
A second example is the length of balancing capacity contracts. More precisely, when a BSPS’s balancing capacity offer is accepted, the BSP is obliged to offer (a certain volume of) balancing energy during a certain period. The contract period can vary from several years to a couple of hours. For example, European Commission [
24] states that in 2005 more than 70% of balancing capacity contracts in Germany had a duration of longer than one year. The length of the contract period influences the extent to which new entrants can compete on equal grounds with conventional generators. A long contract duration also implies a long time-lag between the auctions for balancing capacity and the actual delivery of balancing energy, which affects the ability of new entrants to properly estimate their opportunity cost. Article 6(9) of Regulation (EU) 2019/943, part of the recently adopted Clean Energy Package for all Europeans (CEP), settles the issue. It does so by requiring that balancing capacity contracts shall not be concluded more than one day before the provision of the balancing capacity unless regulators grant exemptions. This implies that balancing capacity contracts shall be no longer than one day in length.
A third and last example is the separate procurement of upward and downward balancing capacity/energy, that means ‘asymmetric balancing products.’ It is easier for RES to offer downward reserves and, on the other side, for DR to offer upward reserves. Requiring from each BSP the capability to provide both types of reserves places new entrants at a disadvantage. Article 6(9) of Regulation (EU) 2019/943 settled this issue by stating that the procurement of up- and downward balancing capacity shall be carried out separately, unless regulators approve a derogation. For a more in-depth discussion of other relevant market design parameters such as the need to be precontracted to be allowed to offer balancing energy and the exact pricing rule (see, for example, [
32]).
3.3. Taking Stock and Outlook
In 2019, the EU was on track to meet its 2020 RES target. That year, renewable energy represented 19.7% of energy consumed in the EU-27, only 0.3 percentage points short of the 2020 target of 20%. Moreover, the EU is pushing their deployment based on updated targets for RES share in 2030 and 2050. As part of the CEP, Directive (EU) 2018/2001 on the promotion of the use of energy from renewable sources set a new RES-target of 32% in final energy consumption to be reached by 2030. As part of the European Green Deal objective to reach climate-neutrality by 2050, the European Commission proposed increasing its 2030 greenhouse gas emissions reduction target to at least 55% compared to 1990. The pursuit of this also require an increase in the RES target The European Commission [
33] estimates that a 55% Greenhouse Gas (GHG) emissions reduction requires a 38–40% renewable energy share by 2030. Together with their increased deployment, EU legislation is also pushing for RES to become real competitors in electricity markets. Regarding the implications of rising amount of renewable generation and balancing costs, in [
23] it is described that indeed balancing and other ancillary service costs have been rising with more renewables in GB, the Pennsylvania-New Jersey-Maryland (PJM) Interconnection, and the National Electricity Market (NEM) in Australia. However, with the exception of the NEM, the increase in costs is rather modest.
The question of balance responsibility, which was not clearly defined in the network codes and guidelines, was resolved in the CEP. Article 5(1) of Regulation (EU) 2019/943 mandates that all market participants be financially responsible for the imbalances they cause in the electricity system. Only for certain installations, including small-scale RES installations with an installed electricity capacity of less than 400 kilowatts (kWs), may Member States provide derogations and allow for a grandfathering clause (The 400 kW threshold applies if the renewable generator is commissioned before 1 January 2026. Afterwards only RES with an installed electricity capacity of less than 200 kW can be exempted). Subjecting RES to balance responsibility might result in increased costs for owners of projects that were formerly used for a feed-in tariff scheme. To mitigate imbalance costs, intermittent RES is increasingly entering the electricity markets to trade away their imbalances before real-time. In that regard, intraday trading volumes are increasing year-by-year in most Member States [
34,
35]. For example, in [
36] it is observed that quarter-hourly intraday trading volumes in Germany have increased from 1 terawatt hour (TWh) in 2012 to 10 TWh in 2017. Their regression analysis indicates that increased trading on the intraday markets significantly reduced system imbalances. In [
37] it is found that 15-min intraday trading is mostly used to balance the intra-hour volatility of renewable energy sources.
The design of subsidy schemes has also been addressed in the CEP. Directive (EU) 2018/2001 mandates that Member States wishing to implement support schemes do so in a way that is as non-distortive as possible for electricity markets. In addition, many RES support schemes were introduced in the early 2000s with a duration of twenty years, resulting in an increasing number of supported RES installations reaching the end of their support time. The Council of European Energy Regulators (CEER) [
38] observes that no major changes have so far been made at the national level to accommodate the end of RES support schemes. The new arrangements for RES do not mean that their full revenue will henceforth depend on markets, but that Member States can allocate support in addition to market revenues, while introducing market-based systems to determine the necessary level of support. RES will be able to choose which markets they want to enter. In addition, RES will still seek to enter long-term contracts, albeit in the form of (corporate) power purchase agreements (PPAs) rather than the subsidies granted by Member States.
4. Asset-Light Software Companies Aggregating Distributed Energy Resources
In this section, we start by describing the context in which aggregators entered EU electricity markets. After, we discuss a selection of market design and regulatory barriers that had to be overcome to allow aggregators to compete on a level playing field with traditional generators. Lastly, we take stock and look at the future.
4.1. Context
Technological innovations and a changing economic and regulatory environment have led to the adoption of utility-scale renewables and distributed energy resources (DERs) have also received more attention [
39,
40]. DERs are connected directly to the distribution network or located behind the consumer’s meter. They include assets such as smaller-scale PV or wind parks, rooftop PV and other distributed generation, thermal and electrical energy storage, and more flexible and price-responsive management of electricity demand [
41]. In [
42,
43] the definition and use cases of DERs is discussed in detail, among the use cases is the participation of DER in organised electricity markets. An issue with the participation of DERs is that the value of directly interacting with organised electricity market is deemed too little compared to the incurred costs and the level of knowledge that is needed to do so: this is true whether we are talking of a solar park of several MWs, a neighbourhood battery of 100 s of kWs, or an electric vehicle (EV) in a household garage. As noted in [
44], this is where aggregators appear as intermediaries reducing transaction costs on both sides: on the wholesale side, the cost of dealing with overly small and heterogeneous units; and on the DER’s side, the cost of understanding, adapting, and reacting to electricity markets.
Flexible and price-responsive management of electricity demand is an important category within what is currently referred to as DERs. The revision of the product and the market design for balancing markets that was described in the previous section paved the way for DR to enter electricity markets. However, it was, at first, only possible for the largest industrial consumers with their own bilateral power purchase agreements to directly participate in electricity markets or, for example, opt for an interruptible contract. Even then participation was limited, as not many Member States had opened their markets to demand-side participation [
45]. In 2016, the European Commission [
46] estimated that the DR potential was 100 gigawatt (GW), while only around 20 GW were considered active, leaving the potential of smaller commercial and household consumers largely untapped. It was also estimated that the DR potential would increase further to 160 GW by 2030. The DR potential of smaller electricity users is expected to increase with the uptake of flexible technologies, such as electric vehicles and heat pumps. One way to unlock that DR at lower voltage levels is by letting consumers react to the price signals included in their energy bill; this response is often referred to as ‘implicit DR’. To the extent that consumers do not respond enough to these price signals, it can also be opportune to contract DR explicitly via aggregators.
The participation of DR in organised electricity markets via aggregators is starkly different from the participation of aggregated stand-alone distributed generation. The reason is that there is an important interaction between the aggregator of a group of consumers and those consumers’ suppliers. In principle, suppliers can provide aggregation services, but they have been relatively slow in taking up this role. Traditional suppliers are inherently reluctant to offer DR programmes as these services impact their core business of selling volumes of energy (see, for example, [
41,
47,
48]). Therefore, the concept of independent aggregators emerged. Independent aggregators are aggregators that engage in the aggregation of consumers, but who are not affiliated to those consumers’ suppliers.
4.2. Lifting the Barriers for (Independent) Aggregators
We first discuss a selection of important market barriers for aggregators in general. After, we discuss the conflict between independent aggregators and suppliers.
4.2.1. A Selection of General Market Barriers for Aggregators
An advantage of aggregators is that they are generally quite flexible. Flexible in this context means that they can carry out changes in (aggregated) production or consumption on short notice. Balancing markets are opportune for aggregators to monetise their flexibility as balancing prices are known to be more volatile than wholesale market prices. This is confirmed by [
49,
50] in which an overview of aggregator business models in the EU is provided. The same barriers that we identified for utility-scale RES and for industrial DR to enter the balancing markets, are also relevant for aggregators (see [
51]). However, there are additional barriers. We briefly, in what follows, discuss four of them.
The first barrier is a straightforward one, namely the possibility of using aggregated offers and bids. This has not been an obvious possibility in all the balancing markets in the EU. For example, the European business association for digital and decentralised energy solutions (SmartEn) [
31] reports that in Estonia, Poland, Portugal, Spain, and Slovenia participants were not allowed to bid with a pool of assets in the balancing markets in 2018.
A second issue, which is especially relevant for the aggregation of smaller units, are the prequalification requirements. Should each small unit have to go through a formal prequalification process, the potential revenues might not make up for the costs. Allowing aggregators to manage their own pools and to be responsible for them, without the need to individually prequalify each asset, lowers entry barriers [
52].
A third issue relates to the measurement of power delivery. Baselines must be introduced because DERs do not often have formal schedules mapping their physical schedules upon their financial positions; this is in contrast to generators or major consumers connected to the transmission-level. System operators and DERs agree upon a baseline, which can be seen as a counterfactual for non-activation, to verify activations. In [
53] baseline methodologies applied in the EU are reviewed. These authors find that baseline methodologies may suffer from their simplicity and their lack of transparency, are prone to manipulation, and may lead to the inefficient use of available resources. In [
54,
55] baseline methods applied in the United States (US) are criticised. These authors state that unfortunately, individual customers will always know more about their true baseline than the administrator of a DR program and can likely profit from that knowledge. Currently there is no consensus on an adequate way to define baselines.
A last example of a (well-hidden) barrier for aggregation are penalties for the non-availability of balancing energy for which a reservation payment was earned. To avoid moral hazard it is important to subject a BSP to a penalty when it does not deliver on its promise to provide balancing energy. However, the design of a penalty scheme can be discriminatory and can lead to risks that discourage new entrants from entering the market. For example, the current penalty scheme in Belgium for non-availability of frequency restoration reserve (automatic and manual) favours large units over aggregators. More precisely, bulk unavailability, e.g., one CCGT unit with 30 MW unavailable for four hours, faces significantly lower penalties than smaller unavailabilities that are evenly spread across a longer period, e.g., an aggregator with 1 MW unavailable for 120 h [
56,
57] The reason behind this difference is that the penalty is a function of the amount of time periods a BSP was not fully available, independent of the precise magnitude of the unavailability. This is hard to justify. What is more, typically a bulk unavailability is much harder to handle for the system operator than many smaller deviations.
4.2.2. A Specific Regulatory Difficulty with Independent Aggregation
An important regulatory challenge in the EU related to the specific case of independent aggregators is the interaction with the supplier and its contracted consumers. Suppliers purchase a certain amount of electricity in advance to cover the consumers’ expected load and are responsible for having a balanced position in real-time. In most cases, the independent aggregator will sell a reduction in consumption compared to the baseline in a given electricity market. Consequently, the actions of the independent aggregator can cause an imbalance in the portfolio of a supplier, and suppliers have also asked for compensation for their forgone revenues.
The imbalance issue has been settled by applying a perimeter correction in most European countries with an existing regulatory framework for independent aggregation in place [
58]. However, the foregone revenue issue is more controversial. In this regard, Article 17 of Directive (EU) 2019/944 says that Member States shall enable DR through independent aggregation. More specifically, it is written that Member States may require independent aggregators to pay financial compensation to suppliers, but that the compensation shall not create a barrier to the market entry of independent aggregators. In [
58] it is described how the European countries that are most advanced in developing a regulatory framework for independent aggregators introduced compensation mechanisms proxying energy sourcing costs. Examples are Belgium, France, Germany (not yet implemented), Slovenia (not yet implemented) and Switzerland (please note that as Switzerland is not an EU Member State, it does not have to comply with the CEP). In contrast, in the US the Federal Energy Regulatory Commission (FERC) has ordered that DR shall not pay compensation and shall be paid at the full wholesale market prices when a net benefit test is passed [
59] (For an early discussion about the integration of DR in US electricity markets, see, for example, [
60]). The Order 745 was disputed as described in [
61,
62]. However it was upheld by the Supreme Court [
63].
4.3. Taking Stock and Outlook
Aggregators have been flourishing in Europe in the last few years. For example, in [
50] at least 26 prominent independent aggregators are counted that are active in Europe in 2019. The same authors identify most aggregators as being active in Germany, the United Kingdom, and France, with, respectively, sixteen, twelve, and ten aggregators. Aggregators have been challenging suppliers, which is proven by that fact that a significant number of prominent European supply companies have either engaged in aggregation themselves, have set up an aggregator, or have acquired an aggregator. At least 35% of the 26 identified aggregators in the review provided in [
50] have been acquired or spun off by large utilities in the last few years. In [
64] two cases of incumbent suppliers are presented who, in search of a more resilient business model, have created combined supplier–aggregator businesses. With more and more independent aggregators being operated by companies with a supplier-side business, issues between the independent aggregator and supplier might become less critical in the EU.
An important development is that more and more aggregators are also active across borders. Therefore, it becomes important to harmonise the rules and regulations affecting aggregation. In [
65] it is stated that without harmonised frameworks, aggregators will face higher costs for participating in electricity markets and cross-border competition will be distorted. Therefore Article 59(1.e) of Regulation (EU) 2019/943 states that a new network code can be developed in the area of DR, including rules on aggregation, energy storage, and demand curtailment rules. Network codes are typically used to harmonise regulatory frameworks at the national level when they interact with cross-border trade. It can be expected that this new network code, which has been recently confirmed in the priority list for new network codes for 2020–2023 [
66], will resolve many of the previously listed barriers.
One specific evolution might be both a barrier and an opportunity for aggregators in the near future, namely, distribution grids. These are expected to become more and more congested due to the increased adoption of DER and the increased electrification of heating and transport. Building more lines, the business-as-usual approach, could come at great expense [
67]. On the downside, this could mean that distribution system operators (DSOs) might exclude the delivery of services by assets connected to their grids for network security reasons. In this regard, the SO GL states in Article 182 (2) that the DSO, in cooperation with the TSO, has the right to set limits to, or to exclude, the delivery of active power reserves located in its distribution system. However, it is currently unclear whether compensation must be paid and by whom when units are (temporarily) barred from participating in the market. On the upside, Article 32 of Directive (EU) 2019/944 requires DSOs to procure services in a market-based manner, when such services are cheaper than grid expansion. The solution to the issue of local grid congestion might be a new revenue stream for aggregators. Four pioneering flexibility markets being set up across Europe are discussed in [
68]. One of these platforms is Piclo Flex in the UK. Piclo reports that during their marketplace trial, aggregators were the biggest participants with 39.2% of the total registered flexibility providers [
69]. The procurement of local grid services by DERs in the US is discussed in [
70].
5. Communities
We call the fourth wave and most recent wave of entrants ‘communities’ as it involves united grid users selling, sharing, or trading electricity among themselves. Communities can focus on different activities and subject to a different governance model. We describe three examples of types of communities emerging today. We divide the section into two parts. First, we introduce the different types of communities. After, we discuss in more detail a selection of future challenges that come with these new entrants.
5.1. Introducing Communities
First, we introduce top-down ‘corporate communities’ managed by hardware companies acting as aggregators and often also as suppliers. Second, we introduce bottom-up citizens and renewable energy communities. Third, we describe how peer-to-peer (P2P) trade can create communities of people exchanging electricity.
5.1.1. Corporate Communities Managed by Hardware Companies
It could be argued that this new entrant type is like the (independent) aggregators introduced as the third wave of new entrants. However, the former were mainly software companies, while the new wave is driven by hardware companies, manufacturing the smart devices that are used to provide DR.
One example of a fully-integrated hardware company, aggregator, and supplier is Sonnen GmbH. Sonnen started as a German producer of intelligent energy storage systems. However, it has recently launched the sonnenCommunity. Members of the sonnenCommunity can use their battery to become part of a battery pool by providing a small share of their individual storage to the public power grid for some minutes per week to buffer short-term peaks. In return, the battery owners who have the sonnenFlat tariff can receive a financial compensation in the form of cost-free energy up to a certain amount of kilowatt hours (kWhs) [
71] (At the time of writing, the membership for sonnenCommunity and sonnenFlat is limited to a few countries. Depending on the sonnenFlat rate clients will receive cost-free energy up to 4250 kWh with “sonnenFlat 4250”, up to 5500 kWh with “sonnenFlat 5500” and up to 6750 kWh with “sonnenFlat 6750”). Moreover, members of the sonnenCommunity can (virtually) share their self-produced energy with other community members. A central software links up and monitors all sonnenCommunity members, while balancing energy supply and demand. As such, the community replaces the traditional energy supplier.
Another example is the electric car manufacturer and technology firm Tesla Motors Limited, to which the GB national energy regulator, Ofgem, granted an electricity generation licence in 2020 [
72]. Tesla entered the market to develop virtual power plants (VPPs) in GB and other countries by using a real-time trading and control platform, which aggregates its own car fleet and possible other DERs. The trading and control platform, called Autobidder, allows value stacking by participating in various electricity markets including balancing markets. More recently Tesla joined up with electricity supplier Octopus Energy to offer an energy tariff tailored to homes with solar panels and Powerwalls [
73]. Households taking the tariff will automatically join Tesla’s GB VPP. Octopus, meanwhile, launched its own Octopus Electric Vehicle solution in GB, which consists of a bundle offer for leasing an electric car, charging infrastructure and a suitable tariff [
74]. Octopus uses the cars to implement vehicle to grid (V2G) to support grid stability around GB.
In the near future, several more hardware companies are expected to follow suit. Examples could be manufacturers of smart home systems such as Google with Nest, Amazon with Amazon Echo, and smaller players such as Thermovault. For several years, integrated supplier-aggregators have been coupling free smart home systems with electricity supply contracts to consumers willing to sign with them [
75,
76].
5.1.2. Citizen and Renewable Energy Communities
Energy cooperatives have a long-standing tradition in several European Member States. They can be connected to the second wave of new entrants that focused on renewables. The difference is that the cooperatives focused on smaller scale projects instead of utility-scale projects. For example, in [
77] the factors are discussed that are likely to foster citizen and community participation as regards wind power cooperatives in Denmark, Germany, Belgium and the United Kingdom (UK). Another difference is that these energy cooperatives have organised many other kinds of activities, from energy efficiency awareness campaigning to the collective switching of supplier; they have gone far beyond solely the investment in renewables projects.
The concept of energy communities has been mainstreamed with the adoption of the CEP in which they were formally recognised. Currently, Member States are in the process of defining enabling frameworks for energy communities. The timing of this legislative push for energy communities comes at a moment when citizens and local authorities have shown an increasing interest in being actively involved in the energy transition and the fight against climate change. The CEP defines two types of energy communities: citizen energy communities (CECs) and renewable energy communities (RECs). In a CEC, members do not have to be in close proximity to one another; a CEC can be ‘virtual’ with dispersed members over a larger region such as Ecopower in Belgium. If there is proximity and if all electricity generation assets are renewable-based, the CEC is a REC. However, RECs are not always a subgroup of CECs. RECs can also engage in collective investments in other energy carriers, e.g., renewable gas, while CECs are limited to electricity. In [
78] it is shown that besides these two legal definitions, there are many different types of energy communities today. Based on collective rules and decisions, energy communities may produce, supply, distribute, share, and consume (often renewable) energy. These authors state that two basic dimensions allow for the mapping of the various types of energy communities: the geographical scope at which they operate; and the motive for collective action. The first can be local or dispersed; while the second can be economic or relational.
The important difference between the former energy cooperatives and today’s emerging energy communities is that members have evolved from mere collective producers to consumers of electricity being supplied by the community. Electricity supply, in turn, requires many different professional skills, a fact which is likely to require an expansion of the community, probably beyond the local non-professional nature. More precisely, community members are collectively self-consuming electricity generated by the communities’ assets. In that sense, energy communities contest the dominant model of electricity supply via professional entities active in organised electricity markets. Note finally that these energy communities also relate to the third wave of new entrants, as they can enter the electricity markets via aggregation. Lastly, [
79] review different energy community business models among which there are, even though still scarce, business models involving services such as aggregation.
5.1.3. Peer-to-Peer Trading
The rise of communities and energy sharing opens up a whole new range of possibilities where not only resources are decentralised but also markets and transactions. These new decentralised marketplaces contest the dominant model of electricity supply via entities active in organised electricity markets.
Once again, the CEP was vital in enabling the creation of decentralised market places by providing a legal definition of P2P trading of renewable energy in Directive (EU) 2018/2001. P2P trade of renewable energy is defined in Article 2(18) as “the sale of renewable energy between market participants by means of a contract with pre-determined conditions governing the automated execution and settlement of the transaction, either directly between market participants or indirectly through a certified third-party market participant, such as an aggregator. The right to conduct peer-to-peer trading shall be without prejudice to the rights and obligations of the parties involved as final customers, producers, suppliers or aggregators”. In [
80] it is described that one class of technology facilitating such a vision is distributed ledgers, of which blockchains are a type. In [
81], 40 worldwide energy start-ups are reviewed with a special attention to blockchain-based P2P trading schemes. In [
82] it is argued that P2P requires three pillars to work, namely a pricing mechanism, a digital transaction loop, and a delivery loop. However, he goes on to observe that none of these can be built by small buyers and by sellers themselves. Therefore, P2P will only work if the concept of communities takes off or with the supporting role of some types of intermediaries and will also, to a certain extent, still rely on the incumbent electricity infrastructure.
5.2. Future Challenges
One common challenge of this most recent wave of entrants concerns the role of the traditional electricity supplier. Electricity supply has been open to competition in the EU since the entry into force of the Second Energy Package. However, the conditions that an electricity supplier must fulfil to obtain supplier licenses have always been very strict. Examples are obligations related to reporting, billing, public service obligations, and balance responsibility. In the case of a local (physical) energy community and P2P trading, participating consumers will typically still need a separate contract with a traditional supplier on top of a contract with the local energy community or the P2P exchange. Similarly, a hardware company acting as a supplier might supply consumer assets used to provide DR, such as an electric vehicle or a heat pump, but not the residual (inflexible) load. The CEP paves the way for the split-supply model, i.e., consumers being able to engage with multiple suppliers, in Article 4 of Directive (EU) 2019/944 by stating that “Member States shall ensure that all customers are free to purchase electricity from the supplier of their choice and shall ensure that all customers are free to have more than one electricity supply contract at the same time, provided that the required connection and metering points are established”. However, from a regulatory perspective it is currently an open question how this kind of split-supply model is implemented. CEER [
83] explains that there is currently no general framework stating how responsibilities would be shared among the multiple suppliers. Also, several practical issues arise. In particular, there is the cost of equipping consumers with additional smart sub-metering devices.
A second common challenge is how to deal with network charges and taxation when sharing or locally trading electricity. Regarding network charges, CEER [
83] explains that Member States generally do not apply network charges on electricity exchanged without the use of the public grid. However, this question becomes trickier when consumers share or trade electricity at a local level, but when they use the public grid. Several Member States allow or are considering allowing a (minor) discount in terms of network charges for the shared electricity via local energy communities. Examples are Belgium’s Brussels region, Italy, and Portugal [
84,
85]. The idea is that by locally producing and consuming electricity losses could be reduced and possibly part of the future investment costs in the network would be avoided (Related to this, in [
86] a cooperative game theoretical framework is introduced to show how the sharing of costs and benefits created by the community (for example due to reduced network charges) is challenging). However, it is hard to provide evidence for this latter claim as local networks are dimensioned for peak usage, which is not necessarily affected by electricity sharing. In terms of P2P trading, for example, in [
87] it is shown how a local electricity marketplace can complement grid tariffs in minimising future network investments. In the future, we might also see the adoption of P2P exchanges facilitating trading between consumers that consider technical grid constraints. These kinds of smart P2P transactions can contest or complement markets for ancillary services in which, typically, DSOs or TSOs act as single buyers. Regarding taxation, CEER [
83] states that the taxation of collectively self-consumed electricity is handled differently in different countries. Some choose to apply exemptions (within limits) from electricity taxes, whereas others apply the full tax rate and levies on all consumed electricity. It is unclear how to regulate energy taxes for electricity shared via corporate communities or electricity traded via P2P exchanges.
A third challenge relates particularly to new players that (re-)integrate several activities. In the case of corporate communities, the sale of smart appliances, electricity supply, and aggregation activities can be integrated. As described in [
47], this may lead to a lock-in effect since the hardware manufacturers may impede or complicate the switching of aggregators by consumers. Hardware manufacturers might have privileged access to consumers’ information, and in some cases might impede data access to other aggregators. The lock-in effect and the uneven access to data might lead to dominant positions in the provision of DR in electricity markets. These issues are not new, yet are reinforced with integrated hardware companies and energy communities. The European Consumer Organisation (BEUC) [
88] reports that several (traditional) suppliers and aggregators have contract terms and conditions including disproportionate termination fees and other barriers for consumers wishing to switch between contracts, effectively locking them into a contractual relationship.
6. Conclusions
An overarching goal of liberalisation was the creation of long-term benefits to society and conveying an appropriate share of these benefits to consumers by placing companies, which were perceived as being inefficient, under competitive pressure. Maintaining competitive markets requires that the incentives for new entrants are correct. In this paper, we selected four waves of new entrants in EU electricity markets: utilities from abroad; utility-scale renewable project developers; aggregators; and several types of communities. We illustrated how with every wave of new entrants, we need to reconsider the market rules because well-intentioned rules designed for certain types of market participants can (unintentionally) become obstacles to new entrants.
We learned from this process that new entrants used to find their way into electricity markets via wholesale markets because balancing markets were more mechanisms than markets. Reforms of balancing markets and progress in technology has led to many new entrants currently starting as balancing service providers.
We also learned that new entrants can lead to a more sustainable electricity system by creating economic, environmental, and social value. However, new entrants can also introduce new risks that have to be managed. With the most recent waves of entrants involving consumers, consumer data will play an increasingly important role and potential issues are not limited to competition issues. For example, BEUC [
88] highlights that several innovative aggregators and suppliers failed to comply with data protection rules and shared consumer data with third parties that had no direct link with their service such as credit referencing agencies.
Finally, we learned that the role of the regulator has not reduced. The view of many at the start of the liberalisation process was that we would deregulate or re-regulate the sector and that the role of regulators would then be reduced, as discussed in [
89]. Instead, it can be argued that the role of regulators has been increasing. The completion of the internal electricity market is a moving target. Regulators are increasingly expected to be dynamic in continuously monitoring the needs to change the detailed market rules. This is also recognised in a recent report by CEER [
90] emphasising the role of dynamic regulation. Important in that regard were the electricity network codes and guidelines, which are a set of rules pushing for the harmonisation of national electricity markets and regulations. These originated in the Third Energy Package. Currently there are eight network codes and guidelines. In the Clean Energy Package for all European (CEP), several new areas for network codes have been identified. The many open issues that have been set out in this paper suggest that the CEP might not be the last package to change market rules.
Author Contributions
Conceptualization, T.S., V.R. and L.M.; methodology, T.S., V.R. and L.M.; investigation, T.S. and V.R.; writing—original draft preparation, T.S. and V.R.; writing—review and editing, T.S., V.R. and L.M. All authors have read and agreed to the published version of the manuscript.
Funding
This research was funded by the EU’s Horizon 2020 project INTERRFACE (grant agreement No 824330).
Acknowledgments
We would like to thank Lynne Kiesling, Michael Pollitt, and Ksenia Poplavskaya for their contributions during the FSR Insights online event on the topic of this paper that took place on the 24th of February 2021. We would also like to thank Simon Young for proofreading and Nicolò Rossetto and Jean-Michel Glachant for feedback. The usual disclaimer applies.
Conflicts of Interest
The authors declare no conflict of interest.
References
- Joskow, P.L. Lessons learned from electricity market liberalization. Energy J. 2008, 29, 9–42. [Google Scholar] [CrossRef]
- Pollitt, M.G. The role of policy in energy transitions: Lessons from the energy liberalisation era. Energy Policy 2012, 50, 128–137. [Google Scholar] [CrossRef]
- Wolfram, C.D. Electricity Markets: Should the Rest of the World Adopt the United Kingdom’s Reforms? Regulation 1999, 22, 48–53. [Google Scholar]
- Jamasb, T.; Pollitt, M. Electricity market reform in the European Union: Review of progress toward liberalization & Integration. Energy J. 2005, 26, 11–41. [Google Scholar] [CrossRef]
- Schneiders, A.; Fell, M.J.; Nolden, C. Peer-to-peer electricity trading and the sharing economy: Social, markets and regulatory perspectives. Preprints 2021. [Google Scholar] [CrossRef]
- Soeiro, S.; Ferreira Dias, M. Energy cooperatives in southern European countries: Are they relevant for sustainability targets? Energy Rep. 2020, 6, 448–453. [Google Scholar] [CrossRef]
- European Commission. Inquiry Pursuant to Article 17 of Regulation (EC) No 1/2003 into the European Gas and Electricity Sectors (Final Report); COM(2006) 851 Final; European Commission: Brussels, Belgium, 2007. [Google Scholar]
- European Commission. Energy Infrastructure and Security of Supply; COM(2003) 743 Final; European Commission: Brussels, Belgium, 2003. [Google Scholar]
- Meeus, L.; Reif, V. Why did we start with electricity markets in Europe? In The Evolution of Electricity Markets in Europe; Edward Elgar Publishing: Cheltenham, UK, 2020; pp. 2–24. ISBN 9781789905472. [Google Scholar]
- European Commission. 2020 Report on the State of the Energy Union Pursuant to Regulation (EU) 2018/1999 on Governance of the Energy Union; COM/2020/950 Final; European Commission: Brussels, Belgium, 2020. [Google Scholar]
- European Commission. Connection Europe Facility Energy. Supported Actions; European Commission: Brussels, Belgium, 2020. [Google Scholar] [CrossRef]
- Meeus, L.; Schittekatte, T. Who gets the rights to trade across borders? In The Evolution of Electricity Markets in Europe; Edward Elgar Publishing: Cheltenham, UK, 2020; pp. 25–47. ISBN 9781789905472. [Google Scholar]
- ETSO. An Overview of Current Cross-Border Congestion Management Methods in Europe. 2004. Available online: https://eepublicdownloads.entsoe.eu/clean-documents/pre2015/publications/etso/Congestion_Management/Current_CM_methods_final_20040908.pdf (accessed on 21 June 2021).
- ERGEG. Compliance with Electricity Regulation 1228/2003. ERGEG Monitoring Report. Ref: E07-EFG-23-06. 2007. Available online: https://www.ceer.eu/documents/104400/-/-/c59d1142-8ea3-703a-efb6-2ddbdb458d65 (accessed on 21 June 2021).
- NEMO Committee. Single Day-Ahead Coupling (SDAC). Available online: http://www.nemo-committee.eu/sdac (accessed on 23 June 2021).
- ENTSO-E. Single Intraday Coupling (SIDC). Available online: https://www.entsoe.eu/network_codes/cacm/implementation/sidc/ (accessed on 15 June 2021).
- ENTSO-E. Single Day-ahead Coupling (SDAC). Available online: https://www.entsoe.eu/network_codes/cacm/implementation/sdac/ (accessed on 23 April 2021).
- ACER. Annual Report on the Results of Monitoring the Internal Electricity and Natural Gas Markets in 2018; Electricity Wholesale Markets Volume; ACER: Ljubljana, Slovenia, 2019. [Google Scholar]
- ACER. Annual Report on the Results of Monitoring the Internal Electricity and Natural Gas Markets in 2019; Energy Retail Consumer Protection Volume; ACER: Ljubljana, Slovenia, 2020. [Google Scholar]
- European Commission. The Share of Renewable Energy in the EU; COM(2004) 366 Final; European Commission: Brussels, Belgium, 2004. [Google Scholar]
- Klessmann, C.; Nabe, C.; Burges, K. Pros and cons of exposing renewables to electricity market risks-A comparison of the market integration approaches in Germany, Spain, and the UK. Energy Policy 2008, 36, 3646–3661. [Google Scholar] [CrossRef]
- Newbery, D.; Pollitt, M.G.; Ritz, R.A.; Strielkowski, W. Market design for a high-renewables European electricity system. Renew. Sustain. Energy Rev. 2018, 91, 695–707. [Google Scholar] [CrossRef]
- Pollitt, M.G.; Anaya, K.L. Competition in markets for ancillary services? The implications of rising distributed generation. Energy J. 2020, 41, 5–31. [Google Scholar] [CrossRef]
- European Commission. Energy Sector Inquiry—Part 3. Report from DG COMP. 2007. Available online: https://ec.europa.eu/competition/sectors/energy/2005_inquiry/full_report_part3.pdf (accessed on 24 April 2021).
- Ocker, F.; Ehrhart, K.M. The “‘German Paradox’” in the balancing power markets. Renew. Sustain. Energy Rev. 2017, 67, 892–898. [Google Scholar] [CrossRef]
- NordPool. Market Closing Times. Available online: https://www.nordpoolgroup.com/4a4d20/globalassets/download-center/xbid/nord-pool-sidc-gate-opening-times-gate-closing-times.pdf (accessed on 20 April 2021).
- Newbery, D. Market Design. Working paper CWPE 0615 and EPRG 0515. 2006. Available online: http://www.electricitypolicy.org.uk/pubs/wp/eprg0515.pdf (accessed on 21 April 2021).
- Neuhoff, K.; Batlle, C.; Brunekreeft, G.; Konstantinidis, C.V.; Nabe, C.; Oggioni, G.; Rodilla, P.; Schwenen, S.; Siewierski, T.; Strbac, G. Flexible Short-Term Power Trading: Gathering Experience in EU Countries. Discuss. Pap. 2015, 1494. [Google Scholar] [CrossRef]
- Meeus, L.; Schittekatte, T.; Reif, V. Who is responsible for balancing the system? In The Evolution of Electricity Markets in Europe; Edward Elgar Publishing: Cheltenham, UK, 2020; pp. 84–110. [Google Scholar]
- Vandezande, L.; Meeus, L.; Belmans, R.; Saguan, M.; Glachant, J.M. Well-functioning balancing markets: A prerequisite for wind power integration. Energy Policy 2010, 38, 3146–3154. [Google Scholar] [CrossRef]
- SmartEn. The SmartEn Map. European Balancing Markets. Report Edition 2018. 2019. Available online: https://smarten.eu/wp-content/uploads/2020/03/the_smarten_map_2018.pdf (accessed on 28 April 2021).
- Schittekatte, T.; Meeus, L. Introduction to Network Tariffs and Network Codes for Consumers, Prosumers, and Energy Communities; FSR Technical Report; Cadmus: Florence, Italy, 2018. [Google Scholar] [CrossRef]
- European Commission. Impact Assessment. Accompanying the Document Report from the Commission to the European Parliament, the Council, the European Economic and Social Committee and the Committee of Regions. Stepping up Europe’s 2030 Climate; SWD/2020/176 Final; European Commission: Brussels, Belgium, 2020. [Google Scholar]
- NordPool. Nord Pool Announces 2019 Trading Figures. Available online: https://www.nordpoolgroup.com/message-center-container/newsroom/exchange-message-list/2020/q1/nord-pool-announces-2019-trading-figures/ (accessed on 20 April 2021).
- Epex Spot. New Record Volume Traded on EPEX SPOT in 2020. Available online: https://www.epexspot.com/en/news/new-record-volume-traded-epex-spot-2020 (accessed on 25 April 2021).
- Koch, C.; Hirth, L. Short-Term Electricity Trading for System Balancing. Renew. Sustain. Energy Rev. 2018, 113, 109275. [Google Scholar] [CrossRef]
- Märkle-Huß, J.; Feuerriegel, S.; Neumann, D. Contract durations in the electricity market: Causal impact of 15 min trading on the EPEX SPOT market. Energy Econ. 2018, 69, 367–378. [Google Scholar] [CrossRef]
- CEER. Paper on Unsupported RES. Report from the Renewable Energy Systems Work Stream 2020; Ref: C19-RES-64-04a. Available online: https://www.ceer.eu/documents/104400/-/-/9e615e4c-3735-597f-f4e2-5fecaf93aaae (accessed on 26 April 2021).
- Sioshansi, F.P. Behind and Beyond the Meter. Digitalization, Aggregation, Optimization, Monetization; Academic Press: Cambridge, MA, USA, 2020. [Google Scholar]
- Sioshansi, F.P. Consumer, Prosumer, Prosumager. How Service Innovations will Disrupt the Utility Business Model; Academic Press: Cambridge, MA, USA, 2019. [Google Scholar]
- Burger, S.P.; Luke, M. Business models for distributed energy resources: A review and empirical analysis. Energy Policy 2017, 109, 230–248. [Google Scholar] [CrossRef]
- Pepermans, G.; Driesen, J.; Haeseldonckx, D.; Belmans, R.; D’haeseleer, W. Distributed generation: Definition, benefits and issues. Energy Policy 2005, 33, 787–798. [Google Scholar] [CrossRef]
- Burger, S.P.; Jenkins, J.D.; Huntington, S.C.; Perez-Arriaga, I.J. Why distributed? A critical review of the tradeoffs between centralized and decentralized resources. IEEE Power Energy Mag. 2019, 17, 16–24. [Google Scholar] [CrossRef]
- Glachant, J.-M. New Business Models in the Electricity Sector. RSCAS Working Paper 2019. Available online: http://hdl.handle.net/1814/63445 (accessed on 28 April 2021).
- SEDC. Mapping Demand Response in Europe Today. Tracking Compliance with Article 15.8 of the Energy Efficiency Directive. 2014. Available online: https://www.smarten.eu/wp-content/uploads/2014/04/SEDC-Mapping_DR_In_Europe-2014-04112.pdf (accessed on 29 April 2021).
- European Commission. Overview of European Electricity Markets. METIS Tech. Note T4. 2016. Available online: https://ec.europa.eu/energy/sites/ener/files/documents/metis_technical_note_t4_-_overview_of_european_electricity_market.pdf (accessed on 29 April 2021).
- He, X.; Keyaerts, N.; Azevedo, I.; Meeus, L.; Hancher, L.; Glachant, J.M. How to engage consumers in demand response: A contract perspective. Util. Policy 2013, 27, 108–122. [Google Scholar] [CrossRef]
- Bray, R.; Woodman, B. Barriers to Independent Aggregators in Europe. EPG Working Paper. 2019. Available online: https://geography.exeter.ac.uk/media/universityofexeter/schoolofgeography/images/researchgroups/epg/Barriers_to_Independent_Aggregators_in_Europe.pdf (accessed on 29 April 2021).
- Barbero, M.; Corchero, C.; Canals Casals, L.; Igualada, L.; Heredia, F.J. Critical evaluation of European balancing markets to enable the participation of Demand Aggregators. Appl. Energy 2020, 264, 114707. [Google Scholar] [CrossRef]
- Poplavskaya, K.; De Vries, L. Aggregators today and tomorrow: From intermediaries to local orchestrators? In Behind and Beyond the Meter: Digitalization, Aggregation, Optimization, Monetization; Sioshansi, F.P., Ed.; Academic Press: Cambridge, MA, USA, 2020. [Google Scholar]
- Koliou, E.; Eid, C.; Chaves-ávila, J.P.; Hakvoort, R.A. Demand response in liberalized electricity markets: Analysis of aggregated load participation in the German balancing mechanism. Energy 2014. [Google Scholar] [CrossRef]
- Poplavskaya, K.; De Vries, L. A (not so) independent aggregator in the balancing market: Theory, policy and reality check. In Proceedings of the 2018 15th International Conference on the European Energy Market (EEM), Lodz, Poland, 27–29 June 2018. [Google Scholar] [CrossRef]
- Ziras, C.; Heinrich, C.; Bindner, H.W. Why baselines are not suited for local flexibility markets. Renew. Sustain. Energy Rev. 2021, 135, 110357. [Google Scholar] [CrossRef]
- Bushnell, J.; Hobbs, B.F.; Wolak, F.A. When It Comes to Demand Response, Is FERC Its Own Worst Enemy? Electr. J. 2009, 22, 9–18. [Google Scholar] [CrossRef]
- Chao, H. Demand response in wholesale electricity markets: The choice of customer baseline. J. Regul. Econ. 2011, 39, 68–88. [Google Scholar] [CrossRef]
- Elia. Terms and Conditions for Balancing Service Providers for Automatic Frequency Restoration Reserve (aFRR). 2020. Available online: https://www.elia.be/-/media/project/elia/elia-site/electricity-market-and-system---document-library/balancing---balancing-services-and-bsp/2020/20200303_tc-bsp-afrr_en.pdf (accessed on 29 April 2021).
- Next Kraftwerke. Consultation “BSP Contact aFRR” & “T&C BSP aFRR”. 2020. Available online: https://www.elia.be/-/media/project/elia/elia-site/public-consultations/2020/20200303_non-confidential-individual-contribution-next-kraftwerke_en.pdf (accessed on 29 April 2021).
- Schittekatte, T.; Deschamps, V.; Meeus, L. The regulatory framework of independent aggregators. Electr. J. 2021, 34, 106971. [Google Scholar] [CrossRef]
- FERC. Demand Response Compensation in Organized Wholesale Energy Markets. Docket No. RM10-17-000; Order No. 745. 2011. Available online: https://www.ferc.gov/sites/default/files/2020-06/Order-745.pdf (accessed on 29 April 2021).
- Smith, V.; Kiesling, L. A Market-Based Model for ISO-Sponsored Demand Response Programs. 2005. Available online: https://citeseerx.ist.psu.edu/viewdoc/download?doi=10.1.1.471.1337&rep=rep1&type=pdf (accessed on 29 April 2021).
- Chen, X.; Kleit, A.N. Money for Nothing ? Why FERC Order 745 Should have Died. Energy J. 2016, 37, 201–222. [Google Scholar] [CrossRef]
- Panfil, M. Demand Response, Order 745 and the Supreme Court. Electr. J. 2015, 28, 22–25. [Google Scholar] [CrossRef]
- Supreme Court of the United States. Federal Energy Regulatory Commission v. Electric Power Supply Association et al. No. 14–840; Supreme Court of the United States: Washington, DC, USA, 2016. [Google Scholar] [CrossRef]
- De Clercq, S.; Schwabeneder, D.; Corinaldesi, C.; Fleischhacker, A. Emerging aggregator business models in European electricity markets. In Behind and Beyond the Meter: Digitalization, Aggregation, Optimization, Monetization; Sioshansi, F.P., Ed.; Academic Press: Cambridge, MA, USA, 2020; pp. 285–303. [Google Scholar]
- Küpper, G.; Hadush, Y.S.; Jakeman, A.; Staschus, K. ASSET Study on Regulatory Priorities for Enabling Demand Side Flexibility; European Commission: Brussels, Belgium, 2020. [Google Scholar] [CrossRef]
- European Commission. Establishing Priority Lists for the Development of Network Codes and Guidelines for Electricity for the Period from 2020 to 2023 and for Gas in 2020; European Commission: Brussels, Belgium, 2020. [Google Scholar]
- Eurelectric. Connecting the Dots: Distribution Grid Investment to Power the Energy Transition. 2021. Available online: https://www.eurelectric.org/connecting-the-dots/ (accessed on 29 April 2021).
- Schittekatte, T.; Meeus, L. Flexibility markets: Q&A with project pioneers. Util. Policy 2020, 63, 101017. [Google Scholar] [CrossRef]
- Piclo. Flexibility and Visibility. Investment and Opportunity in a Flexibility Marketplace. 2019. Available online: https://piclo.energy/publications/Piclo+Flex+-+Flexibility+and+Visibility.pdf (accessed on 30 April 2021).
- Kiesling, L. An Economic Analysis of Market Design: Local Energy Markets for Energy and Grid Services. In Local Energy Markets; Pinto, T., Vale, Z., Widergren, S., Eds.; Elsevier: Amsterdam, The Netherlands, 2021. [Google Scholar]
- Sonnen. Sonnen Community. Available online: https://sonnengroup.com/sonnencommunity/ (accessed on 23 April 2021).
- Ofgem. Tesla Motors Limited—Notice of Grant of an Electricity Generation Licence. Available online: https://www.ofgem.gov.uk/publications/tesla-motors-limited-notice-grant-electricity-generation-licence (accessed on 23 April 2021).
- Octopus. Tesla Energy Plan from Octopus Energy|Octopus Energy. Available online: https://octopus.energy/tesla-energy-plan-faq/ (accessed on 23 April 2021).
- Octopus. EV Powerloop-V2G|Octopus Electric Vehicles. Available online: https://www.octopusev.com/powerloop (accessed on 23 April 2021).
- Brown, M.; Woodhouse, S.; Sioshansi, F. Digitalization of energy. In Consumer, Prosumer, Prosumager: How Service Innovations will Disrupt the Utility Business Model; Sioshansi, F.P., Ed.; Academic Press: Cambridge, MA, USA, 2019. [Google Scholar]
- UtilityDive. Nest Taps More than 50 Providers for Efficiency and DR Services. Available online: https://www.utilitydive.com/news/nest-taps-more-than-50-providers-for-efficiency-and-dr-services/418009/ (accessed on 25 April 2021).
- Bauwens, T.; Gotchev, B.; Holstenkamp, L. What drives the development of community energy in Europe ? The case of wind power cooperatives. Energy Res. Soc. Sci. 2016, 13, 136–147. [Google Scholar] [CrossRef]
- Verde, S.F.; Rossetto, N. The Future of Renewable Energy Communities in the EU; FSR Techical Report; Cadmus: Florence, Italy, 2020. [Google Scholar] [CrossRef]
- Reis, I.F.; Gonçalves, I.; Lopes, M.A.; Henggeler Antunes, C. Business models for energy communities: A review of key issues and trends. Renew. Sustain. Energy Rev. 2021, 144, 111013. [Google Scholar] [CrossRef]
- Shipworth, D.; Burger, C.; Weinmann, J.; Sioshansi, F.P. Peer-to-peer trading and blockchains: Enabling Regional Energy Markets and Platforms for Energy Transactions. In Consumer, Prosumer, Prosumager: How Service Innovations Will Disrupt the Utility Business Model; Sioshansi, F.P., Ed.; Academic Press: Cambridge, MA, USA, 2019; pp. 27–52. [Google Scholar]
- Küfeoğlu, S.; Gaomin, L.; Anaya, K.; Pollitt, M.G. Digitalisation and new Business Models in the Energy Sector. Cambridge Working Papers in Economics. 2019. Available online: https://www.eprg.group.cam.ac.uk/wp-content/uploads/2019/06/1920-Text.pdf (accessed on 26 April 2021).
- Glachant, J.-M. Peer-2-Peer in the Electricity Sector: An Academic Compass in the Making; FSR Policy Brief; Cadmus: Florence, Italy, 2020. [Google Scholar] [CrossRef]
- Regulatory Aspects of Self-Consumption and Energy Communities. Report from the Customers and Retail Markets and Distribution Systems Working Groups. Ref: C18-CRM9_DS7-05-03. 2019. Available online: https://www.ceer.eu/documents/104400/-/-/8ee38e61-a802-bd6f-db27-4fb61aa6eb6a (accessed on 27 April 2021).
- Gruppo Professione Energia. Renewable Collective Self-Consumption and Renewable Energy Communities. The Implementation Hypotheses of the Regulatory Authority for Energy Networks and Environment (ARERA). 2020. Available online: http://www.enusyst.eu/documents/CSC-EC-DCO-ARERA-en.pdf (accessed on 27 April 2021).
- Report on Distribution Tariff Methodologies in Europe. 2021. Available online: https://documents.acer.europa.eu/Official_documents/Acts_of_the_Agency/Publication/ACER%20Report%20on%20D-Tariff%20Methodologies.pdf (accessed on 27 April 2021).
- Abada, I.; Ehrenmann, A.; Lambin, X. On the Viability of Energy Communities. Energy J. 2020, 41, 113–150. [Google Scholar] [CrossRef]
- Askeland, M.; Backe, S.; Bjarghov, S.; Korpås, M. Helping end-users help each other: Coordinating development and operation of distributed resources through local power markets and grid tariffs. Energy Econ. 2021, 94. [Google Scholar] [CrossRef]
- BEUC. Fit for the Consumer? Do’s and Don’ts of Flexible Electricity Contracts. 2019. Available online: https://www.beuc.eu/publications/beuc-x-2019-016_flexible_electricity_contracts_report.pdf (accessed on 27 April 2021).
- Glachant, J.-M. Taking stock of the EU “Power Target Model”… and steering its future course. Energy Policy 2016, 96, 673–679. [Google Scholar] [CrossRef]
- CEER Consultation on Dynamic Regulation to Enable Digitalisation of the Energy System. Conclusions Paper. Ref C19-DSG-09-03. 2019. Available online: https://www.ceer.eu/documents/104400/-/-/3aedcf03-361b-d74f-e433-76e04db24547#:~:text=CEER%20held%20a%20public%20consultation,of%20the%203%2Dyear%20strategy (accessed on 28 April 2021).
| Publisher’s Note: MDPI stays neutral with regard to jurisdictional claims in published maps and institutional affiliations. |
© 2021 by the authors. Licensee MDPI, Basel, Switzerland. This article is an open access article distributed under the terms and conditions of the Creative Commons Attribution (CC BY) license (https://creativecommons.org/licenses/by/4.0/).


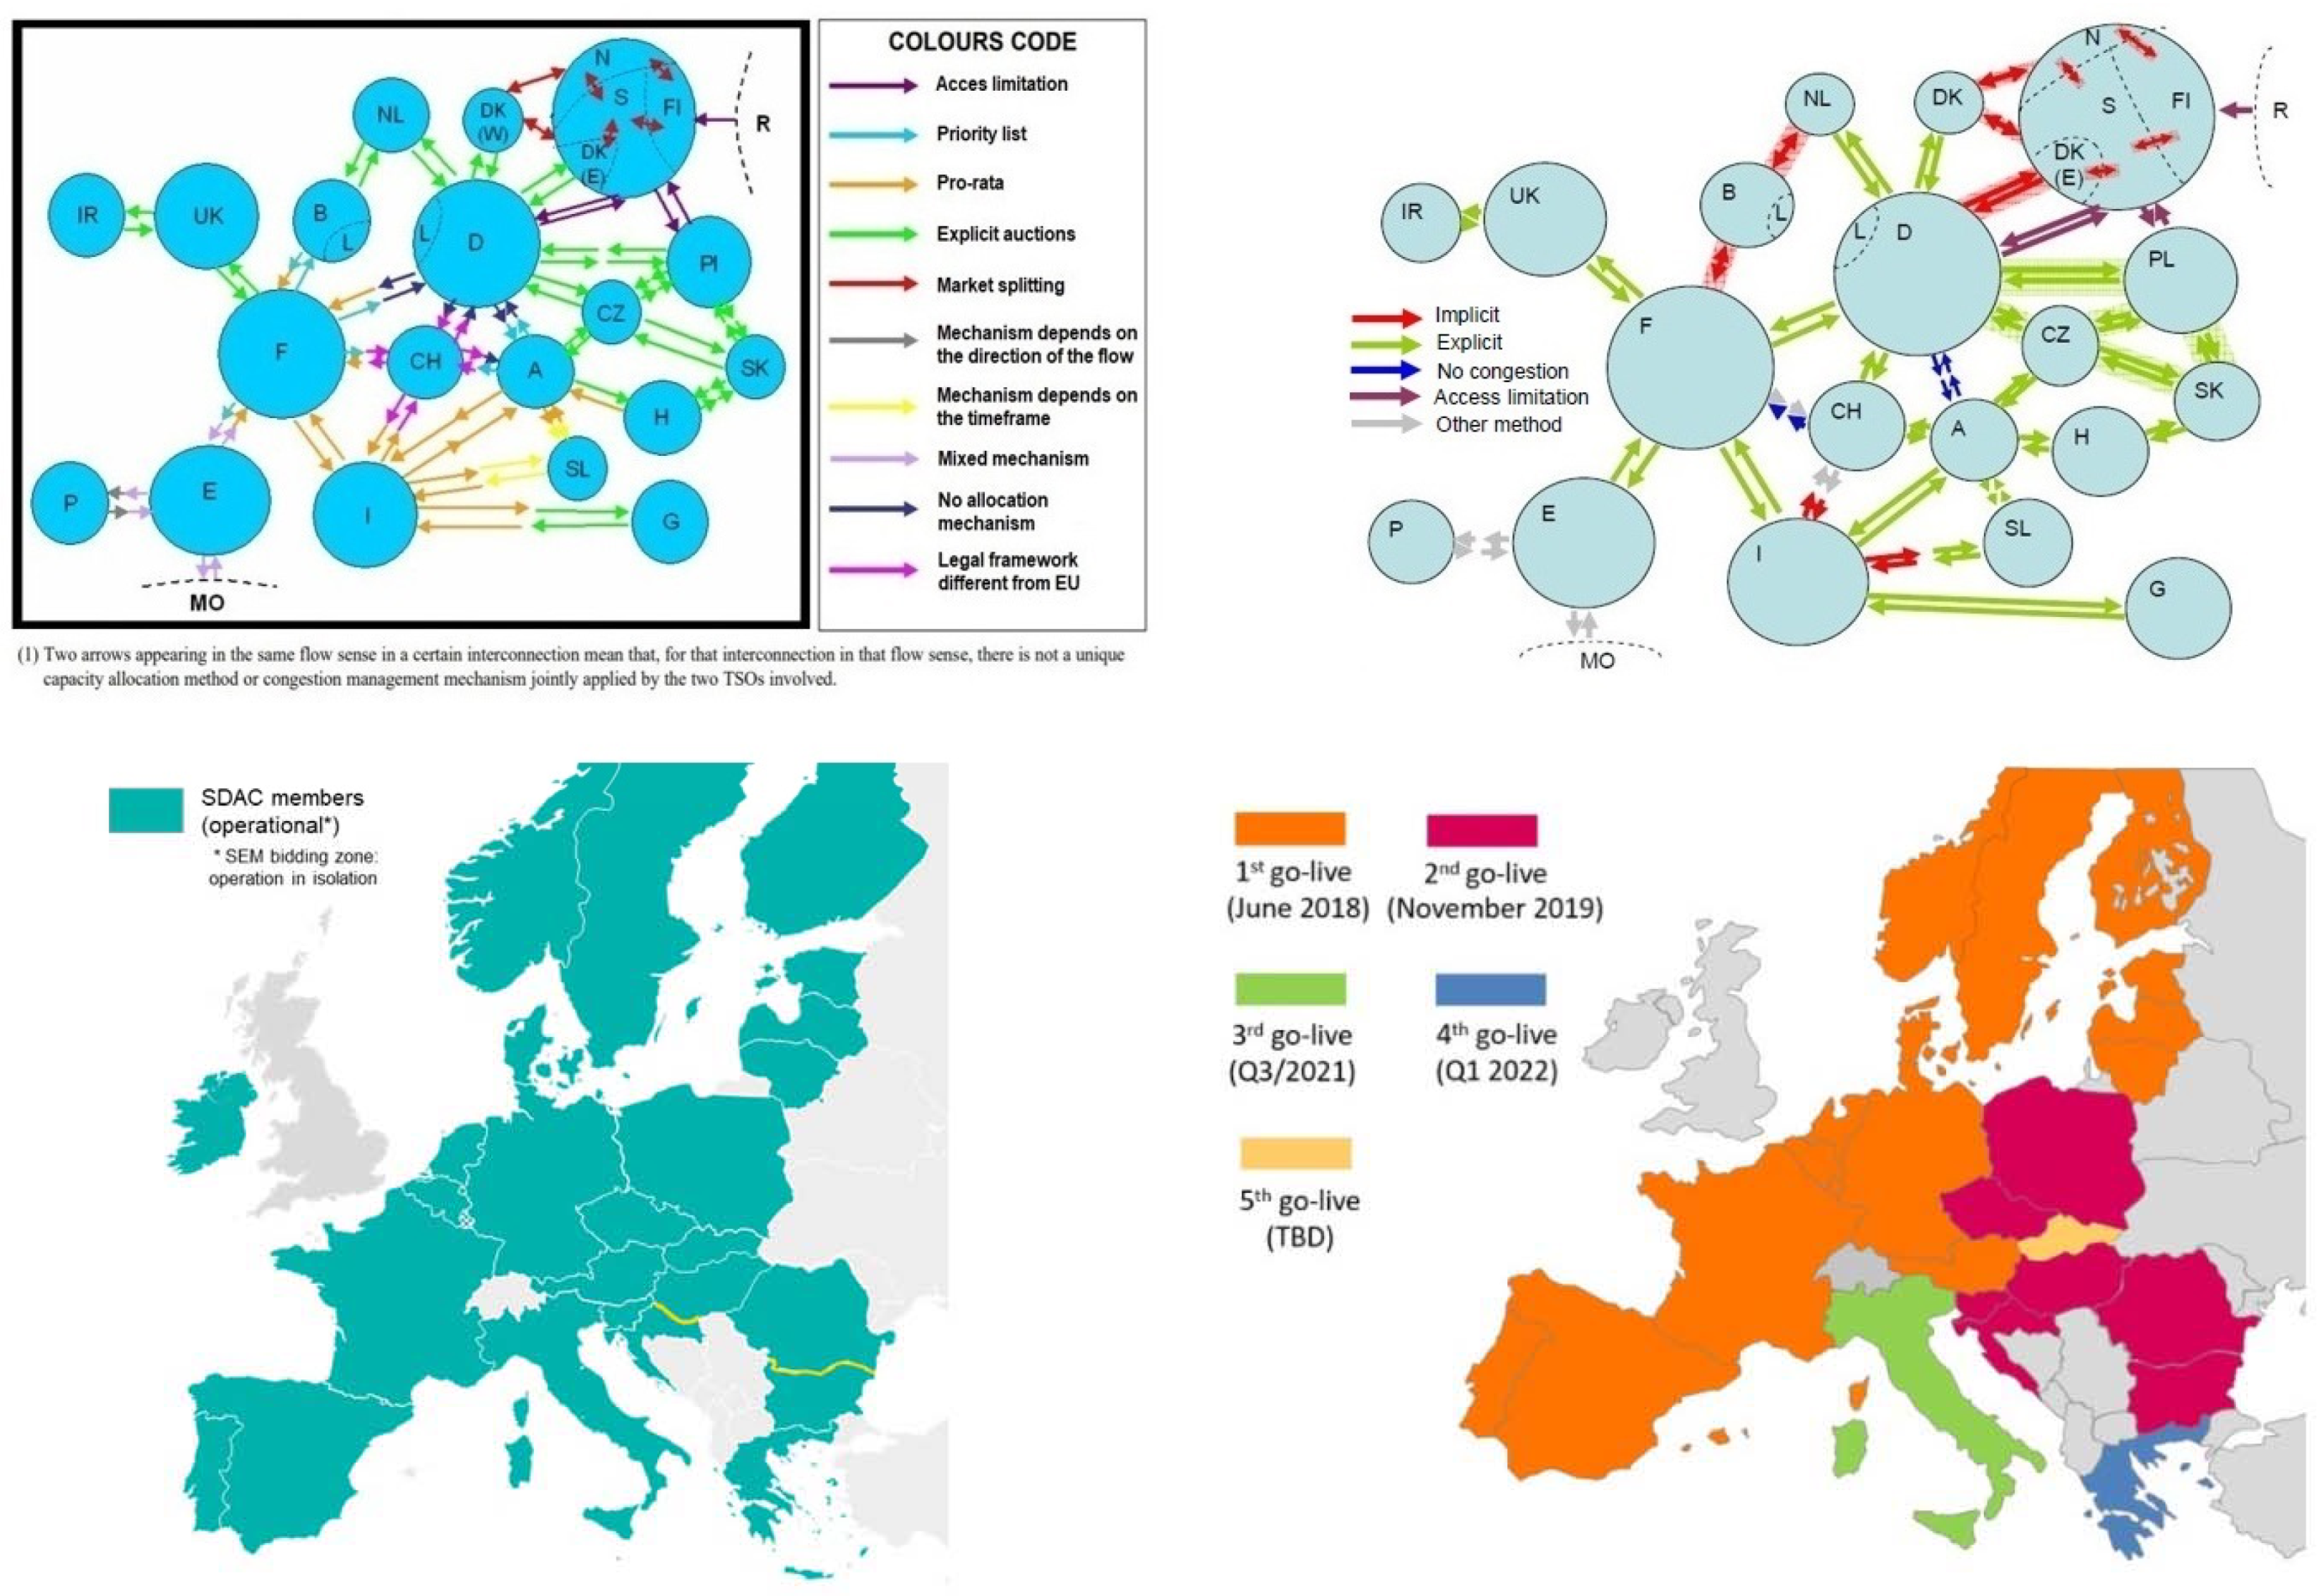
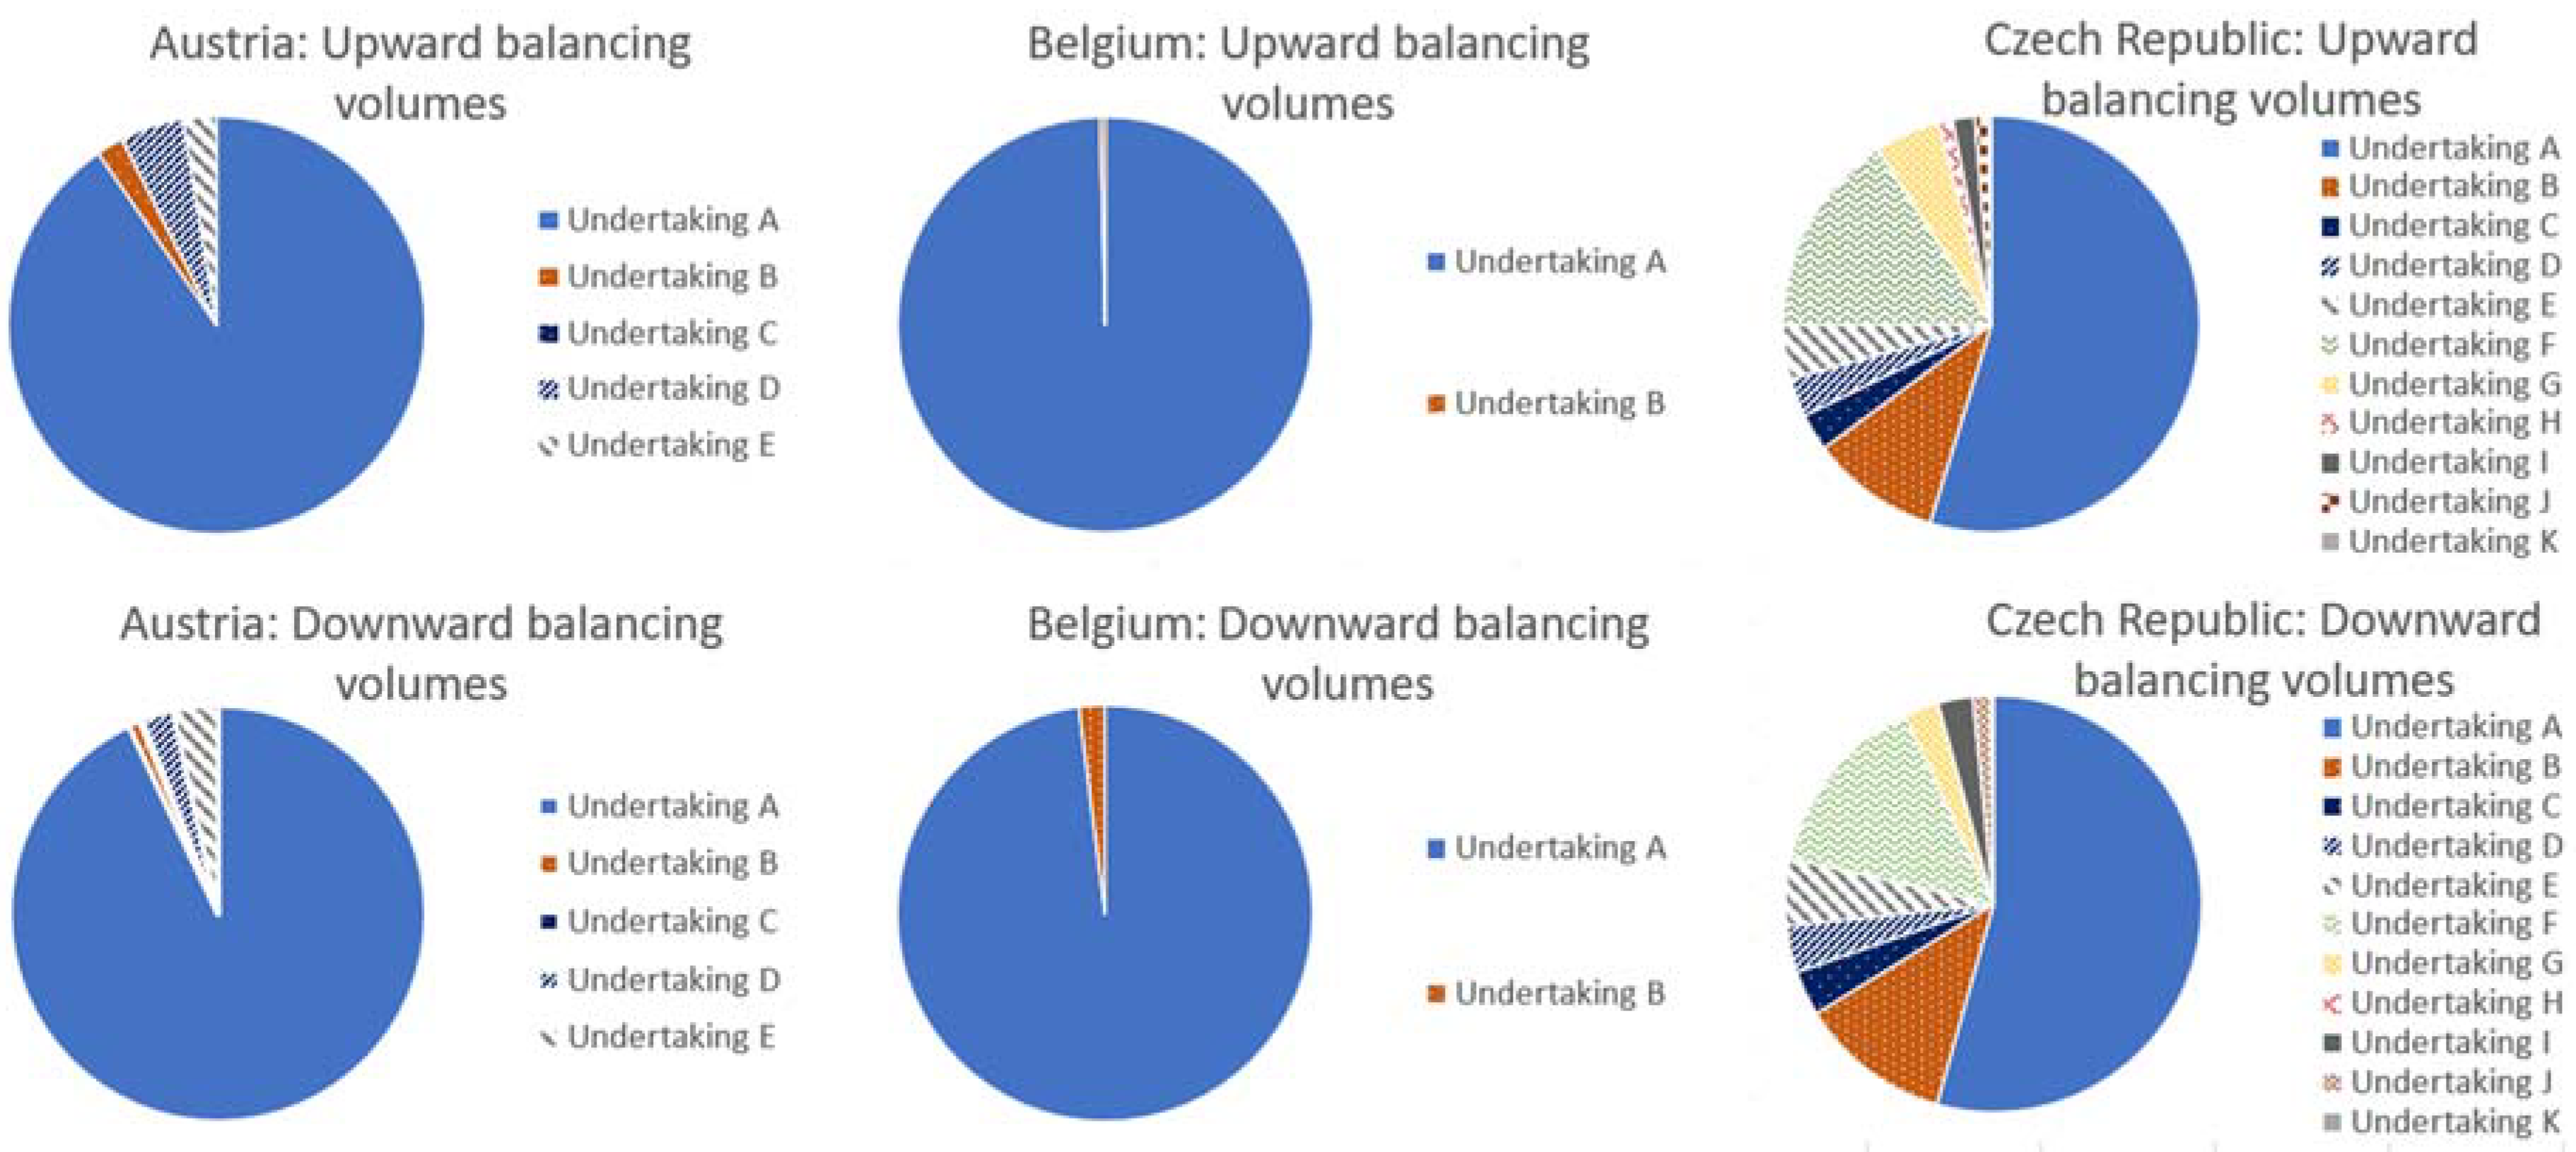

