Abstract
The interest in the seismic performance of nuclear power plants has increased worldwide since the Fukushima Daiichi Nuclear Power Plant incident. In Korea, interest in the seismic safety of nuclear power plants has increased since the earthquake events in Gyeongju (2016) and Pohang (2017). In Korea, studies have been conducted to apply seismic isolation systems to ensure seismic safety while minimizing the design changes to nuclear power plants. Nuclear power plants with seismic isolation systems may have a higher seismic risk due to the failure of the piping system in the structure after a relatively large displacement. Therefore, it is essential to secure the seismic safety of pipes for the safe operation of nuclear power plants. The seismic safety of pipes is determined by seismic fragility analysis. Seismic fragility analysis requires many seismic response analyses because it is a statistical approach to various random variables. Typical numerical conditions affecting the seismic response analysis of pipes are the convergence conditions and mesh size in numerical analysis. This study examined the change in the seismic safety of piping according to the numerical conditions. The difference in the seismic response analysis results of the piping according to the mesh size was analyzed comparatively. In addition, the change in the seismic fragility curve of the piping according to the convergence conditions was investigated.
1. Introduction
Ensuring the seismic performance of nuclear power plants has attracted increased interest worldwide since the Fukushima nuclear incident. Recently, earthquakes with a magnitude higher than 5, such as the Gyeongju earthquake (2016) and the Pohang earthquake (2017), have raised interest in the seismic safety of the nuclear power plants in Korea. Nuclear power plants use various systems to produce and transport energy using nuclear reactors and use a large amount of piping to connect these systems and facilities. Accordingly, it is essential to ensure the seismic safety of these piping systems.
According to various experiments and studies [1,2,3,4,5] conducted on nuclear piping, the primary cause of pipe damage due to earthquakes appeared to be low-frequency fatigue. The pipe elbows were vulnerable to seismic events. A shake table test was conducted to analyze the seismic behavior of nuclear power plant piping. A quantitative study was performed to define the actual failure (leakage) of the piping system [6,7,8]. Recently, studies were conducted to define the degree of piping damage based on an energy dissipation concept [9].
Studies are underway to apply seismic isolation systems to improve the seismic performance of nuclear power plants [10,11,12,13]. On the other hand, the seismic risk may increase due to the large relative displacement induced by a period shift by the seismic isolation [14]. In particular, there is a high risk of damage to the crossover(interface)-piping connecting the isolated part to the non-isolated part. Under this background, a study was carried out to evaluate the seismic safety of the crossover-piping of a seismic isolated nuclear power plant [15]. In addition, finite element analysis was performed to evaluate the seismic safety of the pipe system of the nuclear power plant [16,17].
Specifically, seismic fragility analysis of the piping system for an isolated nuclear power plant was performed. Seismic fragility analysis of the piping system connecting the isolated and non-isolated parts was performed by modifying the NRC (U.S. Nuclear Regulatory Commission)-BNL (Brookhaven National Laboratory) benchmark model [18,19]. The justification of seismic fragility analysis of crossover-piping was confirmed by applying a damage index based on the dissipation energy to express the actual failure quantitatively [20].
On the other hand, the seismic safety of nuclear power plants is determined by performing a seismic probabilistic safety assessment. Therefore, seismic fragility analyses are performed on the structures, systems, and components of nuclear power plants, including piping systems. Seismic fragility analysis requires a statistical approach towards various random variables. Therefore, multiple seismic response analyses are performed. These seismic response analyses should account for the nonlinearity of the seismic behavior of the piping element. Nevertheless, the analysis must be performed under suitable numerical conditions because the seismic response analysis of the piping systems depends on various numerical conditions. Such an argument relies on the following study result. In the OECD (Organization for Economic Cooperation and Development)-NEA (Nuclear Energy Agency), the MECOS (Metallic Component Margins under High Seismic Load) benchmark, a round-robin test that performs finite element analysis based on test results, was conducted to identify an appropriate method to simulate dynamic and static nonlinear behavior for the piping of nuclear power plants accurately. As a result, the results of the eigenvalue analysis were not significantly different. In the case of nonlinear analysis, however, a large error occurred from the experimental results.
Through the results of the MECOS benchmark, it was difficult for finite element analysis to simulate the actual failure accurately based on the fatigue ratcheting of nuclear piping. Thus, it is necessary to check the uncertainty and variability due to the variables of the analysis conditions to analyze the seismic fragility of a nuclear power plant piping system. Typical numerical conditions that affect the results of the seismic response analysis of the piping system are a convergence condition and a mesh size in nonlinear analysis. In this study, the variable seismic performance of a piping system was investigated because of such numerical conditions. First, the finite element model was improved using experimental data. Based on the detailed analytical model representing the experimental results, the difference in the seismic response analysis results of piping according to the mesh size was analyzed comparatively. Finally, the variability in the seismic fragility curve of the piping according to the convergence conditions was confirmed.
2. Derivation of Damage Index of Piping through Experiments
In general, the piping system connecting the two support points was composed of a straight pipe, branch pipe, and elbow. The elbow of the nuclear power plant piping system caused a leak through penetration cracks induced by fatigue failure accompanied by ratchets due to repeated excessive loads. The damage index of the piping is required to perform the seismic fragility analysis of the piping system. The damage index of the piping system was evaluated using extreme nonlinear analyses based on the results of the low cycle fatigue test for a 3-inch pipe elbow.
2.1. In-Plane Cyclic Loading Tests of 3-Inch Elbow Element
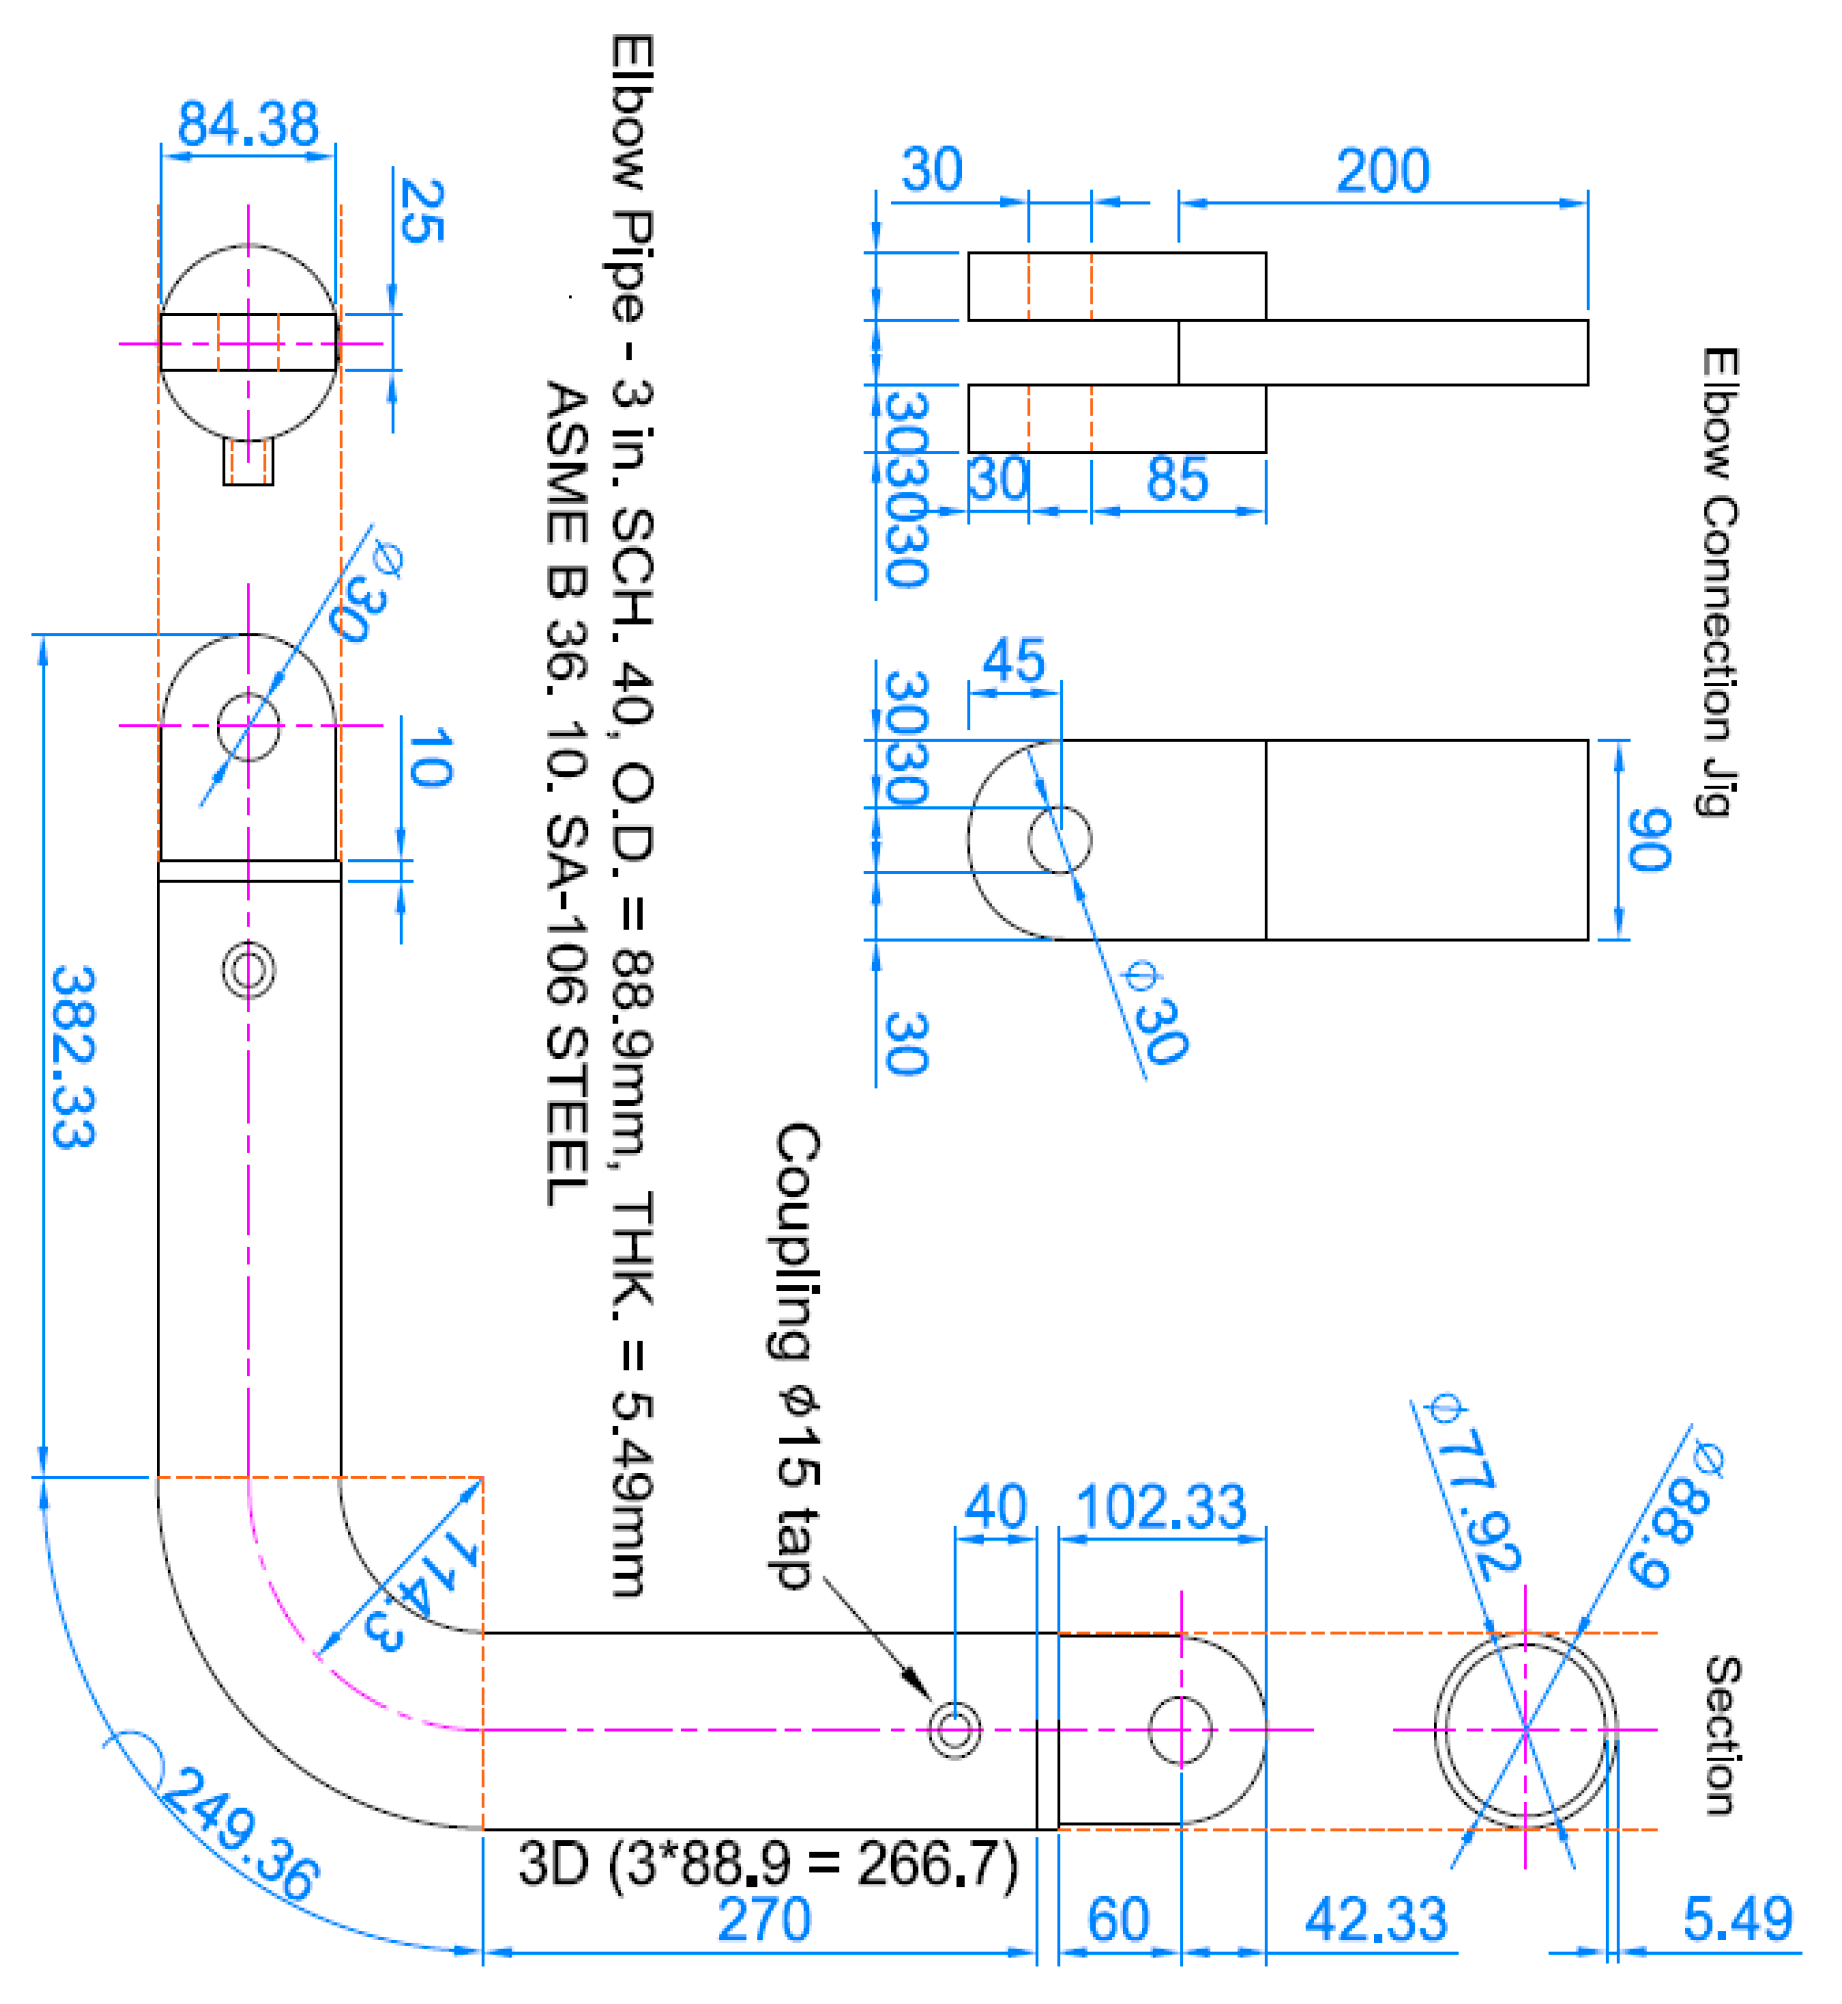
ASME/ANSI 3-inch standard piping was used to minimize the manufacturing errors and material uncertainty. A straight pipe of sufficient length of three times (270 mm) or more in diameter was attached to the elbow by welding to allow plastic behavior in the pipe elbow. As shown in Figure 1 and Figure 2, it was processed to implement a pin connection at both ends of the specimen and combined with a universal testing machine UTM (Universal Testing Machine).
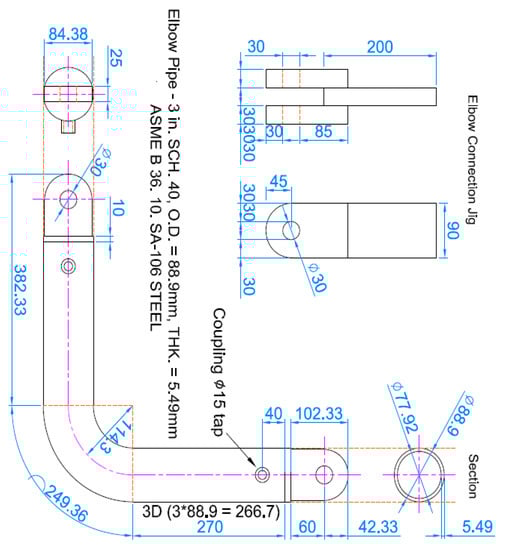
Figure 1.
Test specimen and connection jig.
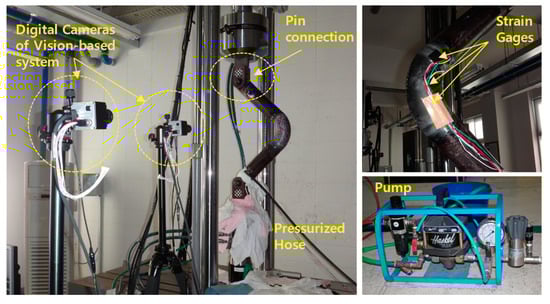
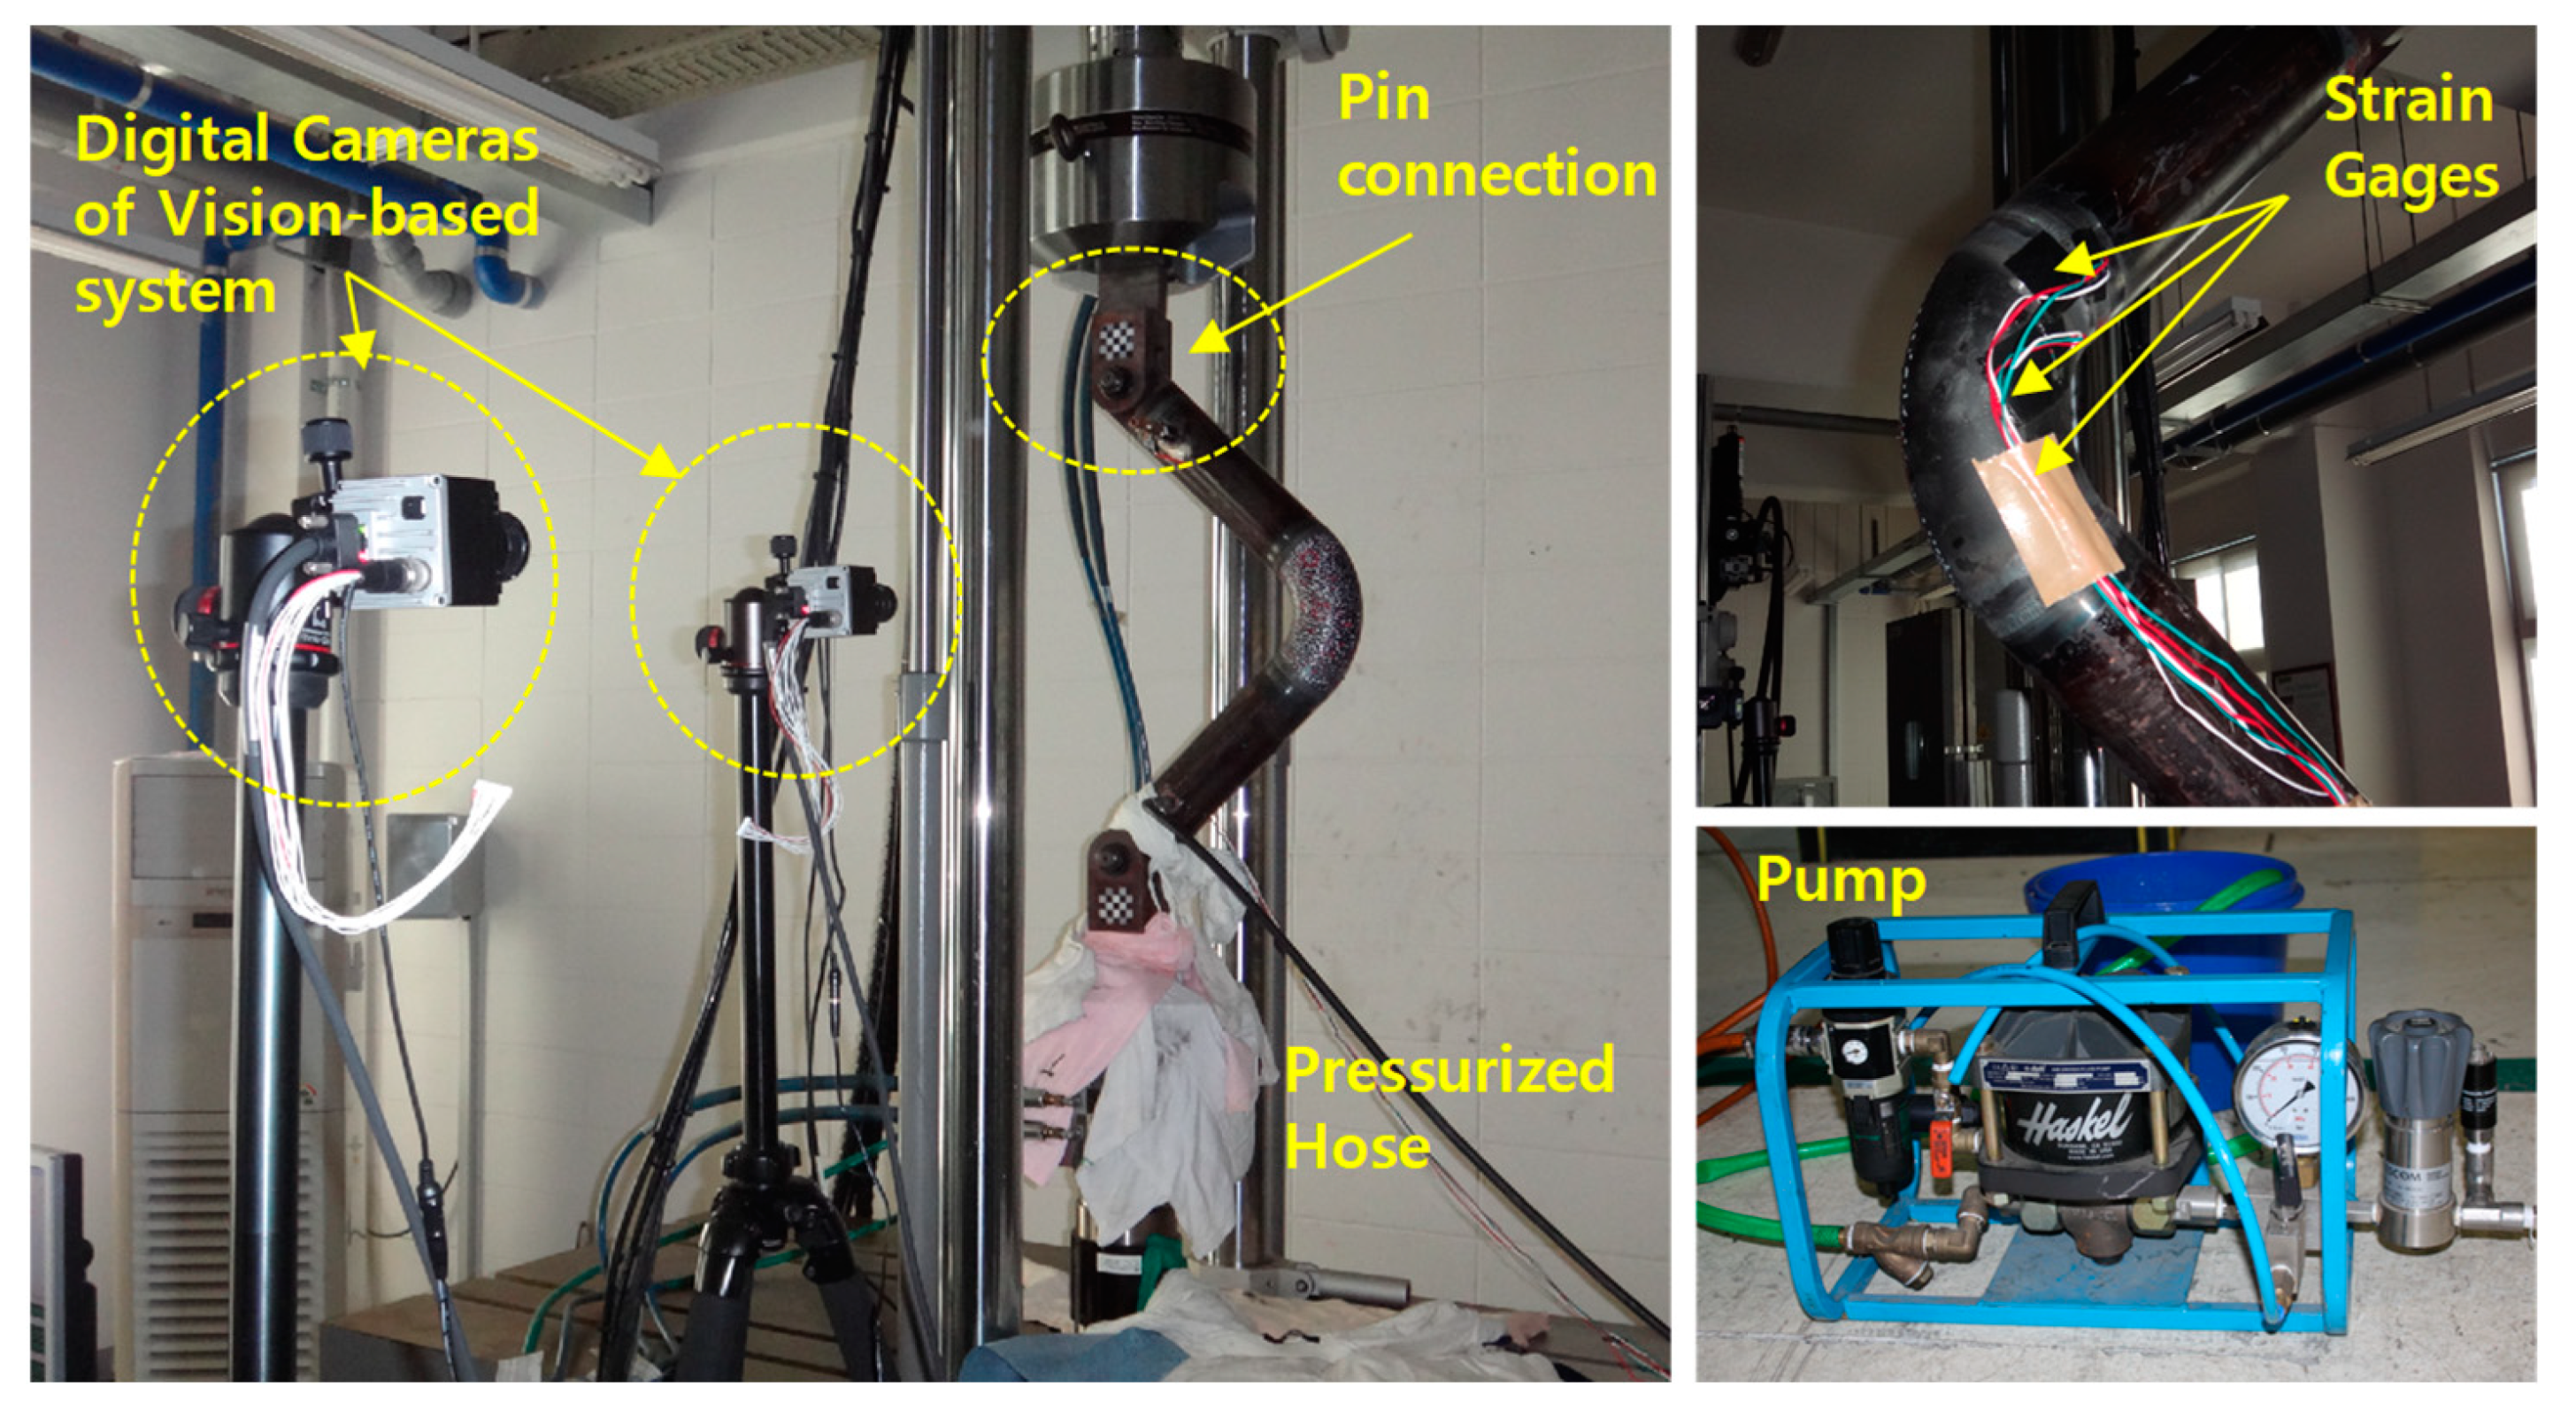
Figure 2.
Test specimen on UTM.
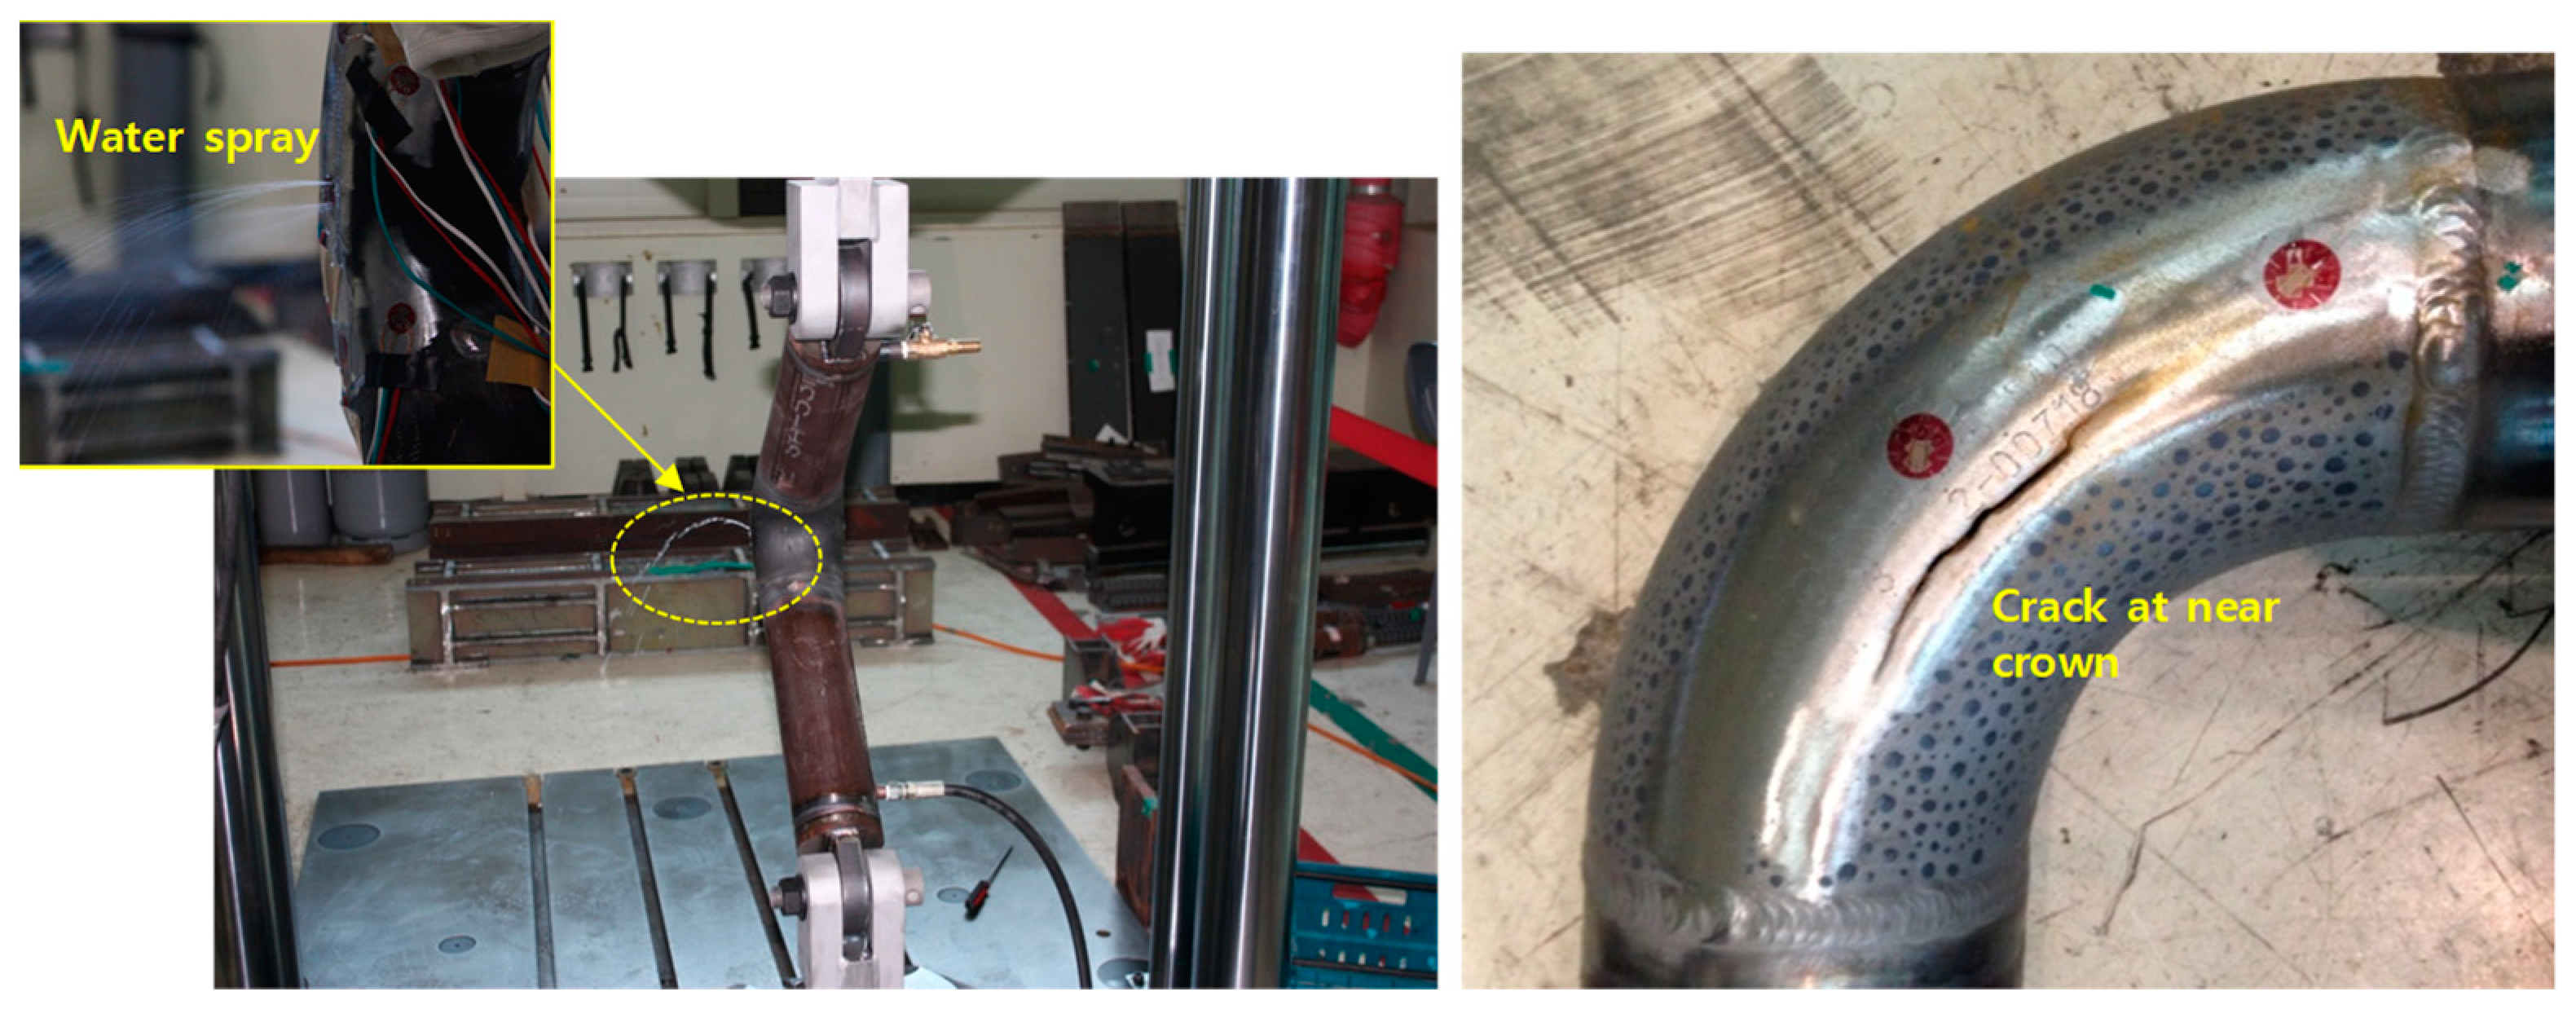
The repeated displacement test for a constant amplitude was performed on the elbow element, as shown in Table 1. A pressure of 3 MPa was applied to all samples, and a repeated force was applied for displacements of ±20 mm to ±100 mm, so sufficient nonlinear behaviors could be captured until leakage occurred. The weakest point of the pipe was the crown and the center of the elbow. A previous study reported that the strain in the hoop direction has a significant effect on damage [2]. Therefore, the strain in the crown region was measured using a strain gauge and a vision-based system based on image signal processing. In this study, the fracture mode of the pipe is defined as a leak caused by cracking. A repeated force test was performed until cracking occurred. Figure 3 shows the composition of the piping element test, including the crack and leak in the pipe elbow. Table 2 lists the results of repeated force experiments in which cracking occurred.

Table 1.
Pipe element test cases.
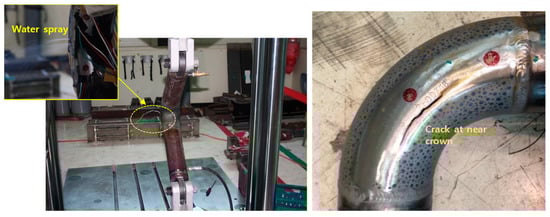
Figure 3.
Cracks and leaks by in-plane cyclic loading test.
Table 2.
Results of the pipe element test.
2.2. Quantitative Failure Criteria Based on the Strain-Stress Relation
In this study, the failure criterion of the piping was defined using Equation (1) which applies the stress–strain relation reported by Bannon. In Equation (1), ϵy and σy are the yield strain and yield stress, respectively; ϵi and Ei are the strain and dissipation energy of the Nth cycle, respectively. The constants c and d are 0.3 and 3.5, respectively [20].
The hoop directional stress and strain were calculated using finite element analysis, as shown in Figure 4, and the damage was evaluated from the dissipated energy.
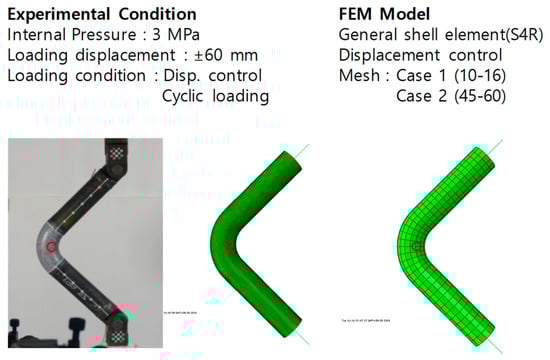
Figure 4.
Finite element analysis model of the pipe specimens.
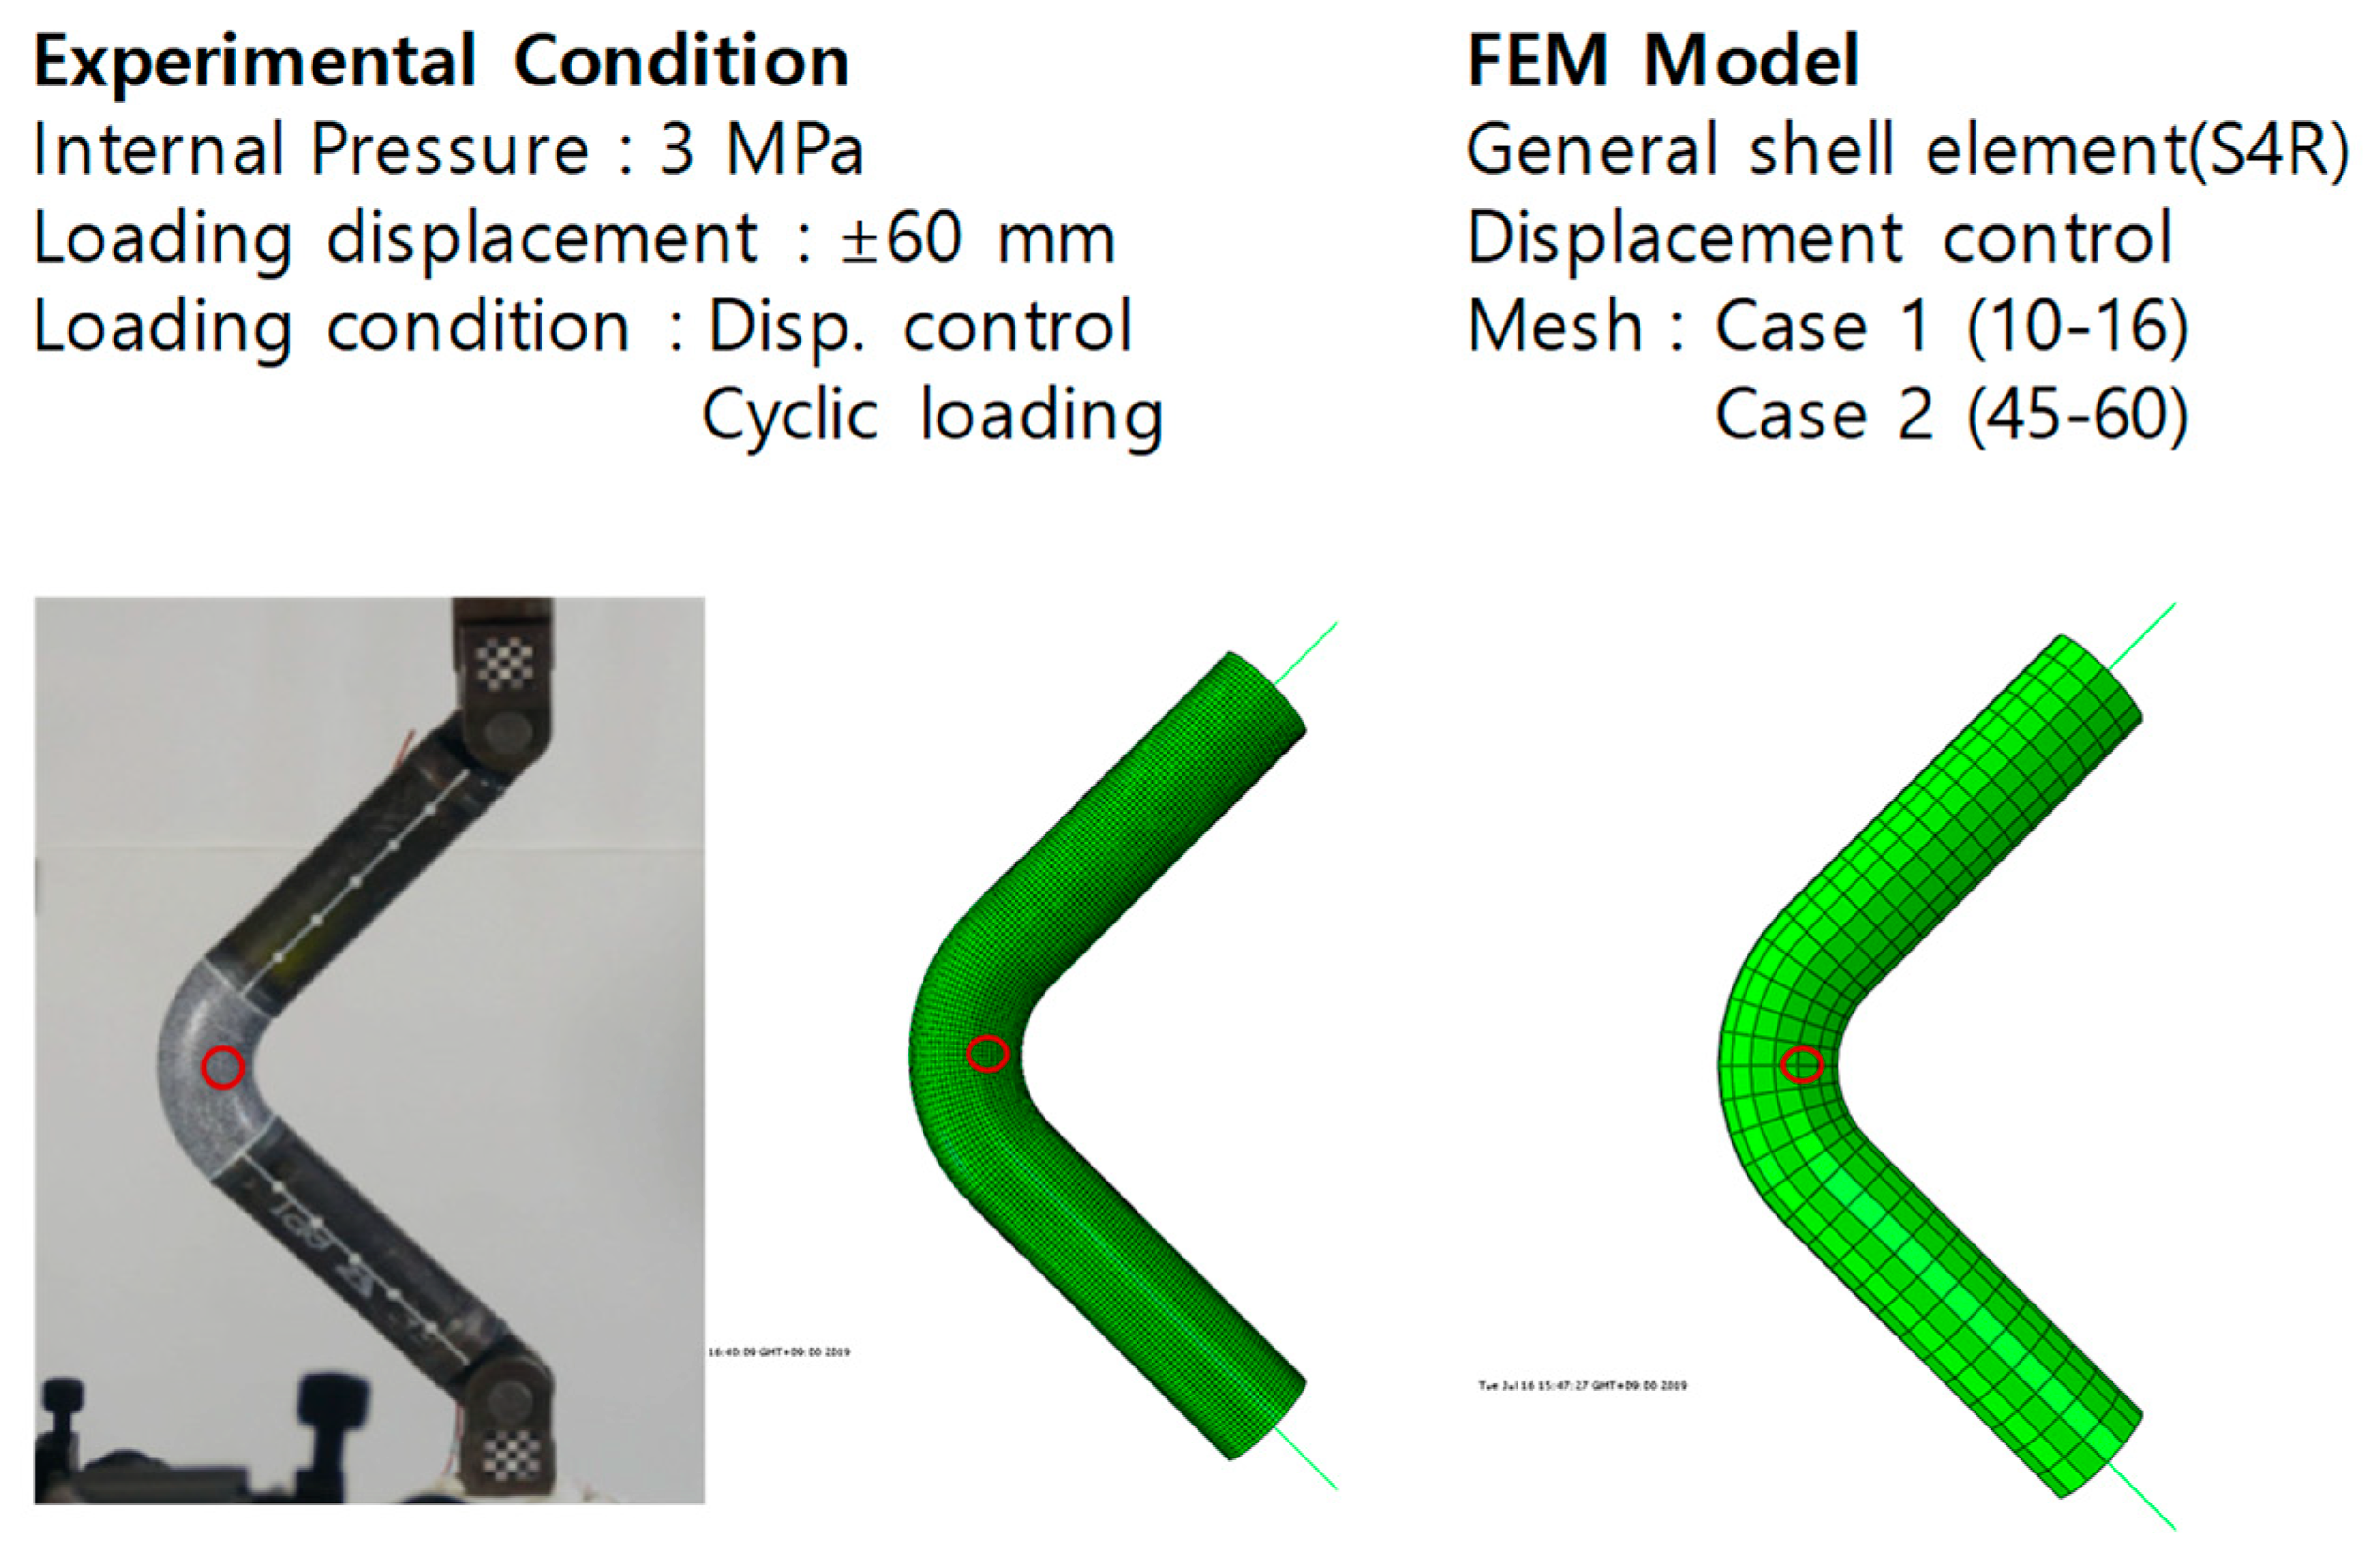
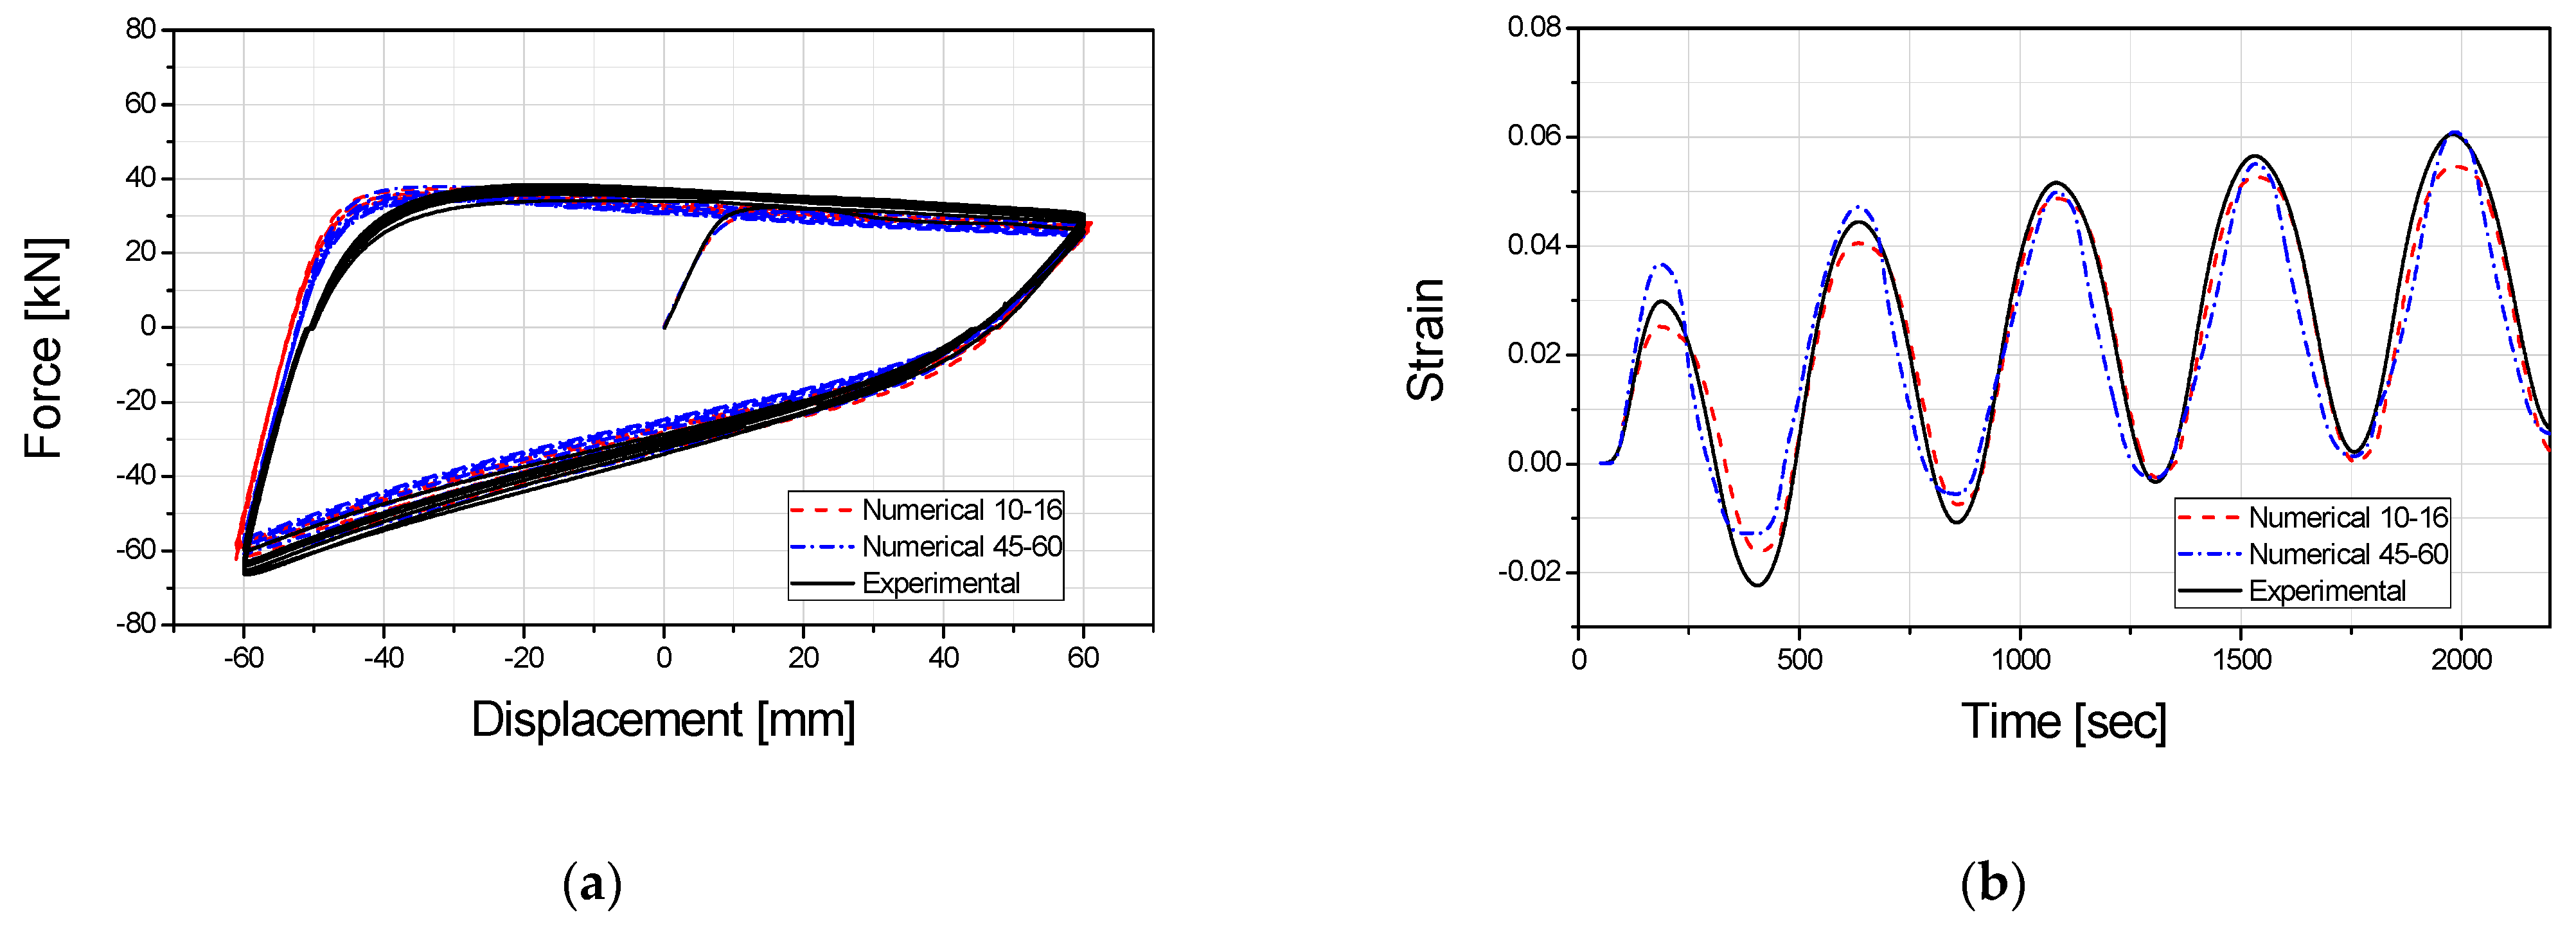
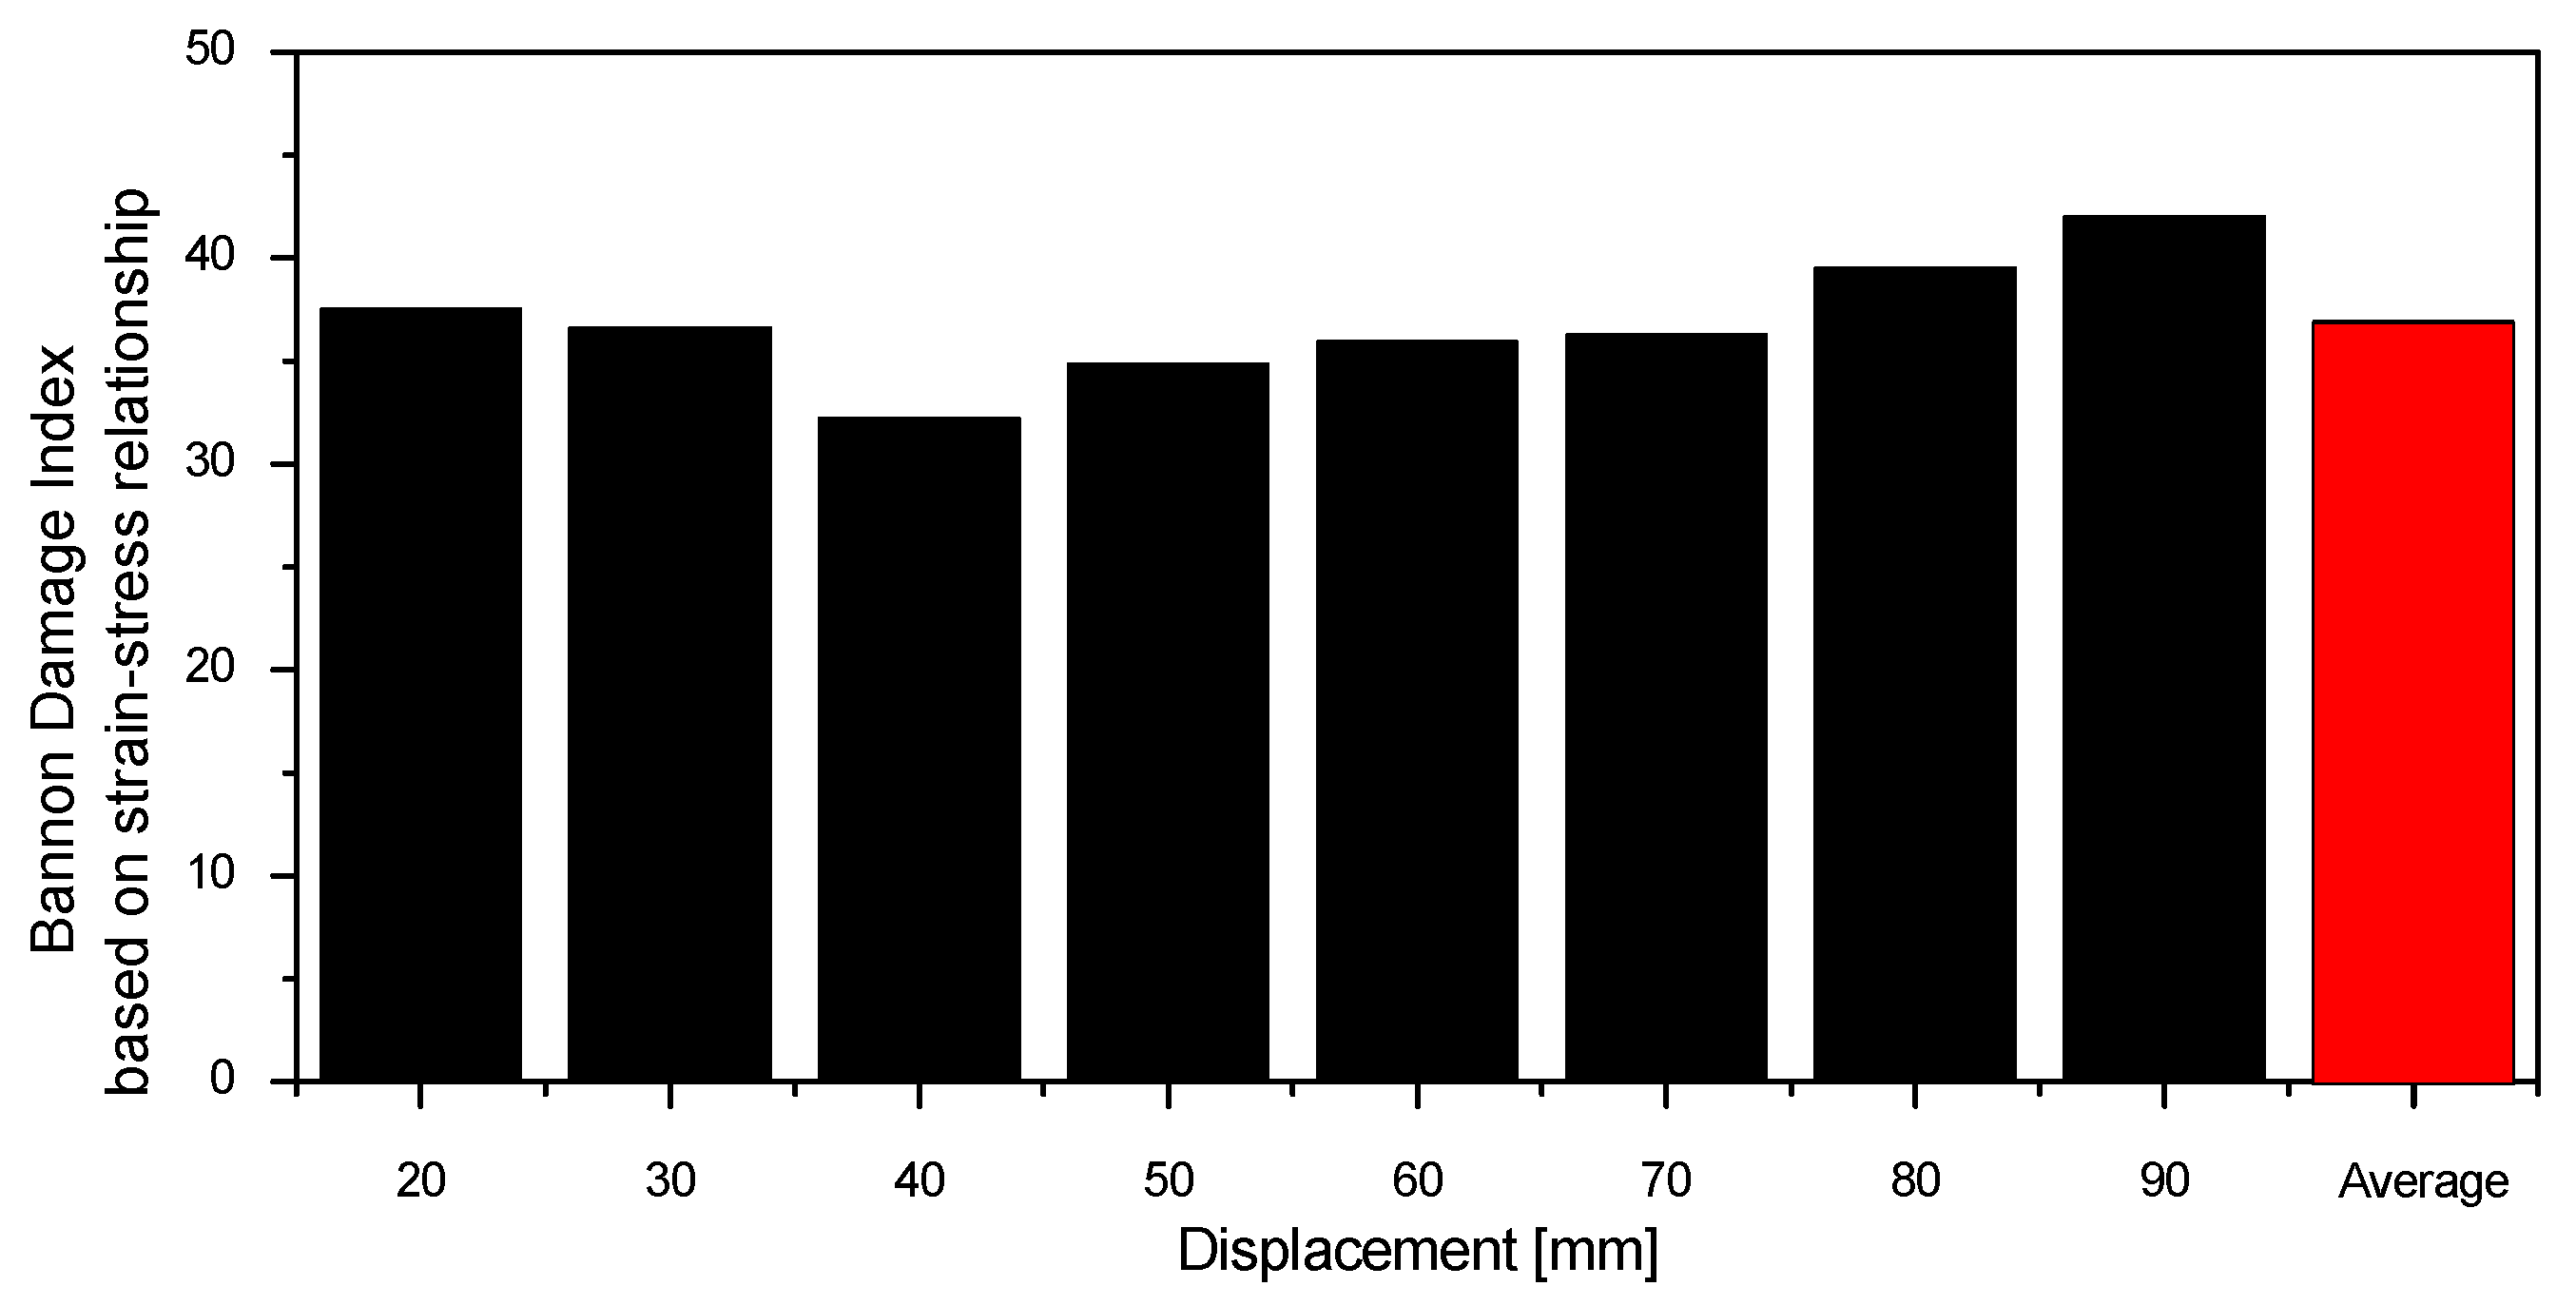
Cracks in the pipe elbow occurred on the inner surface of the crown and grew axially. Hoop strain was dominant. Hence, the hoop strain was used to define the failure of the pipe elbow. The numerical analysis model of the piping was constructed using shell elements. The mesh size was composed of 10–16 elements and 45–60 elements in the longitudinal and circumferential directions, respectively, and analysis was conducted under the same conditions as the test. Figure 5 compares the response of the ±60 mm test case. In the case of the force–displacement relation, the analysis results and test results showed good agreement. The damage index was calculated using Equation (1) from finite element analysis, and the average of the damage index was 35.25, as shown in Figure 6.
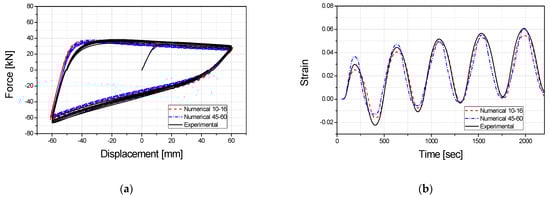
Figure 5.
Comparison of the experimental and finite element analysis results: (a) comparison of the force–displacement response; (b) comparison of the strain response.

Figure 6.
Damage index of a carbon steel pipe elbow.
3. Seismic Performance of Piping Systems According to the Numerical Analysis Conditions
3.1. Finite Element Analysis Model and Seismic Response Analysis of a Piping System
Seismic response analysis was performed on piping installed in the containment building to which the seismic isolation system had been applied. The NRC-BNL benchmark model [18] was used for the pipe model, and an isolator was applied to the lower part of the containment structure. The containment structure and piping were connected, as shown in Figure 7. Table 3 shows the boundary conditions for isolated containment structures and piping systems. The seismic isolation device was assumed to behave linearly, and the natural frequency of the isolated structures was designed to be 0.5 Hz. Carbon steel of ASME (B36.10 M, SA106, Grade b, SCH 40) was used, and the material properties are shown in Table 4 [21]. The outer diameter of the pipe was 323.85 mm, the thickness was 9.525 mm, and the radius of the curved pipe was 457.2 mm. The damping ratio was assumed to be 4% (Rayleigh damping), referring to the damping ratio of the SSE (Safe Shutdown Earthquake)-based piping systems in Regulatory Guide 1.61 [22]. The responses of the structure and piping were derived by performing seismic response analysis unidirectionally (Z-axis).
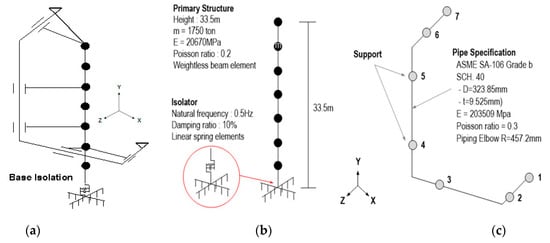
Figure 7.
Isolated containment structure and piping system: (a) connection of the isolated structure and piping system; (b) isolated containment structure; (c) piping system.
Table 3.
Boundary condition of the piping system.
Table 4.
Material properties of the piping system.
The five earthquake input motions that satisfy the requirements of ASCE 43-05 and the response spectrum of Regulatory Guide 1.60 were generated [23]. Figure 8 shows the target response spectrum for the horizontal unidirectional direction (Z direction) and the response spectrum for the generated input earthquake. Table 5 lists the information on the seed earthquake.
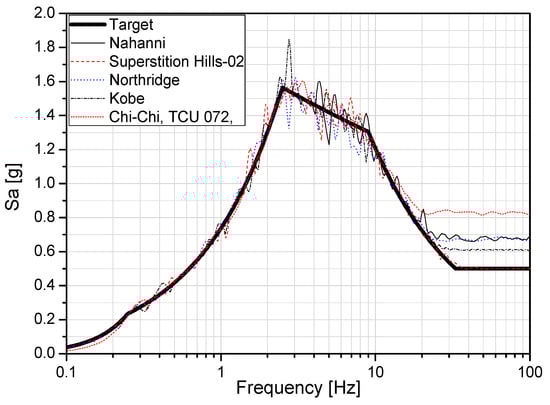
Figure 8.
Response spectra of the generated input earthquakes and target response spectrum.
Table 5.
Characteristic of the seed earthquake.
Detailed finite element analysis of the piping was performed from the seismic response analysis results of the model, in which the structure and piping were connected. Shell elements express the elliptic deformation and distortion behavior in the detailed finite element analysis of piping. The displacement response was derived from the location where the piping was installed in the structure and entered to the support of the piping system. The nonlinear seismic response analysis of the piping system was performed in the following order: (1) First, the design internal pressure was applied, and (2) seismic response analyses (direct integration method) were performed while maintaining the stress due to the internal pressure.
The pressure applied inside the piping was calculated using Equation (2), which is represented in the Boiler & Pressure Vessel Code of ASME (American Society of Mechanical Engineers):
where σdesign is a design stress intensity value; Ip is the design internal pressure; t is the thickness of the pipe; d is the diameter of the pipe.
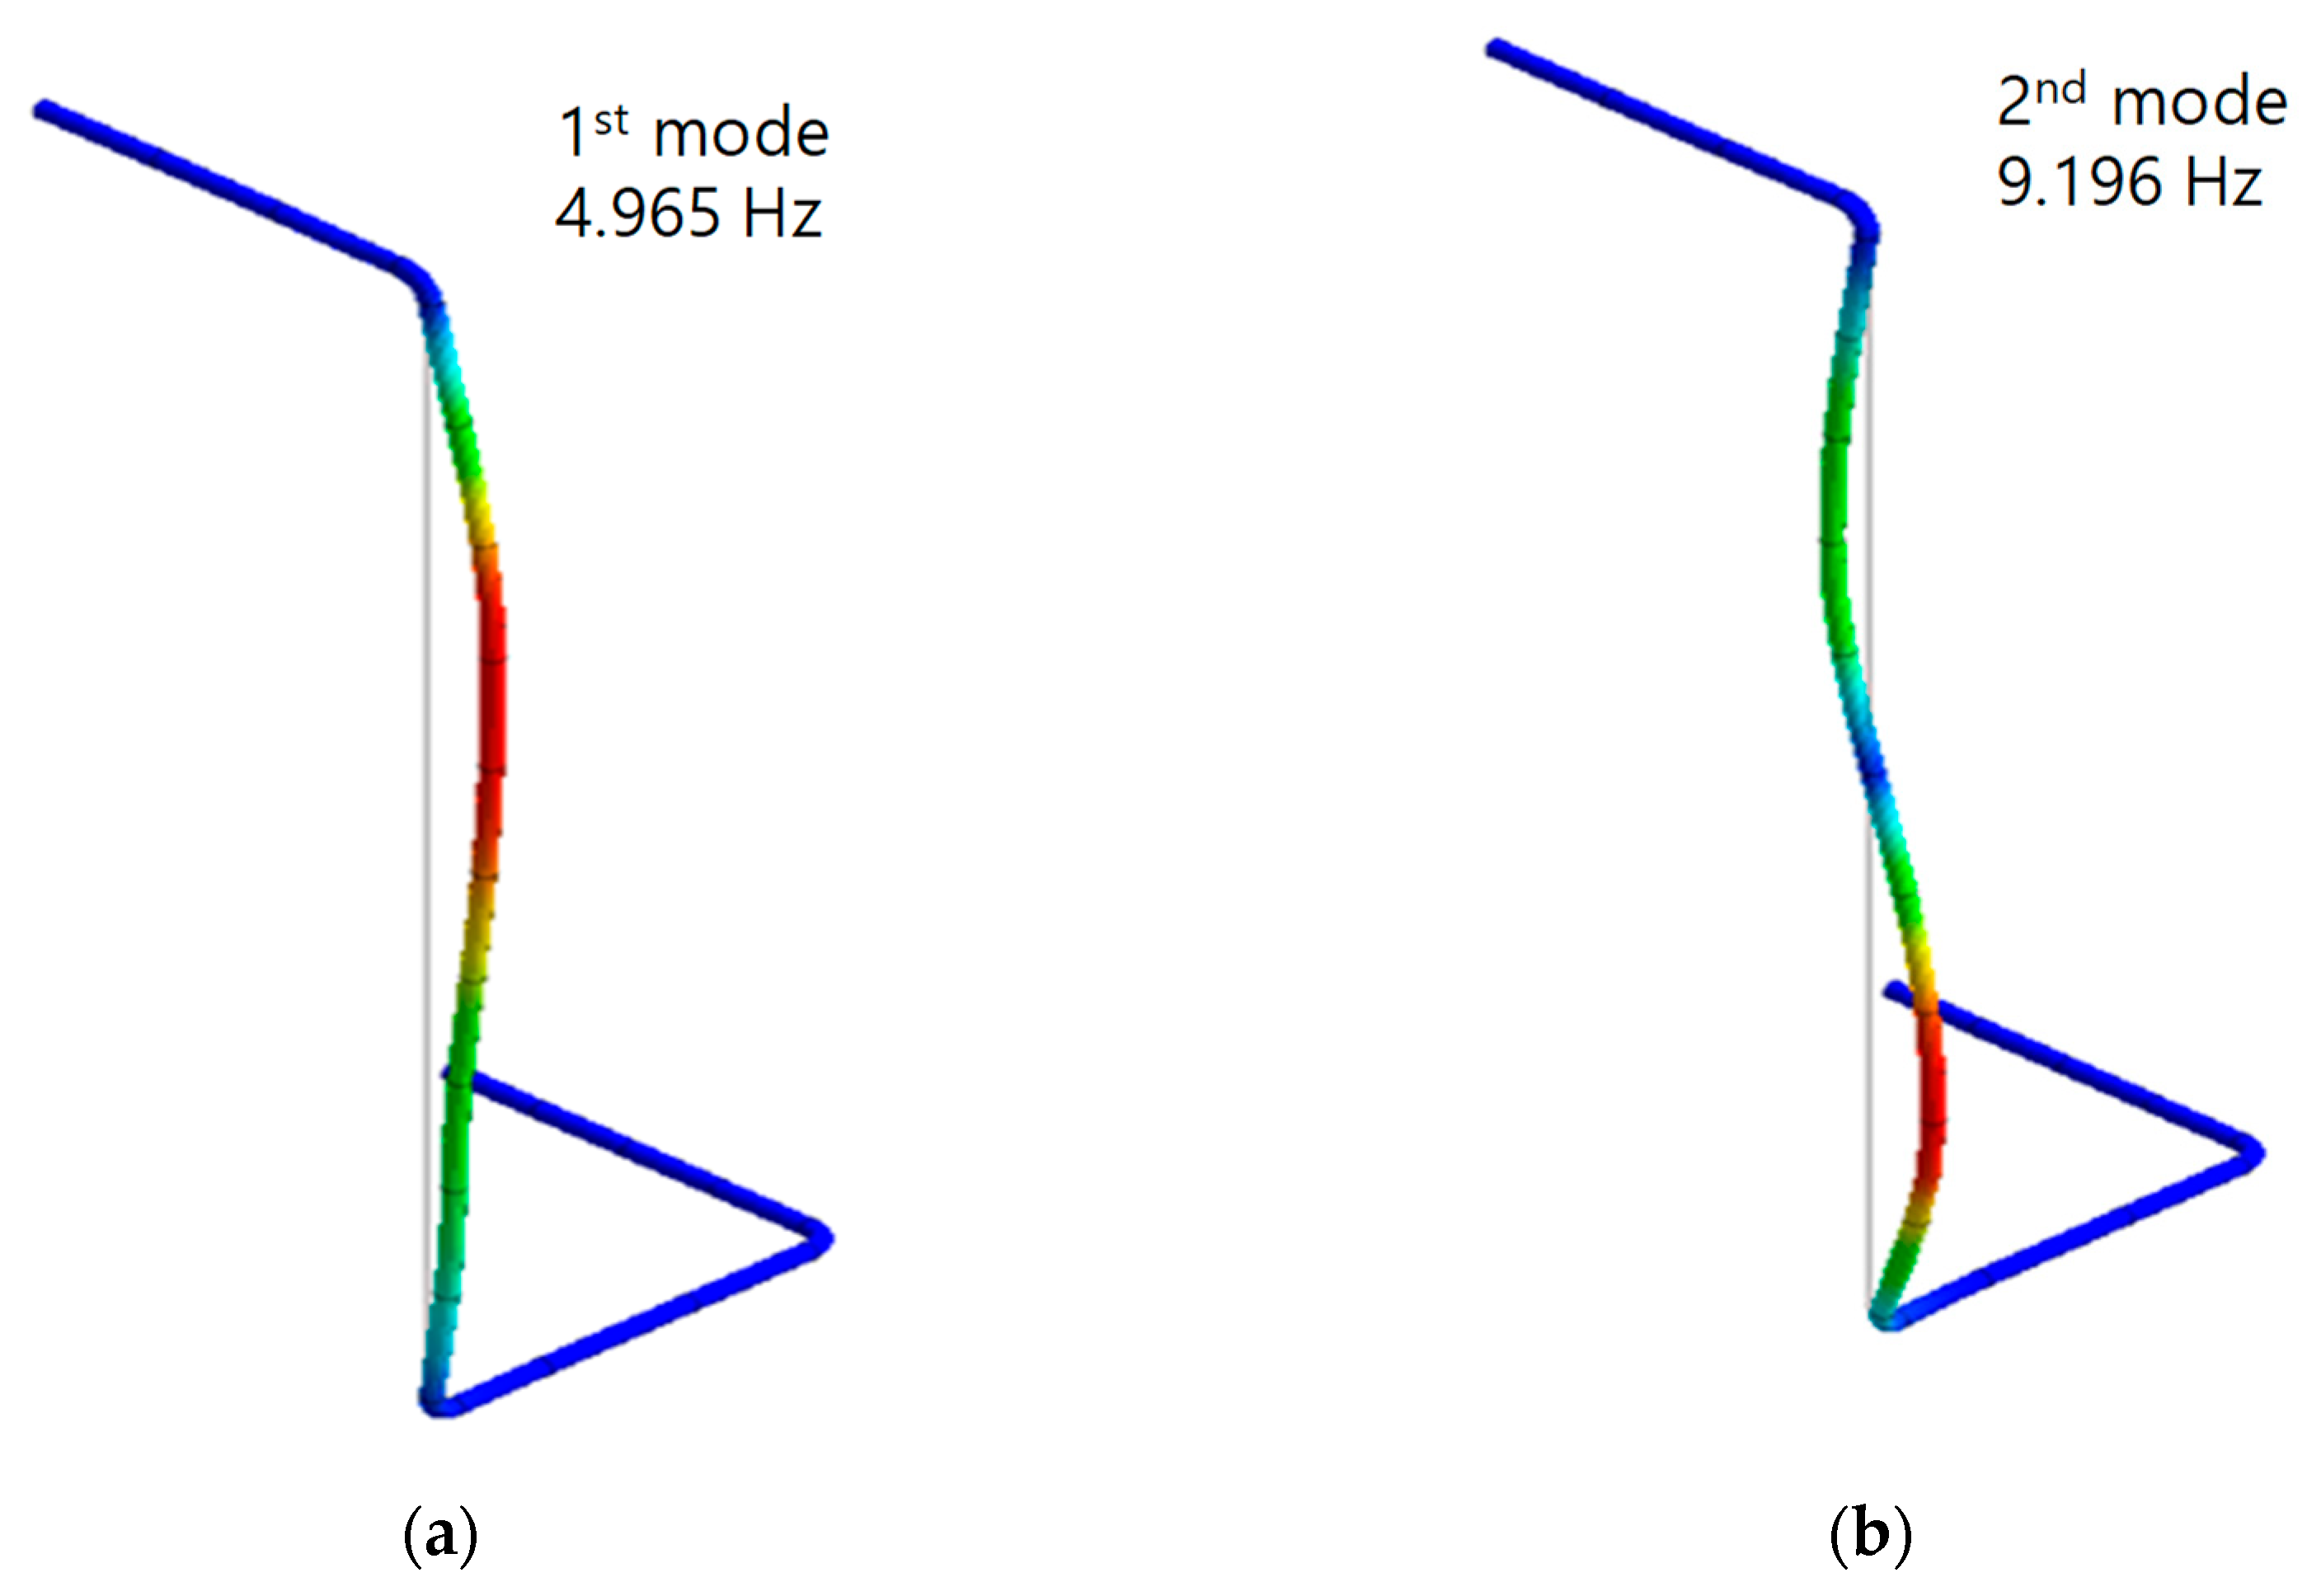
The design stress intensity value was 110 MPa, and the internal pressure was 6.31 MPa, and were applied to the pipe system, referring to the Boiler & Pressure code. Figure 9 presents the natural frequency and mode shape of the piping. The natural frequencies of the primary and secondary modes were 4.965 Hz and 9.196 Hz, respectively.
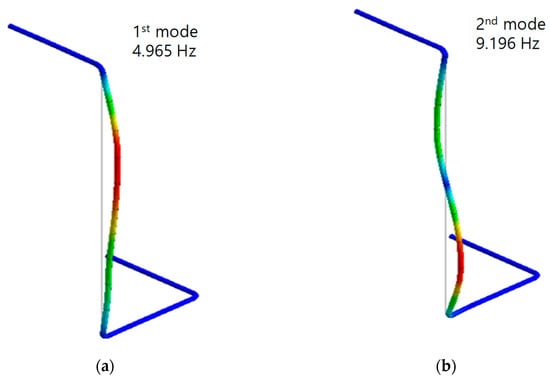
Figure 9.
Natural frequency and mode shape of the piping system: (a) 1st mode; (b) 2nd mode.
3.2. Effect of Number of the Mesh (Mesh Size) for Piping System
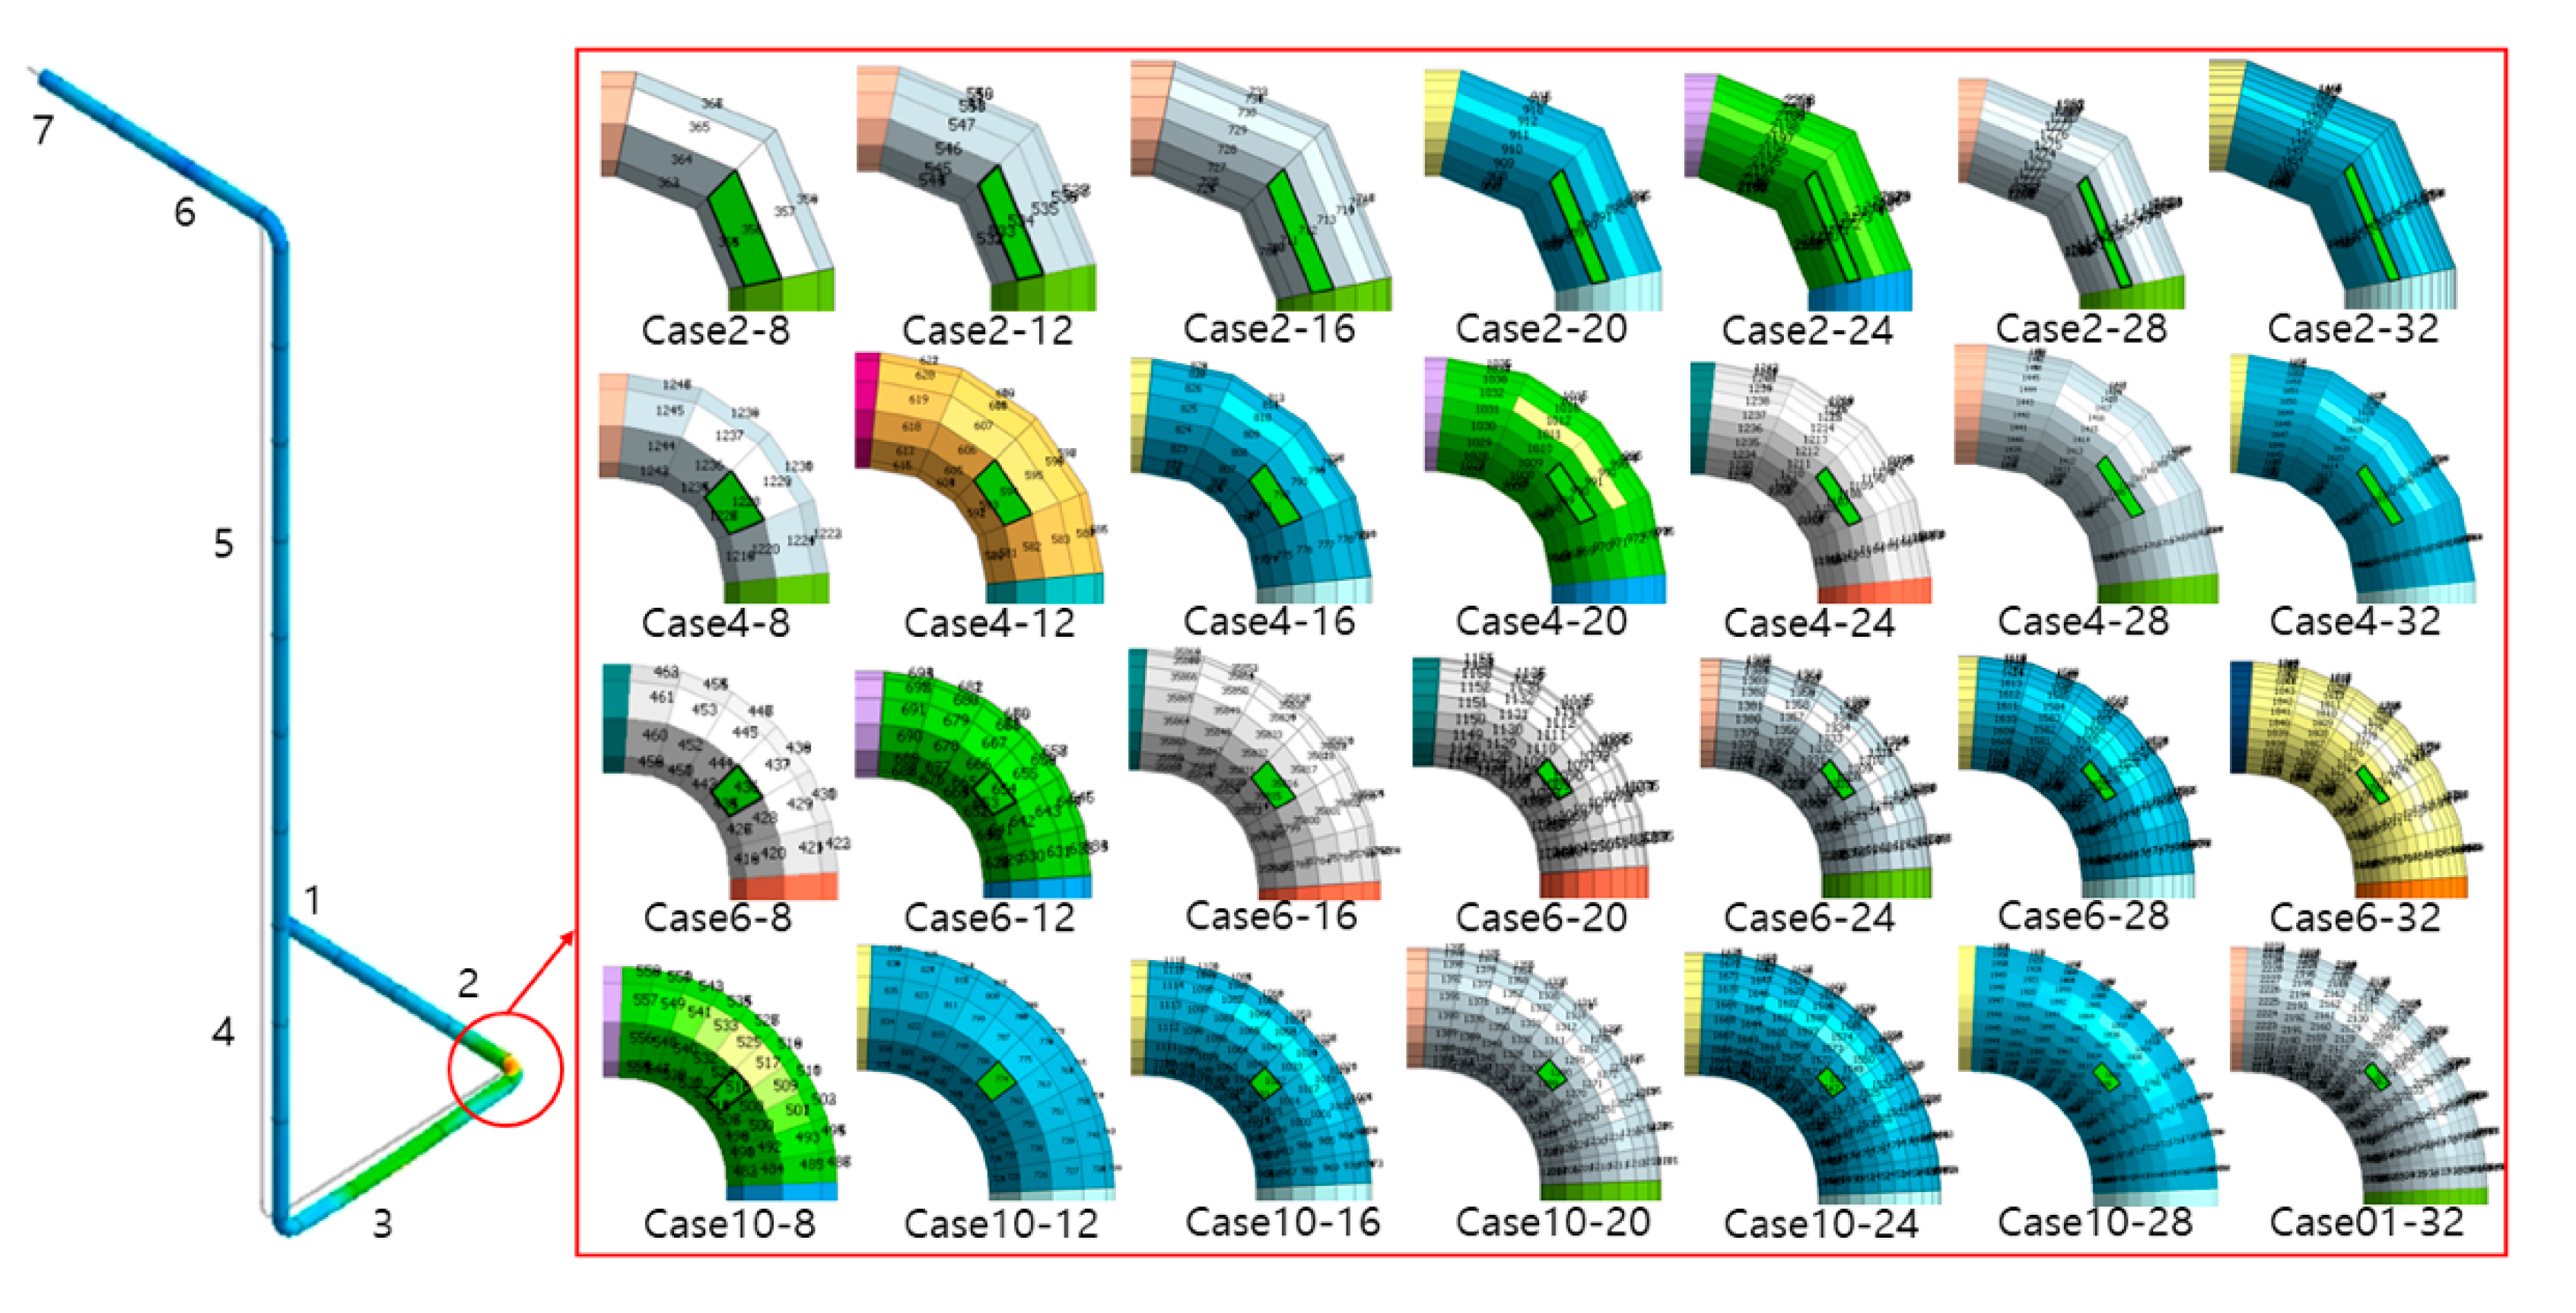
The piping system was modeled as a shell to examine the changes in the stress and strain of the pipe according to the change in mesh size. Such a numerical model was verified by a comparison with the test results in Section 2.2. The weak part of the piping is the elbow part. Therefore, the number of elements in the longitudinal and circumferential directions of the shell elements of the pipe elbow was adjusted. As shown in Figure 10, numerical analysis was performed by dividing the length direction and circumferential direction from 2 to 10 elements and 8 to 32 elements, respectively. All conditions except the number of elements for a pipe elbow were applied in the same way to check only the change in the stress and strain of the pipe according to the number of meshes (mesh size).
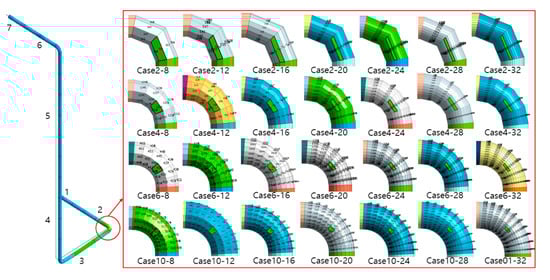
Figure 10.
Pipe finite element model according to the number of elements.
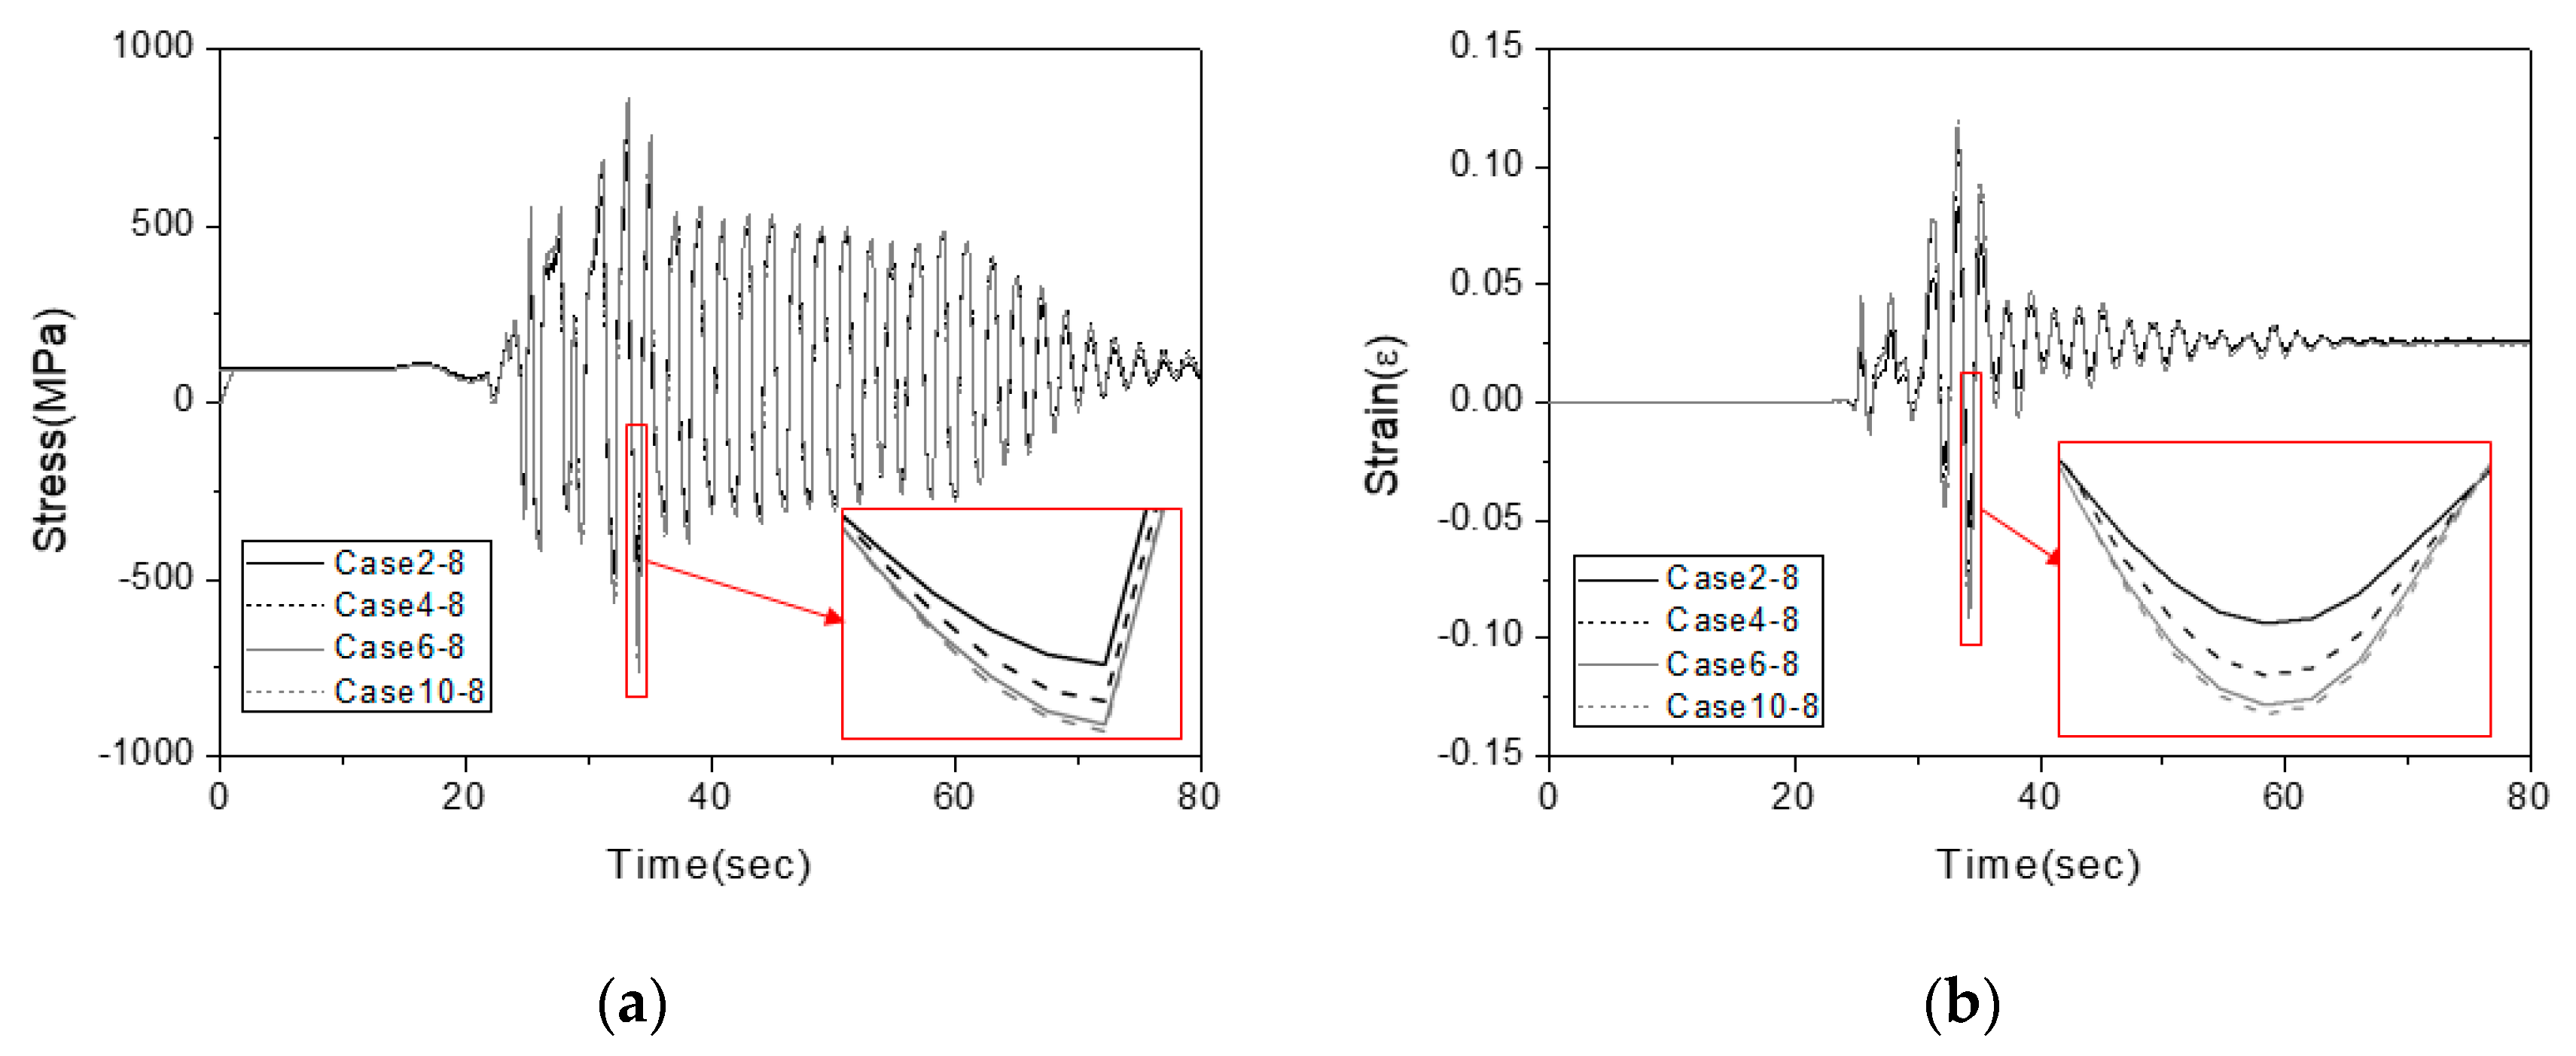
Point 1 in Figure 10 was installed on the ground; the other locations were installed in the building. The positions constrained in the Z direction were points 3 and 7. The elbow crown between points 2 and 3 was identified as the most vulnerable. The stress and strain were derived, as shown in Figure 11 and Figure 12. Table 6 and Table 7 list the maximum values of strain and stress for the size of the mesh. As shown in Figure 11, the change in the size of elements in the longitudinal direction confirmed that the response increased with increasing number of elements in the longitudinal direction. A test on the number of elements in the circumferential direction confirmed that the response increases with increasing number of elements, as shown in Figure 12. The area where the stress is concentrated decreases with increasing number of elements, and the response tends to increase.
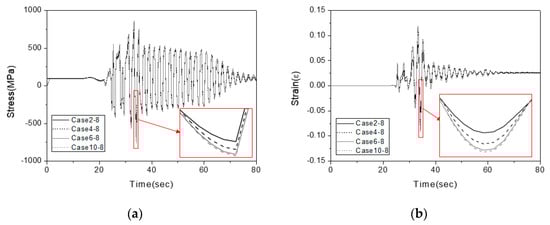
Figure 11.
Comparison according to the change in the lengthwise element size: (a) stress; (b) strain.
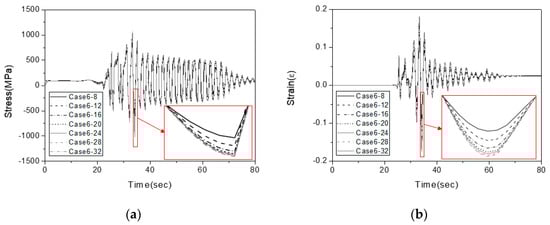
Figure 12.
Comparison according to the change in the circumferential element size: (a) stress; (b) strain.
Table 6.
Comparison of the maximum stress in the piping system.
Table 7.
Comparison of maximum strain in the piping system.
3.3. Effect of Convergence for Piping System
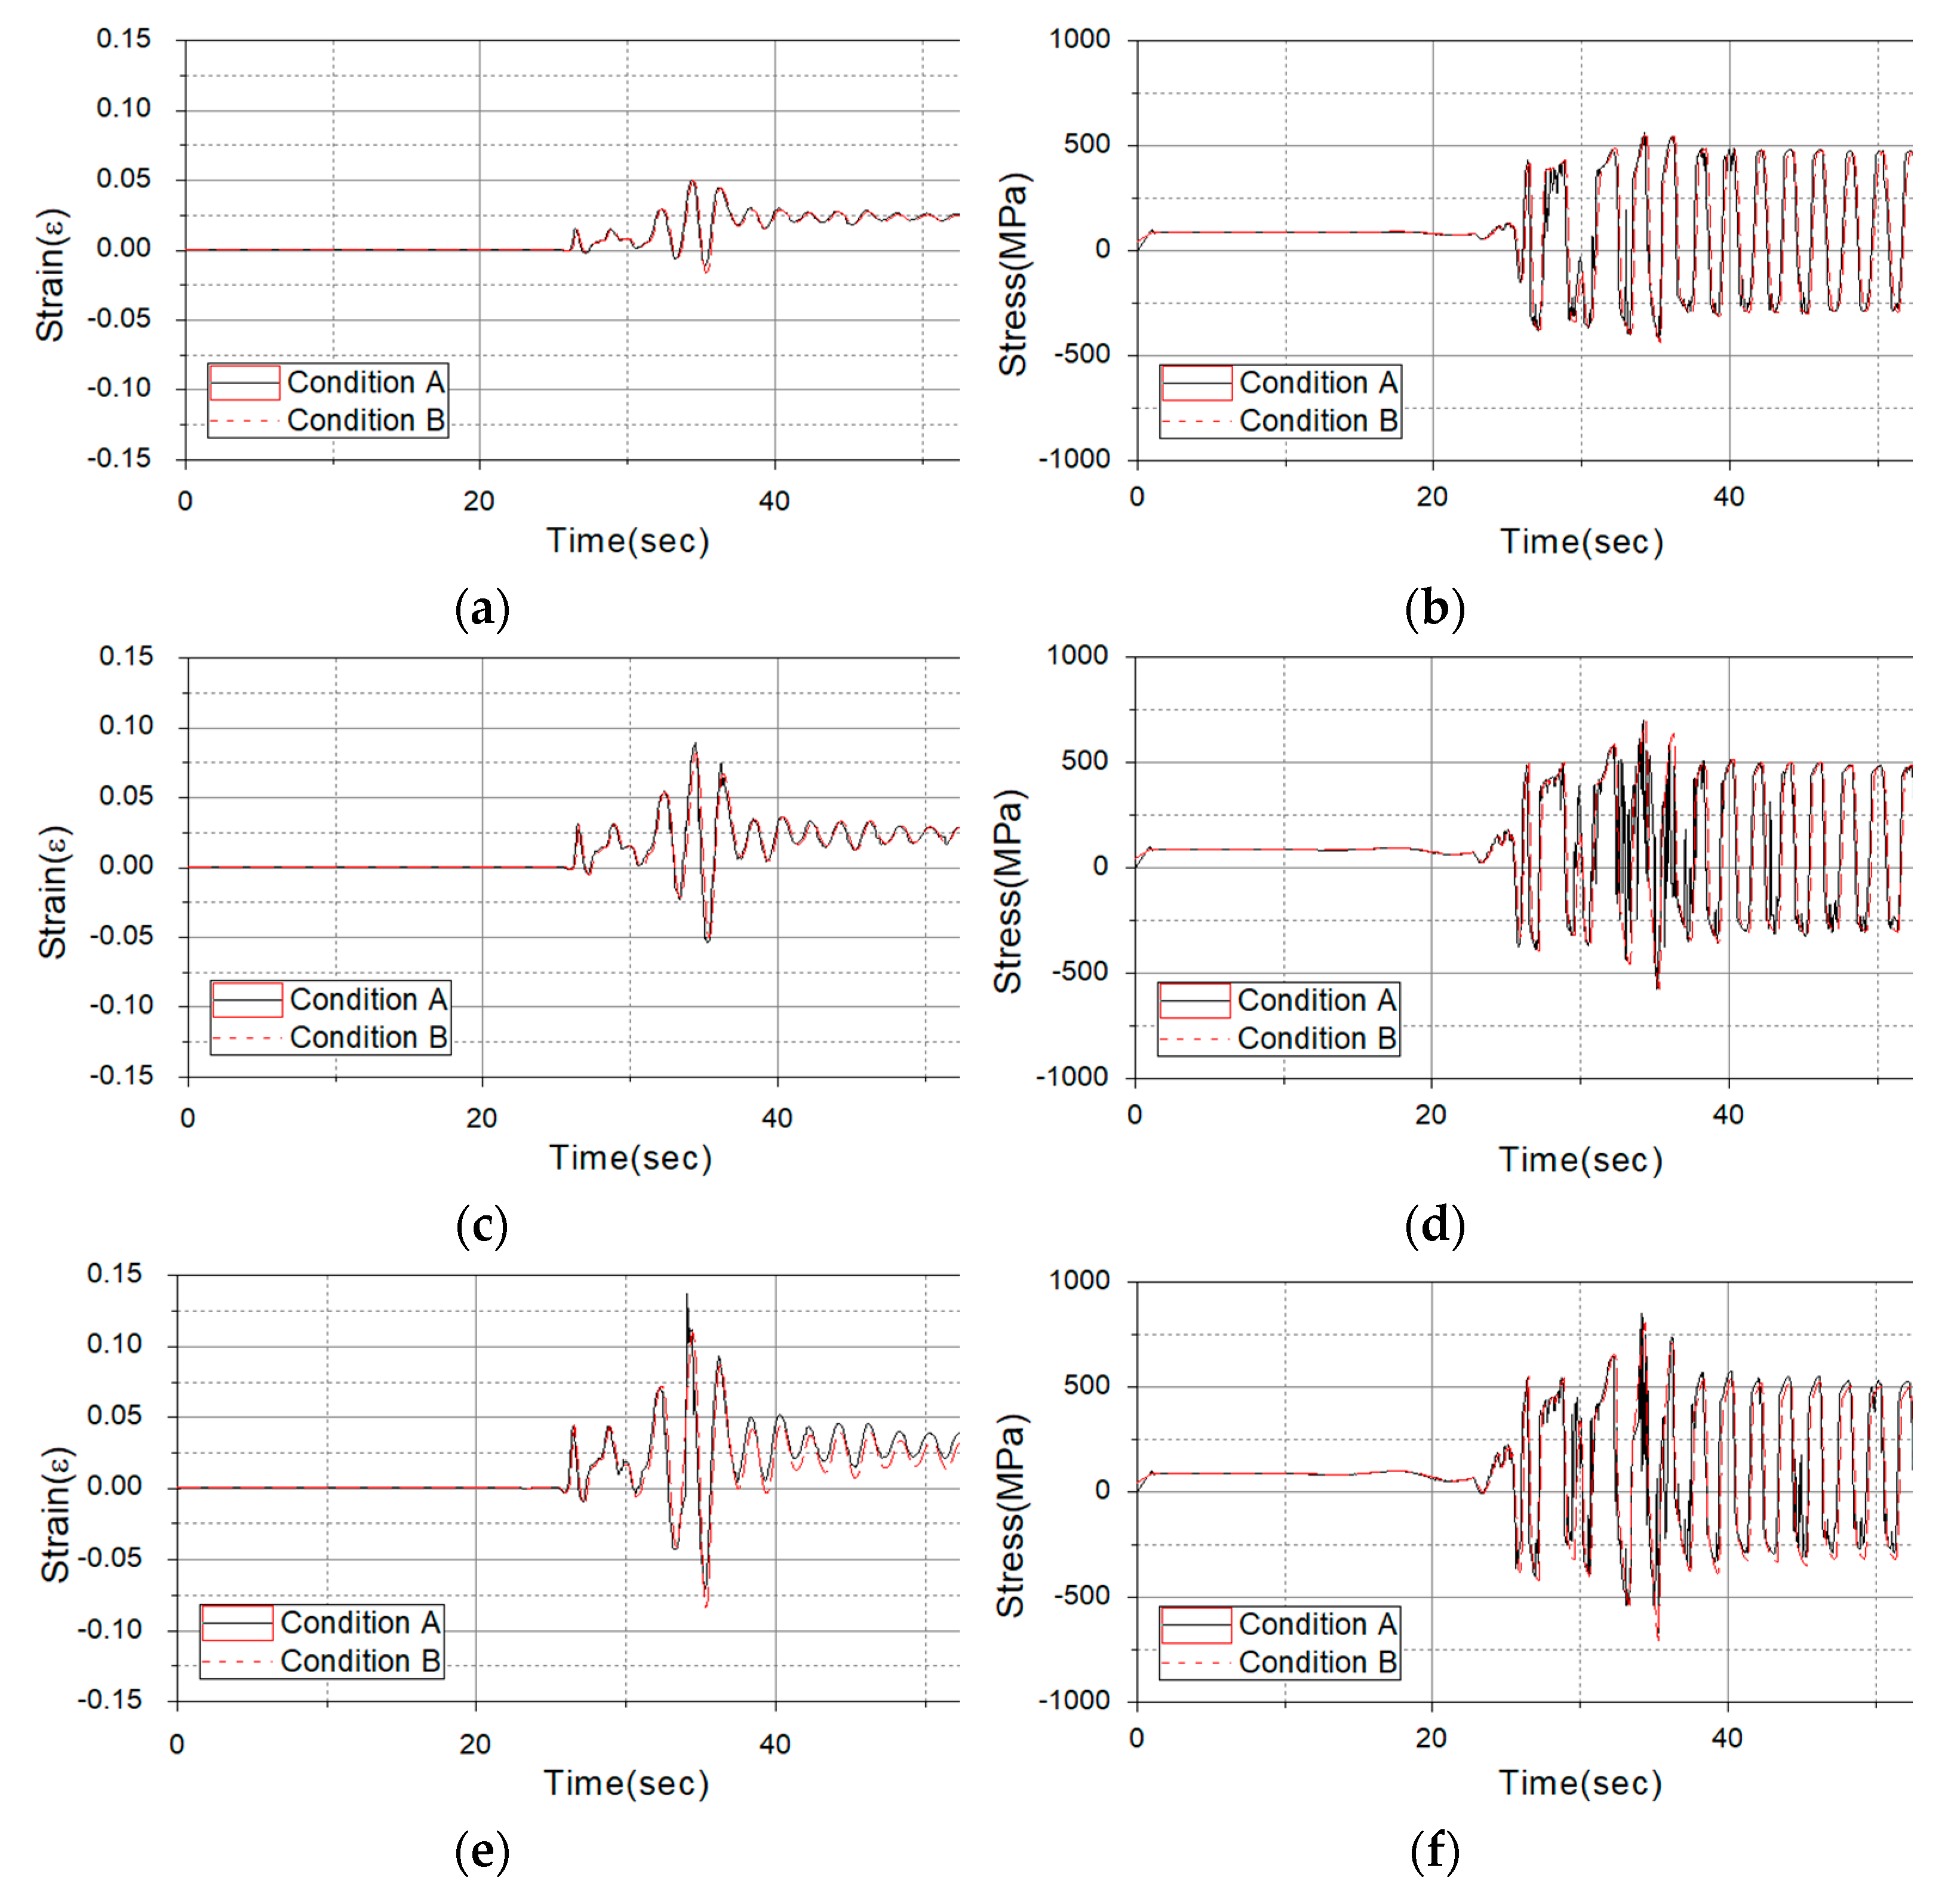
The seismic performance of piping according to the convergence conditions of nonlinear dynamic analysis was analyzed. The Newton-Raphson methodology was used as a convergence method for nonlinear dynamic analysis. In the piping system model, the number of meshes in the elbow was 8 in the longitudinal direction and 12 in the circumferential direction. Convergence “condition A” was performed with a forced convergence when repeated more than 16 times, and convergence “condition B” was performed with forced convergence when repeated more than 48 times. Nonlinear seismic response analysis compared the convergence “condition A” and convergence “condition B” to confirm the change in the result according to the convergence condition. The elbow crown between points 2 and 3 was identified as most vulnerable. Figure 13 compares the strain and stress of convergence “condition A” and convergence “condition B” in the elbow crown caused by the Northridge earthquake. To compare the analysis results of convergence “condition A” and convergence “condition B”, the percentage difference was calculated using Equation (3), and the RMS (Root Mean Square) difference was calculated using Equation (4).
where n is the number of analysis data; A is the response analyzed by convergence “condition A”; and B is the response analyzed by convergence “condition B”. The stress and strain of the piping were checked by varying the five input earthquakes and the PGA (Peak Ground Acceleration) level (1 g, 2 g, and 3 g). Table 8 compares the stress and strain calculated through nonlinear dynamic analysis of the pipe. The average percentage difference in strain was 6.38%, and the RMS difference in strain was 0.006227. The average percentage difference was 25.58% in stress, and the RMS difference in stress was 153.61 N/mm2. Even if the PGA was the same earthquake, the response varied according to the earthquake. If the input earthquake was the same, the difference in response increased with increasing size of the PGA. Therefore, the difference in response is dependent on the size of the PGA and input earthquake.
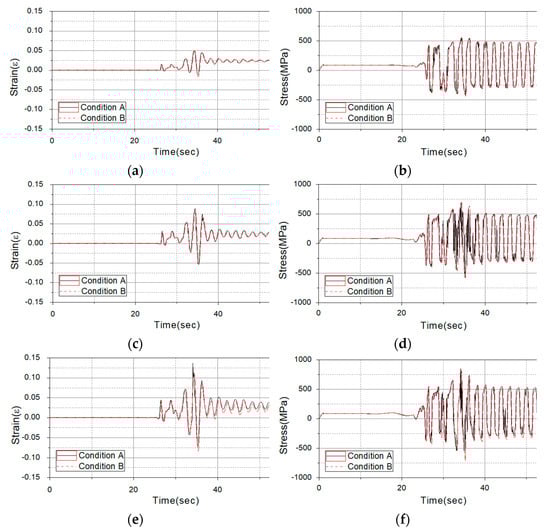
Figure 13.
Comparison of the convergence “condition A” and convergence “condition B” analysis results (Northridge earthquake): (a) comparison of the stress (PGA level: 1 g); (b) comparison of the strain (PGA level: 1 g); (c) comparison of the stress (PGA level: 2 g); (d) comparison of the strain (PGA level: 2 g); (e) comparison of the stress (PGA level: 3 g); (f) comparison of the strain (PGA level: 3 g).
Table 8.
Difference in the stress and strain of piping according to the convergence conditions.
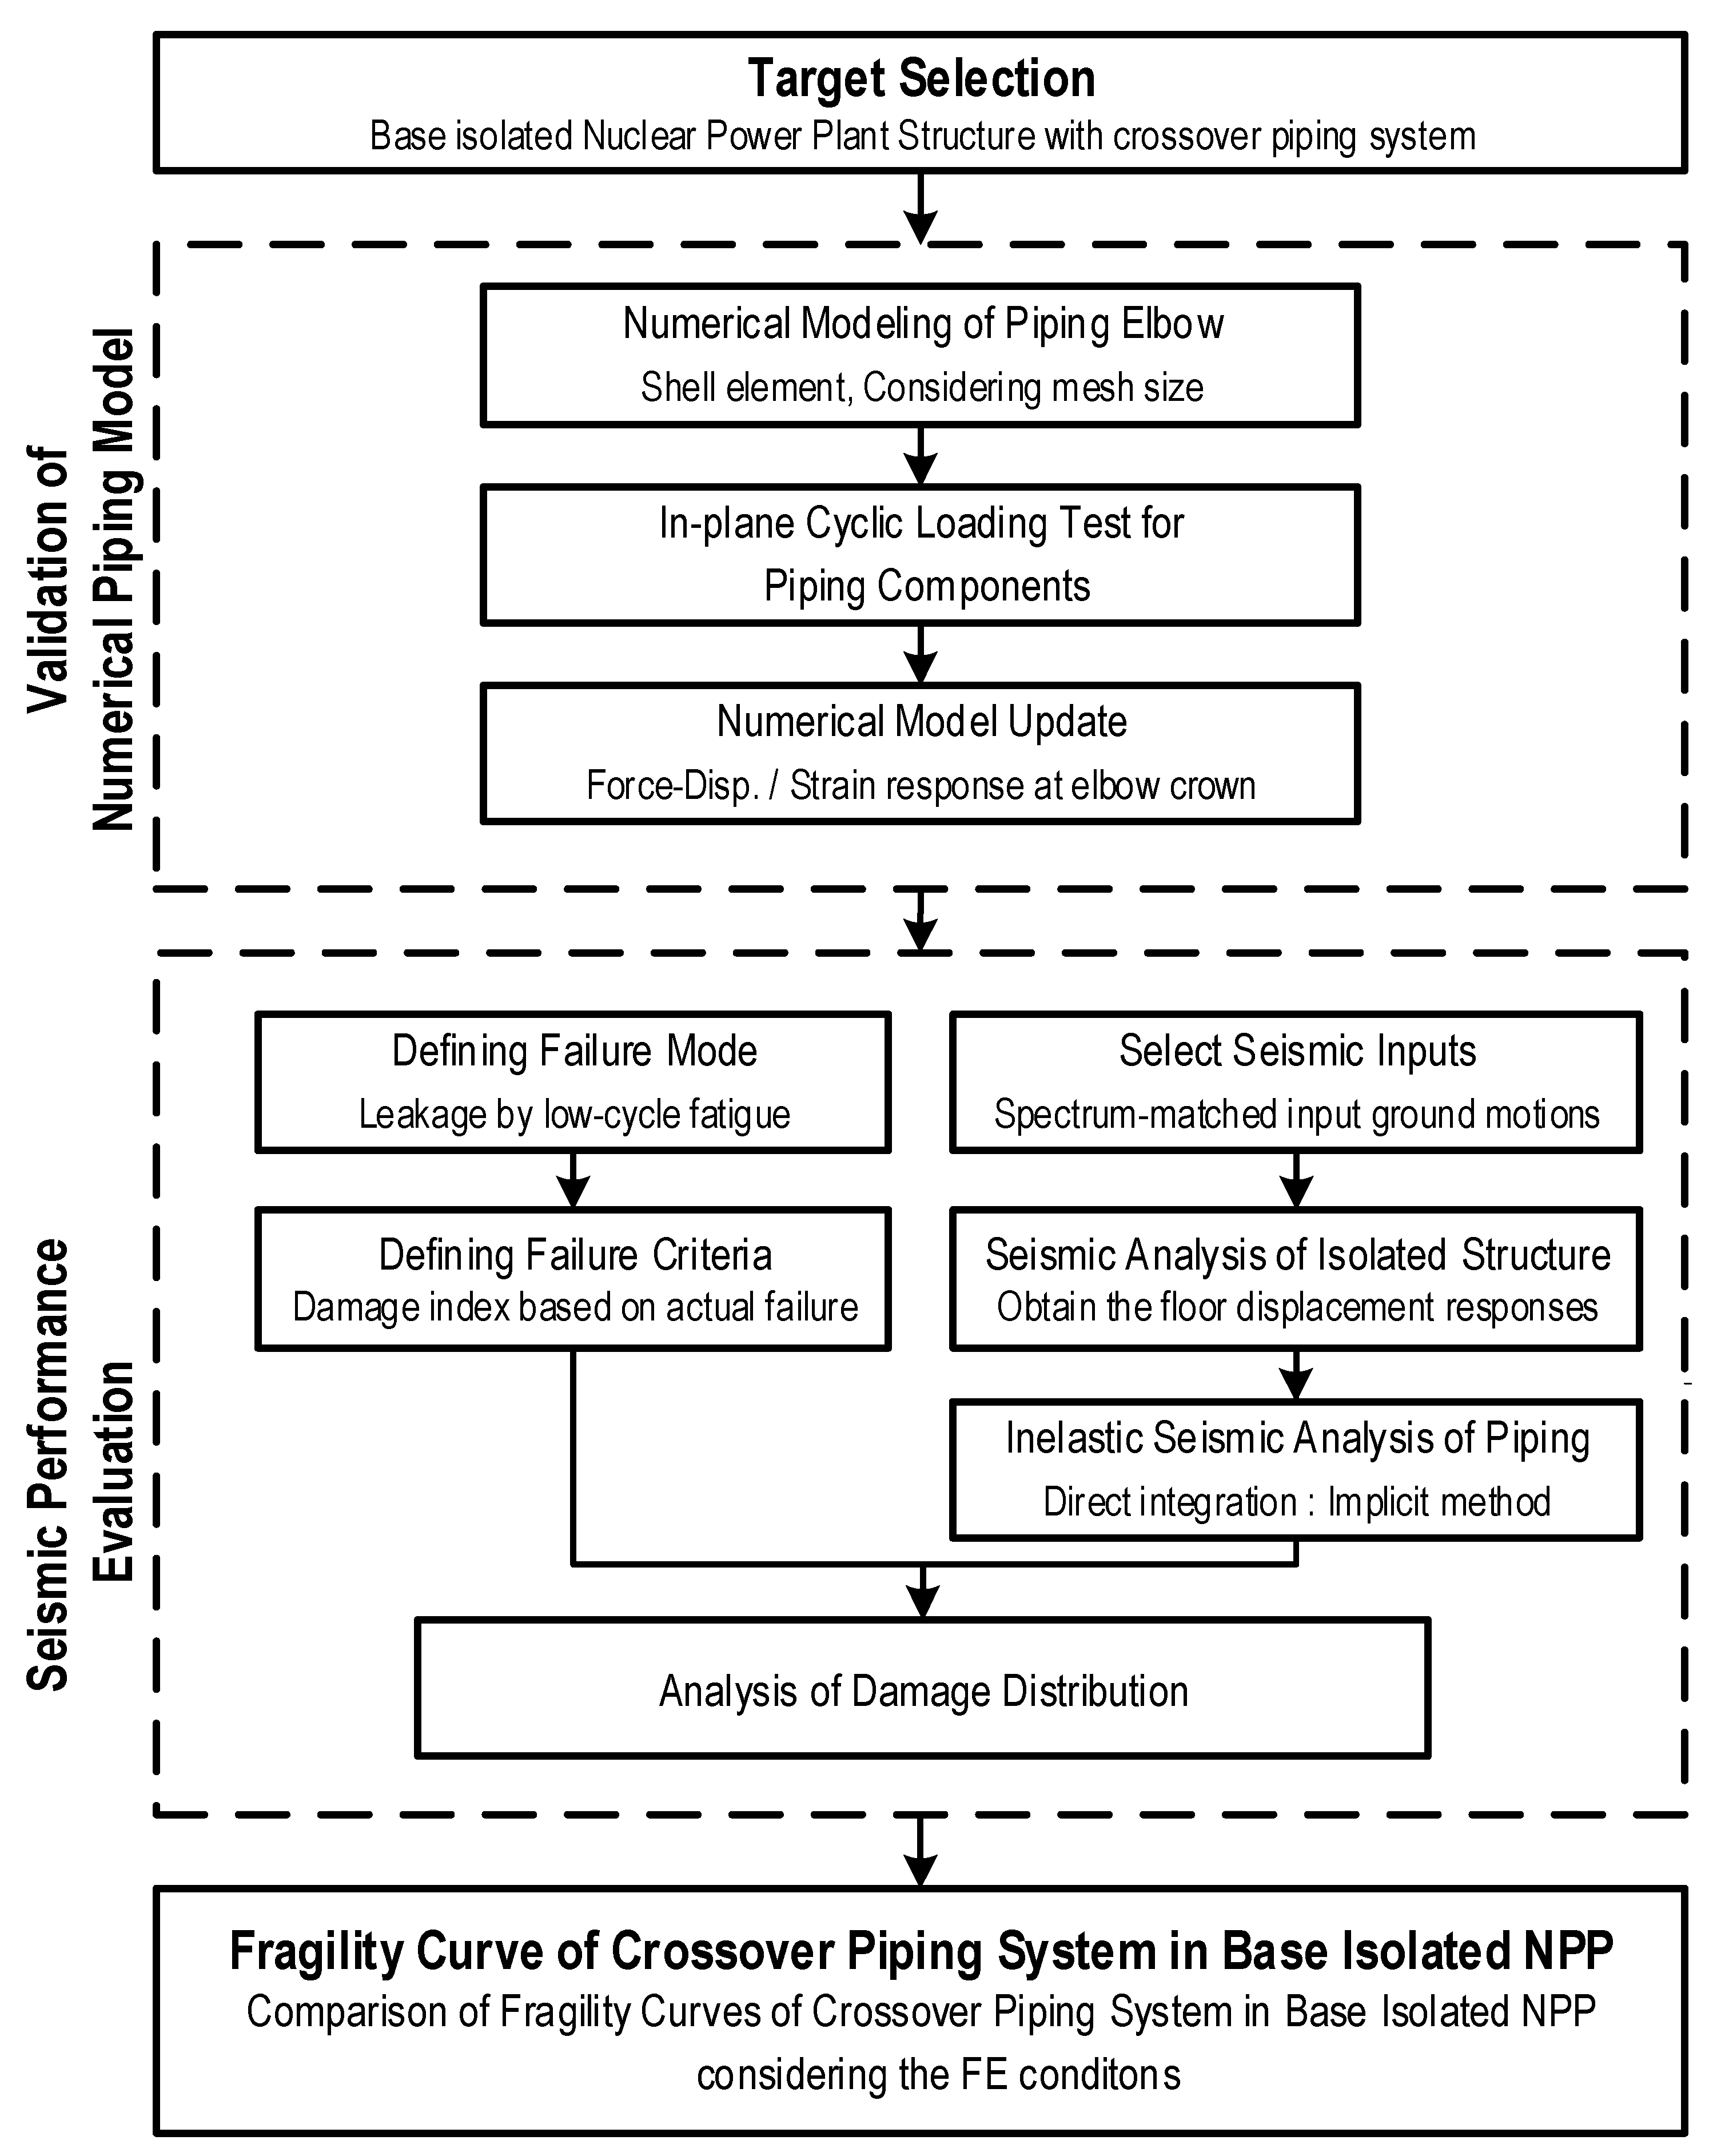
The seismic performance of piping under two different convergence conditions was analyzed. A seismic fragility curve was calculated to assess the seismic performance of the piping system, and the seismic fragility was determined using the procedure in Figure 14. First, a piping system was selected to analyze the seismic fragility, and the most vulnerable part of the piping elements was identified. The finite element model was then updated for the numerical analysis using the cyclic loading test for the weak piping elements. The response of the piping installation position was derived from the experiments and the numerical analysis of the building. Finally, the seismic fragility curves were derived using the damage index that indicated the failure of the piping systems.
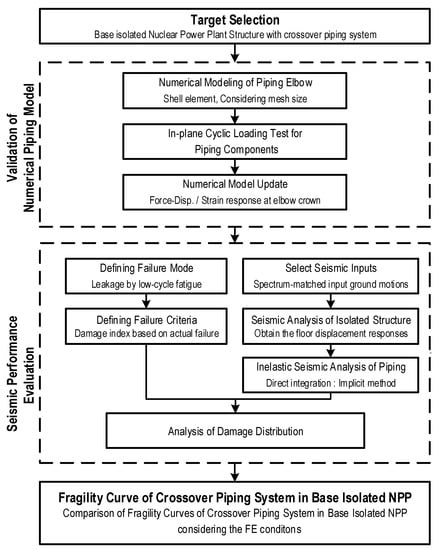
Figure 14.
Procedure for calculating the seismic fragility curve of a piping system.
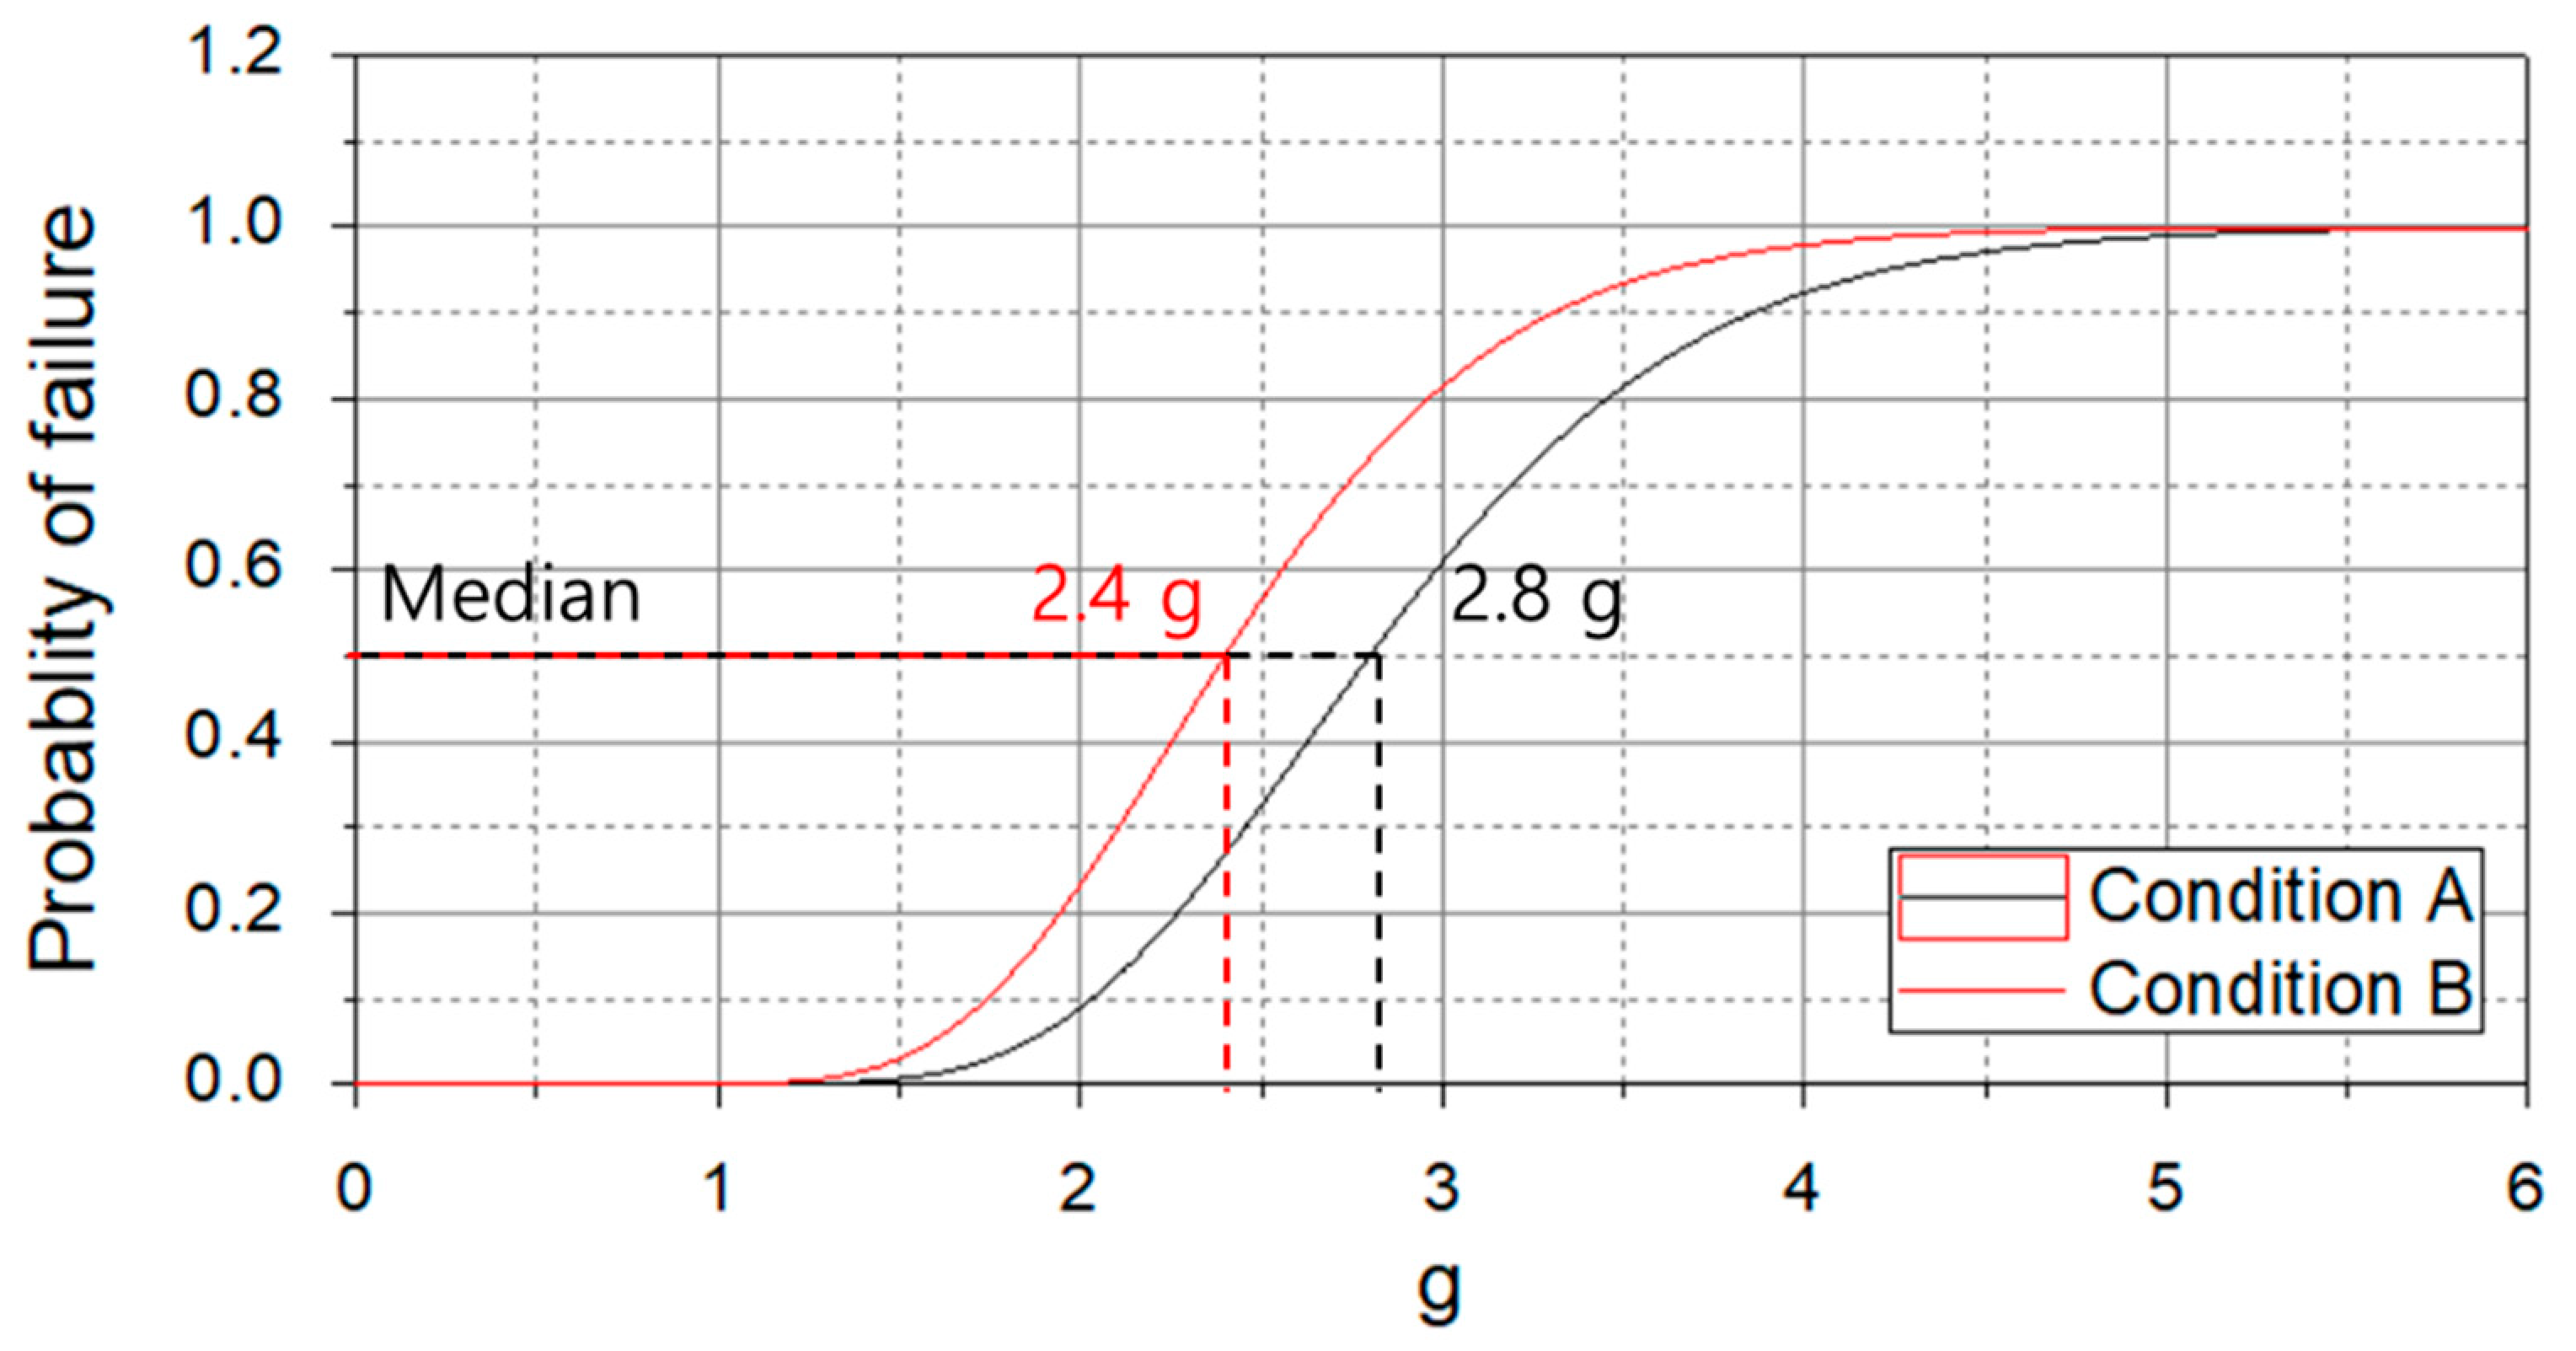
The seismic fragility curve of the piping was checked by varying the five input earthquakes and PGA levels (1 g, 2 g, and 3 g). The damage index was 35.25, which was calculated in Section 2. The seismic fragility curve was represented by a lognormal distribution, which confirmed a difference between the results of convergence “condition A” and “condition B”, as shown in Figure 15. Therefore, when deriving the seismic performance of piping through numerical analysis, differences occur in the results depending on the convergence conditions. The median value of the seismic fragility curve under convergence “condition A” and “condition B” was 2.8 g and 2.4 g, respectively, showing a difference of 0.4 g. Therefore, in this study, the seismic performance of the pipe was overestimated when the iteration is small for convergence.
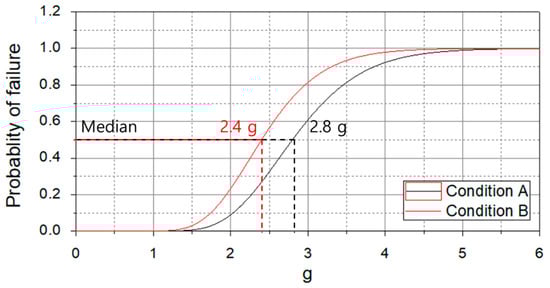
Figure 15.
Seismic fragility curve of the piping system due to the convergence condition.
4. Conclusions
This study examined the effect of evaluating the seismic performance of piping by varying the numerical analysis conditions, i.e., a mesh size and convergence conditions in the nonlinear dynamic analysis (seismic response analysis). Pipe damage was defined as leakage caused by penetrating cracking. A low cycle fatigue test of a 3-inch elbow was performed to quantify piping damage and verify the finite element model of piping. Dynamic tests were performed until piping leakage occurred under various conditions. A finite element model of piping was developed and verified with test results. The damage index of the leak point due to the penetrating cracks was calculated using Bannon’s method from the test and numerical analysis results of the piping.
A numerical model was constructed for the piping system installed in the isolated containment building, and seismic response analysis was performed by varying the number of meshes. The stress and strain were lower when the number of elements was small based on numerical analyses. The seismic performance of the piping was underestimated when a small number of elements were used. On the other hand, the strain and stress were overestimated when a large number of elements were used, but the difference was negligible compared to the dynamic test result. Therefore, evaluating the seismic performance of piping using a numerical model with a small size of elements results in a slight overestimation of the actual results.
The seismic performance of piping according to the convergence conditions of nonlinear dynamic analysis was analyzed. Convergence “condition A” was forced convergence when repeated more than 16 times, and convergence “condition B” was forced convergence when repeated more than 48 times. Seismic response analysis was performed with five input earthquakes and several PGA levels (1 g, 2 g, and 3 g) to evaluate the seismic fragility curve of the piping system. The seismic response was similar between convergence “condition A” and convergence “condition B”, but a difference occurred in the stress–strain curves of the two conditions. As the damage index of the pipe utilizes the stress–strain curve, a difference occurred in the seismic fragility curves of the two conditions. The seismic capacity of the pipe increased with decreasing number of iterations of the convergence condition. Therefore, when performing numerical analysis, the convergence condition needs to be checked. In particular, when considering the actual failure, i.e., leakage through a crack, convergence should be checked for a large input motion that could cause failure.
Overall, the seismic performance of the piping could differ according to the numerical conditions of the piping. Moreover, the seismic performance of the piping can be overestimated if the number of elements and convergence are insufficient. Therefore, an appropriate number of elements and convergence conditions are required when evaluating the seismic performance of a pipe using a numerical analysis technique.
Author Contributions
Formal analysis, B.J., D.H. and S.E.; Writing—original draft, S.C., B.J., D.H. and S.E.; Writing—review & editing, S.K. and S.E. All authors have read and agreed to the published version of the manuscript.
Funding
This research was funded by KETEP, grant number 20201510100010, and also this research was funded by NRF, grant number 2020R1G1A1007570.
Acknowledgments
This study was supported by the Korea Institute of Energy Technology Evaluation and Planning (KETEP) and the Ministry of Trade, Industry & Energy (MOTIE) of the Republic of Korea (No. 20201510100010). This work was also supported by the National Research Foundation of Korea (NRF) grant funded by the Korean government (No. 2020R1G1A1007570).
Conflicts of Interest
The authors declare no conflict of interest.
References
- Vishnuvardhan, S.; Raghava, G.; Gandhi, P.; Saravanan, M.; Goyal, S.; Arora, P.; Bhasin, V. Ratcheting failure of pressurised straight pipes and elbows under reversed bending. Int. J. Press. Vessel. Pip. 2013, 105, 79–89. [Google Scholar] [CrossRef]
- Takahashi, K.; Ando, K.; Matsuo, K.; Urabe, Y. Estimation of low-cycle fatigue life of elbow pipes considering the multi-axial stress effect. J. Press. Vessel. Technol. 2014, 136, 041405. [Google Scholar] [CrossRef]
- Hassan, T.; Rahman, M.; Bari, S. Low-cycle fatigue and ratcheting responses of elbow piping components. J. Press. Vessel. Technol. 2015, 137, 031010. [Google Scholar] [CrossRef]
- Varelis, G.E.; Karamanos, S.A. Low-cycle fatigue of pressurized steel elbows under in-plane bending. J. Press. Vessel. Technol. 2015, 137, 011401. [Google Scholar] [CrossRef]
- Emanuele, B.; Roberto, N.; Marco, P.; Dumitru, B. Seismic Performance of Storage Steel Tanks during the May 2012 Emilia, Italy, Earthquakes. J. Perform. Constr. Facil. 2015, 29, 04014137. [Google Scholar]
- Touboul, F.; Blay, N.; Lacire, M.H. Experimental, analytical, and regulatory evaluation of seismic behavior of piping systems. J. Press. Vessel. Technol. 1999, 121, 388–392. [Google Scholar] [CrossRef]
- Touboul, F.; Sollogoub, P.; Blay, N. Seismic behaviour of piping systems with and without defects: Experimental and numerical evaluations. Nucl. Eng. Des. 1999, 192, 243–260. [Google Scholar] [CrossRef]
- Nakamura, I.; Otani, A.; Sato, Y.; Takada, H.; Takahashi, K. Tri-axial shake table test on the thinned wall piping model and damage detection before failure. In Proceedings of the ASME 2010 Pressure Vessels and Piping Division/K-PVP Conference, Washington, DC, USA, 18–22 July 2010. [Google Scholar]
- Jeon, B.G.; Kim, S.W.; Choi, H.S.; Park, D.U.; Kim, N.S. A Failure Estimation Method of Steel Pipe Elbows under In-plane Cyclic Loading. Nucl. Eng. Technol. 2017, 49, 245–253. [Google Scholar] [CrossRef] [Green Version]
- Eem, S.H.; Jung, H.J. Seismic response distribution estimation for isolated structures using stochastic response database. Earthq. Struct. 2015, 9, 937–956. [Google Scholar] [CrossRef]
- Eem, S.H.; Jung, H.J. Seismic fragility assessment of isolated structures by using stochastic response database. Earthq. Struct. 2018, 14, 389–398. [Google Scholar]
- Eem, S.H.; Hahm, D.G. Large strain nonlinear model of lead rubber bearings for beyond design basis earthquakes. Nucl. Eng. Technol. 2019, 51, 600–606. [Google Scholar] [CrossRef]
- Eem, S.H.; Kim, J.H. Sensitivity analysis for the distribution of maximum responses by seismic isolation system parameters using the stochastic response database. Nucl. Eng. Des. 2019, 347, 53–58. [Google Scholar] [CrossRef]
- Eem, S.H.; Jung, H.J.; Kim, M.K.; Choi, I.K. Seismic fragility evaluation of isolated NPP containment structure considering soil-structure interaction effect. J. Earthq. Eng. Soc. Korea 2013, 17, 53–59. [Google Scholar] [CrossRef]
- Hahm, D.G.; Park, J.H.; Choi, I.K. Seismic Performance Evaluation of Piping System Crossing the Isolation Interface in Seismically Isolated NPP. J. Earthq. Eng. Soc. Korea 2014, 18, 141–150. [Google Scholar] [CrossRef]
- Cheung, J.H.; Seo, Y.D.; Choi, H.S. Seismic capacity test of nuclear piping system using multi-platform shake table. J. Earthq. Eng. Soc. Korea 2013, 17, 21–31. [Google Scholar] [CrossRef] [Green Version]
- Kwag, S.Y.; Eem, S.H.; Choi, I.K. Evaluation Model of Seismic Response Behavior and Performance of Nuclear Plant Piping Systems. J. Korean Soc. Adv. Compos. Struct. 2020, 11, 54–62. [Google Scholar] [CrossRef]
- Xu, J.; DeGrassi, G.; Chokski, N. A NRC-BNL benchmark evaluation of seismic analysis methods for non-classically damped coupled systems. Nucl. Eng. Des. 2004, 228, 345–366. [Google Scholar] [CrossRef]
- Jeon, B.G.; Choi, H.S.; Hahm, D.G.; Kim, N.S. Seismic fragility analysis of base isolated NPP piping systems. J. Earthq. Eng. Soc. Korea 2015, 19, 29–36. [Google Scholar] [CrossRef]
- Kim, S.W.; Jeon, B.G.; Hahm, D.G.; Kim, M.K. Seismic fragility evaluation of the base-isolated nuclear power plant piping system using the failure criterion based on stress-strain. Nucl. Eng. Technol. 2019, 51, 561–572. [Google Scholar] [CrossRef]
- American Society of Mechanical Engineers. ASME B36.10 M—2015. In Welded and Seamless Wrought Steel Pipe; American Society of Mechanical Engineers: New York, NY, USA, 2015. [Google Scholar]
- U.S. Nuclear Regulatory Commission. Regulatory Guide 1.61: Damping Values for Seismic Design of Nuclear Power Plants; U.S. NUCLEAR Regulatory Commission: Rockville, MD, USA, 2007. [Google Scholar]
- Kim, J.H.; Kim, M.K.; Choi, I.-K. Response of base isolation system subjected to spectrum matched input ground motions. J. Earthq. Eng. Soc. Korea 2013, 17, 89–95. [Google Scholar] [CrossRef] [Green Version]


Publisher’s Note: MDPI stays neutral with regard to jurisdictional claims in published maps and institutional affiliations. |
© 2021 by the authors. Licensee MDPI, Basel, Switzerland. This article is an open access article distributed under the terms and conditions of the Creative Commons Attribution (CC BY) license (https://creativecommons.org/licenses/by/4.0/).