Article

Defect Properties and Lithium Incorporation in Li2ZrO3

by
Kobiny Antony Rex
1,
Poobalasuntharam Iyngaran
1,
Navaratnarajah Kuganathan
2,3,* and
Alexander Chroneos
2,3
1
Department of Chemistry, University of Jaffna, Sir. Pon Ramanathan Road, Thirunelvely, Jaffna 40000, Sri Lanka
2
Department of Materials, Imperial College London, London SW7 2AZ, UK
3
Faculty of Engineering, Environment and Computing, Coventry University, Priory Street, Coventry CV1 5FB, UK
*
Author to whom correspondence should be addressed.
Energies 2021, 14(13), 3963; https://doi.org/10.3390/en14133963
Submission received: 13 June 2021 / Revised: 29 June 2021 / Accepted: 30 June 2021 / Published: 1 July 2021
(This article belongs to the Special Issue Applied Energy Materials for Li-Ion Batteries)

Abstract

:
Lithium zirconate is a candidate material in the design of electrochemical devices and tritium breeding blankets. Here we employ an atomistic simulation based on the classical pair-wise potentials to examine the defect energetics, diffusion of Li-ions, and solution of dopants. The Li-Frenkel is the lowest defect energy process. The Li-Zr anti-site defect cluster energy is slightly higher than the Li-Frenkel. The Li-ion diffuses along the c axis with an activation energy of 0.55 eV agreeing with experimental values. The most favorable isovalent dopants on the Li and Zr sites were Na and Ti respectively. The formation of additional Li in this material can be processed by doping of Ga on the Zr site. Incorporation of Li was studied using density functional theory simulation. Li incorporation is exoergic with respect to isolated gas phase Li. Furthermore, the semiconducting nature of LZO turns metallic upon Li incorporation.

Graphical Abstract

1. Introduction

Lithium zirconate (Li2ZrO3 or LZO) is a material of interest for many applications including electrode or electrolyte in Li-ion batteries [1,2,3], breeder blanket in nuclear reactors [4,5,6] and sorbent capture of CO2 [7,8,9] due to its chemical and thermal stability. For battery applications, Li-ion conductivity should be high as battery performance is partly dependent on it during the charge–discharge process. Experimental work based on nuclear magnetic resonance (NMR) spectroscopy shows that the Li-ion conductivity in this material is high and the activation energy is calculated to be ~0.51–0.65 eV [10]. Xu et al. [11] reported that the rate performance of LiNi0.5Co0.2Mn0.3O2 can be improved by the surface coating of LZO. Electrochemical performance of LZO was examined experimentally and an excellent cyclic performance and rate capability reported [1]. In a density functional theory (DFT) simulation by Ferreira et al. [12], the relevance of vacancy-assisted Li-ion migration has been discussed.
Defects and dopants can influence a material’s electrochemical property as diffusion of ions is directly related to the concentration of point defects [13,14]. Particularly, introducing dopants is a common way to form hyperstoichiometric dopant concentration of oxygen vacancies or interstitials, which in turn can impact oxygen self-diffusion as they effectively are the migrating defects [15]. Additionally, dopants can impact the migration energy barriers. In recent work, Kordatos et al. [16] performed DFT simulations to show that doping of aliovalent and isovalent cations on the Zr site is an efficient way to form oxygen vacancies and improve the diffusion and electronic properties of LZO. In the present study, atomistic simulations based on the classical pair-wise potentials to examine the defects, dopants and diffusion of Li-ions in LZO. In particular, we studied isovalent dopants on the Li and Zr sites for stabilizing LZO and aliovalent dopants on the Zr site for creating additional Li in LZO. In order to examine the incorporation, we used DFT simulations.

2. Computational Methods

Classical atomistic simulation was performed to calculate the defect energies, Li-ion migration pathways and solution energies for a variety of dopants. The generalized utilized lattice program (GULP) [17] was used. This method is based on the short-range (repulsive Pauli and attractive van der Waals) and long range (Coulombic) ionic interactions between ions. Short range interactions were modelled using Buckingham potentials (refer to Table 1) [18,19,20]. This potential method allows two unbonded atoms to interact and models the short-range interaction as a function of the intermolecular distance between those atoms. The Mott–Littleton method [21] was used to model point defects and migrating ions. In this method, the crystal surrounding the defect is divided into two regions (region I and region II). In region I, forces exerted by the defects are strong. Therefore, the ions in this region are relaxed explicitly. As forces in region II are relatively weak, quasi-continuum methods are used to relax the ions. Polarization of ions was modelled with the core-shell approach. In previous work, we reported the methodology of calculating migration pathways and activation energies of migration in detail [22,23,24].
Incorporation of Li was studied using DFT simulation as implemented in the Vienna ab initio simulation program (VASP) code [25]. This code is based on projected augmented wave (PAW) potentials [26] and plane wave basis sets. We used a plane wave basis set with a cut-off of 500 eV in all calculations. For bulk LZO, we used 4 × 8 × 4 Monkhorst-Pack [27] k-points. A regular grid of k-points are distributed homogeneously in the Brillouin zone and sampled in the Monkhorst-Pack method. Reciprocal unit cell is first converted from the real space and the k-points are sampled based on the reciprocal basis vectors. A 2 × 2 × 2 super cell containing 192 atoms was used to model Li incorporation. For this supercell, 2 × 4 × 2 Monkhorst-Pack k-points were used. The generalized gradient approximation (GGA) parameterized by Perdew, Burke, and Ernzerhof (PBE) [28] was used to model exchange correlation. The conjugate gradient algorithm [29] was used to relax both atomic positions and cell parameters. Short range temporary dispersive interactions were modelled using zero damping DFT + D3 as parameterized by Grimme et al [30].

3. Results and Discussion

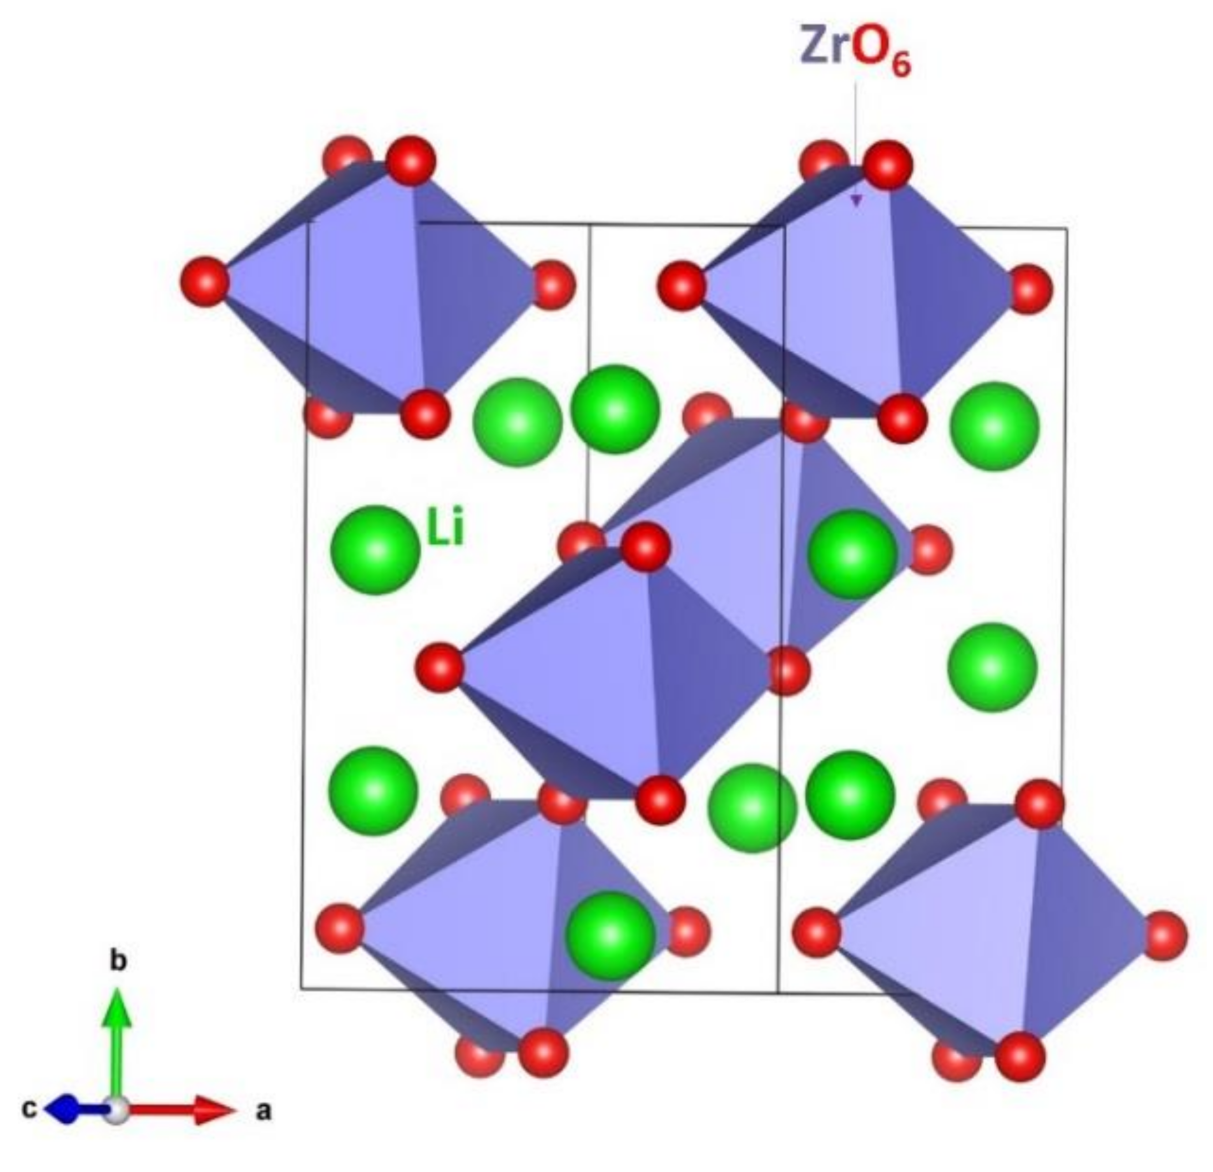
3.1. Structure of LZO

Li2ZrO3 exhibits a monoclinic crystallographic structure with space group of C2/c (no. 15). Heiba et al. [31] reported the crystal structure of LZO with experimental values are a = 5.4089 Å, b = 9.0309 Å, c = 5.4144 Å, α = γ = 90° and β = 112.50°. The crystal structure has ZrO6 octahedral units, which are interconnected by sharing their edges and corners (see Figure 1). Buckingham potentials used in the classical simulation and PAW potentials utilized in the DFT simulation were validated by performing geometry optimization calculations and comparing the relaxed lattice parameters with corresponding experimental values. There is a reasonable agreement between simulations and the experiment (refer to Table 2) as explained by Oberkampf et al. [32]

3.2. Defect Energetics

In this section, we calculate the formation energies of point defects (vacancies and interstitials) using a classical simulation. Frenkel and Schottky defect energies were then calculated by combining point defect energies and appropriate lattice energies. Anti-site defects were also calculated. This defect is important as it can influence the diffusion property of a material. The following reaction equations were constructed to describe the intrinsic defect processes using the Kröger–Vink notation [33].
Li   Frenkel :   Li Li X     V Li +   Li i
Zr   Frenkel :   Zr Zr X     V Zr +   Zr i
O   Frenkel :   O O X     V O +   O i
Schottky : 2   Li Li   X + Zr Zr X   + 3   O O X 2   V Li + V Zr + 3   V O + Li 2 ZrO 3
Li 2 O   Schottky : 2   Li Li X +   O O X   2   V Li + V O + Li 2 O
ZrO 2   Schottky :   Zr Zr X + 2   O O X     V Zr + 2   V O +   ZrO 2
Li / Zr   antisite   isolated :   Li Li X +   Zr Zr X   Li Zr + Zr Li
Li / Zr   antisite   cluster :   Li Li X +   Zr Zr X     { Li Zr + Zr Li } X
The defect energies are tabulated in Table 3. The lowest defect formation energy is calculated for the Li Frenkel (1.09 eV/defect) as reported in a previous DFT simulation [13]. The Li-Zr anti-site cluster defect energy is higher only by 0.37 eV compared with the Li-Frenkel. In this defect, a small amount of Li and Zr atoms would exchange their positions simultaneously. However, this defect process would not take place spontaneously and would be dependent on the temperature and synthetic conditions. The difference in energy between the isolated and cluster forms of the anti-site defect is the binding energy. Here, the binding energy is calculated to be –1.42 eV. The presence of the anti-site defect has been reported in many experimental and theoretical studies [34,35,36]. This means isolated defects form clusters without any energy penalty. The Li2O Schottky defect is the lowest energy process among other Schottky processes. The formation of Li2O can destabilize the lattice. Such a destabilization can degrade the battery performance. The Zr Frenkel is higher in energy (by 3.59 eV) than the O Frenkel. This is due to the high formation energy of introducing Zr vacancy with +4 charge.

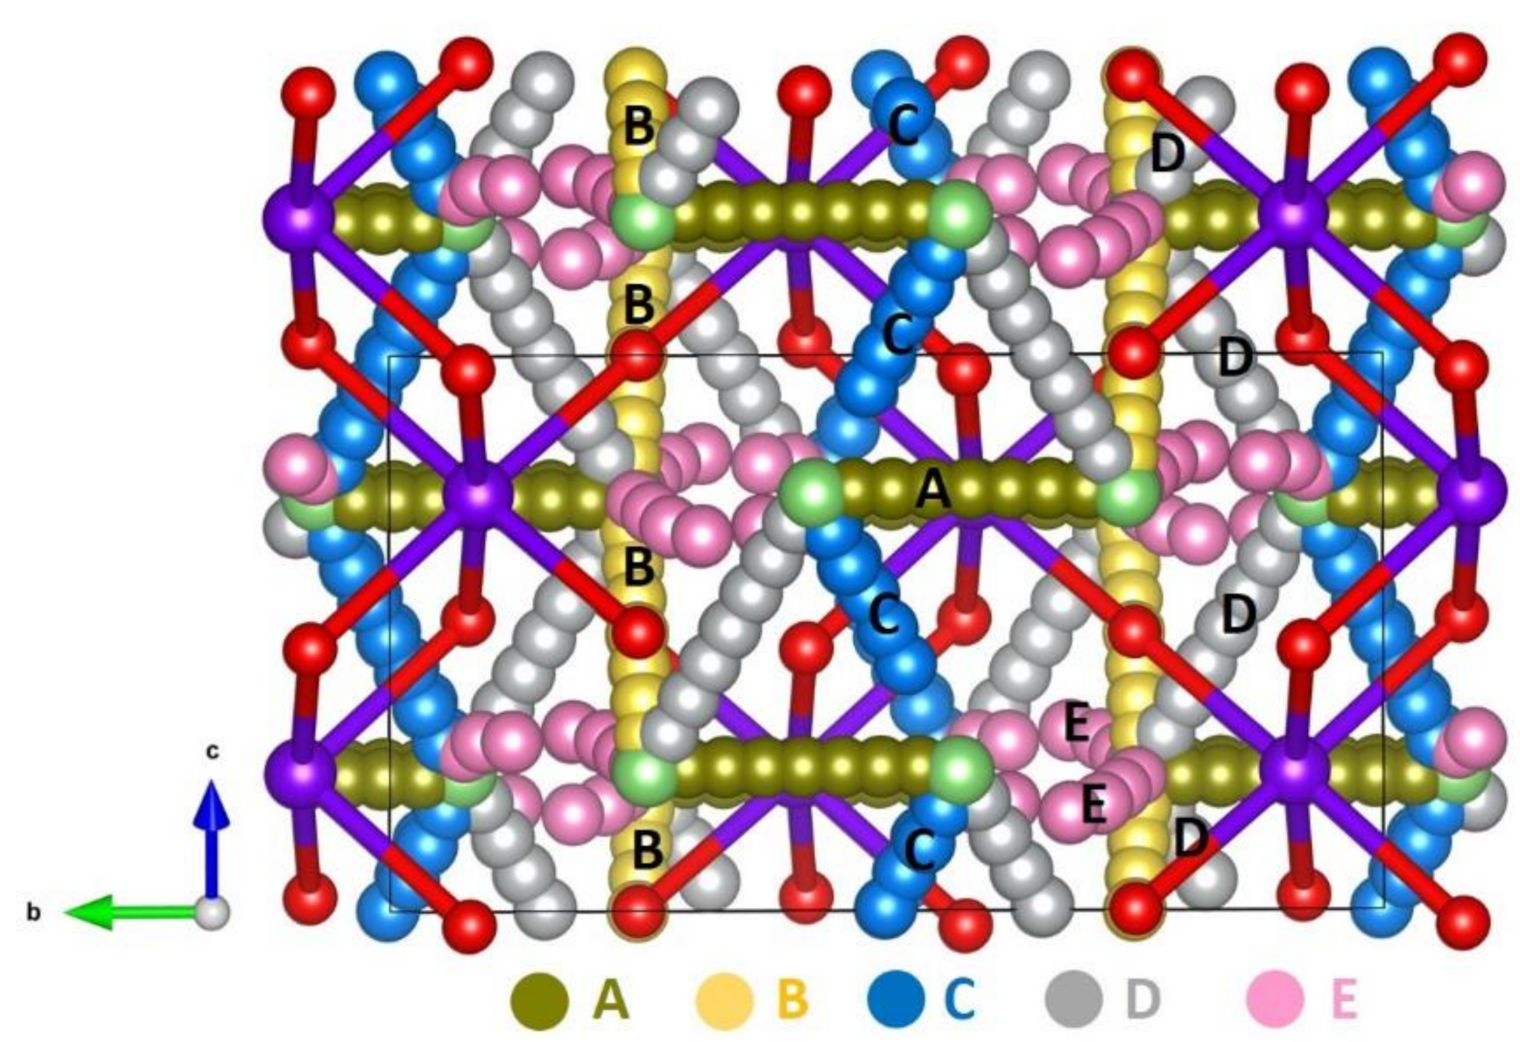
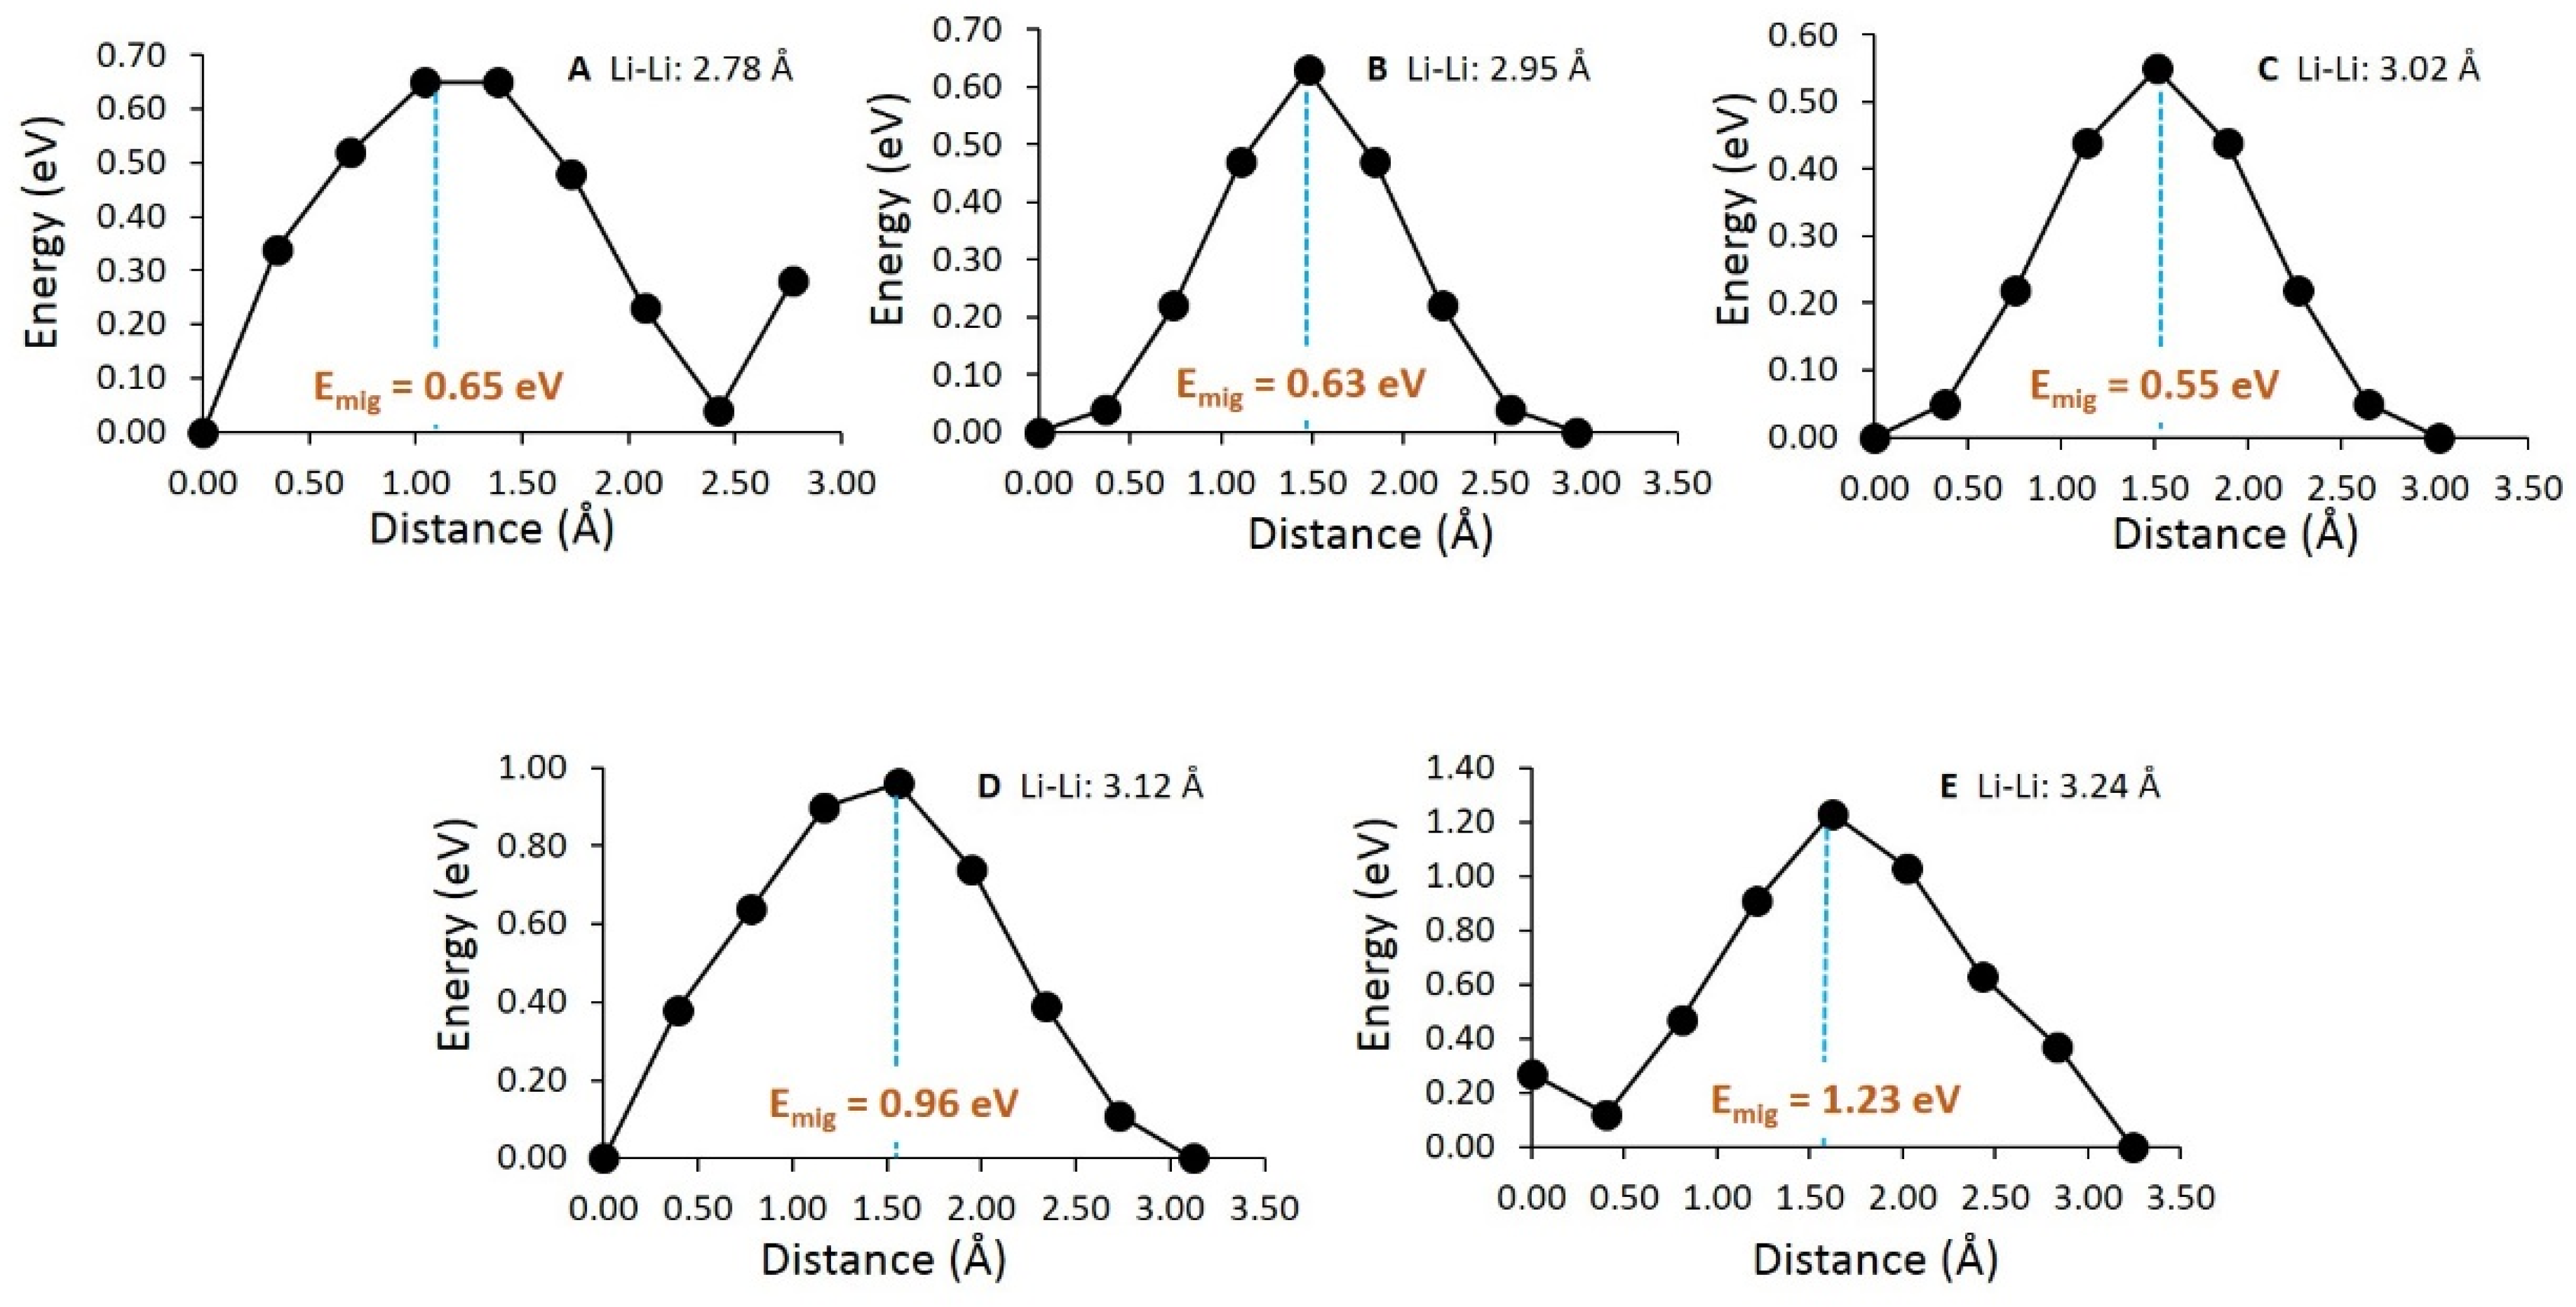
3.3. Diffusion of Li-Ions

Here, we discuss the diffusion of Li-ions and their activation energies. Classical atomistic simulations [37] were used to examine the Li-ion diffusion pathways and migration energies. Diffusion property of a materials is partly important in constructing a promising Li-ion battery. The identification of the diffusion ion pathways through experimental investigation is often challenging. Computational modelling has been shown to be a powerful tool to determine the migration pathways and activation energies [38,39,40]. Five different local Li hops (A–E) were identified, as shown in Figure 2. In Table 4, we report the Li hop distances and activation energies. Figure 3 shows the energy profile diagrams plotted for Li hops.
The hop C exhibits the lowest activation energy. A long range diffusion pathway (C→C→C→C) consisting of hop C was constructed. This pathway has a pattern of zig-zag and Li-ion moves in the bc plane (see Figure 2). The difference in the activation energies calculated for hops A (0.65 eV) and B (0.63 eV) is very small. While there is a long range diffusion possible for hop B (B→B→B→B) in the ac plane with an overall activation energy of 0.63 eV, the diffusion of hop A is limited along the b axis. Another possible long range diffusion pathway (D→D→D→D) can be constructed by connecting local hops D in the bc plane. However, its activation energy is higher by 0.41 eV than that calculated for the lowest migration pathway (C→C→C→C). Finally, hops E were connected. In this long range diffusion (E→E→E→E), activation energy is relatively high. In a Li-NMR study carried out by Baklanova et al. [10], the activation energy for Li-ion migration was estimated to be 0.50–0.65 eV. This is in good agreement with the values calculated in this study. In a DFT simulation by Ferreira [12], a range of activation energies were reported with respect to reactants and products. Activation energies calculated from the products and reactants in the vacancy-assisted Li-ion diffusion are 0.651 eV and 0.749 eV respectively [12]. These values agree with those reported in this study, although DFT simulations treated Li vacancies as neutral in contrast to the current simulation where all defects were modelled as fully charged ions.

3.4. Solution of Dopants

Modification of material properties can be achieved through cation doping. In this strategy, isovalent doping requires no charge-compensating defect, whereas aliovalent doping can introduce point defects (vacancies and interstitials) in the lattice. The degree of disorder of a material is influenced by the concentration of point defects. Furthermore, point defect concentration increases exponentially with an increasing temperature [41]. Here we examined a variety of dopant ions using classical simulation. Table S1 in the Supplementary reports the Buckingham potentials used for dopants in this study (see Table S1).

3.4.1. Isovalent Dopants

First, doping of isovalent dopants (M = Na, K and Rb) on the Li site was considered as explained by the following reaction equation:
M 2 O + Li Li   X 2   M Li   X + Li 2 O
Figure 4a reports the solution energies with respect to the radii of the dopant ions. Exothermic solution energy of −0.10 eV is calculated for Na+. The Li+ has an ionic radius of 0.76 Å. The favorability of Na+ can be partly due to its ionic radius (1.02 Å), closer to that of Li+. Solution energies are positive for both K+ and Rb+. The highest solution of energy of 4.98 eV is calculated for Rb+, meaning that this dopant is highly unlikely for the doping process under normal temperatures.
Next, tetravalent dopants (M = Si, Ge, Ti, Sn and Ce) were considered for doping on the Zr site. The following reaction equation describes the doping process.
MO 2 +   Zr Zr   X M Zr   X + ZrO 2
Exothermic solution energies are calculated for Ge4+, Ti4+ and Sn4+. The most favorable dopant is the Ti4+ with a solution energy of −1.85 eV. Solution energy for Si4+ is 0.18 eV. The endoergic solution energy for this dopant is owing to the ionic radius of Si4+ (0.40 Å) deviating much from that of Zr4+ (0.72 Å). The Ce4+ exhibits the largest solution energy of 1.31 eV.

3.4.2. Aliovalent Dopants

The formation of extra Li+ ions in LZO can be of interest to enhance the capacity of LZO for both battery and nuclear applications. Doping of trivalent cations (Al, Ga, Sc, In, Y, Gd, and La) was considered on the Zr site. This doping process will create Li interstitials based on the following reaction equation:
M 2 O 3 + 2   Zr Zr X + Li 2 O     2   M Zr + 2   Li i + 2   ZrO 2
Ga is the promising dopant for this process (refer to Figure 5). Solution energies calculated for Sc and In are higher only by 0.09 eV and 0.19 eV respectively compared with that calculated for Ga. The dopant Al has a solution energy of 2.09 eV. There is an increase in the solution energy with an ionic radius from Ga to La. The highest solution energy calculated for La indicates that this dopant is an unfavorable dopant under normal conditions. The possible doped configuration that can be prepared by the experiments is Li2+xGaxZr1-xO3 (x = 0.0–1.0).

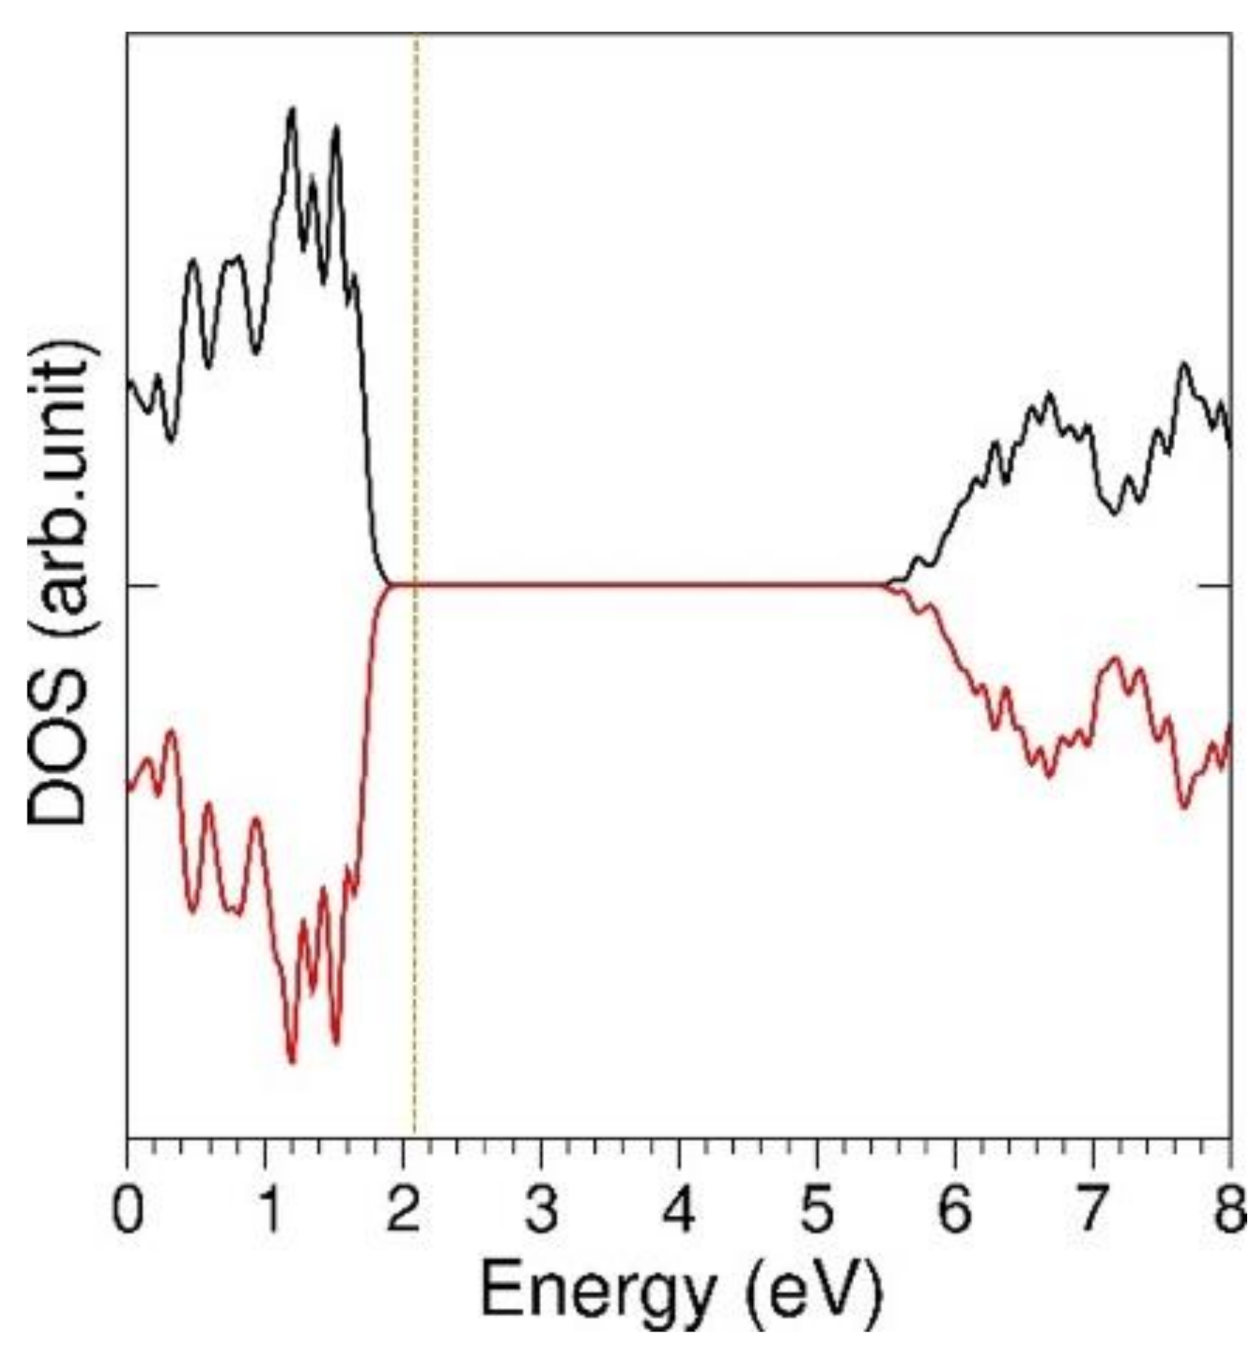
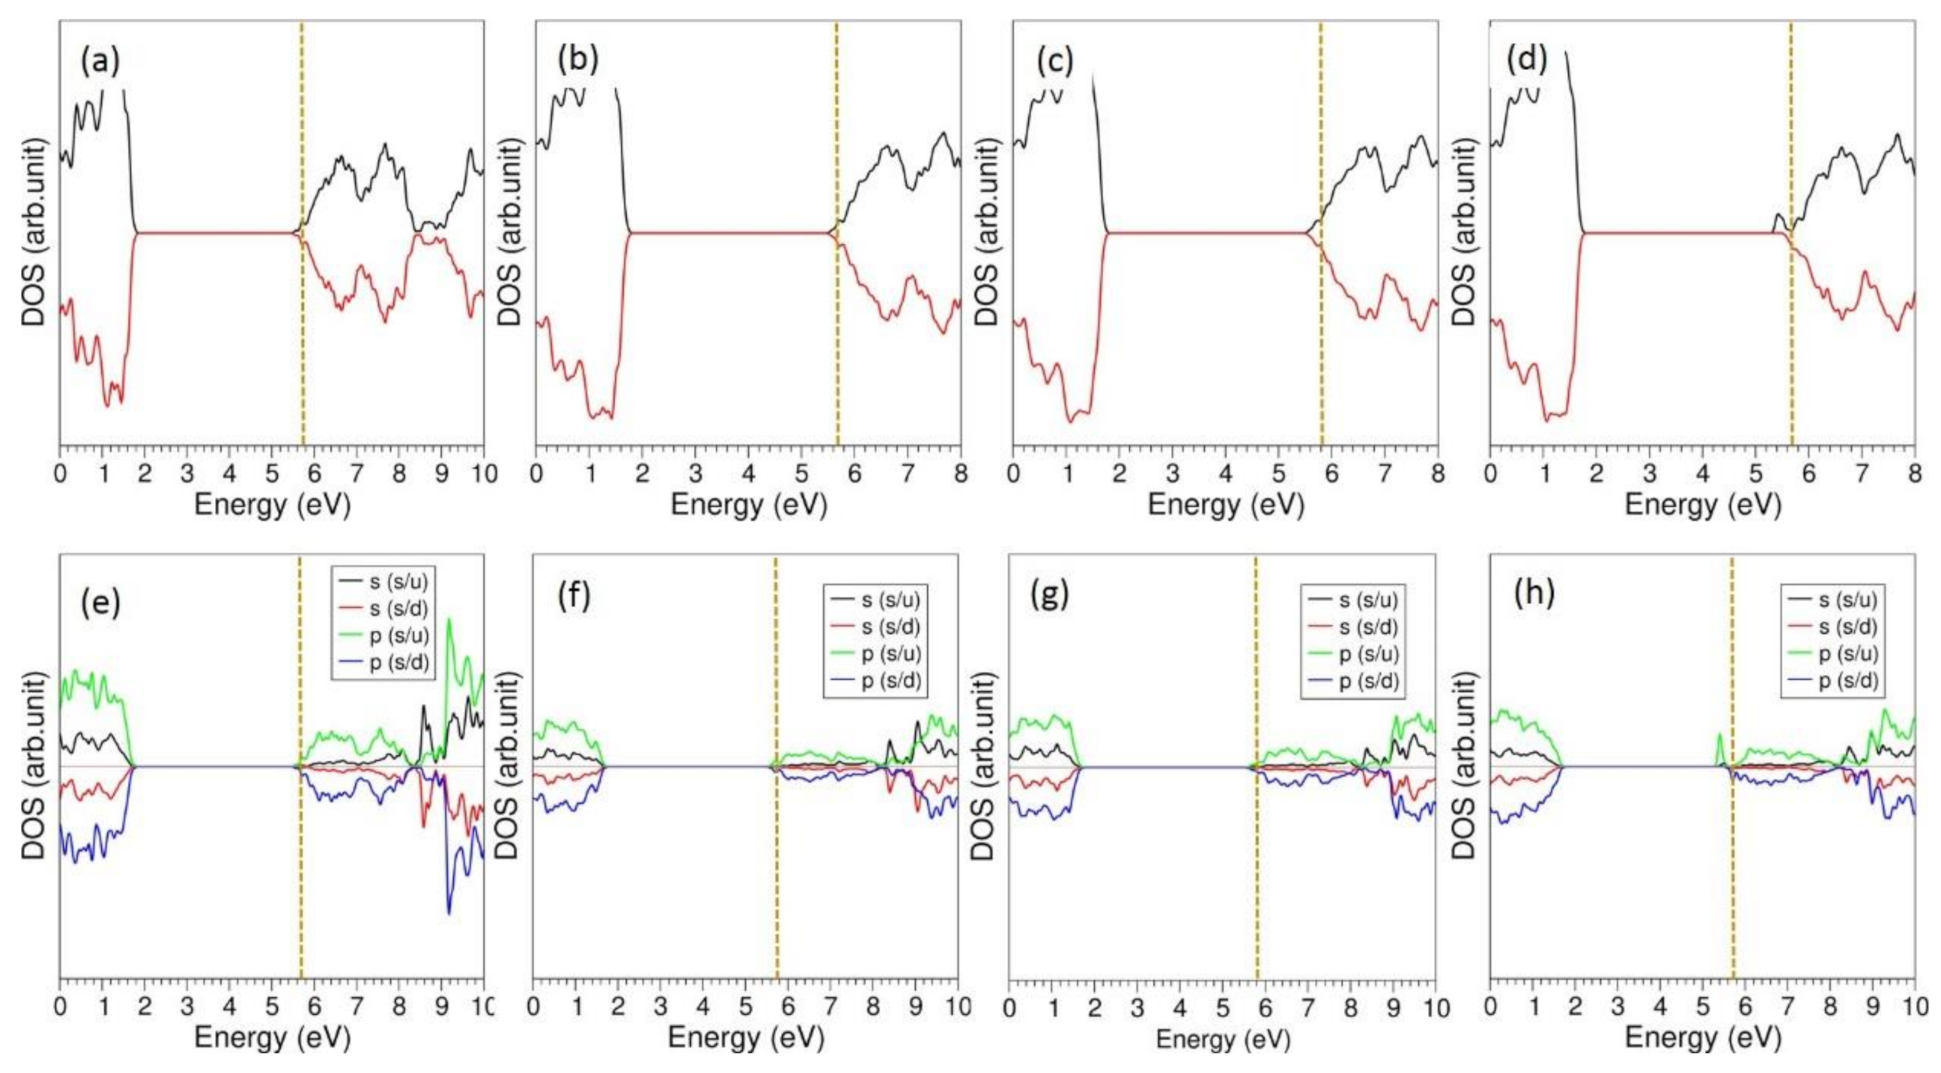
3.5. Li Incorporation in LZO

Simulations based on DFT were employed to examine the Li incorporated geometries and their electronic structures. Calculated total density of states (DOS) plot of bulk LZO is shown in Figure 6. Previous DFT simulation by Duan [42] shows that LZO is a wide gap semiconductor (band gap of 3.90 eV) which is in agreement with the calculated band gap of 3.60 eV in this study (see Figure 6). The net magnetic moment of the relaxed structure of bulk LZO is zero, as evidenced by the total DOS plot where spin-up states are the mirror image of spin-down states about the x-axis.
We have subsequently incorporated four Li atoms. Relaxed structures are shown in Figure 7. Incorporation is exoergic with respect to gas-phase Li atoms and endoergic with respect to Li metal (see Table 5). This is because of the higher endoergic dissociation energy to form Li atoms from bulk Li than the exoergic incorporation energy of gaseous Li atoms. The first two Li atom incorporation is highly negative compared with that of the third and fourth. Bader charge analysis [43] shows that Li atoms are positively charged and form strong bonds with oxygen in the lattice. Bader charge analysis uses partitioning method to calculate electronic charges on individual atoms in the lattice. Using Zero flux surfaces, atoms are divided and charge density is partitioned. There is a gradual increase in volume upon each Li incorporation.
Calculated total DOS plots of Li-incorporated structures are shown in Figure 8. Incorporation shifts the Fermi level towards the conduction band. This is because of an additional electron created by each Li incorporation. In all cases, Fermi level is occupied by states associated with Li and the resultant composites became metallic.

4. Summary

Defect properties, diffusion of Li-ion, solution of dopants and Li incorporation were investigated using classical and DFT simulations. Calculations find that the dominant defect in this material is the Li-Frenkel, ensuring the formation of Li vacancies. The next most favorable defect is the Li-Zr anti-site defect cluster. Li-ion diffusion is noted along the c axis and its activation energy is 0.55 eV. The isovalent dopants on the Li and Zr are calculated to be the Na and Ti respectively. The promising dopant on the Zr site to create extra Li in the lattice is Ga. DFT simulations show that incorporation of Li is exoergic with respect to gas phase Li. The metallic nature of the resultant composite is confirmed by the formation of Li+ ions and electrons in the lattice. The results reported in this study can be validated by experiments for the development of Li-ion batteries and tritium breeding blankets.

Supplementary Materials

The following are available online at https://www.mdpi.com/article/10.3390/en14133963/s1. Table S1. Interatomic potential parameters used for dopant in the atomistic simulations of Li2ZrO3.

Author Contributions

Computation, K.A.R., N.K.; Writing, N.K.; Analysis, P.I.; Editing, A.C. All authors have read and agreed to the published version of the manuscript.

Funding

This computational work was financially supported by European Union’s H2020 Programme under Grant Agreement no 824072–HARVESTORE.

Institutional Review Board Statement

Not applicable.

Informed Consent Statement

Not applicable.

Data Availability Statement

Not applicable.

Acknowledgments

Imperial College London and the Department of Chemistry, University of Jaffna, Srilanka are acknowledged for providing high performance computing facilities.

Conflicts of Interest

The authors declare no conflict of interest.

References

  1. Dong, Y.; Zhao, Y.; Duan, H.; Huang, J. Electrochemical performance and lithium-ion insertion/extraction mechanism studies of the novel Li2ZrO3 anode materials. Electrochim. Acta 2015, 161, 219–225. [Google Scholar] [CrossRef]
  2. Thackeray, M.M.; Johnson, C.S.; Kim, J.S.; Lauzze, K.C.; Vaughey, J.T.; Dietz, N.; Abraham, D.; Hackney, S.; Zeltner, W.; Anderson, M. ZrO2- and Li2ZrO3-stabilized spinel and layered electrodes for lithium batteries. Electrochem. Commun. 2003, 5, 752–758. [Google Scholar] [CrossRef]
  3. Zhang, X.; Sun, S.; Wu, Q.; Wan, N.; Pan, D.; Bai, Y. Improved electrochemical and thermal performances of layered Li[Li0.2Ni0.17Co0.07Mn0.56]O2 via Li2ZrO3 surface modification. J. Power Sources 2015, 282, 378–384. [Google Scholar] [CrossRef]
  4. Kanazawa, T.; Nishikawa, M.; Yamasaki, H.; Katayama, K.; Kashimura, H.; Hanada, T.; Fukada, S. Study on Tritium Release Behavior from Li2ZrO3. Fusion Sci. Technol. 2011, 60, 1167–1170. [Google Scholar] [CrossRef]
  5. Hollenberg, G.W. Fast neutron irradiation results on Li2O, Li4SiO4, Li2ZrO3 and LiAlO2. J. Nucl. Mater. 1984, 123, 896–900. [Google Scholar] [CrossRef]
  6. Kawamura, Y.; Enoeda, M.; Okuno, K. Isotope exchange reaction in Li2ZrO3 packed bed. Fusion Eng. Des. 1998, 39, 713–721. [Google Scholar] [CrossRef]
  7. Wang, C.; Dou, B.; Song, Y.; Chen, H.; Xu, Y.; Xie, B. High Temperature CO2 Sorption on Li2ZrO3 Based Sorbents. Ind. Eng. Chem. Res. 2014, 53, 12744–12752. [Google Scholar] [CrossRef]
  8. Peltzer, D.; Mùnera, J.; Cornaglia, L.; Strumendo, M. Characterization of potassium doped Li2ZrO3 based CO2 sorbents: Stability properties and CO2 desorption kinetics. Chem. Eng. J. 2018, 336, 1–11. [Google Scholar] [CrossRef]
  9. Zhang, Y.; Gao, Y.; Pfeiffer, H.; Louis, B.; Sun, L.; O’Hare, D.; Wang, Q. Recent advances in lithium containing ceramic based sorbents for high-temperature CO2 capture. J. Mater. Chem. A 2019, 7, 7962–8005. [Google Scholar] [CrossRef]
  10. Baklanova, Y.V.; Arapova, I.Y.; Buzlukov, A.L.; Gerashenko, A.P.; Verkhovskii, S.V.; Mikhalev, K.N.; Denisova, T.; Shein, I.; Maksimova, L. Localization of vacancies and mobility of lithium ions in Li2ZrO3 as obtained by 6,7 Li NMR. J. Solid State Chem. 2013, 208, 43–49. [Google Scholar] [CrossRef]
  11. Xu, Y.; Liu, Y.; Lu, Z.; Wang, H.; Sun, D.; Yang, G. The preparation and role of Li2ZrO3 surface coating LiNi0.5Co0.2Mn0.3O2 as cathode for lithium-ion batteries. Appl. Surf. Sci. 2016, 361, 150–156. [Google Scholar] [CrossRef]
  12. Ferreira, A.R.; Reuter, K.; Scheurer, C. DFT simulations of 7 Li solid state NMR spectral parameters and Li+ ion migration barriers in Li2ZrO3. RSC Adv. 2016, 6, 41015–41024. [Google Scholar] [CrossRef]
  13. Alexopoulos, K.; Varotsos, P. Calculation of diffusion coefficients at any temperature and pressure from a single measurement. II. Heterodiffusion. Phys. Rev. B 1981, 24, 3606–3609. [Google Scholar] [CrossRef]
  14. Varotsos, P.; Alexopoulos, K. Thermodynamics of Point Defects and their Relation with the Bulk Properties; Elsevier: Amsterdam, North-Holland, The Netherlands, 1986. [Google Scholar]
  15. Rupasov, D.; Chroneos, A.; Parfitt, D.; Kilner, J.A.; Grimes, R.W.; Istomin, S.Y.; Antipov, E.V. Oxygen diffusion in Sr0.75Y0.25CoO2.625: A molecular dynamics study. Phys. Rev. B 2009, 79, 172102. [Google Scholar] [CrossRef] [Green Version]
  16. Kordatos, A.; Christopoulos, S.R.G.; Kelaidis, N.; Chroneos, A. Defect processes in Li2ZrO3: Insights from atomistic modelling. J. Mater. Sci. Mater. Electron. 2017, 28, 11789–11793. [Google Scholar] [CrossRef] [Green Version]
  17. Gale, J.D. GULP: A computer program for the symmetry-adapted simulation of solids. J. Chem. Soc. Faraday Trans. 1997, 93, 629–637. [Google Scholar] [CrossRef]
  18. Fisher, C.A.J.; Kuganathan, N.; Islam, M.S. Defect chemistry and lithium-ion migration in polymorphs of the cathode material Li2MnSiO4. J. Mater. Chem. A 2013, 1, 4207–4214. [Google Scholar] [CrossRef] [Green Version]
  19. Minervini, L.; Grimes, R.W.; Sickafus, K.E. Disorder in Pyrochlore Oxides. J. Am. Ceram. Soc. 2000, 83, 1873–1878. [Google Scholar] [CrossRef]
  20. Cherry, M.; Islam, M.S.; Catlow, C.R.A. Oxygen Ion Migration in Perovskite-Type Oxides. J. Solid State Chem. 1995, 118, 125–132. [Google Scholar] [CrossRef]
  21. Mott, N.F.; Littleton, M.J. Conduction in polar crystals. I. Electrolytic conduction in solid salts. Trans. Faraday Soc. 1938, 34, 485–499. [Google Scholar] [CrossRef]
  22. Kuganathan, N.; Ganeshalingam, S.; Chroneos, A. Defects, Diffusion, and Dopants in Li2Ti6O13: Atomistic Simulation Study. Materials 2019, 12, 2851. [Google Scholar] [CrossRef] [Green Version]
  23. Kuganathan, N.; Kordatos, A.; Anurakavan, S.; Iyngaran, P.; Chroneos, A. Li3SbO4 lithium-ion battery material: Defects, lithium ion diffusion and tetravalent dopants. Mater. Chem. Phys. 2019, 225, 34–41. [Google Scholar] [CrossRef]
  24. Kuganathan, N.; Kordatos, A.; Kelaidis, N.; Chroneos, A. Defects, Lithium Mobility and Tetravalent Dopants in the Li3NbO4 Cathode Material. Sci. Rep. 2019, 9, 2192. [Google Scholar] [CrossRef] [Green Version]
  25. Kresse, G.; Furthmüller, J. Efficient iterative schemes for ab initio total-energy calculations using a plane-wave basis set. Phys. Rev. B 1996, 54, 11169–11186. [Google Scholar] [CrossRef]
  26. Blöchl, P.E. Projector augmented-wave method. Phys. Rev. B 1994, 50, 17953–17979. [Google Scholar] [CrossRef] [Green Version]
  27. Monkhorst, H.J.; Pack, J.D. Special points for Brillouin-zone integrations. Phys. Rev. B 1976, 13, 5188–5192. [Google Scholar] [CrossRef]
  28. Perdew, J.P.; Burke, K.; Ernzerhof, M. Generalized Gradient Approximation Made Simple. Phys. Rev. Lett. 1996, 77, 3865–3868. [Google Scholar] [CrossRef] [Green Version]
  29. Press, W.H.; Teukolsky, S.A.; Vetterling, W.T.; Flannery, B.P. Numerical Recipes in C: The Art of Scientific Computing, 2nd ed.; Cambridge University Press: Cambridge, UK, 1992. [Google Scholar]
  30. Grimme, S.; Antony, J.; Ehrlich, S.; Krieg, H. A consistent and accurate ab initio parametrization of density functional dispersion correction (DFT-D) for the 94 elements H-Pu. J. Chem. Phys. 2010, 132, 154104. [Google Scholar] [CrossRef] [Green Version]
  31. Heiba, Z.K.; El-Sayed, K. Structural and anisotropic thermal expansion correlation of Li2ZrO3 at different temperatures. J. Appl. Crystallogr. 2002, 35, 634–636. [Google Scholar] [CrossRef] [Green Version]
  32. Oberkampf, W.L.; Barone, M.F. Measures of agreement between computation and experiment: Validation metrics. J. Comput. Phys. 2006, 217, 5–36. [Google Scholar] [CrossRef] [Green Version]
  33. Kröger, F.A.; Vink, H.J. Relations between the Concentrations of Imperfections in Crystalline Solids. In Solid State Physics; Seitz, F., Turnbull, D., Eds.; Academic Press: New York, NY, USA, 1956; Volume 3, pp. 307–435. [Google Scholar]
  34. Armstrong, A.R.; Kuganathan, N.; Islam, M.S.; Bruce, P.G. Structure and Lithium Transport Pathways in Li2FeSiO4 Cathodes for Lithium Batteries. J. Am. Chem. Soc. 2011, 133, 13031–13035. [Google Scholar] [CrossRef] [PubMed] [Green Version]
  35. Nytén, A.; Kamali, S.; Häggström, L.; Gustafsson, T.; Thomas, J.O. The lithium extraction/insertion mechanism in Li2FeSiO4. J. Mater. Chem. 2006, 16, 2266–2272. [Google Scholar] [CrossRef]
  36. Politaev, V.V.; Petrenko, A.A.; Nalbandyan, V.B.; Medvedev, B.S.; Shvetsova, E.S. Crystal structure, phase relations and electrochemical properties of monoclinic Li2MnSiO4. J. Solid State Chem. 2007, 180, 1045–1050. [Google Scholar] [CrossRef]
  37. Pizzagalli, L. Classical Atomistic Simulations in Materials Sciences: An Introduction. Mater. Sci. 2004, 10, 125. [Google Scholar]
  38. Islam, M.S.; Fisher, C.A.J. Lithium and sodium battery cathode materials: Computational insights into voltage, diffusion and nanostructural properties. Chem. Soc. Rev. 2014, 43, 185–204. [Google Scholar] [CrossRef] [Green Version]
  39. Kuganathan, N.; Chroneos, A. Na3V(PO4)2 cathode material for Na ion batteries: Defects, dopants and Na diffusion. Solid State Ion. 2019, 336, 75–79. [Google Scholar] [CrossRef] [Green Version]
  40. Fisher, C.A.J.; Hart Prieto, V.M.; Islam, M.S. Lithium Battery Materials LiMPO4 (M = Mn, Fe, Co, and Ni): Insights into Defect Association, Transport Mechanisms, and Doping Behavior. Chem. Mater. 2008, 20, 5907–5915. [Google Scholar] [CrossRef]
  41. Gladysz, G.M.; Chawla, K.K. 2—Intrinsic voids in crystalline materials: Ideal materials and real materials. In Voids in Materials, 2nd ed.; Gladysz, G.M., Chawla, K.K., Eds.; Elsevier: Amsterdam, The Netherlands, 2021; pp. 17–39. [Google Scholar]
  42. Duan, Y. Electronic structural and electrochemical properties of lithium zirconates and their capabilities of CO2 capture: A first-principles density-functional theory and phonon dynamics approach. J. Renew. Sustain. Energy 2011, 3, 013102. [Google Scholar] [CrossRef]
  43. Henkelman, G.; Arnaldsson, A.; Jónsson, H. A fast and robust algorithm for Bader decomposition of charge density. Comput. Mater. Sci. 2006, 36, 354–360. [Google Scholar] [CrossRef]
Figure 1. Monoclinic crystal structure of LZO.
Energies 14 03963 g001
Figure 2. Li-ion diffusion pathways. Green, yellow, blue, grey and pink color atoms correspond to different Li hops.
Energies 14 03963 g002
Figure 3. Energy profile diagrams for local Li hop activation energies. Letters (AE) are local Li hops as shown in Figure 2.
Energies 14 03963 g003
Figure 4. Solution energies calculated for (a) M2O (M = Na, K and Rb) and (b) MO2 (M = Si, Ge, Ti, Sn and Ce).
Energies 14 03963 g004
Figure 5. Solution energies calculated for M2O3 (M = Al, Ga, Sc, In, Y, Gd, and La) on the Zr site with respect to the M3+ ionic radius.
Energies 14 03963 g005
Figure 6. Total DOS plot of LZO. Vertical dot line corresponds to the Fermi energy level.
Energies 14 03963 g006
Figure 7. Relaxed structures of (a) a single Li, (b) 2Li, (c) 3Li and (d) 4Li incorporated in LZO.
Energies 14 03963 g007
Figure 8. Total DOS plots of (a) a single Li, (b) 2Li, (c) 3Li and (d) 4Li incorporated in Li2ZrO3. Corresponding Li atomic DOS plots (eh) are also shown.
Energies 14 03963 g008
Table 1. Buckingham potential parameters used [18,19,20].
InteractionA/eVρ/ÅC/eV·Å6Y/eK/eV·Å–2
Li+ ‒ O2−632.10180.29060.001.0099,999
Zr4+ ‒ O2−1502.110.34775.101.35169.617
O2− ‒ O2−22,764.00.149043.0−2.8031.0
Two-body [Φij (rij) = Aij exp (−rij/ρij) − Cij/rij6, where A, ρ and C are parameters. The values of Y and K represent the shell charges and spring constants.
Table 2. Calculated and experimental lattice parameters of monoclinic LZO.
ParameterCalculatedExperiment [31]|∆|(%)
Force FieldDFTForce FieldDFT
a (Å)5.59125.34115.40893.371.25
b (Å)8.84589.07379.03092.050.47
c (Å)5.47875.38745.41441.190.50
α = γ (°)90.0090.0090.000.000.00
β (°)115.66111.38112.502.810.99
V (Å3)244.25243.12244.350.040.50
Table 3. Defect formation energies of intrinsic defect process calculated in monoclinic LZO.
Defect ProcessEquation Number Defect Energy (eV)Defect Energy (eV)/Defect
Li Frenkel(1)2.181.09
Zr Frenkel(2)13.646.82
O Frenkel(3)6.463.23
Schottky(4)14.62.45
Li2O Schottky(5)6.742.25
ZrO2 Schottky(6)9.973.32
Li-Zr anti-site (isolated)(7)5.762.88
Li-Zr anti-site (cluster)(8)2.921.46
Table 4. Li hop distances and their activation energies as shown in Figure 2.
Diffusion PathLi-Li Separation (Å)Activation Energy (eV)
A2.780.65
B2.950.63
C3.020.55
D3.120.96
E3.241.23
Table 5. Calculated energies to incorporate Li atoms into LZO, Bader charges on the Li atoms and volume expansion upon successive incorporation.
ReactionIncorporation Energy (eV)Bader Charge (|e|)∆V (%)
Li + Li2ZrO3 → Li.Li2ZrO3−1.15 eV (0.52 eV)+1.001.21
Li + Li.Li2ZrO3 → 2Li.Li2ZrO3−1.12 eV (0.55 eV)+1.00 (2)2.16
Li + 2Li.Li2ZrO3 → 3Li.Li2ZrO3−0.60 eV (1.07 eV)+1.00 (3)2.37
Li + 3Li.Li2ZrO3 → 4Li.Li2ZrO3−0.85 eV (0.82 eV)+1.00 (4)2.73
Publisher’s Note: MDPI stays neutral with regard to jurisdictional claims in published maps and institutional affiliations.

