Abstract
Traditional cooling structures in gas turbines greatly improve the high temperature resistance of turbine blades; however, few cooling structures concern both heat transfer and mechanical performances. A lattice structure (LS) can solve this issue because of its advantages of being lightweight and having high porosity and strength. Although the topology of LS is complex, it can be manufactured with metal 3D printing technology in the future. In this study, an integral optimization model concerning both heat transfer and mechanical performances was presented to design the LS cooling channel with a variable aspect ratio in gas turbine blades. Firstly, some internal cooling channels with the thin walls were built up and a simple raw of five LS cores was taken as an insert or a turbulator in these cooling channels. Secondly, relations between geometric variables (height (H), diameter (D) and inclination angle(ω)) and objectives/functions of this research, including the first-order natural frequency (freq1), equivalent elastic modulus (E), relative density () and Nusselt number (Nu), were established for a pyramid-type lattice structure (PLS) and Kagome-type lattice structure (KLS). Finally, the ISIGHT platform was introduced to construct the frame of the integral optimization model. Two selected optimization problems (Op-I and Op-II) were solved based on the third-order response model with an accuracy of more than 0.97, and optimization results were analyzed. The results showed that the change of Nu and freq1 had the highest overall sensitivity Op-I and Op-II, respectively, and the change of D and H had the highest single sensitivity for Nu and freq1, respectively. Compared to the initial LS, the LS of Op-I increased Nu and E by 24.1% and 29.8%, respectively, and decreased by 71%; the LS of Op-II increased Nu and E by 30.8% and 45.2%, respectively, and slightly increased ; the LS of both Op-I and Op-II decreased freq1 by 27.9% and 19.3%, respectively. These results suggested that the heat transfer, load bearing and lightweight performances of the LS were greatly improved by the optimization model (except for the lightweight performance for the optimal LS of Op-II, which became slightly worse), while it failed to improve vibration performance of the optimal LS.
1. Introduction
The turbine inlet temperature in gas turbines has been drastically increased, which affects the life span of gas turbine blades an extreme amount. Additionally, the most prominent challenge is blade cooling technology to meet the demands from vast power generation with high thermal efficiency. Metal 3D printing technology can produce complex parts [1], which provides the possibility for an optimal design of turbine blades with some novel cooling structures concerning both mechanical and thermal performances.
Convective cooling with various ribs is one of the most common internal cooling technologies in a gas turbine. Previous studies showed that using a ribs turbulator in turbine blades achieved a good cooling performance by enhancing turbulence intensity [2], while also easily causing inhomogeneous temperature distribution and large thermal stress [3]. A lattice structure (LS) with high porosity has been recognized as the most promising new generation of advanced ultra-light and super-strong toughness materials, and it is the preferred structure for ultra-lightweight design. Herein, the LS produced by the metal 3D printer in the future may be used as a turbulator in the internal cooling channels at the middle chord region and/or the trailing edge of turbine blades, which should achieve better heat transfer and mechanical performances (vibration, bearing load, lightweight), and then improve the comprehensive performances of turbine blades.
Evans et al. [4] proposed an LS for the first time in 2001. Since then, the LS has become a popular research object. As a kind of filling material with high mechanical performance, the research on mechanical performance is relatively mature. Tian et al. [5] claimed that the LS is one of the porous structures which has high heat transfer and good heat dissipation. Subsequently, the topic of how to apply it in cooling channel has become a popular issue. Compared with other heat dissipation media such as opening foam, woven and honeycomb material, Joo et al. [6] found that the friction factor of the LS was far lower. Hence, the LS was very suitable for augmenting turbulent flow because of its high porosity, showing good heat transfer [7]. Yan et al. [8] studied fluid flow and heat transfer performances of an X-type LS (XLS) in forced convection. Their results suggested that the capacity of heat transfer performance of the XLS was similar to the Kagome-type LS (KLS), whereas compared to cellular panel and tetrahedron LSs, the XLS was 200% and 38% higher, respectively. Additionally, they studied the convection heat transfer of the XLS in a lightweight multifunctional sandwich panel and proved that convection heat transfer can be improved with a lightweight XLS [9]. Lu et al. [10] presented an active cooling method by an LS and found that both the LS and metal foam satisfied the maximum heat transfer capacity, whereas the LS satisfied the best heat transfer capacity under per temperature difference and pressure loss. Wadly et al. [11] proposed a heat pipe based on an LS and showed that the heat transfer capacity of the LS was 3 times than that of the metal foam material, and it had a good application prospect in the branch heat exchanger with strength requirements. Kim et al. [12] carried out a series of experimental and numerical studies on the heat transfer mechanism of a tetrahedral LS. Their results showed that the vertex of the LS and the inclination angle of its members had great influence on the heat transfer performance of the structure, and the overall heat transfer performance was improved. They also investigated the fluid flow performance [13] and pressure loss characteristic [14] for the LS channel and found that the turbulence intensity of the channel was improved with a relatively low pressure loss. Gao et al. [15] studied fluid flow and heat transfer characteristics of the tetrahedral LS and pyramid-type LS (PLS) by a numerical method and pointed out that the high heat transfer performance of LS was mainly caused by interactions of members. They found that the effect of heat transfer of the PLS was better than the tetrahedron LS under the same porosity and same height of sandwich panel [16]. Moreover, they claimed that the LS can be used as a composite cooling structure in most heat machines because of its active cooling performance [17]. Maloney et al. [18] experimentally studied the heat transfer performance of the LS with the use of a hollow member and nickel layer in a heat exchanger. The experimental results suggested that the heat transfer performance of the heat exchanger under a cross flow condition was at a medium level, but it had good energy absorption performance. Moon et al. [19] studied the effect of porosity on the heat transfer characteristics of the LS and obtained a corresponding empirical correlation of Nusselt number (Nu). Zhang et al. [20] numerically studied the difference of the heat transfer performance in the tetrahedral sandwich panel fabricated by casting and metal sheet folding. Their results showed that the heat transfer capacity of the metal sheet folding tetrahedral sandwich panel was 13 to 16% higher than that of the cast one. Shen et al. [21] numerically studied the convective heat transfer characteristics in the KLS and wire mesh woven Kagome sandwich panels. Their results revealed that the overall Nu of the KLS sandwich panel was 26% to 31% higher than that of the wire mesh woven Kagome under the same pressure loss. In addition, they used the KLS to replace the spoiler rib for the trailing edge structure of turbine blades and found that the KLS can greatly improve the heat transfer capacity under the static trailing edge structure, and the overall Nu increased by 671% under the same pressure loss [22]. The heat enhancement of channels with pin fins and a KLS was also found in Shen’s study [23]. The local heat transfer of the trialing edge of turbine blades was greatly improved by placing pin fins and a KLS in the internal cooling channels. Ekade et al. [24] found that the normalized permeability and inertial coefficients of the LS were 20–80% and 50% higher than that of stochastic foam, showing superior structural characteristics. Additionally, the fluid flow and heat transfer performances of the LS were similar to stochastic foam, making them ideally suited for tailored multifunctional heat sinks and exchangers. Kemerli et al. [25] revealed that strut length and diameter had a great impact for the heat transfer performance of the LS, which provided two research objects for the integral optimization model herein. Luo et al. [26] found that longitudinal vortices distributed between an adjacent LS, which increased the turbulence intensity of the mainstream, facilitated the mixing of high and low speed fluids, so as to improve the heat transfer rate of the supercritical CO2 channel and reduce the heat transfer deterioration. Liang et al. [27] studied a face-centered cubic LS, and the results showed that a face-centered cubic LS greatly improved heat transfer and fluid flow performances by increasing the porosity and the turbulence intensity. Yun et al. [28] also studied the face-centered cubic LS based on additive manufacturing using a thermal fluid–structure interaction model, and the results revealed that this LS can reduce thermal stress, improving the structural performance, except it can improve the heat transfer and fluid flow performances of the cooling channel. Li et al. [29] found that the heat transfer and fluid flow performances of the cooling channel can be greatly improved by introducing pin-fins/protrusions/dimples in LS channels. Ma et al. [30] found that the heat transfer rate and pressure loss of the heat system were effectively improved by adding heat transfer enhancement components into an LS filled in the channel. In conclusion, fluid flow and heat transfer performances of the LS and other structures filled in a sandwich panel were fully investigated. Filling structures included metal foam [31], a rectangular corrugated hole structure [32] and various lattice core junctions (such as a vertical lattice, tilted lattice, Kagome lattice, tetrahedral lattice and pyramid lattice) [33]. Moreover, Fu et al. [34] claimed that the mechanical performances (bearing load, vibration, lightweight and small damping ratios) of the LS were superior. They also presented an optimal design method for a geometrically nonlinear LS to analyze the design sensitivity of the displacement, stress, and critical load factor. The results showed that these variables agreed well with the theoretical counterparts and results reported in the literature [35].
The above studies mainly concerned the heat transfer performance or mechanical performance of the LS, and few studies used the LS in the cooling channels of turbine blades. According to the previous research [36], an integral optimization model was a very effective tool to realize the comprehensive optimization of multi-disciplines. Herein, the aim was to build an integral optimization model concerning both the heat transfer and mechanical performances of the LS used in the internal cooling channels of turbine blades. The size and operating condition of the LS cooling channel were based on modeling real conditions of gas turbine blades. Herein, a PLS and KLS with a simple row of five LS cores were mainly investigated. Firstly, the height (H) of the LS channel, diameter (D) of the LS member and inclination angle (ω) of the LS member were key geometric variables of the LS channel. The aspect ratio of the LS channel changed from 2 to 4 with the change of H. Secondly, Nu was used to represent heat transfer performance, which was similar to reference [36]; the first-order natural frequency (freq1) was used to represent vibration performance; the equivalent elastic modulus (E) was used to represent bearing load performance; and relative density () was used to represent lightweight performance. These four characteristic variables were taken as the objectives of the LS channel. In addition, functions which represent characteristic relevance between the geometric variables and these objectives were established; two selected optimization problems (Op-I and Op-II) with two/three objectives were presented and solved by the NSGA-II algorithm. The results of Op-I and Op-II of the KLS were analyzed. Finally, relevant simulations and experiments were developed to verify the effectiveness of these results. The results suggested that the optimization model was relatively accurate and reasonable.
2. Research Object
Figure 1a shows that lattice structures (LSs) were inserted at region ‘1’ and ‘2’ in the internal cooling channel of a turbine blade. This can greatly enhance heat transfer and improve the mechanical performance in these regions, according to previous research. However, in order to simplify the research, complex types of LS were not considered. Herein, only two simple types of LS were chosen to be the research objects, which were the pyramid-type lattice structure (PLS) and Kagome-type lattice structure (KLS), shown in Figure 1b. The cooling channel with the PLS and KLS was simplified as the channel with thin walls, thickness of which was 2 mm and only filled a row of five LS cores. The fundamental material of the PLS and KLS channels was nickel-based superalloy IN718, and its physical properties are shown in Table 1.
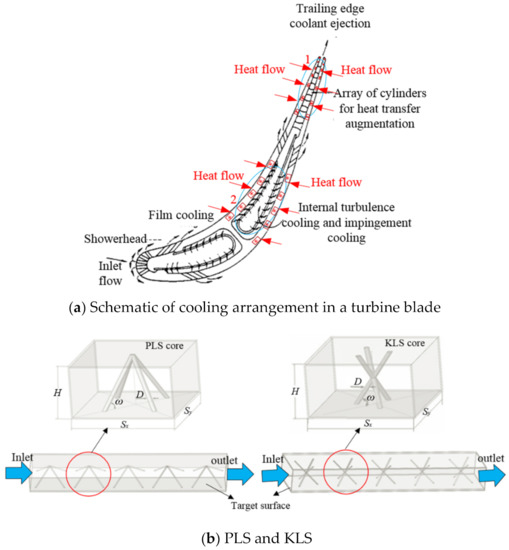
Figure 1.
Cooling structures of turbine blade and LS cooling channels.

Table 1.
Geometric parameters of LS core and its material information.
There were five geometric parameters about the LS core, which were member diameter (D), member inclination angle (ω), length (Sy), width (Sx) and height (H) of a single LS core. The key variables of the optimization model were H, D and ω, shown in Table 1. The aspect ratio meant a ratio of width to height of the LS core which considered different sizes of LS cooling channels used in the thin-wall blades.
In this study, the aspect ratio of the LS channel ranged from 2 to 4, corresponding to the aspect ratio of typical internal cooling channels. The whole length of the LS cooling channel was 400 mm. Preliminary selection values of H, D and ω were given as 40 mm, 2 mm and 45°, respectively, according to reference [36]. A cooling channel based on these initial values was the initial basic channel.
3. Description of Optimization Problems
Previous studies for LSs focused mainly on the investigation of its mechanical performances, and few studies used an LS to improve both the heat transfer and mechanical performances of turbine blades. If more LSs are inserted at the thin-wall blade, the bearing load, vibration and heat transfer performances of the turbine blade may be better. However, it may also enlarge the blade weight and pressure loss of the cooling channel. Therefore, the aim herein was to seek for reasonable topology of an LS (an optimal LS) which could improve both the heat transfer and mechanical performances. The heat transfer and mechanical (bearing load, vibration and lightweight) performances of the LS core were viewed as optimization objectives/functions, similar to reference [36], which can be relatively optimal in a range of H, D and ω.
A mathematical optimization model was established at the start of structural design of the LS. Geometric variables of the optimization model were H, D, and ω; Nusselt number (Nu), the first-order natural frequency (freq1), relative density () and equivalent elastic modulus (E) were selected as objectives/functions to characterize the performances of heat transfer, vibration, lightweight and bearing load, respectively, and these functions were the key contents to develop the integral optimization model.
The variable of the optimization model was the geometric variables of the LS channel. Its expression is:
x = (x1,x2,x3)T = (D,ω,H)T
The functions of heat transfer performance and two mechanical performances (lightweight and vibration) of the mathematical optimization model were f1(x), f2(x) and f3(x), respectively. The expressions are:
The function of the last selected mechanical performance (bearing load) was f4(x), which was taken as a constraint of the LS core in order to simplify the calculation process. Its expression is:
where σ is the Euler buckling critical load of the LS core.
Other constraints of the optimization model were the ranges of three geometric variables. The expressions are:
According to different emphases of the heat transfer and mechanical performances of the LS cooling channel, two kinds of optimization problems were proposed. Optimization problem I (Op-I) was a problem based on the heat transfer and lightweight performances (Nu and ) of the LS cooling channel. Its corresponding mathematical model is:
Op-I:
where ‘Max’ and ‘Min’ mean that the heat transfer and lightweight performances should reach relatively maximum and minimum, respectively; and ‘s.t.’ means the constraints of the optimization problem. By solving Op-I, the aim to design an LS channel was pursued to achieve the best heat transfer and the lightest weight within a certain permitted structural range.
Optimization problem II (Op-II) was a problem based on heat transfer, lightweight and vibration performances (Nu, and freq1). Its corresponding mathematical model is:
Op-II:
where ‘Max’ means that heat transfer and vibration performances should reach relatively maximum, and ‘Min’ means that lightweight performance should reach relatively minimum. Additionally, ‘s.t.’ means the constraints of the optimization problem. By solving Op-II, the aim to design an LS channel was pursued to achieve the best heat transfer, the highest resonance frequency and the lightest weight within a certain permitted structural range and structural strength.
4. Establishment of Optimization Objective Functions
In the optimization model, the most important task was to establish the mathematical calculation expressions for these objectives (Nu, freq1, E and ). According to reference [36], these objectives were dependent to geometric variables (D, H and ω). Some expressions of these relations were derived as follows.
4.1. The Function of Heat Transfer Performance Based on the Fin Method
The turbulent flow and local heat transfer coefficient can be augmented by inserting an LS. According to reference [36], Nu was used to represent the heat transfer performance; meanwhile, it was associated with geometric parameters (D, H and ω) by the heat transfer function. The basic equations of Nu are:
where h is the heat transfer coefficient of the target surface; Dh is the hydraulic diameter; kf is the thermal conductivity of cooling gas; q is the specified heat flux of the target surface; Tw is the average temperature of the target surface; Tin is the average temperature of cooling gas at the entry.
The heat transfer of each member in the LS cooling channel was considered as the same; therefore, only the heat transfer of a single member was analyzed. The temperature control equation is:
where η is the coordinate along single member direction; n is the number of LS cores along the flow direction in the LS channel; Tf(η,n) is the temperature of the η coordinate in the member of the nth row of the LS core; Tf(n) is the average temperature of cooling air in the nth row of the LS core; h∞ is the heat transfer coefficient between member surfaces and cooling air; according to reference [37], h∞ is equal to 1.19(Re)0.6; P is the section perimeter of a single member; S is the cross-sectional area of the member; is the thermal conductivity of a single member.
The other side walls of the LS cooling channel were given as the adiabatic walls of no slip and no penetration. The initial heat flux q0 went into each member from the target surface, which can be calculated as:
where q0 is the heat flux coming from the surface of a single member at the place of η = 0.
By combining Equations (10) and (11), Equation (12) can be obtained:
where l is the length of single member, , and H is the height of the cooling channel; , with the dimension of L−1.
When η = 0, the temperature of a single member was equal to the temperature of the wall, i.e., Ts(η,n) = Tf(0,n) = Tw(n). According to Equation (10), the following can be obtained:
From the law of conservation of energy, the following can be obtained:
where is the cooling air density; um is the average velocity of cooling air, um = Reμ/(ρfDh); Re is the Reynolds number; μ is the dynamic viscosity of cooling air; CP is the specific heat capacity of cooling air.
In order to obtain q0, it was necessary to obtain heat flux q1, which entered internal fluid directly from the target surface, and it can be obtained by:
where h1 is the heat transfer coefficient between the cooling air and the target surface. In order to simplify the calculation, the thermal resistance between the member and the target surface was ignored, i.e., h1 and h∞ were considered to be the same value. Therefore, the heat flux q entering the nth row of the LS core was calculated as:
where D is the member diameter.
By combining Equations (15) and (16), the final equation can be obtained:
In conclusion, the average heat transfer coefficient of the LS core can be calculated as:
By combining Equations (13), (17) and (18), the average Nu can be obtained. The expression of the average Nu for the PLS core is:
The expression of the average Nu for the KLS core is:
In conclusion, the average Nu expression for the whole cooling channel was:
where N was 5 in this study, meaning that the LS channel included five LS cores.
The first objective of present study was f1(x). Its expression was given by Equation (21). The effectiveness of this equation can be validated by the experimental data of Kim [14].
It can be observed from Figure 2 that with the increase in Re, the trend for the growth of Nu was consistent with the experiment value of Kim [14] and the calculation value of the cooling channel with the fin method based on Equation (19). Meanwhile, the maximum error between the calculated value with the fin method and the experiment value of Kim [14] was about 17%; therefore, the given function of Nu was considered to be reliable with the uniform trend line. Furthermore, compared with five LS cores, when 10 LS cores were set, the average Nu decreased by 23.1%; when 15 LS cores were set, the Nu decreased about by 47.9%. Therefore, five LS cores were set in the flow direction of the cooling channel to reduce its overall size. According to reference [38], pressure loss increased gradually with the increase in Re. However, when Re reached up to 10,000, pressure loss was only about 300 Pa in the LS channel. In addition, changing the D, H and ω of a single LS core had a small effect on the change of pressure loss of the cooling channel. Therefore, pressure loss was not investigated further in following research.
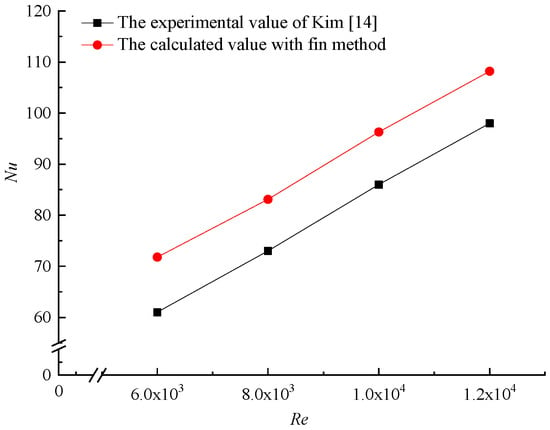
Figure 2.
Comparison of the experimental value of Kim [14] and the calculated value with fin method.
In conclusion, the expression of the first objective of the optimization model (f1(x)) was obtained, which represented the heat transfer performance of the LS cooling channel.
4.2. The Function of Vibration Performance
Low frequency vibration and vibration, causing the structural resonance of turbine blades, should be avoided. The natural frequency of the turbine blades should be increased. To achieve these objectives, the LS cores were set at an internal cooling channel of turbine blades in this study, and finite element analysis method (FEA) was used to set up the relevance between the first-order natural frequency (freq1) and geometric parameters (D, H and ω) of the LS cooling channel. This relevance was determined by an implicit function box by numerical calculation using ABAQUS software. Therefore, the expression of freq1 can be obtained:
where this value was given by ABAQUS software directly by the process of numerical simulation.
In the numerical simulation, the boundary condition of the LS cooling channel was fixed support on one side and free on the other side. Herein, the vibration of the PLS and KLS cooling channels were mainly investigated. However, in a previous study, a new type of LS channel, which was X-type LS (XLS), was used as the calculation model because of its symmetrical characteristic in topology and more importantly, the XLS was formed by two PLSs and has similar topology with the KLS. Therefore, the validation of Equation (22) was based on the XLS cooling channel. The second objective was f2(x). This expression was validated as follows.
The XLS channel is shown in Figure 3a. The material of the XLS cooling channel used in the experiment was PLA resin (PLA material parameters are shown in Table 1). A modified quadric tetrahedron element (C3D10M) was used in the process of mesh generation. After the verification of grid independence, the first six-order natural frequencies (freq1–6) tended to be stable when the grid number was about 100,000. Therefore, the computational grid number of the XLS channel was taken as about 100,000. Relevant experiments were carried out to further verify the reliability of Equation (22). In the experiment, a SIEMENS SCM205 dynamic signal analyzer was used; the model of force hammer was PCB086C03 with a sensitivity of 2.25 mV/N; a PCB356A66 piezoelectric accelerometer sensor was used with a sensitivity of 1.034 mV/(m·s2), and a vice was used to fix the test sample so as to reduce its impact on the accuracy of the experimental results. Figure 3a shows a sample of the XLS channel and the layout of the relevant measuring points. The sample was divided into five parts in the length direction and two parts in the width direction, with equal proportions. Nodes were numbered in sequence, and the geometric model established in LMS Test.Lab was consistent with those settings. Acceleration sensors were put at point 5, 11 and 14 of the sample to pick up vibration signals, and a hammer was used to knock at point 17. The average value was obtained after striking the point 5 times. Signals were captured by the acceleration sensor and force hammer sensor, which were transmitted to multi-channel data acquisition apparatus for processing. Finally, the data were transmitted to the PC end for relevant data processing, and relevant parameters were obtained.

Figure 3.
Printed XLS cooling channel and validation of freq1.
Figure 3b shows that in freq1–3, the experimental value and calculated value showed good consistency, and its maximum error was within 10.5%. When it came to freq4–6, the error between them was relatively large, and the maximum error reached 24.9%. The reason for the analysis error lay in two aspects. On the one hand, due to the limitation of the printing accuracy of the printer, the printed sample had certain defects. Especially, the printing mode was adopted without internal support at the top of the channel, which made the resin material on the top of the sample not fit tightly enough. On the other hand, because the sample was a thin-walled structure, it was inevitable that some deformation would occur when the sample was fixed with the vice. However, in the simulation process using FEA, there were no defects in the three-dimensional model, and its deformation was not considered when the constraints were applied. Meanwhile, according to [39,40], the maximum errors between the modal experimental values and the calculated values caused by some defects of the test piece could reach 17.7% and 15.21%, respectively, while the error of freq1 between the experiment and simulation herein was only 10.5%. Therefore, the value of freq1 calculated by numerical simulation was accurate, i.e., Equation (22) was reliable.
In addition, Figure 3b also shows that the curve of freq1–6 of simulation material using IN 718 was basically linear when using PLA. Although the experiment of IN 718, which is real material of turbine blades, was not developed, the simulation results of PLA had a similar regulation with IN 718. Therefore, it may provide guidance for research of an LS cooling channel made of IN 718.
The expression of the second objective of the optimization model (f2(x)) was obtained, which represented the vibration performance of the LS cooling channel.
4.3. The Function of Lightweight Performance
Lightweight performance was considered to be improved in the turbine blade using LS cores. The relative density () of the LS channel was used to evaluate the structural characteristic of lightweight. The relevance between and geometric parameters of the PLS channel was:
where Vmembers is the volume of the member, and Vcore is the volume of the single PLS core, and Sy is the length of KLS core. The expression of relative density for the KLS core was ., where .
The expression of the third objective of the optimization model (f3(x)) was obtained, which represented the lightweight performance of the LS cooling channel.
4.4. The Function of Bearing Load Performance
Bearing load performance was considered to be improved in the turbine blade using LS cores. The equivalent elastic modulus (E) of the LS channel was used to evaluate its bearing load performance. The relevance between E and geometric parameters of the LS core was derived using a PLS core. One member of the PLS core was analyzed, as shown in Figure 4a. An outer load F was added at the upper end of the member, and the member had a displacement δ, which caused axial force FA and shear force FS. As all forces in the member were balanced, F can be obtained along vertical direction:
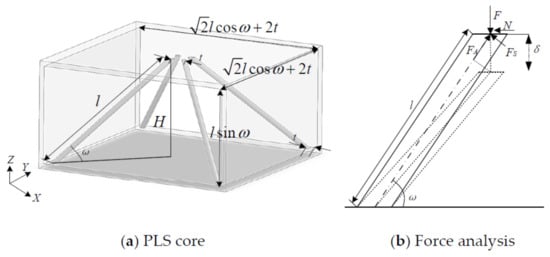
Figure 4.
Force analysis of single member of PLS core.
According to the compression and bending function of the member, FA and FS can be obtained:
where Ec is elastic modulus of the material of the PLS channel.
The equivalent plane compressive stress and strain can be defined as:
where l is the length of the member, as shown in Figure 4a,b, l = H/sinω. A is the area of the bottom surface of the PLS core, ; D is the diameter of the member; t is a small spacing between two members at the top wall of the PLS core and also was a small spacing between one of side walls of the PLS core and the member at the bottom wall of the core.
Combining Equations (27) and (28), the plane equivalent elastic modulus of the PLS can be obtained:
where is the relative density of the PLS core, . As shown in Figure 4b, D/(2l) was generally a small value; therefore, for Equation (26), the second part can be ignored. Thus, the equivalent elastic modulus can be expressed as:
The expression of E was obtained:
where f3(x) is the third objective of the present study, and Equation (39) was also used for the E of the KLS channel with different Ec and .
The Euler buckling critical load of the member was:
where kb is the end restraint factor for buckling. For the LS, due to the large slenderness ratio of the member and the thin panel, the constraint at the end of the member was weak. Therefore, k was taken as 2.
The expression of the third objective of the optimization model (f4(x)) was obtained, which represented the bearing load performance of LS cooling channel, and f4(x) was not used as an objective of the present study, which was used as a constraint in order to simplify the optimization calculation.
As mentioned above, the expressions of four functions (f1(x), f2(x), f3(x) and f4(x)) and one constraint () were obtained, respectively. Based on these expressions, the integral optimization model was solved on the ISIGHT platform as follows.
5. Establishment of Optimization Model
The optimization model for the PLS and KLS was built by ISIGHT2018. Figure 5a shows that models of PLS and KLS cores were established by SOLIDWORKS; the value of freq1 was calculated by ABAQUS; and Nu, , E and σ were directly calculated by their equations. Herein, the heat transfer and mechanical performances of the LS channel were mainly investigated. Moreover, in future study, the pressure loss, porosity and friction coefficient of the LS channel might be added at this optimization model.
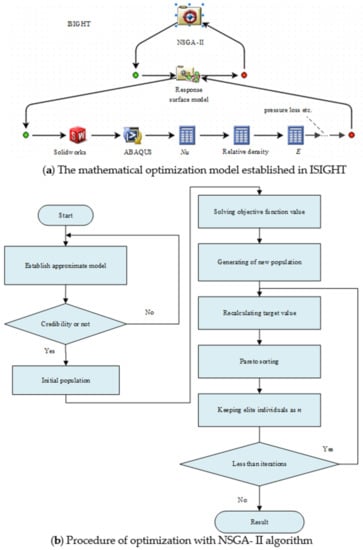
Figure 5.
Mathematical optimization model establishment and the procedure of optimization.
In ISIGHT, model objectives (freq1, Nu and ) were the input values, while E and σ were taken as the constraints. The relevance between model variables (H, D and ω) and these model objectives was established by the third-order response surface model (RSM), as shown in Figure 6a. The RSM was used to establish the approximate model to improve the calculation efficiency. In order to make all test points evenly distributed in the design space, the DOE optimal Latin hypercube (opt. LHD) sampling mode with the sample number of 50 was used, and the sample number for error analysis was 25. Part of them is shown in Table 2, and its whole version is shown in Table A1. Response values were obtained by numerical simulation according to different input parameters.
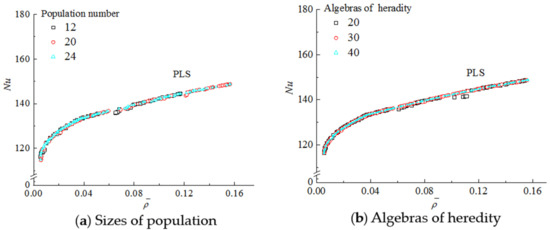
Figure 6.
Influence of main parameters of genetic algorithm on the stability of results.

Table 2.
Experimental design of the DOE optimal Latin hypercube.
There was a certain error compared to the actual model, because the RSM could not guarantee to pass all the sample points. In order to ensure the calculation accuracy of the approximate model, the fitting accuracy R2 was used to verify the effectiveness of the approximate model.
The calculation formula of the fitting accuracy R2 was:
where SSR represented the sum of regression squares, ; SST represented the sum of total squares, ; was the average value of response; was the predicted value at the design point; was the real value of response; and k was the number of sample points.
It can be observed from Table 3 that the fitting accuracy values for the four optimization objectives were all more than 0.97. Therefore, the model can approximate the actual model well, and can be used for the following optimization solution of the LS cooling channel.

Table 3.
Fitting accuracy of approximate models of KLS.
As shown in Figure 5a, the NSGA-II algorithm with a good exploration performance was selected. The specific procedure is shown in Figure 5b. The NSGA-II algorithm was described based on the PLS cooling channel as follows.
In this algorithm, the sizes of population were given as 80; the algebras of heredity were given as 100; the crossover of probability was given as 0.9; the index for distribution of mutation was given as 20. Figure 6 reveals that when the sizes of population increased from 12 to 24, the Pareto front tended to be consistent. When the sizes of population were 20, the Pareto fronts of the PLS were basically stable, as shown in Figure 6a. With the increase in the algebras of heredity from 20 to 40, the Pareto fronts tended to be consistent. In addition, when the algebras of heredity were 30, the Pareto fronts of the PLS were basically stable, as shown in Figure 6b. Therefore, to avoid only obtaining a local optimal solution and to improve the accuracy of the optimization results, the sizes of population and algebras of heredity were given as 20 and 30, respectively.
6. Sensitivity Analysis and Discussion of Optimization Results
As mentioned above, functions representing the relevance between the heat transfer and mechanical performances and geometric parameters were given. A mathematical optimization model was built based on these functions. The given functions were the input values of the optimization model; Op-I and Op-II were solved by the NSGA- II algorithm. Sensitivities between the objectives and geometric parameters of LS cooling channels were analyzed. The overall sensitivity represented the relations among objectives, and a higher overall sensitivity meant that the solution set of optimization problem was more concentrative. Single sensitivity represented the influence law of geometric variables to optimization objectives, and a higher single sensitivity meant that the change of variables had a larger influence on the objectives.
6.1. Sensitivity Analysis
As shown in Figure 7a, the Pareto fronts of Nu and were approximately exponential distribution when the aspect ratio of KLS and PLS cores changed. Table 4 and Table 5 reveal that the Pareto fronts of Nu were mainly concentrated in the higher area, while the Pareto fronts of were mainly distributed in the area with lower values for both PLS and KLS cores in Op-I. For the PLS core, the optimal solutions of Nu between 140 and 180 accounted for 89% of the total solution sets, whereas the Pareto front of Nu for the KLS core distributed widely in this region. In contrast, the distribution of the Pareto fronts of for PLS and KLS cores were more concentrated in the area with lower values than that of Nu. However, the distribution of optimization solutions was relatively uniform. Therefore, for Op-I, the overall sensitivity of Nu was higher than that of for both PLS and KLS cores.
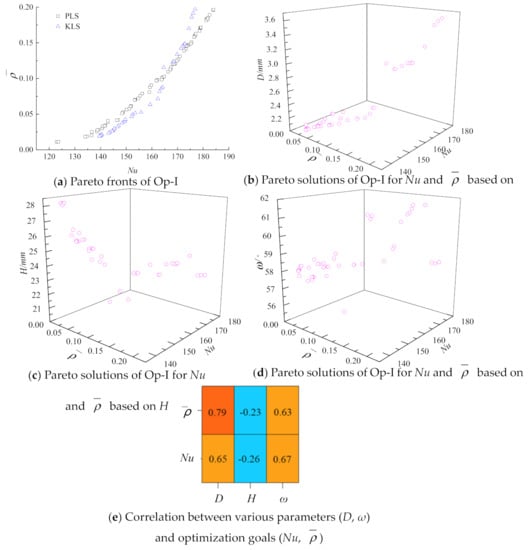
Figure 7.
Sensitivity analysis for Op-I.

Table 4.
The distribution for Pareto solutions of Nu for Op-I.

Table 5.
The distribution for Pareto solutions of for Op-I.
As discussed above, under the same , Nu distribution in the KLS core was more uniform than that of the PLS core. It meant the KLS core showed better heat transfer and lightweight performances. Therefore, only the KLS core was selected for the analysis of single sensitivity. As shown in Figure 7b–d, the optimal solutions of D were between 2.0 mm and 3.6 mm, which mainly concentrated between 2.2 mm and 2.6 mm; the optimal solutions of H were concentrated between 21 mm and 28 mm and its total distribution was relatively uniform; and the optimal solution of ω was between 56° and 62° and its total distribution was also relatively uniform.
In addition, the correlation coefficient was used to represent the single sensitivity of each model variable (H, D and ω), and its calculation formula was:
where , , SXY is the total variation of samples, ; SX is the standard deviation of X sample, ; and SY is the standard deviation of Y sample, . Among them, the positive sign indicates a positive correlation, and the negative sign indicates a negative correlation. Meanwhile, the larger these values, the stronger the correlation between two variables, and the stronger single sensitivity, and vice versa.
Figure 7e shows that the Pareto solutions of D were the most sensitive to , followed by Nu. The Pareto solutions of H had negative correlation with and Nu. The Pareto solutions of ω were the most sensitive to Nu, followed by .
In conclusion, the overall performance of Op-I was that the function of Nu had the highest overall sensitivity for Op-I, and the function of had the highest single sensitivity to D.
Figure 8a shows the Pareto fronts of Op-II for PLS and KLS cores. The Pareto fronts distributed at a curved surface approximately for both PLS and KLS cores. It suggested that freq1 had a great influence on the other two optimization objectives (Nu and ). At the same time, the change of H made the freq1 of both PLS and KLS cores change greatly. For both the PLS and KLS core, the optimal solutions of freq1 were between 180 Hz and 280 Hz. Therefore, the highest overall sensitivity of Op-II was freq1. Table 6 and Table 7 show that the Pareto fronts of Nu were mainly concentrated in the high area, while the Pareto fronts of were mainly distributed in the area with low values. For the PLS core, the optimal solutions with Nu between 140 and 208 accounted for 69% of the total solution sets; and for the KLS core, the optimal solutions with Nu between 140 and 208 accounted for 75% of the total solution sets. In contrast, the Pareto front distributions of the of PLS and KLS cores were more concentrated in the area with lower values. However, in general, the distribution of optimization solutions was relatively uniform.
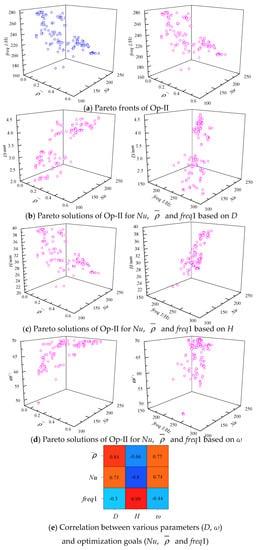
Figure 8.
Sensitivity analysis for Op-II.

Table 6.
The distribution for Pareto solutions of Nu for Op-II.

Table 7.
The distribution for Pareto solutions of for Op-II.
In conclusion, for Op-II, the overall sensitivity of Nu was higher than that of , regardless of the PLS or KLS core. However, the KLS core showed relatively better performances under the expected results of these two objectives. Therefore, only the KLS core was analyzed for the single sensitivity, as follows.
It can be found from Figure 8b that the optimal solutions of D were concentrated between 2.0 mm and 4.5 mm, which was mainly concentrated between 2.0 mm and 3.0 mm. Figure 8c shows that the optimal solutions of H were concentrated between 22 mm and 40 mm, which was mainly concentrated between 22 mm and 38 mm. As shown in Figure 8d, the optimal solution of ω was between 50° and 70°. Figure 8e reveals that the change of H had a great impact on freq1, showing a strong positive correlation between them, whereas Nu and had a strong negative correlation.
In conclusion, freq1 had the highest overall sensitivity for Op-II; Nu came second; and came last. The value of H had the highest single sensitivity on freq1, representing the vibration performance of the KLS core.
6.2. Discussion of Optimization Results
From the analysis of overall sensitivity, the comprehensive performance of the KLS was better than that of the PLS. Therefore, the optimal data of the KLS were used to derive the representative function. The Pareto fronts obtained above were a series of discrete points, and it was necessary to give a continuous set of solutions as a reference to real application. Figure 9a,b suggest that the distribution form of the Pareto fronts for Nu and of Op-I and Op-II showed a strong convexity. Therefore, the first-order exponential function was used to derive the representative function. Its equation was as follows, and each coefficient in the formula is given in Table 8.
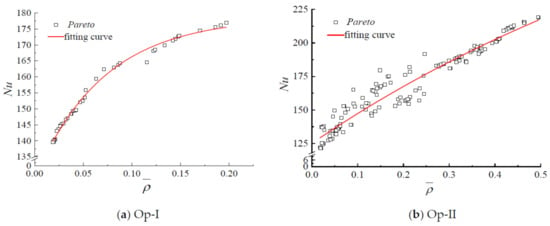
Figure 9.
Pareto fronts and fitting curves.

Table 8.
Coefficients of the set of Pareto optimized solutions in fitting function.
Moreover, the results between the optimal KLS channel and the initial KLS channel were compared, as shown in Table 9. For Op-I, when Nu reached 140, it was about 21.4% higher than the initial model, and the value of decreased by 71%. For Op-II, when the Nu reached 150, it was 30.8% higher than the initial model, and value of improved little compared with the initial model. Additionally, H had the highest single sensitivity on freq1, representing the vibration performances of the LS channel. Values of freq1 under both the optimal KLS model of Op-I or Op-II were smaller than that of the KLS initial model. The results suggested that the optimization model can effectively seek reasonable structural parameters (H, D and ω) to improve the heat transfer, lightweight and vibration performances of the LS channel.

Table 9.
Comparison of initial model the optimal model of KLS.
7. Effectiveness of Optimization Results
In conclusion, a group of optimal structural parameters of the KLS channel was obtained to develop a relevant KLS model which had relatively excellent mechanical and heat transfer performances by the mathematical optimization model. Three validation methods were used to verify the accuracy of this mathematical optimization model, as follows.
7.1. Effectiveness of Bearing Load Performance
Although the function of bearing load performance was used as a constraint, which was represented by E, its value can be used to verify the effectiveness of the mathematical optimization model by a corresponding experiment, as follows.
Only a single KLS core of the initial model and the optimal model was made by IN 718 because the KLS had the property of periodicity, as shown in Figure 10a. According to the GB/T 1041–2008 test standard, the unidirectional compression test of the structure was carried out by a ctm2000 universal material testing machine. The pre cyclic loading method was adopted in the experiment, and the loading rate was 0.5 mm/min. The force displacement curve of the KLS core was obtained. As shown in Figure 10b, the black curve was the force displacement curve of the KLS initial model; the maximum force was 8543.267 N, converting into an equivalent elastic modulus of 680.196 MPa; the theoretical calculation value of the equivalent elastic modulus was 830.265 MPa, and the error between them was 10.3%. Therefore, E can accurately evaluate the bearing load capacity of the KLS core. Moreover, it can be observed from Figure 10b that the maximum bearing capacity of the optimization result of Op-I and Op-II were 11,089.41 N and 12,404.22 N, respectively. Compared with the KLS initial model, the maximum bearing load capacity of the optimized KLS was significantly improved. As shown in Figure 10c, the maximum bearing load capacity for the optimal KLS of Op-I was increased by 29.8% compared to that of the KLS initial model. The maximum capacity of bearing load for the optimal KLS of Op-II was increased by 45.2% compared to that of the KLS initial model. Therefore, the optimization model was effective for bearing load performance.
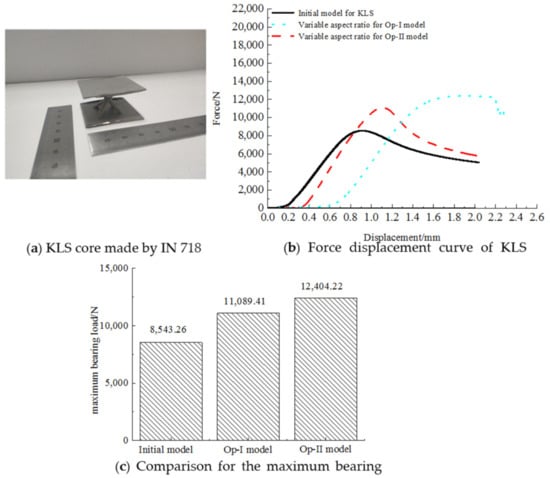
Figure 10.
KLS core and the comparison data of KLS core.
7.2. Effectiveness of Vibration Performance
The first-order natural frequency (freq1) was used to evaluate the effectiveness of the vibration performance of the KLS channel by a relevant numerical simulation based on ABAQUS 2018. Table 10 shows the comparison of freq1 between the optimization results and simulation results of the KLS. The error between the optimization results and the numerical simulation results was less than 3.3%. It is worth noting that the H of the initial model was 40 mm, whereas the H of the optimal models of Op-I and Op-II were 26.5 mm and 30.3 mm, respectively. Meanwhile, the freq1 of the optimal model of Op-I was 27.9% lower than that of the initial model, and the value of freq1 of Op-II was 19.3% lower than that of the initial model, suggesting that freq1 increased with the increase in H. Additionally, this proved that the vibration performance of the optimal models cannot be improved compared with the initial model, because freq1 should be higher to avoid low frequency vibration. However, the optimization model still can be proved to be effective for vibration performance.

Table 10.
Comparison of freq1 between optimization results and simulation results of KLS.
7.3. Effectiveness of Heat Transfer Performance
Nusselt number (Nu) was used to evaluate the effectiveness of the heat transfer performance of the KLS channel by a relevant numerical simulation based on ICEM CFD and CFX18.0. The simulation models of the KLS channel were shown in Figure 1b. Grids of the KLS simulation models were finished by ICEM CFD and the average Nu of the target surface was stable, with the grid numbers of 4,600,000. During the calculation in CFX18.0, the standard k-ε turbulence model was used, pressure correction based on a simple algorithm was used, and the second-order upwind scheme was selected. The turbulence intensity of both inlet and outlet was given as 5%. More settings for numerical calculation are shown in Table 11.

Table 11.
Boundary conditions of the simulation for KLS channel.
The definition of Reynolds number (Re) was:
The definition of average Nu was:
where um is the inlet velocity; Dh is the hydraulic diameter; q is the constant heat flux of target surface; Tw is the temperature of the target surface; Tin is the average temperature of cooling air of the entry; H is the height of channel; μ is the dynamic viscosity of cooling air; is the mass flow rate.
As shown in Figure 11, the experimental data of the KLS from Kim [37] were used to verify the effectiveness of turbulence model. It suggested that Nu obtained with the standard k-ε turbulence model was very consistent with the experimental Nu values. The error between them was less than 9.6%. Therefore, the standard k-ε turbulence model was used for the subsequent numerical simulation.
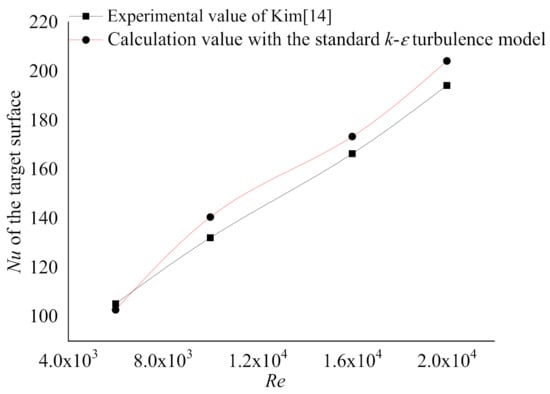
Figure 11.
Validation of turbulence model.
The simulation results for the fluid flow and heat transfer of the KLS channel were obtained. Figure 12a–c reveal that the KLS member had a greatly disturbing effect on the air flow in the channel, and the flow velocity in the rear along the flow direction was significantly reduced. For the initial model, because its member diameter was smaller than that of the optimal models, a small area with low velocity formed behind the member. For both optimal models of Op-I and Op-II, airflow disturbance was strengthened with the increase in member diameter. Figure 12d–f show that Nu distributions in the target surface of the optimal models were more uniform than that of the initial model. As shown in Figure 12g, the average Nu of the target surface between the optimal value and simulation value were very close. This suggested that the optimization model can be proved to be effective for heat transfer performance. Moreover, pressure loss under the condition of Re = 10,000 was 385.621 Pa, 371.945 Pa and 360.681 Pa for the KLS initial model, KLS optimal model of Op-I, and KLS optimal model of Op-II, respectively. The pressure loss of those three models was closed and acceptable for the KLS channel, which only had five LS cores. Thus, pressure loss was not considered as a key objective herein.
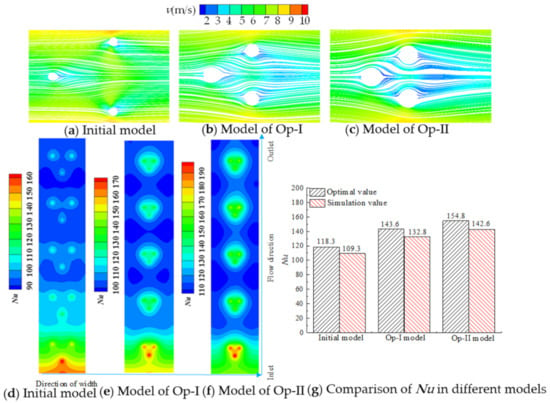
Figure 12.
Numerical simulation results of KLS.
8. Conclusions
- The present study established an integral optimization model based on the LS used in turbine blades with a variable aspect ratio (height (H) of the cooling channel was not constant). Herein, H, member diameter (D) and inclination angle (ω) were key geometric variables of LS; Nusselt number (Nu), the first order natural frequency (freq1), relative density () and equivalent elastic modulus (E) were key objectives of the optimization model. Two selected optimization problems (Op-I and Op-II) were proposed to obtain optimal structures of the LS, and the NSGA-Ⅱ algorithm was used to solve Op-I and Op-II.
- For Op-I (Nu and were the objectives), the overall sensitivity of H, D and ω for Nu was higher than . The single sensitivity of D for was higher than Nu, the single sensitivity of ω for Nu was higher than , and both and Nu had a negative correlation to H. The parameters of the optimal LS were: 2.2 mm ≤ D ≤ 2.6 mm, 21 mm ≤ H ≤ 28 mm, 56° ≤ ω ≤ 62°.
- For Op-II (Nu, freq1 and were the objectives), the overall sensitivity of H, D and ω for the objectives was ranked as freq1, Nu and . The single sensitivity of D for the objectives was ranked as freq1, and Nu, the single sensitivity of ω for the objectives was ranked as Nu, and freq1, and there was a strong positive correlation between H and freq1, whereas H had a strong negative correlation with both and Nu. The parameters of the optimal LS were: 2.0 mm ≤ D ≤ 3.0 mm, 22 mm ≤ H ≤ 38 mm, 50° ≤ ω ≤ 70°.
- As shown in Figure 13a–d, compared to the initial KLS, Nu and E increased by 21.4% and 29.8%, respectively, while freq1 and decreased by 27.9% and 71.1%, respectively, in the optimal KLS of OP-I; Nu and E increased by 30.8% and 45.2%, respectively, while freq1 decreased by 19.3% and slightly increased in the optimal KLS of Op-II. The results suggested that the heat transfer, lightweight and load bearing performances of the KLS were greatly improved by the optimization model (except for the lightweight performance for the optimal KLS of Op-II, which became slightly worse), but the vibration performances in the KLS for both Op-I and Op-II cannot be improved.
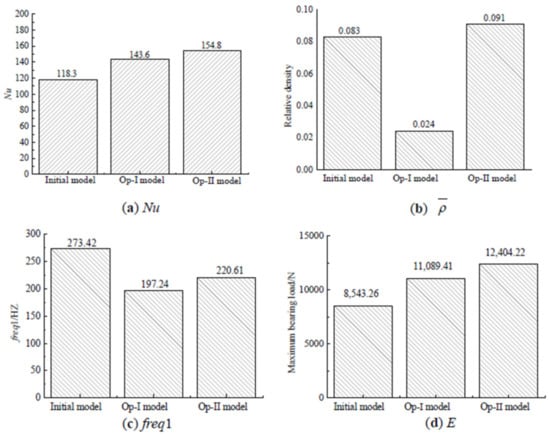 Figure 13. Comparison of the optimization results of KLS.
 - The fitting function of the Pareto fronts of Op-I and Op-II was obtained, which may provide guidance for the design of structural parameters for an LS cooling channel used at turbine blades with a variable aspect ratio.
Author Contributions
Conceptualization, L.X. (Liang Xu) and Q.S.; methodology, Q.S. and L.X. (Lei Xi); software, Q.S. and L.X. (Lei Xi); validation, L.X. (Liang Xu), Q.S., and Q.R.; formal analysis, L.X. (Liang Xu); investigation, Q.S.; resources, L.X. (Liang Xu); data curation, Q.R.; writing—original draft preparation, Q.R.; writing—review and editing, Q.R.; visualization, L.X. (Liang Xu); supervision, L.X. (Liang Xu), J.G. and Y.L.; project administration, L.X. (Liang Xu); funding ac-funding acquisition, L.X. (Liang Xu). All authors have read and agreed to the published version of the manuscript.
Funding
This research was funded by the National Key R&D Program of China, grant number 2018YFB1106400, the National Natural Science Foundation of China, grant number 51876157; Natural Science Foundation of Shaanxi Province in China, grant number 2019JM-096.
Institutional Review Board Statement
Not applicable.
Informed Consent Statement
Not applicable.
Data Availability Statement
Not applicable.
Conflicts of Interest
The authors declare no conflict of interest.
Nomenclature
| LS | Lattice structure |
| KLS | Kagome-type LS |
| Sy | Length of lattice structure core (mm) |
| l | Length of member (mm) |
| kb | The end restraint factor for buckling |
| H | Height of lattice structure core (mm) |
| ω | Inclination angle of member (mm) |
| Dh | Hydraulic diameter of lattice structure channel (mm) |
| kf | Thermal conductivity of air (W/m K) |
| q | Heat flux of target surface (W/m2) |
| Ts | Temperature of the η coordinate in member of the nth row (K) |
| Tw | Temperature of target surface (K) |
| h∞ | Heat transfer coefficient between member surface and air (W/m2 K) |
| q0 | Heat flux of the member where η = 0 (W/m2) |
| um | Average velocity of air (m/s) |
| Re | Reynolds number |
| CP | Specific heat capacity of air (J/kg K) |
| Relative density of lattice core | |
| freq1 | The first-order natural frequency of lattice core (Hz) |
| F | Force of member (N) |
| FS | Shear force of member (N) |
| εe | Strain of member |
| x1–3 | Model variables |
| f1–4(x) | Function of optimization objectives |
| k | The number of sample points |
| The index | |
| The average value of response | |
| rXY | The correlation coefficient |
| SX | The standard deviation of X sample |
| SY | The standard deviation of Y sample |
| PLS | Pyramid-type LS |
| XLS | X-type LS |
| Sx | Width of lattice structure core (mm) |
| t | Small distance between member and wall (mm) |
| N | Numbers of LS cores |
| D | Diameter of member (mm) |
| Nu | Nusselt number |
| h | Heat transfer coefficient of target surface (W/m2 K) |
| η | Coordinates along member direction |
| n | Number of lattice structure cores along the flow direction |
| Tf | Average temperature of air in the nth row (K) |
| h1 | Heat transfer coefficient between air and target surface (W/m2 K) |
| ks | Thermal conductivity of member (W/m K) |
| ρf | Air density (kg/m3) |
| m | Middle value (/m) |
| µ | Dynamic viscosity of air (Pa s) |
| q1 | Transfer heat flux (W/m2) |
| E | Equivalent elastic modulus of lattice structure core (Pa) |
| FA | Axial force of member (N) |
| σ | The Euler buckling critical load (Pa) |
| Mass flow rate (kg/s) | |
| R2 | Fitting accuracy |
| SSR | The sum of regression squares |
| SST | The sum of total squares |
| The predicted value at the design point | |
| yi | The real value of response |
| x | Difference between X and |
| y | Difference between Y and |
| SXY | Total variation of samples |
Appendix A

Table A1.
Experimental design of the DOE optimal Latin hypercube.
Table A1.
Experimental design of the DOE optimal Latin hypercube.
| Input Parameter | Response Value | ||||
|---|---|---|---|---|---|
| D/mm | H/mm | ω/° | freq 1/Hz | Nu | |
| 4.69 | 35.51 | 53.47 | 388.65 | 122.17 | 0.06 |
| 2.67 | 26.12 | 70.00 | 337.55 | 160.71 | 0.13 |
| 4.08 | 39.18 | 46.12 | 385.80 | 105.92 | 0.03 |
| 3.84 | 24.49 | 40.61 | 317.50 | 124.99 | 0.04 |
| 4.57 | 22.04 | 59.59 | 296.92 | 171.69 | 0.23 |
| 4.39 | 26.94 | 55.92 | 337.95 | 145.83 | 0.11 |
| 4.45 | 37.55 | 66.33 | 386.38 | 132.82 | 0.13 |
| 2.86 | 25.71 | 65.71 | 325.24 | 154.90 | 0.10 |
| 4.94 | 25.31 | 45.51 | 326.50 | 135.11 | 0.09 |
| 2.92 | 27.76 | 41.84 | 357.53 | 117.30 | 0.02 |
| 3.10 | 33.88 | 55.92 | 401.58 | 121.04 | 0.03 |
| 3.22 | 34.29 | 69.39 | 402.54 | 139.15 | 0.10 |
| 4.63 | 20.00 | 49.18 | 267.88 | 154.84 | 0.15 |
| 3.53 | 40.00 | 57.14 | 380.97 | 112.60 | 0.03 |
| 2.43 | 23.67 | 44.90 | 315.23 | 125.97 | 0.02 |
| 3.59 | 21.63 | 47.35 | 294.86 | 140.47 | 0.07 |
| 2.31 | 37.96 | 61.43 | 396.46 | 112.82 | 0.02 |
| 4.14 | 28.57 | 47.96 | 340.85 | 128.10 | 0.05 |
| 4.02 | 29.39 | 68.78 | 362.47 | 160.05 | 0.21 |
| 4.33 | 30.20 | 63.88 | 375.87 | 149.55 | 0.15 |
| 4.76 | 32.24 | 41.22 | 381.30 | 114.07 | 0.04 |
| 2.80 | 26.53 | 43.06 | 333.21 | 120.36 | 0.02 |
| 3.47 | 22.45 | 67.55 | 304.24 | 180.31 | 0.24 |
| 3.04 | 37.14 | 43.67 | 396.06 | 104.11 | 0.01 |
| 2.06 | 33.47 | 48.57 | 396.02 | 109.77 | 0.01 |
| 2.24 | 31.43 | 50.41 | 390.29 | 115.53 | 0.02 |
| 2.98 | 36.73 | 68.16 | 397.47 | 128.79 | 0.07 |
| 2.00 | 30.61 | 62.04 | 378.77 | 125.03 | 0.03 |
| 3.78 | 30.61 | 46.73 | 377.81 | 120.77 | 0.04 |
| 3.16 | 29.80 | 54.08 | 365.22 | 128.14 | 0.04 |
| 4.51 | 38.78 | 65.10 | 387.59 | 128.37 | 0.11 |
| 3.35 | 27.35 | 58.37 | 349.90 | 141.57 | 0.07 |
| 4.27 | 28.16 | 51.02 | 359.71 | 133.98 | 0.07 |
| 3.90 | 31.84 | 63.27 | 367.22 | 140.86 | 0.10 |
| 3.41 | 35.92 | 44.29 | 393.88 | 107.58 | 0.02 |
| 3.59 | 36.33 | 57.76 | 395.44 | 120.70 | 0.05 |
| 4.82 | 34.69 | 42.45 | 394.09 | 111.40 | 0.04 |
| 2.73 | 32.65 | 40.00 | 394.28 | 106.95 | 0.01 |
| 3.71 | 20.82 | 64.49 | 281.32 | 181.78 | 0.24 |
| 5.00 | 33.06 | 55.31 | 393.91 | 131.26 | 0.09 |
| 2.18 | 28.98 | 62.65 | 369.52 | 131.75 | 0.04 |
| 2.61 | 39.59 | 49.80 | 391.52 | 103.41 | 0.01 |
| 3.96 | 22.86 | 60.20 | 288.40 | 164.81 | 0.17 |
| 4.88 | 24.90 | 66.94 | 311.94 | 180.50 | 0.36 |
| 2.55 | 23.27 | 52.86 | 315.26 | 137.11 | 0.04 |
| 2.49 | 35.10 | 60.82 | 391.36 | 119.26 | 0.03 |
| 2.12 | 24.08 | 54.69 | 313.31 | 133.33 | 0.03 |
| 2.37 | 21.22 | 58.98 | 290.08 | 149.31 | 0.06 |
| 3.29 | 20.41 | 51.63 | 277.10 | 148.83 | 0.08 |
References
- Gebisa, A.W.; Lemu, H.G. Additive manufacturing for the manufacture of gas turbine engine components: Literature review and future perspectives. In Proceedings of the ASME Turbo Expo 2018, Turbomachinery Technical Conference and Exposition, Oslo, Norway, 11–15 June 2018; Volume 6. [Google Scholar]
- Wang, W.; Gao, J.; Xu, L.; Shi, X. Flow and Heat Transfer Characteristics in Rotating Two-pass Channels Cooled by Superheated Steam. Chin. J. Aeronaut. 2012, 25, 524–532. [Google Scholar] [CrossRef] [Green Version]
- Xu, L.; Xi, L.; Zhao, Z.; Gao, J.; Li, Y. Numerical prediction of heat loss from a test ribbed rectangular channel using the conjugate calculations. Int. Commun. Heat Mass Transf. 2018, 96, 98–108. [Google Scholar]
- Evans, A.G.; Hutchinson, J.W.; Ashby, M.F. Multi-functionality of Cellular Metal Systems. Prog. Mater. Sci. 1999, 43, 171–221. [Google Scholar] [CrossRef]
- Tian, J.; Kim, T.; Lu, T.J.; Hodson, H.P.; Queheillalt, D.T.; Sypeck, D.J.; Wadley, H.N.G. The effects of topology upon fluid-flow and heat-transfer within cellular copper structures. Int. J. Heat Mass Transf. 2004, 47, 3171–3186. [Google Scholar] [CrossRef]
- Joo, J.H.; Kang, B.S.; Kang, K.J. Experimental Studies on Friction Factor and Heat Transfer Characteristics Through Wire-Woven Bulk Kagome Structure. Exp. Heat Transf. 2009, 22, 99–116. [Google Scholar] [CrossRef]
- Joo, J.H.; Kang, K.J.; Kim, T.; Lu, T.J. Forced convective heat transfer in all metallic wire-woven bulk Kagome sandwich panels. Int. J. Heat Mass Transf. 2011, 54, 5658–5662. [Google Scholar] [CrossRef]
- Yan, H.B.; Zhang, Q.C.; Lu, T.J.; Kim, T. A lightweight X-type metallic lattice in single-phase forced convection. Int. J. Heat Mass Transf. 2015, 83, 273–283. [Google Scholar] [CrossRef]
- Yan, H.; Yang, X.; Lu, T.; Xie, G. Convective heat transfer in a lightweight multifunctional sandwich panel with X-type metallic lattice core. Appl. Therm. Eng. 2017, 127, 1293–1304. [Google Scholar] [CrossRef]
- Lu, T.J.; Valdevit, L.; Evans, A.G. Active cooling by metallic sandwich structures with periodic cores. Prog. Mater. Sci. 2005, 50, 789–815. [Google Scholar] [CrossRef]
- Wadley, H.N.G.; Queheillalt, D.T. Thermal applications of cellular lattice structures. Mater. Sci. Forum 2007, 539–543, 242–247. [Google Scholar] [CrossRef]
- Kim, T.; Zhao, C.Y.; Lu, T.J.; Hodson, H.P. Convective heat dissipation with lattice-frame materials. Mech. Mater. 2004, 36, 767–780. [Google Scholar] [CrossRef]
- Kim, T.; Hodson, H.P.; Lu, T.J. Fluid-flow and endwall heat-transfer characteristics of an ultralight lattice-frame material. Int. J. Heat Mass Transf. 2004, 47, 1129–1140. [Google Scholar] [CrossRef]
- Kim, T.; Hodson, H.P.; Lu, T.J. Contribution of vortex structures and flow separation to local and overall pressure and heat transfer characteristics in an ultralightweight lattice material. Int. J. Heat Mass Transf. 2005, 48, 4243–4264. [Google Scholar] [CrossRef]
- Gao, L.; Sun, Y.G. Fluid flow and heat transfer characteristics of composite lattice core sandwich structures. J. Thermophys. Heat Transf. 2014, 28, 258–269. [Google Scholar] [CrossRef]
- Gao, L.; Sun, Y.G. Thermal control of composite sandwich structure with lattice truss cores. J. Thermophys. Heat Transf. 2015, 29, 47–54. [Google Scholar] [CrossRef]
- Gao, L.; Sun, Y. Active Cooling Performance of All-composite Lattice Truss Core Sandwich Structure. Heat Transfer Res. 2016, 47, 1093–1108. [Google Scholar] [CrossRef]
- Maloney, K.J.; Fink, K.D.; Schaedler, T.A.; Kołodziejska, J.A.; Jacobsen, A.J.; Roper, C.S. Multifunctional heat exchangers derived from three-dimensional micro-lattice structures. Int. J. Heat Mass Transf. 2012, 55, 2486–2493. [Google Scholar] [CrossRef]
- Moon, C.; Kim, D.; Abadi, G.B.; Yoon, S.Y.; Kim, K.C. Effect of ligament hollowness on heat transfer characteristics of open-cell metal foam. Int. J. Heat Mass Transf. 2016, 102, 911–918. [Google Scholar] [CrossRef]
- Zhang, X.; Jin, X.; Xie, G.; Yan, H. Thermo-Fluidic Comparison between Sandwich Panels with Tetrahedral Lattice Cores Fabricated by Casting and Metal Sheet Folding. Energies 2017, 10, 906. [Google Scholar] [CrossRef] [Green Version]
- Shen, B.; Yan, H.; Xue, H.; Xie, G. The Effects of Geometrical Topology on Fluid Flow and Thermal Performance in Kagome Cored Sandwich Panels. Appl. Therm. Eng. 2018, 142, 79–88. [Google Scholar] [CrossRef]
- Shen, B.; Li, Y.; Yan, H.; Boetcher, S.K.S.; Xie, G. Heat transfer enhancement of wedge-shaped channels by replacing pin fins with Kagome lattice structures. Int. J. Heat Mass Transf. 2019, 141, 88–101. [Google Scholar] [CrossRef]
- Li, Y.; Shen, B.; Yan, H.; Boetcher, S.K.S.; Xie, G. Heat transfer enhancement of rotating wedge-shaped channels with pin fins and Kagome lattices. Numer. Heat Transf. Part A Appl. 2020, 77, 1014–1033. [Google Scholar] [CrossRef]
- Ekade, P.; Krishnan, S. Fluid flow and heat transfer characteristics of octet truss lattice geometry. Int. J. Therm. Sci. 2019, 137, 253–261. [Google Scholar] [CrossRef]
- Kemerli, U.; Kahveci, K. Conjugate forced convective heat transfer in a sandwich panel with a Kagome truss core: The effects of strut length and diameter. Appl. Therm. Eng. 2020, 167, 114794. [Google Scholar] [CrossRef]
- Luo, X.; Yang, Z.; Chen, W.; Chyu, M.K. Effect of lattice structures on heat transfer deterioration of supercritical CO2 in rectangle channels. Numer. Heat Transf. Part A Appl. 2020, 77, 931–950. [Google Scholar] [CrossRef]
- Liang, D.; Bai, W.; Chen, W.; Chyu, M.K. Investigating the effect of element shape of the face-centered cubic lattice structure on the flow and endwall heat transfer characteristics in a rectangular channel. Int. J. Heat Mass Transf. 2020, 153, 119579. [Google Scholar] [CrossRef]
- Yun, S.; Kwon, J.; Lee, D.; Shin, H.H.; Kim, Y. Heat transfer and stress characteristics of additive manufactured FCCZ lattice channel using thermal fluid-structure interaction model. Int. J. Heat Mass Transf. 2020, 149, 119187. [Google Scholar] [CrossRef]
- Li, Y.; Xie, G.; Boetcher, S.K.; Yan, H. Heat transfer enhancement of X-lattice-cored sandwich panels by introducing pin fins, dimples or protrusions. Int. J. Heat Mass Transf. 2019, 141, 627–642. [Google Scholar] [CrossRef]
- Ma, Y.; Yan, H.; Hooman, K.; Xie, G. Enhanced heat transfer in a pyramidal lattice sandwich panel by introducing pin-fins/protrusions/dimples. Int. J. Therm. Sci. 2020, 156, 106468. [Google Scholar] [CrossRef]
- Bai, X.; Zheng, Z.; Nakayama, A. Heat transfer performance analysis on lattice core sandwich panel structures. Int. J. Heat Mass Transf. 2019, 143, 118525. [Google Scholar] [CrossRef]
- Jin, X.; Shen, B.; Yan, H.; Sunden, B.; Xie, G. Comparative evaluations of thermofluidic characteristics of sandwich panels with X-lattice and Pyramidal-lattice cores. Int. J. Heat Mass Transf. Part B 2018, 127, 268–282. [Google Scholar] [CrossRef]
- Ernot, J.; Verdin, P.G.; Hayder, A.; Indge, P. Analytical and numerical predictions of the thermal performance of multi-layered lattice structures. Int. J. Heat Mass Transf. 2019, 145, 118752. [Google Scholar] [CrossRef]
- Fu, J.-Y.; Wu, B.-G.; Wu, J.-R.; Deng, T.; Pi, Y.-L.; Xie, Z.-N. Wind resistant size optimization of geometrically nonlinear lattice structures using a modified optimality criterion method. Eng. Struct. 2018, 173, 573–588. [Google Scholar] [CrossRef]
- Fu, J.-Y.; Wu, B.-G.; Wu, J.-R.; Deng, T.; Pi, Y.-L.; Xie, Z.-N. Design sensitivity analysis for optimal design of geometrically nonlinear lattice structures. Eng. Struct. 2018, 168, 915–928. [Google Scholar] [CrossRef]
- Gao, L.; Sun, S.; Zhao, Y.; Sun, Y. Thermostructural multiobjective optimization of a composite sandwich panel with lattice truss cores. Numer. Heat Transf. Part B Fundam. 2016, 70, 233–250. [Google Scholar]
- Jiang, P.-X.; Li, M.; Lu, T.-J.; Yu, L.; Ren, Z.-P. Experimental research on convection heat transfer in sintered porous plate channels. Int. J. Heat Mass Transf. 2004, 47, 2085–2096. [Google Scholar] [CrossRef]
- Moon, S.K.; Tan, Y.E.; Yoon, Y.-J.; Hwang, J. Application of 3D printing technology for designing light-weight unmanned aerial vehicle wing structures. Int. J. Precis. Eng. Manuf. Green Technol. 2014, 1, 223–228. [Google Scholar] [CrossRef]
- Li, B.; Zhang, Q.; Lu, T. Dynamic performance of truss core sandwich structures based on modal analysis experiments. Chin. J. Solid Mech. 2008, 29, 373–378. (In Chinese) [Google Scholar]
- Li, S.; Yang, J.; Wu, L.; Yu, G.; Yang, L.; Qu, J. Influence of boundary conditions and truss inclination angles on vibration characteristics of the hourglass lattice structure. J. Harbin Eng. Univ. 2019, 40, 878–885. (In Chinese) [Google Scholar]
Publisher’s Note: MDPI stays neutral with regard to jurisdictional claims in published maps and institutional affiliations. |
© 2021 by the authors. Licensee MDPI, Basel, Switzerland. This article is an open access article distributed under the terms and conditions of the Creative Commons Attribution (CC BY) license (https://creativecommons.org/licenses/by/4.0/).