
Dynamic Analysis of the Similarity of Objects in Research on the Use of Renewable Energy Resources in European Union Countries


Abstract
:
1. Introduction
2. Literature Review
3. Data and Methodology
- Building a database on the use of renewable energy. The article uses the following indicators provided by Eurostat.X1—Overall share of energy from renewable sourcesX2—Share of energy from renewable sources in gross electricity consumptionX3—Share of energy from renewable sources in transportX4—Share of energy from renewable sources for heating and coolingX5—Electricity generation per capita (kWh)—HydroX6—Electricity generation per capita (kWh)—WindX7—Electricity generation per capita (kWh)—SolarX8—Electricity generation per capita (kWh)—Solid biofuelsX9—Electricity generation per capita (kWh)—All other renewablesX10—Electricity generation per capita (kWh)—Total (RES-E numerator)X11—Transport per capita (kWh)—Ren. electricity in road transportX12—Transport per capita (kWh)—Ren. electricity in rail transportX13—Transport per capita (kWh)—Ren. electricity in all other transport modesX14—Transport per capita (kWh)—Compliant biofuelsX15—Transport per capita (kWh)—Total (RES-T numerator with multiplicators)X16—Heating and cooling per capita (kWh)—Final energy consumptionX17—Heating and cooling per capita (kWh)—Derived heatX18—Heating and cooling per capita (kWh)—Heat pumpsX19—Heating and cooling per capita (kWh)—Total (RES-H&C numerator)
- Determining the distribution of diagnostic features
- 3.
- Construction of taxonomic measures of development using the zero unitarization method [72].
- for stimulant:
- for destimulant:
- 4.
- group 1: ,
- group 2: ,
- group 3: ,
- group 4: .
- 5.
- Dynamic classification based on random fluctuations of taxonomic measures of development
4. Results
5. Discussion
- legal factors, it is necessary to create a stable legal framework for changing Co2 emissions and directing energy production to RES. In the case of EU countries, the legal framework for the operation of the RES sector has long been specified and integrated into the implementation of the SDG’s goals [27,83,84,85];
- political factors—allows you to check whether there have been changes in the policies that support the development of RES use, including assessing their effectiveness;
- legal factors—allows you to introduce changes aimed at increasing the effectiveness of activities, including policies;
- geographic (natural) environment—allows you to monitor efficiency in the indicated groups, assess the jump of changes and the direction of change of groups in which we classified the countries;
- financial factor—allows to assess whether the level of financing policies was adequate;
- information and education factor—reflects the need to finance the information policy, promotion activities, and sharing good practices, including the effectiveness of reporting on ESG factors related to RES.
6. Conclusions
Author Contributions
Funding
Institutional Review Board Statement
Informed Consent Statement
Data Availability Statement
Conflicts of Interest
Abbreviations
| ESG | Environmental Social and Governance |
| EU | European Union |
| GW | GigaWatt |
| IRENA | International Renewable Energy Agency |
| RES | renewable energy sources |
| SDG | Sustainable Development Goals |
| TMD | taxonomic measure of development |
Appendix A

| Country | 2004 | 2005 | 2006 | 2007 | 2008 | 2009 | 2010 | 2011 | ||||||||
|---|---|---|---|---|---|---|---|---|---|---|---|---|---|---|---|---|
| zi | Rank | zi | Rank | zi | Rank | zi | Rank | zi | Rank | zi | Rank | zi | Rank | zi | Rank | |
| Austria | 0.451 | 2 | 0.483 | 2 | 0.524 | 2 | 0.542 | 2 | 0.527 | 2 | 0.550 | 2 | 0.550 | 2 | 0.524 | 2 |
| Belgium | 0.045 | 23 | 0.054 | 24 | 0.057 | 24 | 0.068 | 22 | 0.069 | 26 | 0.108 | 20 | 0.161 | 14 | 0.157 | 13 |
| Bulgaria | 0.071 | 19 | 0.068 | 20 | 0.068 | 21 | 0.065 | 23 | 0.069 | 25 | 0.080 | 26 | 0.093 | 25 | 0.092 | 24 |
| Croatia | 0.172 | 7 | 0.165 | 8 | 0.151 | 9 | 0.153 | 10 | 0.145 | 14 | 0.152 | 14 | 0.156 | 16 | 0.153 | 14 |
| Cyprus | 0.023 | 27 | 0.023 | 27 | 0.023 | 27 | 0.029 | 27 | 0.065 | 27 | 0.073 | 27 | 0.075 | 27 | 0.052 | 27 |
| Czechia | 0.080 | 17 | 0.080 | 18 | 0.076 | 19 | 0.088 | 19 | 0.105 | 18 | 0.132 | 17 | 0.160 | 15 | 0.150 | 15 |
| Denmark | 0.258 | 5 | 0.273 | 5 | 0.267 | 5 | 0.279 | 4 | 0.277 | 4 | 0.284 | 4 | 0.296 | 4 | 0.328 | 4 |
| Estonia | 0.126 | 13 | 0.126 | 13 | 0.111 | 15 | 0.117 | 15 | 0.126 | 15 | 0.172 | 13 | 0.186 | 12 | 0.204 | 8 |
| Finland | 0.375 | 3 | 0.396 | 3 | 0.399 | 3 | 0.404 | 3 | 0.429 | 3 | 0.439 | 3 | 0.453 | 3 | 0.411 | 3 |
| France | 0.138 | 11 | 0.143 | 10 | 0.128 | 11 | 0.139 | 12 | 0.174 | 11 | 0.180 | 12 | 0.185 | 13 | 0.116 | 21 |
| Germany | 0.165 | 8 | 0.221 | 6 | 0.264 | 6 | 0.250 | 6 | 0.265 | 5 | 0.245 | 6 | 0.273 | 6 | 0.275 | 6 |
| Greece | 0.060 | 21 | 0.057 | 23 | 0.070 | 20 | 0.075 | 21 | 0.075 | 24 | 0.083 | 25 | 0.097 | 24 | 0.091 | 25 |
| Hungary | 0.041 | 25 | 0.062 | 22 | 0.063 | 22 | 0.077 | 20 | 0.104 | 19 | 0.124 | 18 | 0.127 | 18 | 0.125 | 20 |
| Ireland | 0.037 | 26 | 0.044 | 26 | 0.050 | 26 | 0.060 | 24 | 0.079 | 22 | 0.097 | 22 | 0.105 | 23 | 0.115 | 23 |
| Italy | 0.146 | 10 | 0.137 | 11 | 0.133 | 10 | 0.141 | 11 | 0.169 | 12 | 0.192 | 10 | 0.217 | 9 | 0.237 | 7 |
| Latvia | 0.307 | 4 | 0.299 | 4 | 0.278 | 4 | 0.262 | 5 | 0.256 | 6 | 0.275 | 5 | 0.277 | 5 | 0.289 | 5 |
| Lithuania | 0.108 | 16 | 0.109 | 16 | 0.122 | 13 | 0.128 | 14 | 0.149 | 13 | 0.151 | 15 | 0.144 | 17 | 0.147 | 16 |
| Luxembourg | 0.117 | 15 | 0.125 | 14 | 0.126 | 12 | 0.204 | 7 | 0.229 | 7 | 0.203 | 9 | 0.195 | 11 | 0.196 | 11 |
| Malta | 0.000 | 28 | 0.000 | 28 | 0.001 | 28 | 0.000 | 28 | 0.000 | 28 | 0.000 | 28 | 0.005 | 28 | 0.028 | 28 |
| Netherlands | 0.070 | 20 | 0.087 | 17 | 0.097 | 17 | 0.105 | 17 | 0.116 | 16 | 0.134 | 16 | 0.116 | 20 | 0.128 | 18 |
| Poland | 0.060 | 22 | 0.064 | 21 | 0.060 | 23 | 0.060 | 25 | 0.082 | 21 | 0.097 | 23 | 0.112 | 21 | 0.115 | 22 |
| Portugal | 0.159 | 9 | 0.157 | 9 | 0.182 | 7 | 0.195 | 8 | 0.207 | 8 | 0.232 | 7 | 0.249 | 7 | 0.196 | 10 |
| Romania | 0.124 | 14 | 0.120 | 15 | 0.107 | 16 | 0.113 | 16 | 0.115 | 17 | 0.118 | 19 | 0.120 | 19 | 0.126 | 19 |
| Slovakia | 0.076 | 18 | 0.076 | 19 | 0.093 | 18 | 0.095 | 18 | 0.097 | 20 | 0.108 | 21 | 0.111 | 22 | 0.132 | 17 |
| Slovenia | 0.175 | 6 | 0.173 | 7 | 0.161 | 8 | 0.176 | 9 | 0.179 | 10 | 0.186 | 11 | 0.202 | 10 | 0.197 | 9 |
| Spain | 0.129 | 12 | 0.132 | 12 | 0.118 | 14 | 0.133 | 13 | 0.188 | 9 | 0.213 | 8 | 0.232 | 8 | 0.167 | 12 |
| Sweden | 0.711 | 1 | 0.676 | 1 | 0.657 | 1 | 0.691 | 1 | 0.648 | 1 | 0.670 | 1 | 0.673 | 1 | 0.691 | 1 |
| United Kingdom | 0.043 | 24 | 0.047 | 25 | 0.051 | 25 | 0.056 | 26 | 0.077 | 23 | 0.086 | 24 | 0.091 | 26 | 0.086 | 26 |
| Country | 2012 | 2013 | 2014 | 2015 | 2016 | 2017 | 2018 | 2019 | ||||||||
|---|---|---|---|---|---|---|---|---|---|---|---|---|---|---|---|---|
| zi | Rank | zi | Rank | zi | Rank | zi | Rank | zi | Rank | zi | Rank | zi | Rank | zi | Rank | |
| Austria | 0.513 | 2 | 0.494 | 3 | 0.481 | 3 | 0.489 | 3 | 0.479 | 3 | 0.470 | 3 | 0.460 | 3 | 0.417 | 3 |
| Belgium | 0.162 | 15 | 0.158 | 17 | 0.146 | 17 | 0.139 | 19 | 0.156 | 17 | 0.161 | 17 | 0.155 | 18 | 0.147 | 21 |
| Bulgaria | 0.105 | 25 | 0.150 | 18 | 0.136 | 19 | 0.147 | 18 | 0.151 | 18 | 0.147 | 20 | 0.144 | 19 | 0.183 | 11 |
| Croatia | 0.154 | 17 | 0.167 | 14 | 0.160 | 14 | 0.168 | 15 | 0.162 | 16 | 0.162 | 16 | 0.164 | 16 | 0.166 | 14 |
| Cyprus | 0.052 | 27 | 0.064 | 27 | 0.071 | 27 | 0.078 | 27 | 0.081 | 26 | 0.083 | 27 | 0.108 | 24 | 0.079 | 27 |
| Czechia | 0.189 | 11 | 0.186 | 11 | 0.180 | 12 | 0.183 | 12 | 0.179 | 12 | 0.177 | 13 | 0.163 | 17 | 0.146 | 22 |
| Denmark | 0.347 | 4 | 0.349 | 4 | 0.344 | 4 | 0.353 | 4 | 0.383 | 4 | 0.407 | 4 | 0.403 | 4 | 0.383 | 4 |
| Estonia | 0.207 | 8 | 0.193 | 10 | 0.194 | 10 | 0.226 | 9 | 0.231 | 9 | 0.235 | 9 | 0.256 | 7 | 0.208 | 8 |
| Finland | 0.413 | 3 | 0.501 | 2 | 0.561 | 2 | 0.557 | 2 | 0.482 | 2 | 0.547 | 2 | 0.548 | 2 | 0.487 | 2 |
| France | 0.189 | 12 | 0.180 | 13 | 0.166 | 13 | 0.169 | 14 | 0.175 | 14 | 0.177 | 14 | 0.169 | 14 | 0.147 | 20 |
| Germany | 0.280 | 6 | 0.267 | 6 | 0.250 | 6 | 0.251 | 7 | 0.254 | 6 | 0.258 | 6 | 0.259 | 6 | 0.246 | 6 |
| Greece | 0.113 | 22 | 0.139 | 20 | 0.136 | 20 | 0.137 | 20 | 0.135 | 21 | 0.151 | 19 | 0.138 | 20 | 0.158 | 17 |
| Hungary | 0.119 | 20 | 0.117 | 22 | 0.101 | 23 | 0.105 | 25 | 0.106 | 25 | 0.100 | 25 | 0.088 | 26 | 0.085 | 25 |
| Ireland | 0.111 | 23 | 0.110 | 23 | 0.103 | 22 | 0.109 | 24 | 0.108 | 24 | 0.126 | 23 | 0.124 | 23 | 0.128 | 23 |
| Italy | 0.257 | 7 | 0.252 | 7 | 0.234 | 7 | 0.240 | 8 | 0.238 | 8 | 0.238 | 8 | 0.219 | 10 | 0.201 | 10 |
| Latvia | 0.299 | 5 | 0.303 | 5 | 0.309 | 5 | 0.305 | 5 | 0.296 | 5 | 0.312 | 5 | 0.310 | 5 | 0.276 | 5 |
| Lithuania | 0.160 | 16 | 0.161 | 15 | 0.159 | 15 | 0.190 | 11 | 0.188 | 11 | 0.198 | 11 | 0.187 | 11 | 0.154 | 18 |
| Luxembourg | 0.193 | 10 | 0.201 | 9 | 0.204 | 9 | 0.209 | 10 | 0.208 | 10 | 0.218 | 10 | 0.222 | 9 | 0.225 | 7 |
| Malta | 0.042 | 28 | 0.045 | 28 | 0.053 | 28 | 0.057 | 28 | 0.071 | 28 | 0.087 | 26 | 0.088 | 27 | 0.081 | 26 |
| Netherlands | 0.118 | 21 | 0.105 | 24 | 0.099 | 24 | 0.116 | 22 | 0.137 | 20 | 0.155 | 18 | 0.170 | 13 | 0.176 | 12 |
| Poland | 0.109 | 24 | 0.100 | 25 | 0.086 | 25 | 0.085 | 26 | 0.077 | 27 | 0.076 | 28 | 0.072 | 28 | 0.067 | 28 |
| Portugal | 0.186 | 13 | 0.185 | 12 | 0.233 | 8 | 0.252 | 6 | 0.252 | 7 | 0.253 | 7 | 0.240 | 8 | 0.207 | 9 |
| Romania | 0.141 | 18 | 0.142 | 19 | 0.142 | 18 | 0.148 | 17 | 0.148 | 19 | 0.146 | 21 | 0.128 | 22 | 0.173 | 13 |
| Slovakia | 0.123 | 19 | 0.121 | 21 | 0.125 | 21 | 0.134 | 21 | 0.127 | 22 | 0.119 | 24 | 0.106 | 25 | 0.116 | 24 |
| Slovenia | 0.207 | 9 | 0.208 | 8 | 0.183 | 11 | 0.180 | 13 | 0.171 | 15 | 0.177 | 15 | 0.174 | 12 | 0.163 | 15 |
| Spain | 0.165 | 14 | 0.160 | 16 | 0.157 | 16 | 0.156 | 16 | 0.178 | 13 | 0.180 | 12 | 0.164 | 15 | 0.159 | 16 |
| Sweden | 0.693 | 1 | 0.679 | 1 | 0.658 | 1 | 0.678 | 1 | 0.700 | 1 | 0.698 | 1 | 0.691 | 1 | 0.653 | 1 |
| United Kingdom | 0.070 | 26 | 0.074 | 26 | 0.081 | 26 | 0.110 | 23 | 0.123 | 23 | 0.129 | 22 | 0.133 | 21 | 0.154 | 19 |
| Year | 2004 | 2005 | 2006 | 2007 | 2008 | 2009 | 2010 | 2011 | 2012 | 2013 | 2014 | 2015 | 2016 | 2017 | 2018 | 2019 |
|---|---|---|---|---|---|---|---|---|---|---|---|---|---|---|---|---|
| 2004 | 1.000 | 0.990 | 0.979 | 0.952 | 0.916 | 0.910 | 0.896 | 0.883 | 0.893 | 0.918 | 0.920 | 0.916 | 0.894 | 0.876 | 0.865 | 0.833 |
| 2005 | 0.990 | 1.000 | 0.987 | 0.968 | 0.948 | 0.940 | 0.914 | 0.891 | 0.898 | 0.909 | 0.911 | 0.905 | 0.891 | 0.877 | 0.876 | 0.835 |
| 2006 | 0.979 | 0.987 | 1.000 | 0.985 | 0.955 | 0.942 | 0.909 | 0.889 | 0.897 | 0.915 | 0.923 | 0.926 | 0.908 | 0.899 | 0.897 | 0.851 |
| 2007 | 0.952 | 0.968 | 0.985 | 1.000 | 0.972 | 0.966 | 0.932 | 0.912 | 0.920 | 0.924 | 0.933 | 0.924 | 0.914 | 0.909 | 0.904 | 0.857 |
| 2008 | 0.916 | 0.948 | 0.955 | 0.972 | 1.000 | 0.980 | 0.932 | 0.884 | 0.897 | 0.881 | 0.893 | 0.892 | 0.891 | 0.891 | 0.885 | 0.814 |
| 2009 | 0.910 | 0.940 | 0.942 | 0.966 | 0.980 | 1.000 | 0.977 | 0.935 | 0.937 | 0.906 | 0.920 | 0.909 | 0.921 | 0.924 | 0.909 | 0.817 |
| 2010 | 0.896 | 0.914 | 0.909 | 0.932 | 0.932 | 0.977 | 1.000 | 0.958 | 0.961 | 0.930 | 0.940 | 0.913 | 0.926 | 0.922 | 0.888 | 0.787 |
| 2011 | 0.883 | 0.891 | 0.889 | 0.912 | 0.884 | 0.935 | 0.958 | 1.000 | 0.958 | 0.930 | 0.933 | 0.912 | 0.919 | 0.909 | 0.891 | 0.818 |
| 2012 | 0.893 | 0.898 | 0.897 | 0.920 | 0.897 | 0.937 | 0.961 | 0.958 | 1.000 | 0.973 | 0.967 | 0.939 | 0.940 | 0.930 | 0.900 | 0.793 |
| 2013 | 0.918 | 0.909 | 0.915 | 0.924 | 0.881 | 0.906 | 0.930 | 0.930 | 0.973 | 1.000 | 0.992 | 0.968 | 0.959 | 0.943 | 0.914 | 0.839 |
| 2014 | 0.920 | 0.911 | 0.923 | 0.933 | 0.893 | 0.920 | 0.940 | 0.933 | 0.967 | 0.992 | 1.000 | 0.984 | 0.975 | 0.959 | 0.925 | 0.856 |
| 2015 | 0.916 | 0.905 | 0.926 | 0.924 | 0.892 | 0.909 | 0.913 | 0.912 | 0.939 | 0.968 | 0.984 | 1.000 | 0.991 | 0.977 | 0.949 | 0.883 |
| 2016 | 0.894 | 0.891 | 0.908 | 0.914 | 0.891 | 0.921 | 0.926 | 0.919 | 0.940 | 0.959 | 0.975 | 0.991 | 1.000 | 0.992 | 0.964 | 0.884 |
| 2017 | 0.876 | 0.877 | 0.899 | 0.909 | 0.891 | 0.924 | 0.922 | 0.909 | 0.930 | 0.943 | 0.959 | 0.977 | 0.992 | 1.000 | 0.976 | 0.887 |
| 2018 | 0.865 | 0.876 | 0.897 | 0.904 | 0.885 | 0.909 | 0.888 | 0.891 | 0.900 | 0.914 | 0.925 | 0.949 | 0.964 | 0.976 | 1.000 | 0.915 |
| 2019 | 0.833 | 0.835 | 0.851 | 0.857 | 0.814 | 0.817 | 0.787 | 0.818 | 0.793 | 0.839 | 0.856 | 0.883 | 0.884 | 0.887 | 0.915 | 1.000 |


References
- Sikora, A. European Green Deal—Legal and financial challenges of the climate change. In ERA Forum; Springer: Berlin/Heidelberg, Germany, 2021; Volume 21, pp. 681–697. [Google Scholar] [CrossRef]
- Ziolo, M.; Jednak, S.; Savić, G.; Kragulj, D. Link between Energy Efficiency and Sustainable Economic and Financial Development in OECD Countries. Energies 2020, 13, 5898. [Google Scholar] [CrossRef]
- Lucchi, E.; Polo Lopez, C.S.; Franco, G. A conceptual framework on the integration of solar energy systems in heritage sites and buildings. In IOP Conference Series: Materials Science and Engineering, Proceedings of the International Conference Florence Heri-Tech: The Future of Heritage Science and Technologies, Online, 14–16 October 2020; IOP Publishing: Bristol, UK, 2020; Volume 949. [Google Scholar]
- Sánchez-Pantoja, N.; Vidal, R.; Pastor, M. EU-Funded Projects with Actual Implementation of Renewable Energies in Cities. Analysis of Their Concern for Aesthetic Impact. Energies 2021, 14, 1627. [Google Scholar] [CrossRef]
- Temiz, D.; Gokmen, A. The importance of renewable energy sources in turkey. Int. J. Econ. Fin. Stud. 2010, 2, 22–30. [Google Scholar]
- Panwar, N.; Kaushik, S.; Kothari, S. Role of renewable energy sources in environmental protection: A review. Renew. Sustain. Energy Rev. 2011, 15, 1513–1524. [Google Scholar] [CrossRef]
- Abolhosseini, S.; Heshmati, A.; Altmann, J. A Review of Renewable Energy Supply and Energy Efficiency Technologies. IZA Discuss. Pap. 2014, No. 8145. Available online: http://ftp.iza.org/dp8145.pdf (accessed on 30 June 2021).
- Samarina, V.; Skufina, T.; Samarin, A.; Ushakov, D. Alternative Energy Sources: Opportunities, Experience and Prospects of the Russian Regions in the Context of Global Trends. Inter. J. Ener. Econ. Policy 2018, 8, 140–147. [Google Scholar]
- Razmjoo, A.A.; Davarpanah, A.; Zargarian, A. The Role of Renewable Energy to Achieve Energy Sustainability in Iran. An Economic and Technical Analysis of the Hybrid Power System. Technol. Econ. Smart Grids Sustain. Energy 2019, 4, 7. [Google Scholar] [CrossRef] [Green Version]
- UNCTAD. The Role of Science, Technology and Innovation in Promoting Renewable Energy by 2030; United Nations: Geneva, Switzerland, 2019. [Google Scholar]
- Marks-Bielska, R.; Bielski, S.; Pik, K.; Kurowska, K. The Importance of Renewable Energy Sources in Poland’s Energy Mix. Energies 2020, 13, 4624. [Google Scholar] [CrossRef]
- Owusu, P.A.; Asumadu-Sarkodie, S. A review of renewable energy sources, sustainability issues and climate change mitigation. Cogent Eng. 2016, 3, 1167990. [Google Scholar] [CrossRef]
- Abbasi, T.; Premalatha, M.; Abbasi, S. The return to renewables: Will it help in global warming control? Renew. Sustain. Energy Rev. 2011, 15, 891–894. [Google Scholar] [CrossRef]
- Lu, Y.; Nakicenovic, N.; Visbeck, M.; Stevance, A.-S. Policy: Five priorities for the UN Sustainable Development Goals. Nat. Cell Biol. 2015, 520, 432–433. [Google Scholar] [CrossRef] [Green Version]
- Koroneos, C.; Spachos, T.; Moussiopoulos, N. Exergy analysis of renewable energy sources. Renew. Energy 2003, 28, 295–310. [Google Scholar] [CrossRef]
- Hansen, C.; Skinner, R. Nuclear Power and Renewables: Strange Bedfellows? Oxford Energy Comment, 2005. Oxford Institute for Energy Studies. Available online: https://www.oxfordenergy.org/wpcms/wp-content/uploads/2011/01/July2005-NuclearPowerandRenewables-ChristopherHansenandRobertSkinner.pdf (accessed on 5 May 2021).
- Gielen, D.; Boshell, F.; Saygin, D.; Bazilian, M.D.; Wagner, N.; Gorini, R. The role of renewable energy in the global energy transformation. Energy Strategy Rev. 2019, 24, 38–50. [Google Scholar] [CrossRef]
- Noorollahi, Y.; Pourarshad, M.; Veisi, A. The synergy of Renewable Energies for Sustainable Energy Systems Development in Oil-Rich Nations; Case of Iran. Renew. Energy 2021, 173, 561–568. [Google Scholar] [CrossRef]
- Elum, Z.; Momodu, A.S. Climate change mitigation and renewable energy for sustainable development in Nigeria: A discourse approach. Renew. Sustain. Energy Rev. 2017, 76, 72–80. [Google Scholar] [CrossRef]
- Ziolo, M.; Kluza, K.; Spoz, A. Impact of Sustainable Financial and Economic Development on Greenhouse Gas Emission in the Developed and Converging Economies. Energies 2019, 12, 4514. [Google Scholar] [CrossRef] [Green Version]
- Kulovesi, K.; Oberthür, S. Assessing the EU’s 2030 Climate and Energy Policy Framework: Incremental change toward radical transformation? Rev. Eur. Comp. Int. Environ. Law 2020, 29, 151–166. [Google Scholar] [CrossRef]
- Wang, Q.; Zhan, L. Assessing the sustainability of renewable energy by combining 3E model and RAGA-PP techniques: An empirical analysis of selected 18 European countries. Sci. Total Environ. 2019. [Google Scholar] [CrossRef]
- Jenniches, S. Assessing the regional economic impacts of renewable energy sources—A literature review. Renew. Sustain. Energy Rev. 2018, 93, 35–51. [Google Scholar] [CrossRef]
- Li, T.; Li, A.; Guo, X. The sustainable development-oriented development and utilization of renewable energy industry—A comprehensive analysis of MCDM methods. Energy 2020, 212, 118694. [Google Scholar] [CrossRef]
- Statistics Poland. 2019. Available online: https://bdl.stat.gov.pl/BDL/metadane/cechy/1674?back=True# (accessed on 7 May 2021).
- Solangi, Y.A.; Longsheng, C.; Shah, S.A.A. Assessing and overcoming the renewable energy barriers for sustainable development in Pakistan: An integrated AHP and fuzzy TOPSIS approach. Renew. Energy 2021, 173, 209–222. [Google Scholar] [CrossRef]
- Ogunlana, A.O.; Goryunova, N.N. Tax Incentives for Renewable Energy: The European Experience. Eur. Proc. Soc. Behav. Sci. 2017, 19, 507–513. [Google Scholar] [CrossRef]
- Lezama, J.M.L.; Villada, F.; Galeano, N.M. Effects of Incentives for Renewable Energy in Colombia. Ing. Univ. 2017, 21, 257–272. [Google Scholar] [CrossRef] [Green Version]
- Simsek, H.A.; Simsek, N. Recent incentives for renewable energy in Turkey. Energy Policy 2013, 63, 521–530. [Google Scholar] [CrossRef]
- U.S. Energy Information Administration. Renewable Energy; EIA: Washington, DC, USA, 2018. Available online: https://www.eia.gov/energyexplained/renewable-sources/ (accessed on 6 May 2021).
- Pan, X.; Wang, Y. Evaluation of renewable energy sources in China using an interval type-2 fuzzy large-scale group risk evaluation method. Appl. Soft Comput. 2021, 108, 107458. [Google Scholar] [CrossRef]
- John, A.; Basu, S.; Kumar, A. Design and evaluation of stand-alone solar-hydrogen energy storage system for academic institute: A case study. Mater. Today Proc. 2021. [Google Scholar] [CrossRef]
- Cousse, J. Still in love with solar energy? Installation size, affect, and the social acceptance of renewable energy technologies. Renew. Sust. Energy Rev. 2021, 145, 111107. [Google Scholar] [CrossRef]
- Chiemelu, N.E.; Anejionu, O.C.; Ndukwu, R.I.; Okeke, F.I. Assessing the potentials of largescale generation of solar energy in Eastern Nigeria with geospatial technologies. Sci. Afr. 2021, 12, e00771. [Google Scholar] [CrossRef]
- Yao, Y.; Xu, J.-H.; Sun, D.-Q. Untangling global levelised cost of electricity based on multi-factor learning curve for renewable energy: Wind, solar, geothermal, hydropower and bioenergy. J. Clean. Prod. 2021, 285, 124827. [Google Scholar] [CrossRef]
- Stefano, F.; Valentina, G.; Roberto, B.; Vito, L.; Riccardo, G. Setting up of a cost-effective continuous desalination plant based on coupling solar and geothermal energy. Desalination 2021, 500, 114854. [Google Scholar] [CrossRef]
- Hamzaoğlu, A.; Erduman, A.; Alçı, M. Reduction of distribution system losses using solar energy cooperativity by home user. Ain Shams Eng. J. 2021. [Google Scholar] [CrossRef]
- Anctil, A.; Lee, E.; Lunt, R.R. Net energy and cost benefit of transparent organic solar cells in building-integrated applications. Appl. Energy 2020, 261, 114429. [Google Scholar] [CrossRef]
- Sultan, M.; Wu, J.; Aleem, F.E.; Imran, M. Cost and energy analysis of a grid-tie solar system synchronized with utility and fossil fuel generation with major Issues for the attenuation of solar power in Pakistan. Sol. Energy 2018, 174, 967–975. [Google Scholar] [CrossRef]
- Novacheck, J.; Johnson, J.X. The environmental and cost implications of solar energy preferences in Renewable Portfolio Standards. Energy Policy 2015, 86, 250–261. [Google Scholar] [CrossRef]
- Shahsavari, A.; Akbari, M. Potential of solar energy in developing countries for reducing energy-related emissions. Renew. Sustain. Energy Rev. 2018, 90, 275–291. [Google Scholar] [CrossRef]
- Creutzig, F.; Agoston, P.; Goldschmidt, J.C.; Luderer, G.; Nemet, G.; Pietzcker, R.C. The underestimated potential of solar energy to mitigate climate change. Nat. Energy 2017, 2, 17140. [Google Scholar] [CrossRef]
- Ambec, S.; Crampes, C. Decarbonizing Electricity Generation with Intermittent Sources of Energy. J. Assoc. Environ. Resour. Econ. 2019, 6, 1105–1134. [Google Scholar] [CrossRef] [Green Version]
- Adeyeye, K.; Ijumba, N.; Colton, J. Exploring the environmental and economic impacts of wind energy: A cost-benefit perspective. Int. J. Sustain. Dev. World Ecol. 2020, 27, 718–731. [Google Scholar] [CrossRef]
- Sayed, E.T.; Wilberforce, T.; Elsaid, K.; Rabaia, M.K.H.; Abdelkareem, M.A.; Chae, K.-J.; Olabi, A. A critical review on environmental impacts of renewable energy systems and mitigation strategies: Wind, hydro, biomass and geothermal. Sci. Total Environ. 2021, 766, 144505. [Google Scholar] [CrossRef]
- Wellig, S.D.; Nusslé, S.; Miltner, D.; Kohle, O.; Glaizot, O.; Braunisch, V.; Obrist, M.K.; Arlettaz, R. Mitigating the negative impacts of tall wind turbines on bats: Vertical activity profiles and relationships to wind speed. PLoS ONE 2018, 13, e0192493. [Google Scholar] [CrossRef] [Green Version]
- Diógenes, J.R.F.; Claro, J.; Rodrigues, J.C.; Loureiro, M.V. Barriers to onshore wind energy implementation: A systematic review. Energy Res. Soc. Sci. 2020, 60, 101337. [Google Scholar] [CrossRef]
- Gönül, Ö.; Duman, A.C.; Deveci, K.; Güler, Ö. An assessment of wind energy status, incentive mechanisms and market in Turkey. Eng. Sci. Technol. Int. J. 2021. [Google Scholar] [CrossRef]
- Aldy, J.; Gerarden, T.; Sweeney, R. Investment versus Output Subsidies: Implications of Alternative Incentives for Wind. Energy 2018. [Google Scholar] [CrossRef]
- Black, G.; Holley, D.; Solan, D.; Bergloff, M. Fiscal and economic impacts of state incentives for wind energy development in the Western United States. Renew. Sustain. Energy Rev. 2014, 34, 136–144. [Google Scholar] [CrossRef]
- Javed, M.S.; Ma, T.; Jurasz, J.; Amin, M.Y. Solar and wind power generation systems with pumped hydro storage: Review and future perspectives. Renew. Energy 2020, 148, 176–192. [Google Scholar] [CrossRef]
- Fan, J.; Xie, H.; Chen, J.; Jiang, D.; Li, C.; Tiedeu, W.N.; Ambre, J. Preliminary feasibility analysis of a hybrid pumped-hydro energy storage system using abandoned coal mine goafs. Appl. Energy 2020, 258, 114007. [Google Scholar] [CrossRef]
- Lu, Z.; Gao, Y.; Zhao, W. A TODIM-based approach for environmental impact assessment of pumped hydro energy storage plant. J. Clean. Prod. 2020, 248, 119265. [Google Scholar] [CrossRef]
- Penghao, C.; Pingkuo, L.; Hua, P. Prospects of hydropower industry in the Yangtze River Basin: China’s green energy choice. Renew. Energy 2019, 131, 1168–1185. [Google Scholar] [CrossRef]
- Yang, C.-J.; Jackson, R.B. Opportunities and barriers to pumped-hydro energy storage in the United States. Renew. Sustain. Energy Rev. 2011, 15, 839–844. [Google Scholar] [CrossRef]
- Ciric, R.M. Review of techno-economic and environmental aspects of building small hydro electric plants—A case study in Serbia. Renew. Energy 2019, 140, 715–721. [Google Scholar] [CrossRef]
- Paulillo, A.; Striolo, A.; Lettieri, P. The environmental impacts and the carbon intensity of geothermal energy: A case study on the Hellisheiði plant. Environ. Int. 2019, 133, 105226. [Google Scholar] [CrossRef]
- Bošnjakovid, M.; Stojkov, M.; Jurjevid, M. Environmental impact of geothermal power plants. Teh. Vjesn. 2019, 26, 1515–1522. [Google Scholar]
- Shortall, R.; Davidsdottir, B.; Axelsson, G. Geothermal energy for sustainable development: A review of sustainability impacts and assessment frameworks. Renew. Sustain. Energy Rev. 2020, 44, 391–406. [Google Scholar] [CrossRef]
- Yasukawa, K.; Lee, T.J.; Uchida, T.; Song, Y. Environmental Barriers to Geothermal Development in Eastern and South-Eastern Asia. In Proceedings of the World Geothermal Congress 2020, Online. 21–26 May 2021. [Google Scholar]
- Danish, R.; Ulucak, R. Linking biomass energy and CO2 emissions in China using dynamic Autoregressive-Distributed Lag simulations. J. Clean. Prod. 2020, 250, 119533. [Google Scholar] [CrossRef]
- Güney, T.; Kantar, K. Biomass energy consumption and sustainable development. Int. J. Sustain. Dev. World Ecol. 2020, 27, 762–767. [Google Scholar] [CrossRef]
- Chang, W.-R.; Hwang, J.-J.; Wu, W. Environmental impact and sustainability study on biofuels for transportation applications. Renew. Sust. Energ. Rev. 2017, 67, 277–288. [Google Scholar] [CrossRef]
- Inayat, A.; Nassef, A.M.; Rezk, H.; Sayed, E.T.; Abdelkareem, M.A.; Olabi, A.G. Fuzzy modeling and parameters optimization for the enhancement of biodiesel production from waste frying oil over montmorillonite clay K-30. Sci. Total Environ. 2019, 666, 821–827. [Google Scholar] [CrossRef] [Green Version]
- Mohamed, H.O.; Obaid, M.; Sayed, E.T.; Abdelkareem, M.A.; Park, M.; Liu, Y.; Kim, H.-Y.; Barakat, N.A.M. Graphite Sheets as High-Performance Low-Cost Anodes for Microbial Fuel Cells Using Real Food Wastewater. Chem. Eng. Technol. 2017, 40, 2243–2250. [Google Scholar] [CrossRef]
- Qazi, A.; Hussain, F.; Rahim, N.A.; Hardaker, G.; Alghazzawi, D.; Shaban, K.; Haruna, K. Towards Sustainable Energy: A Systematic Review of Renewable Energy Sources, Technologies, and Public Opinions. IEEE Access 2019, 7, 63837–63851. [Google Scholar] [CrossRef]
- Yang, Y.; Solgaard, H.S.; Haider, W. Wind, hydro or mixed renewable energy source: Preference for electricity products when the share of renewable energy increases. Energy Policy 2016, 97, 521–531. [Google Scholar] [CrossRef]
- Nermend, K. Taxonomic Vector Measure of Region Development (TWMRR). Pol. J. Environ. Stud. 2017, 16, 195–198. [Google Scholar]
- Roszkowska, E.; Filipowicz-Chomko, M. Measuring Sustainable Development Using an Extended Hellwig Method: A Case Study of Education. Soc. Indic. Res. 2021, 153, 299–322. [Google Scholar] [CrossRef]
- Pawlas, I. Economic Picture of the Enlarged European Union in the Light of Taxonomic Research. In Proceedings of the MAC-EMM 2016, Prague, Czech Republic, 5–6 August 2016. [Google Scholar]
- Reiff, M.; Surmanová, K.; Balcerzak, A.P.; Pietrzak, M.B. Multiple Criteria Analysis of European Union Agriculture. J. Int. Stud. 2016, 9, 62–74. [Google Scholar] [CrossRef]
- Kukuła, K. Metoda Unitaryzacji Zerowanej; PWN: Warszawa, Poland, 2000. [Google Scholar]
- Bąk, I.; Cheba, K. An analysis of dynamic changes in selected areas of sustainable development of the European Union countries. Folia Oeconomica Stetin. 2018, 18, 93–107. [Google Scholar] [CrossRef] [Green Version]
- Bąk, I.; Cheba, K. The application of the dynamic classifications in order to evaluate the changes of the European Union’s Sustainable Development. In Proceedings of the 2018 International Conference “Economic Science for Rural Development”, Jelgava, Latvia, 9–11 May 2018; pp. 36–43. [Google Scholar]
- Grabiński, T. Wybrane problemy dynamicznej wielowymiarowej analizy porównawczej. Ruch Praw. Ekon. Socjol. 1985, 2, 189–206. [Google Scholar]
- Nowak, E. Metody Taksonomiczne w Klasyfikacji Obiektów Społeczno-Gospodarczych; Państwowe Wydawnictwo Ekonomiczne: Warszawa, Poland, 1990. [Google Scholar]
- Steczkowski, J.; Zeliaś, A. Metody Statystyczne w Badaniu Zjawisk Jakościowych; Wydawnictwo Uczelniane Akademii Ekonomicznej w Krakowie: Kraków, Poland, 1997. [Google Scholar]
- Stanisz, A. Przystępny Kurs Statystyki z Zastosowaniem STATISTICA PL na Przykładach z Medycyny, t. 1. Statystyki Podstawowe; Wydawnictwo StatSoft Polska: Kraków, Poland, 2006. [Google Scholar]
- Global Trends in Renewable Energy Investment. BloombergNEF, United Nations Environment Programme, Frankfurt am Main. 2020. Available online: http://www.fs-unep-centre.org (accessed on 30 June 2021).
- Hess, D.J.; McKane, R.G. Renewable Energy Research and Development: A Political Economy Perspective. In Routledge Handbook of the Political Economy of Science; Tyfield, D., Lave, R., Randalls, S., Thorpe, C., Eds.; Routledge: London, UK, 2016. [Google Scholar]
- Burke, M.J.; Stephens, J. Political power and renewable energy futures: A critical review. Energy Res. Soc. Sci. 2018, 35, 78–93. [Google Scholar] [CrossRef]
- Pegels, A.; Vidican-Auktor, G.; Lütkenhorst, W.; Altenburg, T. Politics of Green Energy Policy. J. Environ. Dev. 2018, 27, 26–45. [Google Scholar] [CrossRef] [Green Version]
- Heffron, R.J.; Talus, K. The development of energy law in the 21st century: A paradigm shift? J. World Energy Law Bus. 2016, 9, 189–202. [Google Scholar] [CrossRef] [Green Version]
- O’Sullivan, M.; Overland, I.; Sandalow, D. The Geopolitics of Renewable Energy Center on Global Energy Policy; Columbia University: New York, NY, USA, 2017. [Google Scholar]
- Heffron, R.J.; Rønne, A.; Tomain, J.P.; Bradbrook, A.; Talus, K. A treatise for energy law. J. World Energy Law Bus. 2018, 11, 34–48. [Google Scholar] [CrossRef] [Green Version]
- Turney, D.; Fthenakis, V. Environmental impacts from the installation and operation of large-scale solar powerplants. Renew. Sustain. Energy 2011, 15, 3261–3270. [Google Scholar] [CrossRef]
- Kumar, M. Social, Economic, and Environmental Impacts of Renewable Energy Resources. In Wind Solar Hybrid Renewable Energy System; Okedu, K.E., Tahour, A., Aissaou, A.G., Eds.; IntechOpen: London, UK, 2020; Chapter 11; Available online: https://www.intechopen.com/books/wind-solar-hybrid-renewable-energy-system/social-economic-and-environmental-impacts-of-renewable-energy-resources (accessed on 30 June 2021). [CrossRef] [Green Version]
- Mizobuchi, K.; Takeuchi, K. The influences of financial and non-financial factors on energy-saving behaviour: A field experiment in Japan. Energy Policy 2013, 63, 775–787. [Google Scholar] [CrossRef]
- Peimani, H. Financial Barriers to Development of Renewable and Green Energy Projects in Asia. ADBI Working Paper 862. 2018. Available online: https://www.adb.org/publications/financial-barriers-development-renewable-green-energy-projects-asia (accessed on 30 June 2021).
- Le, H.P. The energy-growth nexus revisited: The role offinancial development, institutions, government expenditure and trade openness. Heliyon 2020, 6, e04369. [Google Scholar] [CrossRef] [PubMed]
- An Official Website of the European Union. Available online: https://europa.eu/european-union/topics/environment_pl (accessed on 7 January 2021).
- Ossowska, L.; Janiszewska, D.; Bartkowiak-Bakun, N.; Kwiatkowski, G. Energy Consumption Versus Greenhouse Gas Emissions in EU. Eur. Res. Stud. J. 2020, XXIII, 185–198. [Google Scholar] [CrossRef]
- Standar, A.; Kozera, A.; Satoła, Ł. The Importance of Local Investments Co-Financed by the European Union in the Field of Renewable Energy Sources in Rural Areas of Poland. Energies 2021, 14, 450. [Google Scholar] [CrossRef]
- Aceleanu, M.; Șerban, A.C.; Pociovălișteanu, D.M.; Dimian, G.C. Renewable energy: A way for a sustainable development in Romania. Energy Sources Part B Econ. Plan. Policy 2017, 12, 958–963. [Google Scholar] [CrossRef]
- Akar, B.G. The Determinants of Renewable Energy Consumption: An Empirical Analysis for The Balkans. Eur. Sci. J. ESJ 2016, 12, 594–607. [Google Scholar] [CrossRef]
- Spaiser, V.; Ranganathan, S.; Swain, R.B.; Sumpter, D.J.T. The sustainable development oxymoron: Quantifying and modelling the incompatibility of sustainable development goals. Int. J. Sustain. Dev. World Ecol. 2017, 24, 457–470. [Google Scholar] [CrossRef]
- Wu, G.; Liu, D.; Yan, Y. Sustainable development and ecological protection associated with coal-fired power plants in China. Int. J. Sustain. Dev. World Ecol. 2017, 24, 385–388. [Google Scholar] [CrossRef]
- United Nations. Sustainable Development Goals. 2019. Available online: https://www.un.org/sustainabledevelopment/energy/ (accessed on 30 June 2021).
- Streimikiene, D.; Klevas, V.; Bubeliene, J. Use of EU structural funds for sustainable energy development in new EU member states. Renew. Sustain. Energy Rev. 2007, 11, 1167–1187. [Google Scholar] [CrossRef]
- Bointner, R.; Pezzutto, S.; Grilli, G.; Sparber, W. Financing innovations for the renewable energy transition in Europe. Energies 2016, 9, 990. [Google Scholar] [CrossRef] [Green Version]
- Carfora, A.; Romano, A.A.; Ronghi, M.; Scandurra, G. Renewable generation across Italian regions: Spillover effects and effectiveness of European Regional Fund. Energy Policy 2017, 102, 132–141. [Google Scholar] [CrossRef]
- Bostan, I.; Lazar, C.M.; Asalos, N.; Munteanu, I.; Horga, G.M. The three-dimensional impact of the absorption effects of European funds on the competitiveness of the SMEs from the Danube Delta. Ind. Crops Prod. 2019, 132, 460–467. [Google Scholar] [CrossRef]
- Kazak, J.K.; Kamiń, J.A.; Madej, R.; Bochenkiewicz, M. Where Renewable Energy Sources Funds are Invested? Spatial Analysis of Energy Production Potential and Public Support. Energies 2020, 13, 5551. [Google Scholar] [CrossRef]
- Nurkan, K.A. The Impact of Government Policies in the Renewable Energy Investment: Developing a Conceptual Framework and Qualitative Analysis. Glob. Adv. Res. J. Manag. Bus. Stud. 2015, 4, 67–81. [Google Scholar]
- May, N.; Neuhoff, K. Financing Power: Impacts of Energy Policies in Changing Regulatory Environments. DIW Berl. Discuss. Pap. 2017, 1684. Available online: https://ssrn.com/abstract=3046516 (accessed on 30 June 2021). [CrossRef] [Green Version]
- Layke, J.; Hutchinson, N. 3 Reasons to Invest in Renewable Energy Now. World Resources Institute, 2020. Available online: https://www.wri.org/insights/3-reasons-invest-renewable-energy-now (accessed on 4 May 2021).
- Newbery, D. Policies for decarbonizing a liberalized power sector. Econ. Open-Access Open-Assess. E-J. 2018, 12, 1–24. [Google Scholar] [CrossRef] [Green Version]
| Renewable Energy Type | Directions of Research | Authors |
|---|---|---|
| Solar energy | positive relationship between solar energy and installation size the possibility of using solar energy and the amount of energy that can be generated cost of installation, generation, and cost effectiveness impact on environment | John et al. (2021) [32], Cousse (2021) [33] Chiemelu et al. (2021) [34] Yao et al. (2021) [35], Farnè et al. (2021) [36], Hamzaoğlu et al. (2021) [37], Anctil et al. (2019) [38], Sultan et al. (2018) [39], Novacheck and Johnson (2015) [40] Shahsavari and Akbari (2018) [41], Novacheck and Johnson (2015) [41], Creutzig et al. (2017) [42] |
| Wind energy | cost of installation, generation and cost effectiveness impact on environment barriers and incentives for installation or improvement of wind energy | Yao et al. (2021) [35], Ambec and Crampes (2019) [43], Adeyeye et al. (2020) [44] Sayed et al. (2020) [45], Wellig et al. (2018) [46]) Diógenes et al. (2020) [47], Gönül et al. (2021) [48], Aldy et al. (2018) [49], Black et al. (2014) [50] |
| Hydro energy | cost of installation, generation, and cost effectiveness environmental impact incentives and barriers for installation or improvement of hydro energy | Yao et al. (2021) [35], Javed et al. (2019) [51], Fan et al. (2020) [52] Sayed et al. (2020) [45], Lu et al. (2019) [53] Penghao et al. (2018) [54], Yang et al. (2011) [55], Ciric (2019) [56] |
| Geothermal energy | cost of installation, generation, and cost effectiveness mitigate climate change and sustainable development barriers and incentives for installation or improvement | Yao et al. (2021) [35], Farnè et al. (2021) [36] Paulillo et al. (2019) [57], Bošnjakovid et al. (2019) [58], Shortall et al. (2015) [59], Sayed et al. (2020) [45] Yasukawa et al. (2020) [60] |
| Biomass energy | environmental impact and sustainable development cost of installation, generation, and cost effectiveness | Danish and Ulucak (2019) [61], Güney and Kantar (2020) [62], Sayed et al. (2020) [45], Chang et al. (2017) [63]) Inayat et al. (2019) [64], Mohamed et al. (2017) [65] |
| Symbol | M | A | ||
|---|---|---|---|---|
| X1 | 0.22 | 0.18 | 53.56 | 1.13 |
| X2 | 0.33 | 0.32 | 56.65 | 0.75 |
| X3 | 0.09 | 0.08 | 59.51 | 3.01 |
| X4 | 0.29 | 0.26 | 57.10 | 0.53 |
| X5 | 952.45 | 361.28 | 156.40 | 2.59 |
| X6 | 692.45 | 477.74 | 97.26 | 1.48 |
| X7 | 188.27 | 173.94 | 77.17 | 0.73 |
| X8 | 317.02 | 175.32 | 143.38 | 3.06 |
| X9 | 132.80 | 103.21 | 81.50 | 1.44 |
| X10 | 2282.98 | 1674.57 | 88.94 | 2.41 |
| X11 | 2.98 | 1.44 | 136.43 | 2.31 |
| X12 | 36.40 | 27.10 | 105.70 | 2.38 |
| X13 | 6.07 | 0.37 | 325.00 | 4.61 |
| X14 | 479.49 | 323.17 | 96.83 | 3.25 |
| X15 | 750.76 | 561.81 | 87.08 | 2.58 |
| X16 | 2537.78 | 1919.25 | 91.11 | 2.77 |
| X17 | 849.23 | 253.68 | 146.74 | 1.55 |
| X18 | 330.93 | 195.19 | 109.27 | 2.05 |
| X19 | 3717.94 | 2353.66 | 95.59 | 2.31 |
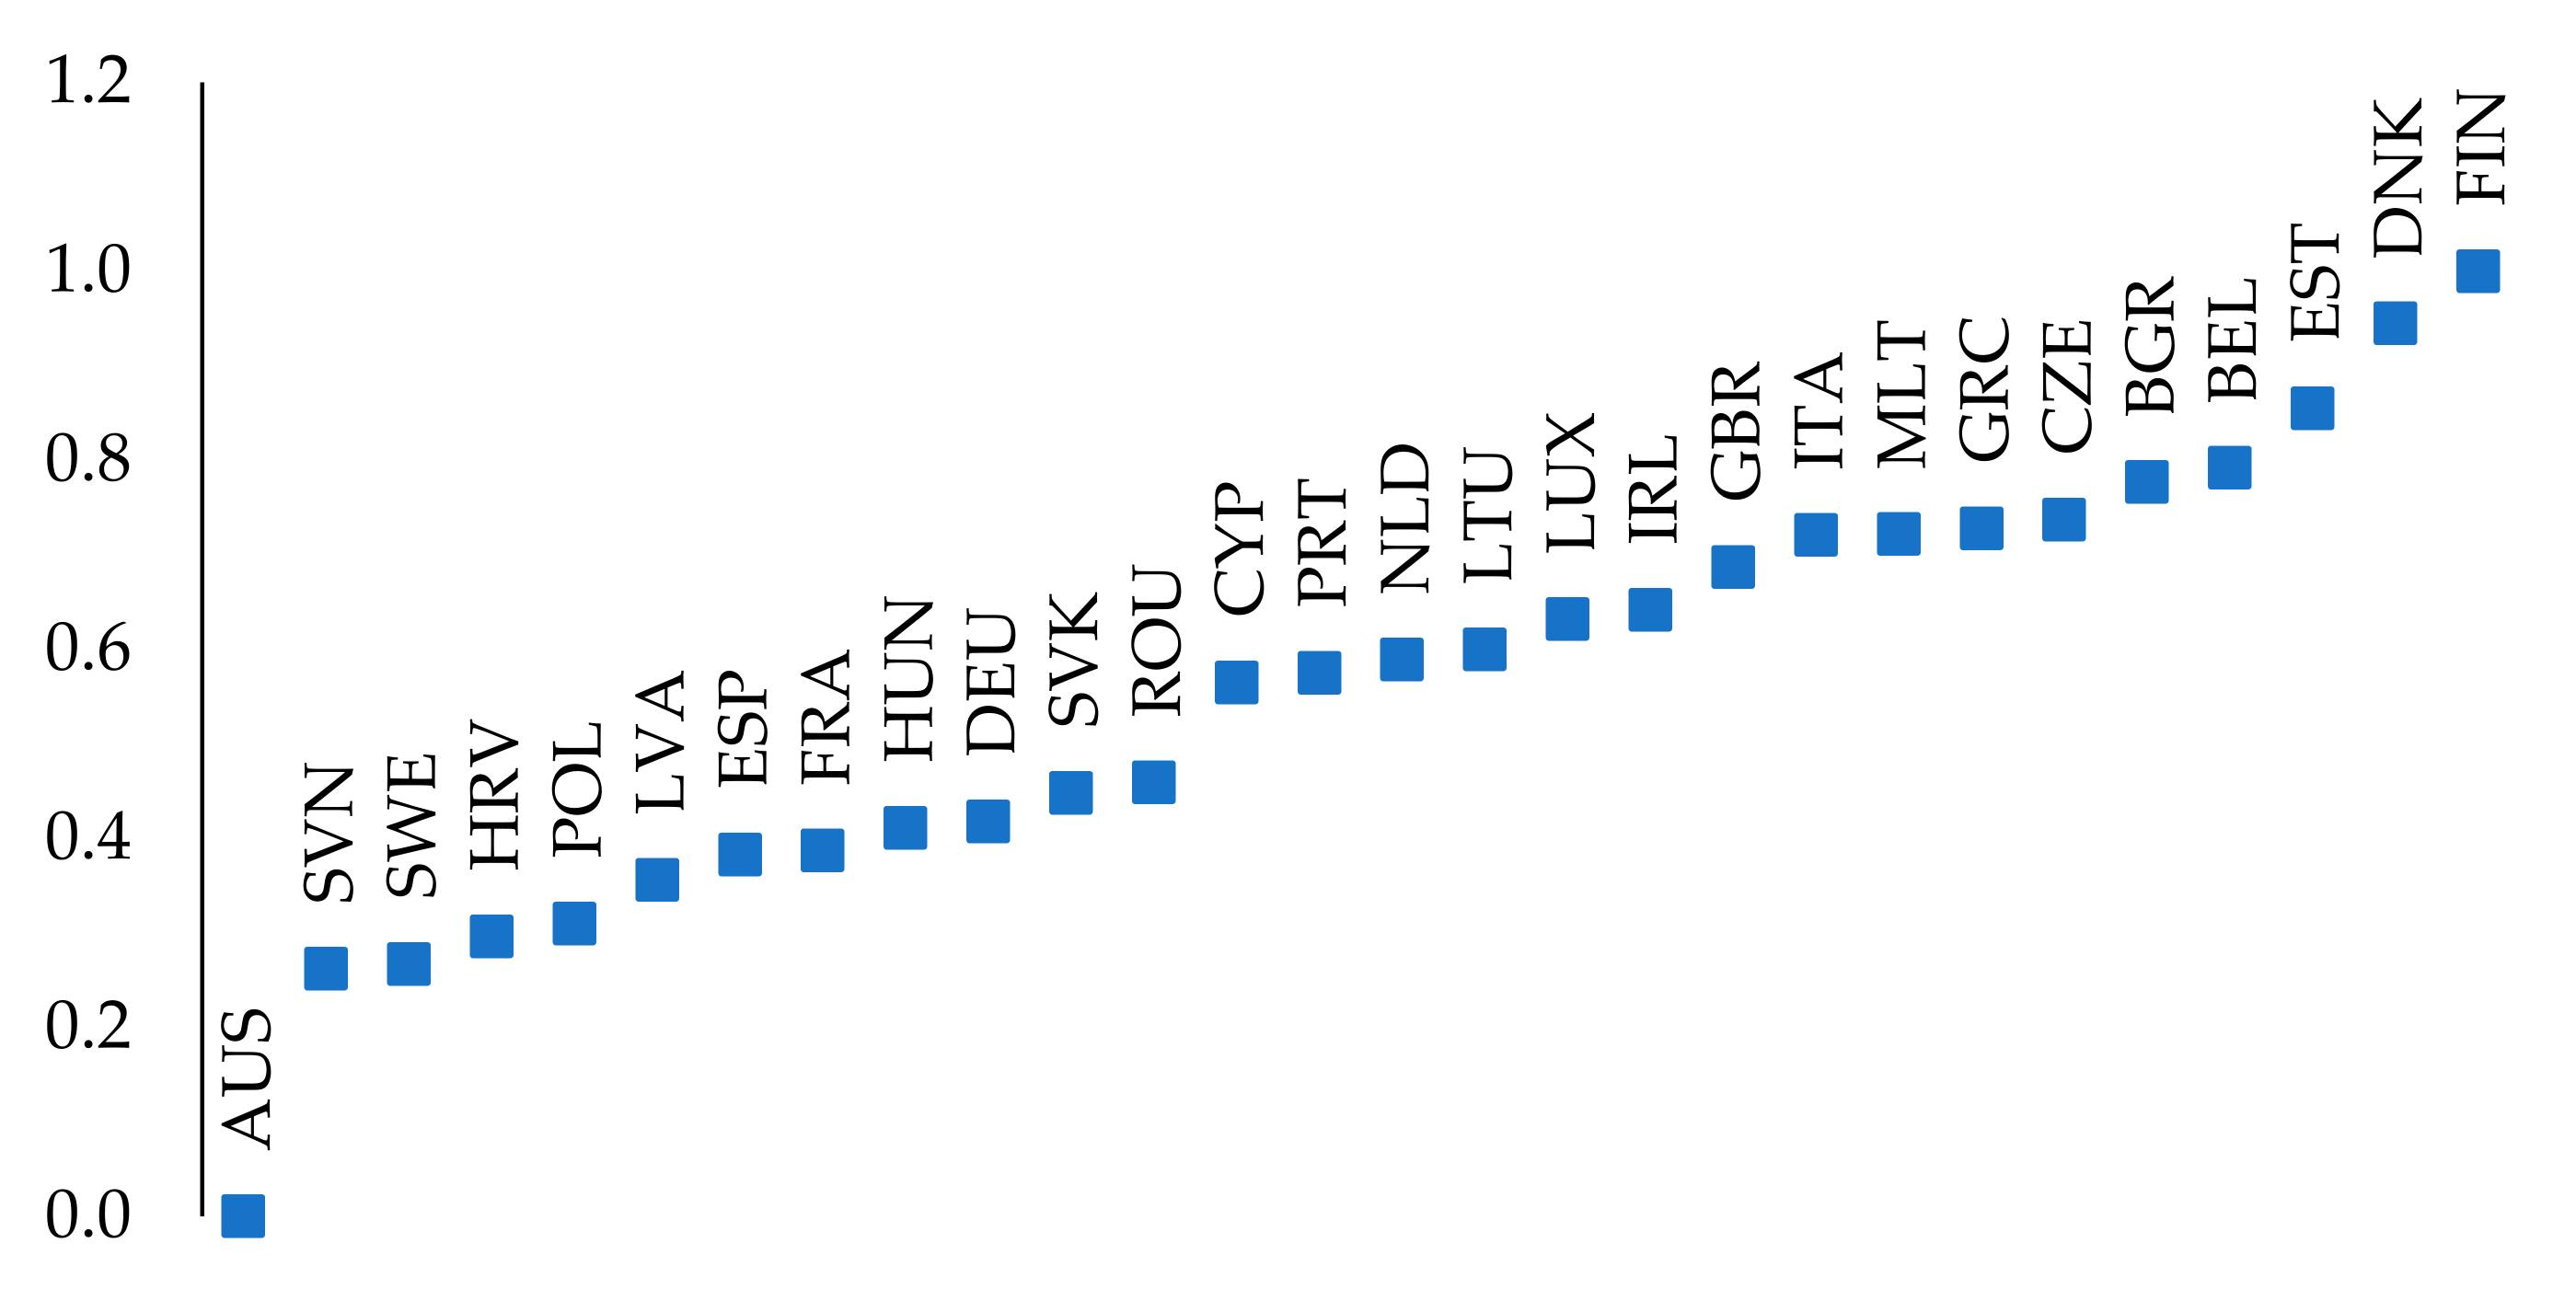
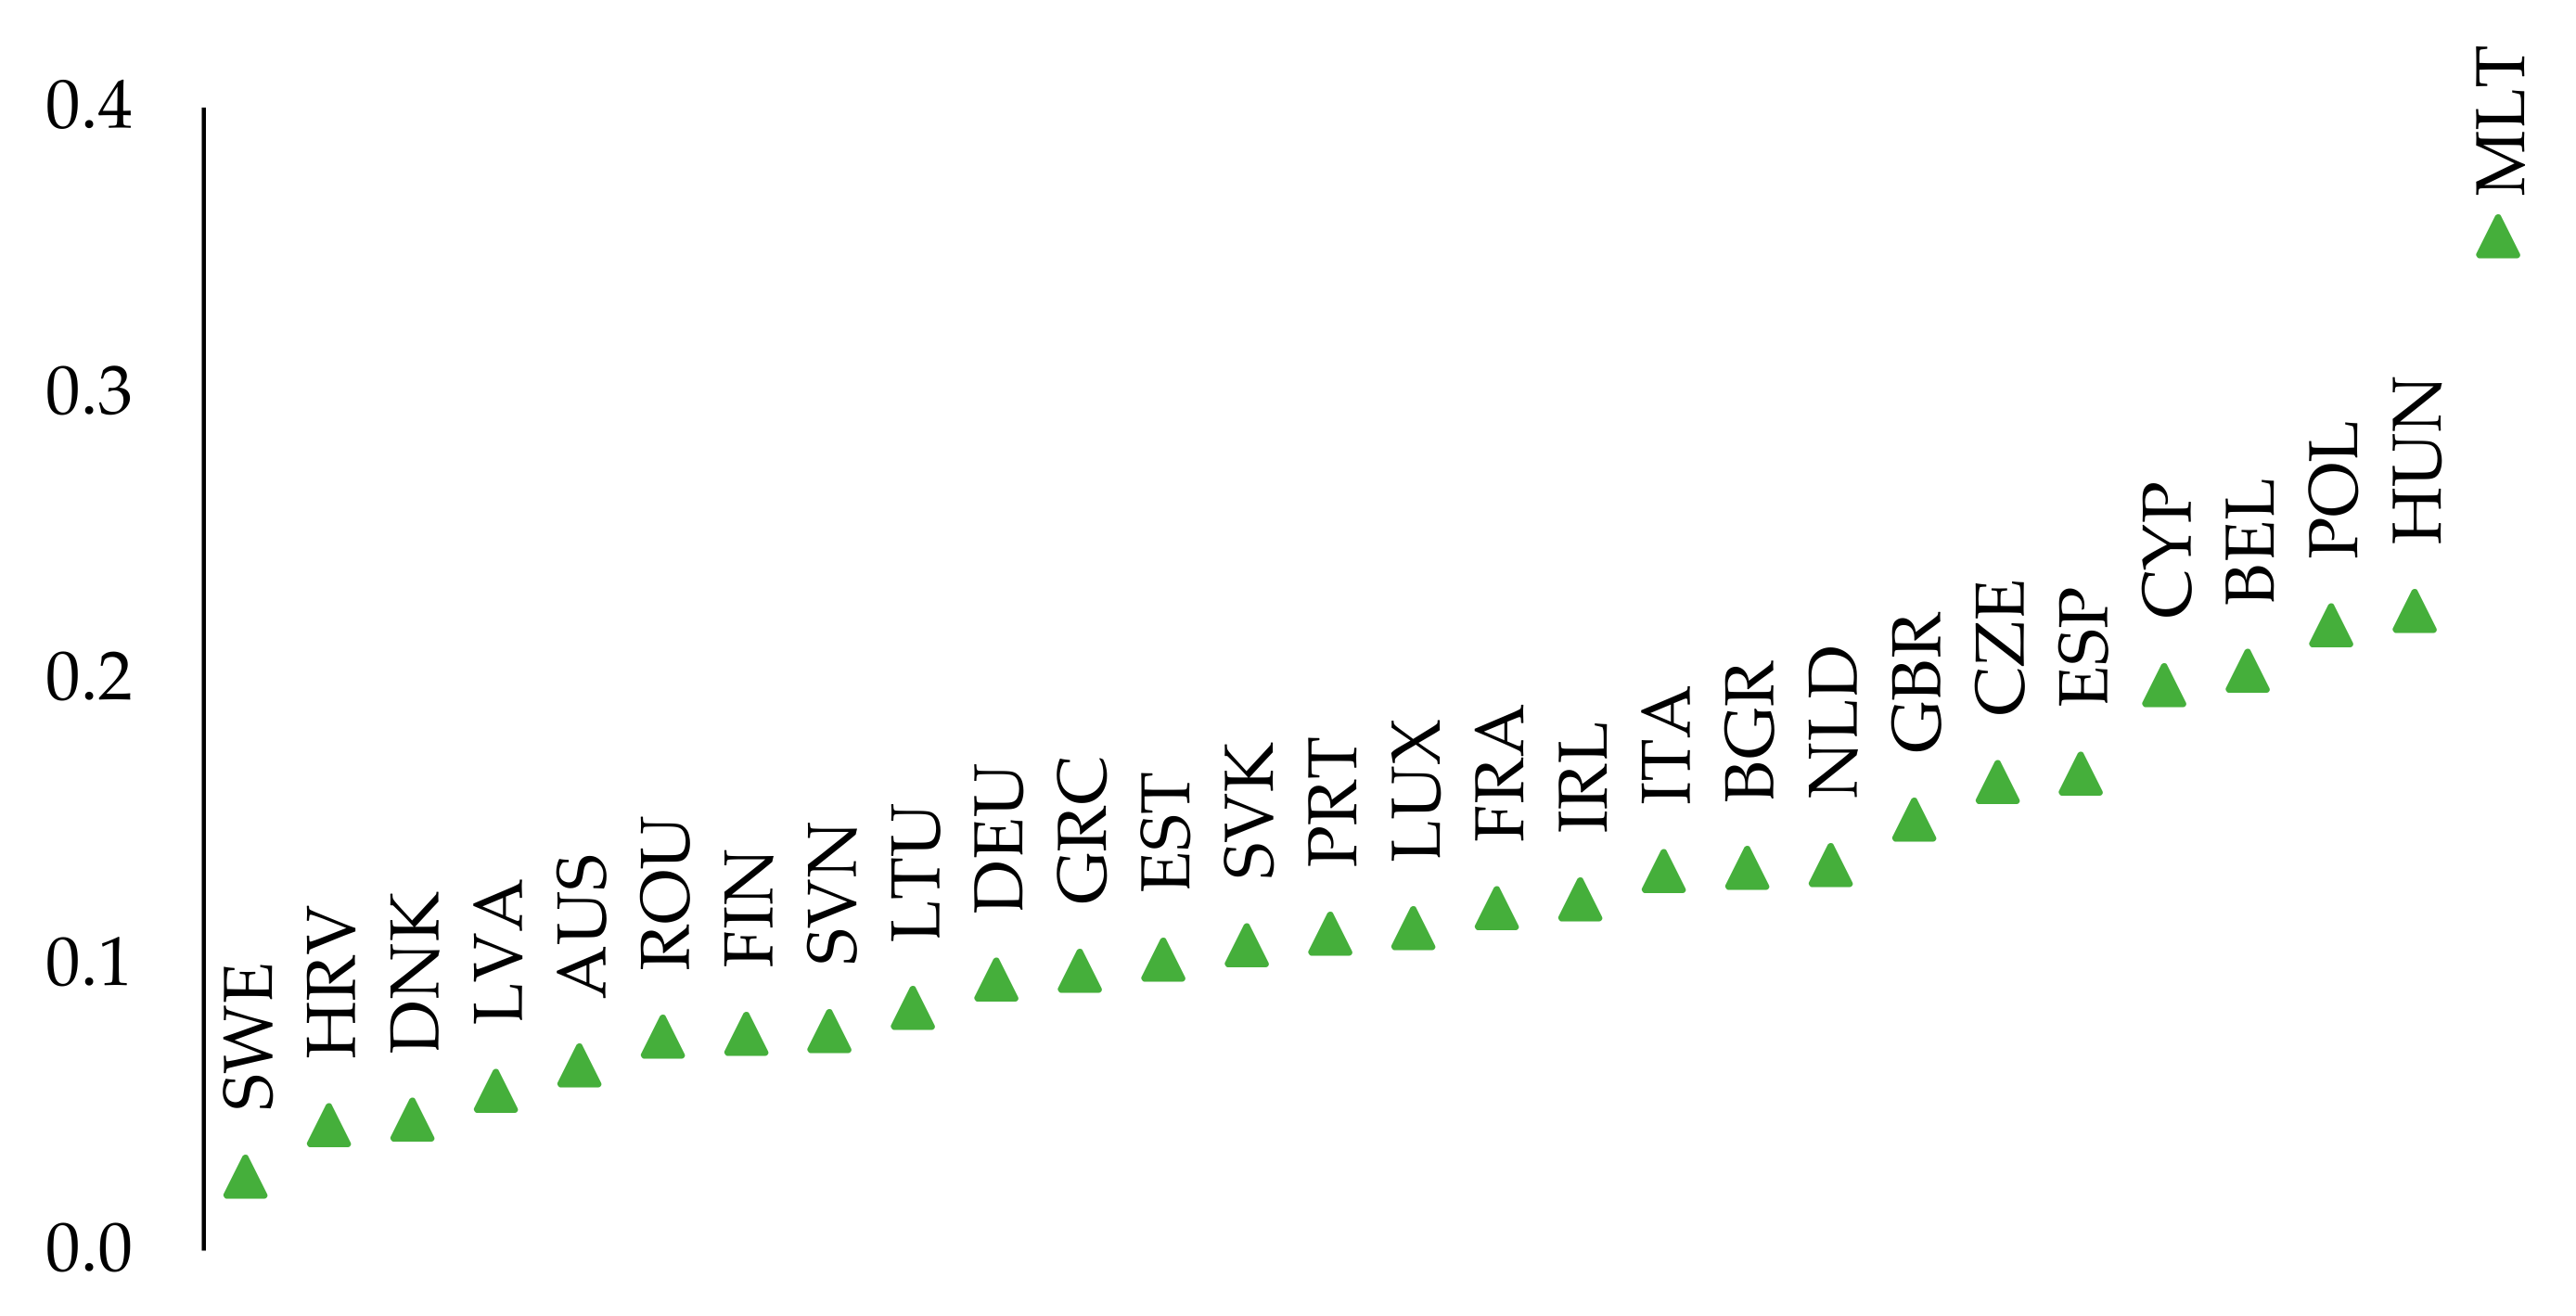
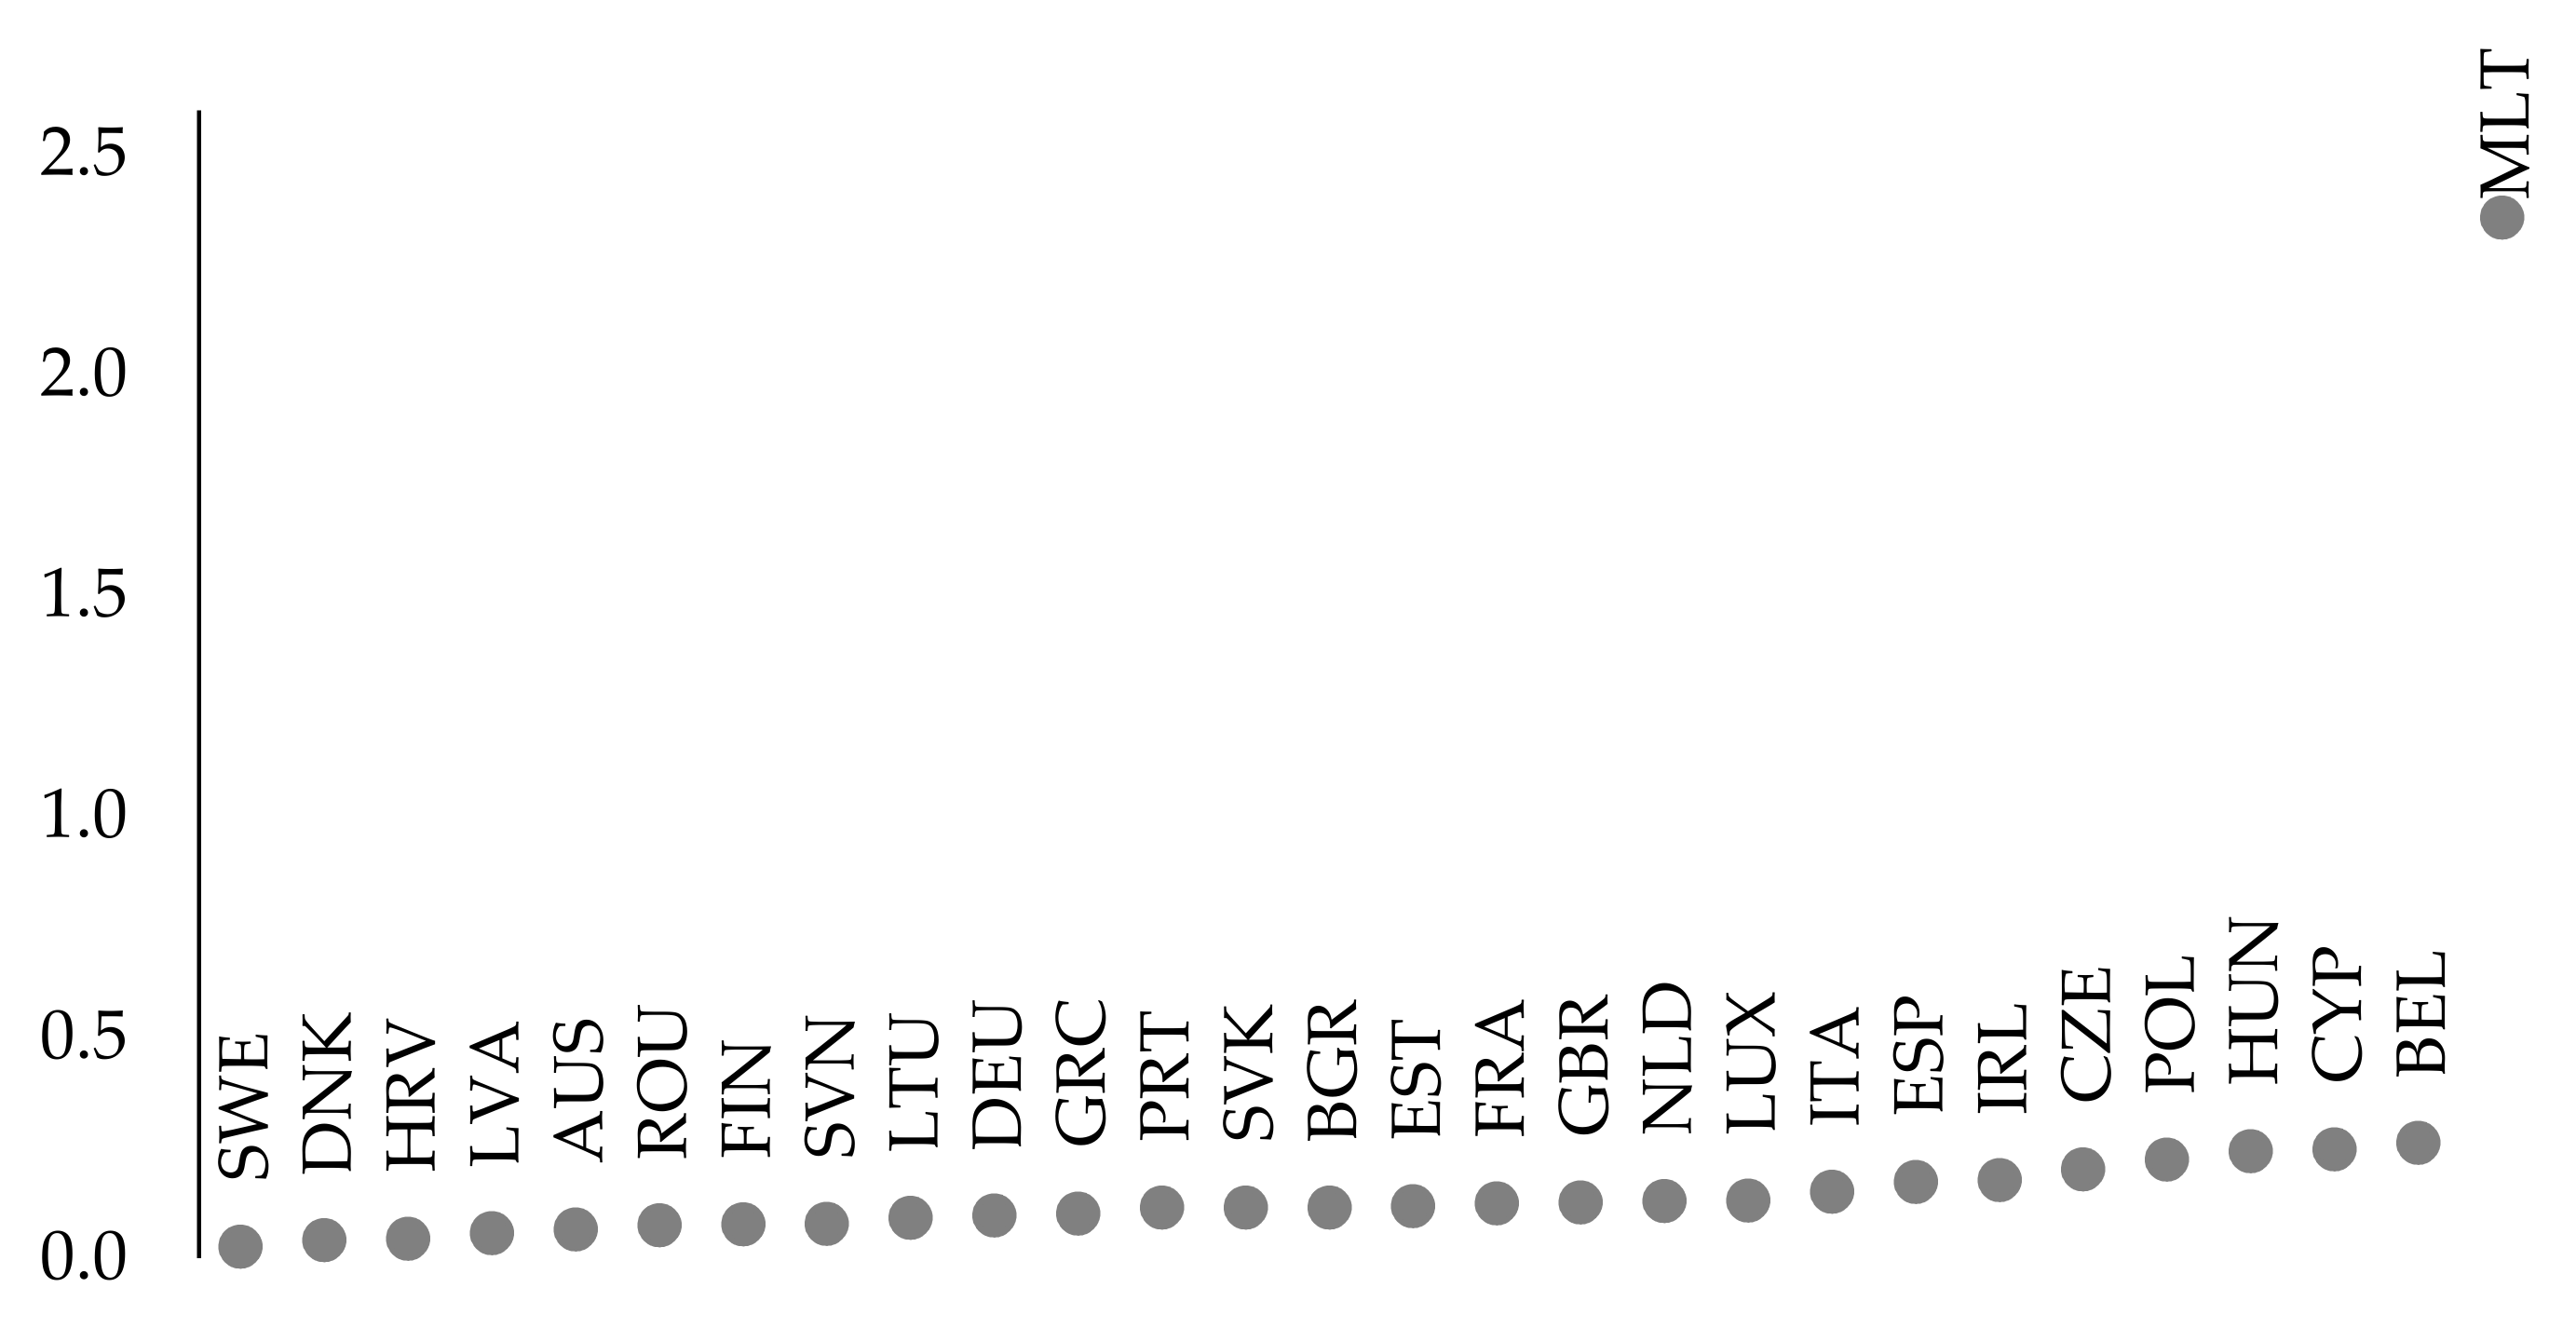
| Country | bi | Country | ci | Country | wi on the Basis of Linear Trends | Country on the Basis of Exponential Trends | wi |
|---|---|---|---|---|---|---|---|
| Finland Denmark Estonia Belgium Bulgaria Czechia Greece | 1.000 0.945 0.855 0.792 0.777 0.737 0.728 | Malta Cyprus Belgium United Kingdom Ireland Bulgaria Greece | 1.000 0.984 0.890 0.80 90.791 0.781 0.756 | Malta Hungary Poland Belgium Cyprus Spain Czechia | 0.355 0.224 0.21 90.203 0.198 0.167 0.164 | Malta Belgium Cyprus Hungary Poland Czechia Ireland | 2.357 0.261 0.246 0.242 0.223 0.201 0.176 |
| Malta Italy United Kingdom Ireland Luxembourg Lithuania Netherlands | 0.722 0.721 0.687 0.642 0.632 0.600 0.589 | Czechia Estonia Netherlands Italy Lithuania Luxembourg Hungary | 0.643 0.582 0.472 0.43 90.406 0.398 0.385 | United Kingdom Netherlands Bulgaria Italy Ireland France | 0.151 0.135 0.134 0.133 0.123 0.120 | Spain Italy Luxembourg Netherlands United Kingdom France Estonia | 0.172 0.150 0.130 0.12 90.126 0.124 0.117 |
| Portugal Cyprus Romania Slovakia Germany Hungary France | 0.575 0.565 0.45 90.448 0.418 0.411 0.387 | Denmark Slovakia Finland Portugal Romania Spain France | 0.380 0.340 0.307 0.298 0.285 0.205 0.194 | Luxembourg Portugal Slovakia Estonia Greece Germany Lithuania Slovenia | 0.113 0.111 0.107 0.102 0.098 0.095 0.085 0.077 | Bulgaria Slovakia Portugal Greece Germany Lithuania Slovenia Finland | 0.1144 0.1142 0.1140 0.101 0.096 0.091 0.077 0.076 |
| Spain Latvia Poland Croatia Sweden Slovenia Austria | 0.383 0.356 0.310 0.296 0.267 0.262 0.000 | Germany Poland Latvia Croatia Sweden Slovenia Austria | 0.182 0.181 0.122 0.107 0.077 0.074 0.000 | Finland Romania Austria Latvia Denmark Croatia Sweden | 0.076 0.075 0.065 0.056 0.046 0.044 0.026 | Romania Austria Latvia Croatia Denmark Sweden | 0.074 0.065 0.056 0.044 0.040 0.026 |
Publisher’s Note: MDPI stays neutral with regard to jurisdictional claims in published maps and institutional affiliations. |
© 2021 by the authors. Licensee MDPI, Basel, Switzerland. This article is an open access article distributed under the terms and conditions of the Creative Commons Attribution (CC BY) license (https://creativecommons.org/licenses/by/4.0/).
Share and Cite
Bąk, I.; Spoz, A.; Zioło, M.; Dylewski, M. Dynamic Analysis of the Similarity of Objects in Research on the Use of Renewable Energy Resources in European Union Countries. Energies 2021, 14, 3952. https://doi.org/10.3390/en14133952
Bąk I, Spoz A, Zioło M, Dylewski M. Dynamic Analysis of the Similarity of Objects in Research on the Use of Renewable Energy Resources in European Union Countries. Energies. 2021; 14(13):3952. https://doi.org/10.3390/en14133952
Chicago/Turabian StyleBąk, Iwona, Anna Spoz, Magdalena Zioło, and Marek Dylewski. 2021. "Dynamic Analysis of the Similarity of Objects in Research on the Use of Renewable Energy Resources in European Union Countries" Energies 14, no. 13: 3952. https://doi.org/10.3390/en14133952
APA StyleBąk, I., Spoz, A., Zioło, M., & Dylewski, M. (2021). Dynamic Analysis of the Similarity of Objects in Research on the Use of Renewable Energy Resources in European Union Countries. Energies, 14(13), 3952. https://doi.org/10.3390/en14133952