Abstract
Shifting from fossil to renewable energy sources is a major global challenge, and in this context, the European Union has promoted sustainable and environmentally friendly growth as early as the Maastricht Treaty of 1992. To date, European institutions have promulgated a series of environmental regulations and directives aimed at promoting and imposing adoption by member states of internal regulations. This paper is focused on Western Europe, and it explores, for each state under analysis, energy policies adopted, the results achieved and recommendations for the future growth of renewable energy. The results show that in countries where energy policy is not fragmented, the yield in renewable energies has been higher, and also in the states where more and various forms of subsidies are foreseen, growth seems to be greater. Finally, the paper provides useful recommendations and future policy implications for states that have not met the 2020 targets.
1. Introduction
From a sustainability perspective, renewable energy plays a fundamental role [1]. To date, in fact, great use is made of non-renewable energies, whose overall quantity is limited; moreover, the greater the amount of non-renewable energy extracted and used today, the lesser the amount available for future generations [2]. It therefore appears essential that industrialized states rush to invest in the development of eco-sustainable technologies, exploiting renewable resources, such as the sun, wind and water and their interaction [3,4,5]. The “sustainable” energy thus produced can be used for activities related to the production of electricity, as well as cooling and heating [6,7]. In this regard, there is talk of sustainable energy produced from natural sources (solar, wind, biomass [8], hydro, wave and tidal energy [9,10,11]) that do not harm the environment and are always available, as they are not destined to run out [12,13,14].
To verify and analyze the current energy situation in the European Union, this paper is focused on Western European countries according to the UN geographic scheme: Austria, Belgium, France, Germany, Luxembourg and Holland.
In particular, the objectives of this paper are to analyze the following:
- The progress made by the states under analysis in the field of renewable energy;
- The energy policies adopted and the results that have been reported following the regulatory innovations, in order to identify the potentials and limits for the development of renewable energies;
- Recommendations for the future growth of renewable energy in these regions.
The results may be of interest to academics, economists, entrepreneurs and especially the political leadership involved in the development of long-term energy scenarios internationally, nationally and regionally.
This paper is structured as follows: the second section is aimed at a literature review; the third section analyzes the energy situation of the countries under analysis in the years 2011 to 2018; in the fourth section, the energy policies of the Western European countries are tackled in a critical approach; finally, the paper concludes with future useful recommendations for states that have not met the 2020 targets.
2. Literature Review
Western European countries are often used as a sample model to analyze the European situation in various fields: social [15,16], economic [17] and political [18,19], and also in order to verify the results obtained in Europe in terms of environmental protection, land use and the use of renewable energy [1,20,21,22,23,24].
This interest in the analysis of the western states can be connected to a plurality of reasons: These states exhibit considerable heterogeneity in terms of population density and size. Furthermore, this lack of homogeneity also emerges with reference to the historical-political culture which, consequently, also affects the energy policies adopted (although not the types of subsidies) as well as the targets imposed by Dir. 2009/28/EC (Figure 1).
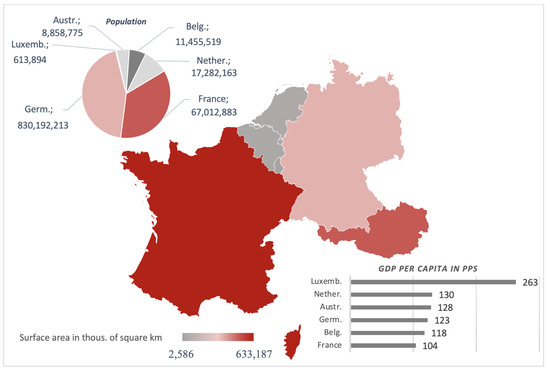
Figure 1.
Main characteristics of Western European countries under analysis.
Study on the energy situation in Austria has been carried out at various levels, focusing, in particular, on the exploitation of energy from biomass [25,26], wind and photovoltaics [27]; comparative studies have been carried out by Monacchi et al. [28], by A. Ebers Broughel and Hampl [29] and by Würzburg et al. [30] for Italy, Switzerland and Germany, respectively, and Dujardin et al. [31] also focused on renewable energy in Switzerland.
The exploitation of renewable energy and the energy policies of this, on the other hand, have been studied more widely and in a more general way [32,33], also in respect to Luxembourg, on which some analyses have also been carried out regarding the use of photovoltaic energy [34].
As for Belgium, France and the Netherlands, however, the study is larger, and, in the area of RES, the academic contributions are considerable [35,36,37], but there are not many comparative analyses.
3. Western European Renewables Outlook
The data relating to energy consumption from renewable and non-renewable sources in the six states taken into consideration were analyzed over an eight-year period spanning from 2011 to 2018.
These data were then used to evaluate the performance of each individual state with a view to achieving the 2020 target defined by Directive 2009/28/EC, a directive on the promotion of the use of energy from renewable sources, and amending and subsequently repealing Directives 2001/77/EC and 2003/30/EC. The need to identify targets for each individual state was highlighted in the Commission Communication of 10 January 2007 entitled “Roadmap for renewable energy” and reaffirmed in the European Council of March 2007 because, as the directive itself states, the national mandatory targets established create certainty for investors and stimulate the constant development of technologies capable of generating energy from any type of renewable source. In addition, for the purpose of a comparative study, these targets are useful for comparing the results achieved year by year with respect to the final objective (Figure 2).
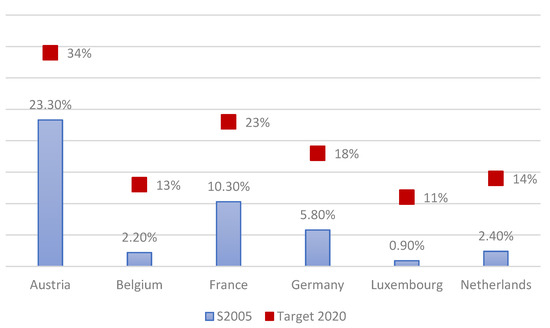
Figure 2.
Starting point (S2005) and directive’s 2020 target for the sample member states. On the Y-axis, the percentage of energy achieved with respect to the final objective is shown.
As a reference of the growth rate relating to the consumption of renewable energy, the starting percentage values of the member states used by the directive to calculate the arrival point (S2005) are also shown in the figure.
The following figures show the data relating to total energy consumption, in the year 2011 (Figure 3) and in 2018 (Figure 4), in the three main sectors such as electricity, transport and heating and cooling from which consumption from renewable sources was extracted: RES-E, RES-T and RES H&C, respectively.
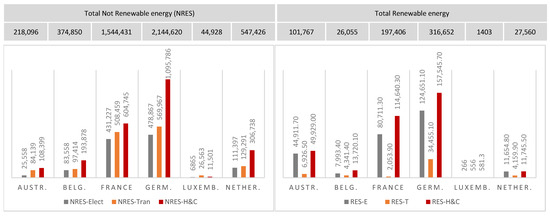
Figure 3.
Energy consumption (GWh) in 2011.
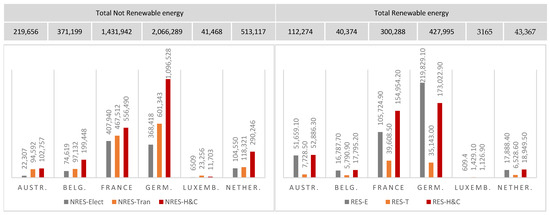
Figure 4.
Energy consumption (GWh) in 2018.
In calculating the consumption of electricity from renewable sources (RES-E), the amount of energy used in transport was excluded because it was already considered as RES-T values.
In the following figures (source: https://ec.europa.eu/eurostat/web/energy/data/shares, accessed on 28 June 2021), however, the individual renewable energy sources for each country are taken into consideration, in order to highlight the individual contributions to the production of electricity, in the years 2011 (Figure 5) and 2018 (Figure 6).
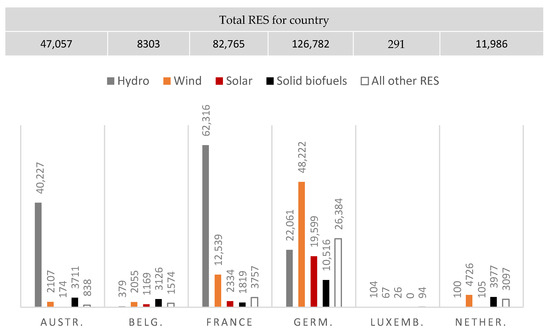
Figure 5.
Types of RES (GWh) produced in 2011.
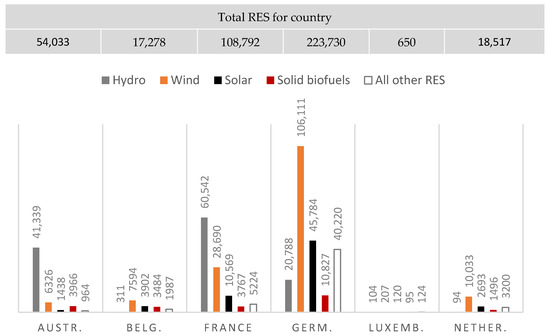
Figure 6.
Types of RES (GWh) produced in 2018.
The analysis of the data shows that the policies of Austria, Germany and the Netherlands have mainly been aimed at the use of solar energy, managing to significantly increase its use. Belgium, on the other hand, has increased both the use of solar and wind energy, but the value of the other RES is almost unchanged. Luxembourg, starting from 0, has managed to increase the use of solid fuel, unlike the Netherlands, where biofuel consumption is decreasing.
It can be seen in the figure how Austria has always maintained a very high consumption of renewable energy, close to the 2020 target, demonstrating a modest improvement from 2011 to 2018. In contrast, Luxembourg, which in 2011 started from a percentage of achievement of the target of 26.1%, shows impressive growth, reaching 82.4% in 2018, with a growth of 56.3%. The other countries, on the other hand, show an average growth rate of around 25%.
In Figure 7 a summary of the renewable energy consumption rate normalized to the 2020 target is presented.
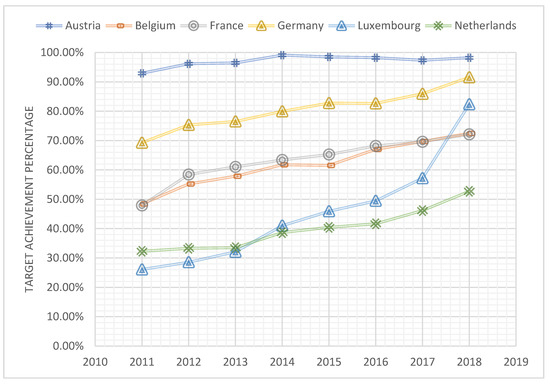
Figure 7.
Renewable energy consumption rate normalized to the 2020 target.
4. Leading Features of Renewable Energy Policies in Western European Countries
As required by Directive 2009/28/EC, each member state has developed its own path to achieve the objective set for it by the European Union by 2020. These paths were published in the form of national action plans for renewable energy during the years 2010 and 2011.
Support and funding for RES investment policies are typically based on a combination of different types of policies and grants and cover all three main energy sectors analyzed above: RES-E; RES-T; RES-H&C.
This paper will analyze the main incentive schemes for renewable energy sources of the EU member states under analysis, namely: feed-in tariffs (FIT), feed-in prizes (FIP) and green certificates (GC) granted through tender contracts (TND) or other administrative procedures (Figure 8).
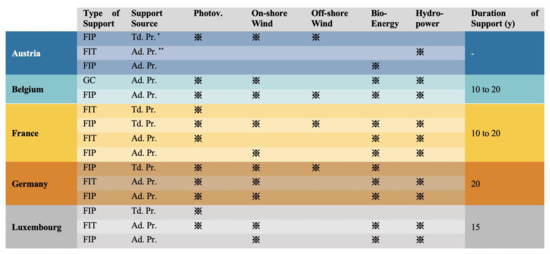
Figure 8.
Energy policies 2018. * Td. Pr., tendering procedures; ** Ad. Pr., administrative procedures.
This paper will also evaluate the success of a specific incentive policy. In this regard, it is important to highlight that the success of a given support tool can be assessed in multiple ways: in this document, the assessment is carried out considering the level of effectiveness, that is, the ability to achieve the set objectives, for example, the increase in the share of electricity generated from renewable sources in the total supply within a certain period of time.
4.1. Austria
Guidelines for funding REs are published separately for each Land; however, they differ neither in the eligibility criteria for the incentives, nor in the respective amounts.
In 2009 (BGBL, II no. 251/2009), the federal government and the individual Länder reached an agreement on the measures to be adopted in the construction sector aimed at reducing greenhouse gas emissions (art.15 bis B- VG). Moreover, most of the subsidies envisaged are directed mainly to the construction sector, for example, in the field of solar heat, heat pumps and biomass heating systems [38].
To support the development of renewable energy, several policies have been adopted in Austria; thus, using the year 2005 as a starting point, in Figure 9, the percentage growth in the consumption of energy from renewable sources in this country is depicted. There is an increasing monotonous trend from 2011 to 2018, with an average value of 1.75% and a minimum growth rate of 1.1% in 2013–2014. The last red column of the figure indicates the percentage to be reached in 2020 according to Dir. 2009/28/CE, which, for Austria, is 34%, meaning that the actual gap is 3.7%.
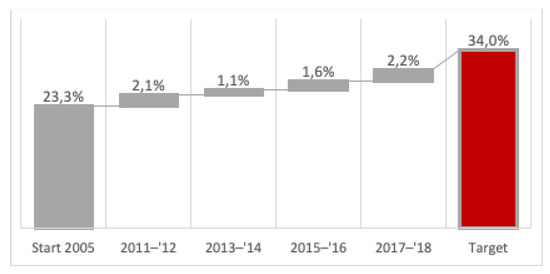
Figure 9.
Austria—energy consumption trend. Source: https://ec.europa.eu/eurostat/web/energy/data/shares, accessed on 28 June 2021.
In the following subsections, the main policies and regulations used by Austria to reach these results are analyzed. The analysis is focused on the actions to support renewable energies in the shares of RES-E, RES-T and RES-H&C. Additionally, since there is a highly fragmented situation, the following analysis also has the scope to define a comprehensive critical framework. This analysis and subsection division were carried out for each country under study.
4.1.1. RES-E
In Austria, electricity produced from renewable sources is supported, therefore, primarily through an FIT tariff, envisaged by the 2012 Ökostromgesetz (ÖSG), a green electricity law, and established, in quantum, by the related regulations.
In principle, the FIT regime is applied to all renewable energy technologies. However, plants must meet certain requirements, established by § 7 ÖSG of 2012, which allows them to be registered in public registers as a “green electricity plant” (Ökostromanlage) and to participate in tenders; from 2018, for solid and liquid biogas plants, these conditions are more onerous, and there are more stringent eligibility criteria: photovoltaic plants must exceed 5 kWp, and hydroelectric plants are eligible up to a power of 2 MW.
In addition to the FIT tariff regime, a series of subsidies are also provided for photovoltaic systems whose payment, envisaged by the ÖSG, depends on the capacity of the system in question.
The regime, just seen, seems to work, given that the production of renewable electricity has increased from 2011 to 2018.
4.1.2. RES-T
In Austria, alongside a tax exemption for electric vehicles and for end users of biofuel, the main support scheme for renewable energy sources used in transport is a quota system in force since 2005. That is, the legislation provides that companies that import or produce petrol or diesel are obliged to ensure that biofuels make up a defined percentage of their annual fuel sales. In addition, biofuels are supported through an investment promotion program (Klimaaktiv mobil). In essence, the state contributes to the purchase of green cars and supports the use of environmentally friendly vehicles; for example, electric bicycles are made available to citizens completely free of charge, and taxi drivers are encouraged to purchase green cars.
Initially, the energy plan envisaged for transport seemed to work, but in the last period, there has been a decrease compared to the use of biofuels for vehicles according to data published by Eurostat. However, this does not necessarily indicate that the tools provided by the Australian government are deficient or not very functional: since 2016, the statistical office has highlighted that only Austria (and Sweden), among the Union states, has achieved the objective of using 10% of the energy from renewable fuels for transport. Therefore, if, in absolute terms, the quota system alongside the promotion program would seem to have lost its effectiveness, in comparison with the other member states, Austria still enjoys a good record in terms of the use of RES-T. The comparison between Austria and the sample states would seem to confirm this thesis, since only France, in percentage, seems to have a higher yield, but France also has a greater population, and therefore a greater number of cars are estimated in the territory, meaning that the data also depend on this (Figure 3 and Figure 4).
4.1.3. RES H&C
As highlighted above, heating and cooling from renewable energy sources is supported by an incentive scheme at the level of the individual Länder. However, in summary, the most substantial form of support for heating and cooling RES on a small scale is provided by the environmental assistance program in Austria (betriebliche Umweltförderung im Inland—UFI), supported by the Austrian Federal Ministry for Sustainability and Tourism. The UFI is envisaged beyond individual subsidies from federal states that can be added to or replaced by it, and it envisages a series of specific projects [39].
For example, there is a form of FIT subsidy for the disposal of wastewater, which can be accessed by all natural and legal persons who establish a connection to a public sewer network of over 100 m for their needs. Specifically, only the first installation of sewer connection lines (including associated system components such as pumping stations) and the renewal of sewer connection lines older than 40 years are financed provided that they fall within the length parameters of the 100 m.
In addition to the structure, construction planning and supervision are also recognized as eligible costs.
Furthermore, support for the purchase of energy-efficient refrigerators and freezers for all companies and business organizations is expected, valid until January 2017. Moreover, also by way of example, a contract project for the construction of photovoltaic systems was provided by the Land of Vienna, and also in the UFI.
Finally, it is interesting to note that in Austria, an installer training program is foreseen, the costs of which are partly borne by the installers themselves and partly by the individual Länder.
4.2. Belgium
In Belgium, the energy policy responsibilities are divided between the Federal Authorities and the three regions of Flanders, Walloon and Brussels, subject to the control of the Commission for the regulation of electricity and gas (CREG) [40].
It should be noted that in 2017, Belgium spent 2.58% of its GDP on scientific and technological research. Therefore, the boundaries of competences between the regions and the federal state seem sufficiently outlined, but the energy policies of the individual regions are not uniform on the whole: Brussels has opted for a complex system of energy subsidies and investment incentives for companies; Flanders’ energy policy, on the other hand, is based on a quota system; and, finally, Wallonia has laid down obligations for new residential buildings which must be built according to a series of principles of eco-sustainability.
To support the development of renewable energy, several policies have been adopted in Belgium; thus, using the year 2005 as a starting point, in Figure 10, the percentage growth in the consumption of energy from renewable sources in this country is depicted. There is an increasing monotonous trend from 2011 to 2018, with an average value of 1.75% and a minimum growth rate of 1.0% in 2013–2014. The last red column of the figure indicates the percentage to be reached in 2020 according to Dir. 2009/28/CE, which, for Belgium, is 13%, meaning that the actual gap is 3.8%.
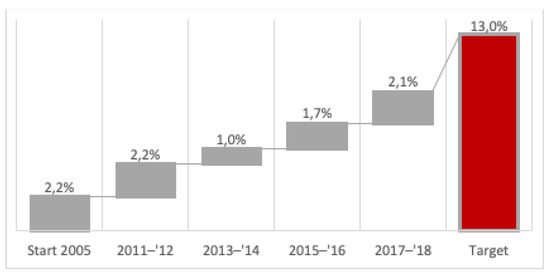
Figure 10.
Belgium—energy consumption trend. Source: https://ec.europa.eu/eurostat/web/energy/data/shares, accessed on 28 June 2021.
As above, the RES-E, RES-T and RES-H&C analysis follows in the next subsections.
4.2.1. RES-E
In Belgium, therefore, there is no single energy policy. In particular, Brussels-Capital has its own Air, Climate and Energy (PACE) plan, introduced with the order of 2 May 2013 on the Brussels Air, Climate and Energy Code. It essentially envisages the introduction of a fund for the energy renovation of existing public buildings.
In Flanders, on the other hand, the innovation platform for the environment and energy technologies (MIP) has been operating since 2005, bringing together companies, researchers and policy makers. MIP offers two types of funding programs: interdisciplinary cooperative research for, for example, the recovery of building materials, and feasibility studies such as for the reuse of energy, materials and water.
Finally, in the Walloon region, the federal system of green certificates is accompanied by considerable financial support for companies, as well as universities and research institutes willing to develop RES research and development projects.
Here, too, as in Austria, an energy policy differentiated by territory seems to be efficient, and the production and consumption of renewable electricity have significantly increased from 2011 to 2018.
4.2.2. RES-T
Transportation is one of the few federal exclusive matters; therefore, there are no differentiated regional RES-T support schemes. The federal government has essentially provided for a biofuel support policy which, on the one hand, requires companies to meet a defined volume of sustainable biofuels within one calendar year and, on the other, is an exemption mechanism (Exemption d’accise pour l’huile de colza). There has thus been an increase in the consumption of biofuels in Belgium.
4.2.3. RES H&C
Finally, heating and cooling are a matter of regional competence, even if, as for RES-E, a connection system is also provided here: in fact, at the federal level, there are indirect tax subsidies for research and development and a tax deduction on investment costs for companies in order to promote the use of heat production from renewable energy sources.
This is essential above all for the Brussels-Capital region, where there are no research and development programs or construction obligations for eco-sustainable buildings. This is unlike both Flanders and the Walloon region, where energy subsidy systems and a quota system are provided.
4.3. France
The structure of the total primary energy supply (TPES) is still characterized by a high percentage of nuclear energy, where in 2014, it was still 44%, compared to 40% in 2004 [41], and in 2018, Eurostat still identified France as Europe’s main producer of nuclear energy (Figure 11).
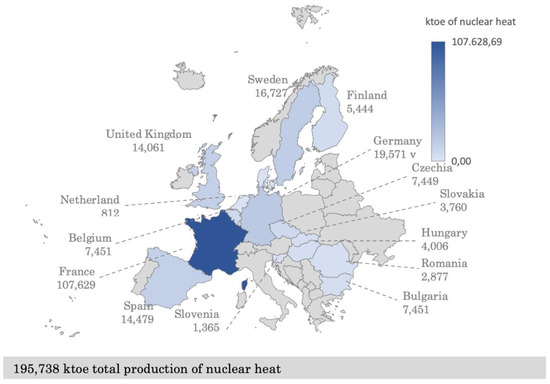
Figure 11.
Nuclear energy in the EU—data for 2018. Source: Eurostat.
In France, nuclear energy is considered a source of clean energy with a low environmental impact [42] and has allowed France great energy independence. However, a number of reasons [41] led the French government to plan the decommissioning of nuclear power plants: in spring 2020, for example, the first of the two reactors at the Fessenheim nuclear power plant was shut down, and the ultimate goal is to shut down 14 nuclear reactors. According to the “programmation pluriannuelle de l’énergie” (PPE), the “weight” of nuclear power will have to drop to 50% of the electrical mix in 2035.
The PPE represents a decisive step for France because it sets the objectives for energy and climate for the next ten years and thus directs the country towards “coal neutrality” in 2050.
The target should be achieved through, for example, increasing the consumption of thermal energy from renewable sources by 40–60% compared to 2016 levels, from 218–247 to 155 TWh, and, at the same time, reducing emissions by 30% of greenhouse gases due to the combustion of fossil sources compared to the values recorded in 2016 (from 227 Mt of CO2 to 322 Mt).
In Figure 12, the percentage growth in the consumption of energy from renewable sources in this country is depicted. There is an increasing monotonous trend from 2011 to 2018, with an average value of 2.08% and a minimum growth rate of 1.3% in 2013–2014. The last red column of the figure indicates the percentage to be reached in 2020 according to Dir. 2009/28/CE, which, for France, is 23%, meaning that the actual gap is 4.4%.
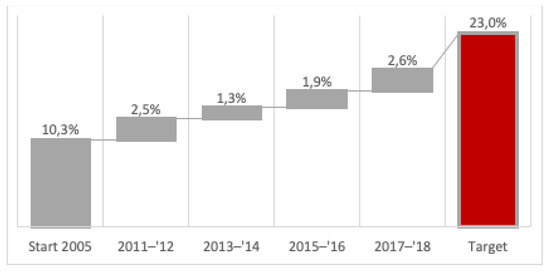
Figure 12.
France—energy consumption trend. Source: https://ec.europa.eu/eurostat/web/energy/data/shares, accessed on 28 June 2021.
As above, the RES-E, RES-T and RES-H&C analysis follows in the next subsections.
4.3.1. RES-E
In France, electricity produced from renewable sources is promoted through an FIT (Tarif d’achat) and FIP that can be awarded through tenders, in addition to the provision of certain tax breaks. Therefore, in the study addressed, France plays a central role in that it envisages an energy policy that brings together the main financing systems present in Europe. However, the current support framework, although it has returned good results, is destined to change: from 2015 onwards, in fact, the injection tariffs have been progressively replaced by a fiscal regulation mechanism, i.e., the Crédit d’impôt pour la transition énergétique (CITE)—tax credit for the energy transition.
The CITE has allowed citizens to deduct part of the expenses incurred for work to improve the energy efficiency of their homes from income tax.
In 2020, in application of Article 15 of the 2020 Finance Act, however, the CITE also underwent changes, gradually transforming itself into a more targeted bonus for energy services and low-income families. From 1 January 2021, therefore, the CITE will be definitively eliminated and the new bonus (MaPrimeRenov) will be extended to all families.
In addition to this form of incentive, the Complément de rémunération par guichet ouvert is also provided, under which renewable energy producers can benefit from an FIP tariff in addition to the sale price they obtain on the electricity market, in order to cover the costs of their structures and guarantee their profitability and a reduced VAT rate for those who install photovoltaic systems on public and private buildings.
4.3.2. RES-T
In the framework of the renewable energy development objectives, the Arrêté du 24 avril 2016 relatif aux objectifs de développement des énergies renouvelables, recently modified in April 2020, foresees the following objectives for the development of the injected biogas and for the development of fuel of renewable origin, including bioGNV [43]:
For the injection of biomethane into the gas network, in terms of total production: 1.7 TWh in 2018; 8 TWh in 2023.
For bioGNV: support the development of bioGNV to reach 0.7 TWh consumed in 2018 and 2 TWh in 2023, with the prospect that bioGNV represents 20% of NGV consumption in 2023, in segments complementary to those of vehicles, electric vehicles and plug-in hybrids.
For the integration of advanced biofuels into fuels, the targets for 2018 are 1.6% for the oil industry and 1% in the diesel sector, and for 2023, 3.4% for the oil industry and 2.3% in the diesel sector.
To achieve these objectives, a quota system and a tax on polluting activities called Taxe Générale sur les Activités Polluantes (TAGP) have been envisaged.
RES-T growth in France has been exponential.
4.3.3. RES H&C
The French government has introduced a national program to support low-income families in the thermal renovation of their buildings to reduce energy losses called abiter mieux (RES LEGAL). In addition, there is a fund for heat (Fonds Chaleur), which supports the production of renewable heat through the publication of annual tenders for large biomass plants.
Le Fonds Chaleur, ou Fonds Chaleur Renouvelable, is managed by the Agence de la transition écologique and was created by the French state as part of the Grenelle de l’Environnement, which collects the official documents produced in a series of political meetings organized in France in September and December 2007, to make long-term decisions on environment and sustainable development. The thermal background helps the production of heat from all known renewable energies and is intended for collective housing and businesses in every sector from agriculture to manufacturing. It finances projects guaranteeing a lower price than the heat produced by non-renewable energies while supporting the creation or extension of RES heating networks.
4.4. Germany
The German policy for a great increase in its dependence on renewable sources is known as the 2010 Energiewende (literally “energy revolution”) [44]. It is based on the Energiekonzept policy (concept of energy), as well as on the law on renewable energy sources (Erneuerbare Energien Gesetz) of 2000.
The purpose of the Energiewende is to minimize, until elimination, the use of energy from nuclear power, replacing it with the use of eco-sustainable energy sources; in this way, the nation should achieve decarbonization by 2022 and considerably reduce its CO2 emissions.
To achieve these objectives, the government has provided for a series of FIT and FIP incentives that practically cover all energy sectors. However, the plan to envisage the allocation of considerable sources would seem to be well viewed by the German population and academics [45,46].
In addition to the Energiewende energy plan, there is the Germany Renewable Energy Act, a very complex regulation that has been subject to numerous modifications, the last of which is from 2017. The aim, in line with what was also asserted by the previous authors, would seem to abound the form of FIT incentive, in favor of public auctions organized and monitored by the Federal Network Agency—Bundesnetzagentur [47].
To support the development of renewable energy, several policies have been adopted in Germany; thus, using the year 2005 as a starting point, in Figure 13, the percentage growth in the consumption of energy from renewable sources in this country is depicted. There is an increasing monotonous trend from 2011 to 2018, with an average value of 1.98% and a minimum growth rate of 1.3% in 2013–2014. The last red column of the figure indicates the percentage to be reached in 2020 according to Dir. 2009/28/CE, which, for Germany, is 18.0%, meaning that the actual gap is 4.3%.
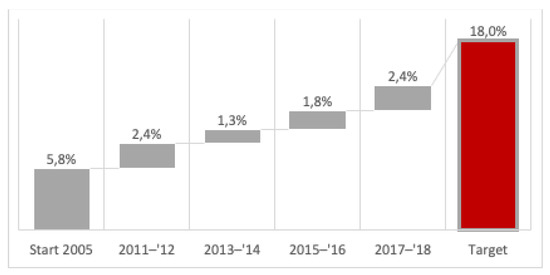
Figure 13.
Germany—energy consumption trend. Source: https://ec.europa.eu/eurostat/web/energy/data/shares, accessed on 28 June 2021.
As above, the RES-E, RES-T and RES-H&C analysis follows in the next subsections.
4.4.1. RES-E
In Germany, for renewable electricity as well as FIT and FIP systems, a series of advantageous and low-interest loans are provided by the bank Kreditanstalt für Wiederaufbau (“Credit Institute for Reconstruction”—KfW) for the development of offshore wind energy and for photovoltaic systems. With regard to photovoltaics, KfW offers loans for photovoltaic investments for private Erneuerbare Energien Standard companies, but also public ones, in order to reduce the costs necessary for the photovoltaic market to become competitive internationally. As highlighted by Thilo Grau et al. [48], however, the competitiveness of photovoltaics also depends on other factors such as the cost of alternative fuels, carbon prices and the level of solar radiation. However, the growth of photovoltaic plants in Germany has significantly increased, as have offshore wind energy plants. All in all, it would seem that the German bank’s lending policy has led to appreciable results.
4.4.2. RES-T
In the recommendations for 2020, the IEA reminds Germany of “Adopt a more comprehensive approach to promoting reduced energy demand in transportation, including stronger incentives for cost-effective consumer adoption of alternative transport technologies and promotion of public and multi-modal transport” [49]. This is also confirmed by RES LEGAL for which, in Germany, there are no adequate incentives to promote the use of renewable energy in the transport sector.
In fact, and this is published by RES LEGAL, Germany has the same energy policy as the other sample states, that is, a quota system for biofuel and a series of subsidies including a form of KfW loan.
This is also confirmed by the data published by Eurostat: in fact, not only did Germany start from a higher level than the other states, but it also achieved growth in the RES-T sector.
4.4.3. RES H&C
In the MAP framework, KfW also offers advantageous loans in the energy sector under analysis to private individuals, freelancers, small and medium-sized enterprises, local authorities and non-profit organizations. This encourages, for example: the construction of biogas plants for the purification of the quality of natural gas, fuel or CHP; plants with automatic feeding for the combustion of solid biomass (firewood, wood chips, pellets, etc.); geothermal systems supported for the production of heat and for the combined production of heat and energy; hydrothermal energy systems with efficient heat pumps up to 100 kW.
4.5. Luxembourg
According to IEA, the strong economic and demographic growth of Luxembourg is unique among the member countries of the IEA which highlights how, in the grand duchy, “energy demand and GHG emissions show signs of decoupling from GDP and the country doubled the share of renewables in the last decade”.
The renewable energy legislation has recently been changed: from the first law in 1999 that had established the first fund for environmental protection, in 2017, the Loi du 15 décembre 2017 entered into force which establishes a new support system for environmental protection and efficient use of energy.
To support the development of renewable energy, several policies have been adopted in Luxemburg; thus, using the year 2005 as a starting point, in Figure 14, the percentage growth in the consumption of energy from renewable sources in this country is depicted. There is an increasing monotonous trend from 2011 to 2018, with an average value of 1.65% and a minimum growth rate of 1.0% in 2013–2014. The last red column of the figure indicates the percentage to be reached in 2020 according to Dir. 2009/28/CE, which, for Luxemburg, is 11.0%, meaning that the actual gap is 3.5%.
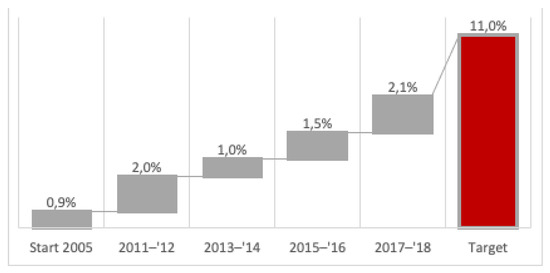
Figure 14.
Luxemburg—energy consumption trend. Source: https://ec.europa.eu/eurostat/web/energy/data/shares, accessed on 28 June 2021.
As above, the RES-E, RES-T and RES-H&C analysis follows in the next subsections.
4.5.1. RES-E and RES-H&C
Additionally, in Luxembourg, renewable electricity and heating and cooling are incentivized through FIT and FIP (Prime de marché) systems supported by various forms of subsidy, many of which have been introduced quite recently. The Prime House grant, for example, was foreseen under the 2017 “Climate and sustainable housing package” and is intended for natural persons, legal entities governed by private law and legal entities governed by public law, other than the state, for the realization of investments and related services. It is valid until 31 December 2024 and provides subsidies for the construction of the first house or for its renovation so that it meets the sustainability requirements established by the grand-ducal du 23 décembre 2016 règlement.
Industrial companies that invest in the production of renewable electricity can also benefit from investment grants thanks to the “Régime d’aide à la protection de l’environnement et à l’utilisation rationnelle des ressources naturelles, under the Loi of 18 février 2010”.
4.5.2. RES-T
As in other states, a quota system is also provided in Luxembourg, even if it is not supported by any other type of energy policy. The law of 18 December 2009, in particular, requires oil companies that release petrol and diesel for consumption to satisfy a defined quota of biofuels per year and suppliers to guarantee a certain quantity of biofuel for their annual sale. This amount varies from year to year; to date, suppliers must ensure that biofuels make up at least 5.85% of the company’s total annual fuel sales (Loi n° 2018-1317 du 28 décembre 2018 de finances pour 2019).
4.6. Netherlands
According to Eurostat data, Dutch energy is the least sustainable of the whole European Union. In 2018, 7.4% of the energy used came from renewable sources. That is 6.6% less than the 14% that the Netherlands is expected to reach in 2020.
Dutch data have improved slightly compared to previous years, but development is slow. Between 2015 and 2018, the share of renewable energy in the Netherlands grew by 1.7%.
Based on these data, the Dutch Environmental Assessment Agency has calculated that the Netherlands will not reach their target by 2020, although there seems to be an acceleration compared to previous years.
Meanwhile, as regards wind energy, the climate agreement sets a target of 6000 MW of wind energy by 2020, which is estimated to be achieved through wind farms.
At the end of 2018, there was 3382 MW of onshore wind energy usable in the Netherlands, and this would represent over 56% of the national target; therefore, the Netherlands should add 2618 MW. As an average wind turbine delivers around 3.5 MW, the Netherlands needs around 750 new wind turbines on the ground to achieve the target by 2020.
To support the development of renewable energy, several policies have been adopted in the Netherlands; thus, using the year 2005 as a starting point, in Figure 15, the percentage growth in the consumption of energy from renewable sources in this country is depicted. There is an increasing monotonous trend from 2011 to 2018, with an average value of 1.88% and a minimum growth rate of 1.2% in 2013–2014. The last red column of the figure indicates the percentage to be reached in 2020 according to Dir. 2009/28/CE, which, for the Netherlands, is 14.0%, meaning that the actual gap is 4.1%.
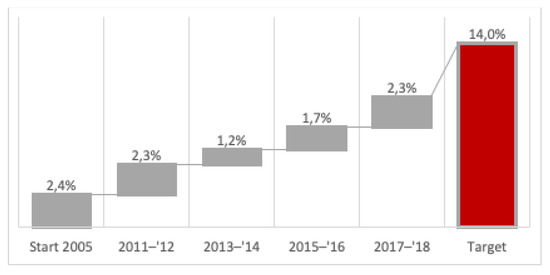
Figure 15.
The Netherlands—energy consumption trend. Source: https://ec.europa.eu/eurostat/web/energy/data/shares accessed on 28 June 2021.
As above, the RES-E, RES-T and RES-H&C analysis follows in the next subsections.
4.6.1. RES-E
In the Netherlands, the main support tool for renewable energies is Stimulering Duurzame Energieproductie—subsidy for the production of renewable electricity (SDE +). SDE + is an FIP subsidy for the production of renewable electricity, renewable heat or the combined generation of renewable heat and electricity or green gas, for the various renewable energy sources: solar, biomass, hydroelectric, wind and geothermal. In particular, it provides for a gradual admission system with increasing base rates, which favors low-cost RES options—a sort of operating subsidy with which RES energy producers can receive financial compensation for the renewable energy they generate. In other words, the price difference between the cost of renewable energy and the market price is compensated for a few years by SDE +. Compensation depends on the technology used to create renewable energy, for example, the government has recently been focusing heavily on offshore wind.
On the government website, old and new tenders for the award of this form of incentive are available. The latest falls on 17 March 2020 and provides for a budget of around EUR 4 billion.
In addition to the FIP scheme just seen, investments in renewable energy technologies are supported by other types of loans and various tax benefits, but no FIT-type grants are foreseen.
4.6.2. RES-T
Tax credits exist for RES-T investments related to biofuels and hydrogen.
In the Netherlands, investments have been made in the production and use of electric cars. Due to tax measures and an improved pricing infrastructure, the policy in the Netherlands is aimed at selling only cars that are capable of driving without emissions. From 2030 onwards, according to the 2017 coalition agreement, only zero-emission cars will be allowed to be sold. Tax credits exist for RES-T investments related to biofuels and hydrogen.
Moreover, even if the Netherlands is in the lowest positions for RES production, they are also in the highest position in the world in terms of percentage of electric cars in the total number of cars [50].
Attention to the issue is testified by what happened in the Dutch Parliament: in March 2016, the House of Representatives approved a motion for the mandatory sale of zero-emission cars by 2025. The government then considered the motion impracticable, also because it is not legally possible under European law to ban the sale in the Netherlands of cars sold elsewhere in the European Union; however, the episode could highlight the policy that is being pursued in the Netherlands regarding RES-T.
A fully electric car (FEV) was, in fact, exempt from paying the monthly tax on motor vehicles (road tax) from 2017 to 2020. In other words, each car with CO2 emissions of 0 g/km paid EUR 0 in MRB.
In order to make the management of public charging stations for electric cars profitable, a law on a temporarily reduced tariff for charging stations was adopted, following which operators pay a lower energy tax for the electricity supplied. The law was in force from 2017 to 2020.
At the municipal level, large cities, such as Amsterdam or Rotterdam, have provided an incentive scheme and subsidies for electric cars and have introduced environmental zones to keep polluting vehicles outside the city center.
4.6.3. RES H&C
In Holland, there are several densely populated areas and large greenhouse complexes, which also require a lot of heat. In Amsterdam, therefore, the Heat & Cold program was developed which should stimulate the use of soil as an energy source (heat pumps).
The Dutch government has made various forms of financing available to provide entrepreneurs and others an extra sustainable energy boost, including the following:
Participatiefonds Duurzame Economie Noord-Holland (PDENH): This fund is intended for companies and projects that provide an extra boost to sustainable energy. For example, North Holland wants to stimulate the use of energy, circular economy and sustainable mobility. The investment fund has EUR 85 million available to invest in sustainable and innovative companies and initiatives.
The Ready for Investment Innovative SME (PIM) program is an initiative of the province of North Holland with which companies are consulted on RES, providing insights on financing options and offering training courses and information meetings.
GO! -NH is a program started in 2018 that invests in innovative start-ups in the field of RES.
5. Conclusions and Policy Implications
From the data published by Eurostat, it emerges that Austria is the state with the highest RES production; however, it is not the state that has obtained the greatest growth, indeed, over the years, as energy production has shown a fluctuating trend, even if the level starting points were higher. This could depend on the fragmented nature of energy policy, since a similar trend characterized by low constancy is also found in Germany, where energy competence is also divided between central power and Länder. In the context of energy policy, therefore, the principle of subsidiarity, as the basic principle of the European Union, does not seem to fully unfold its effects. The subsidiarity principle is defined in Article 5 of the Treaty on European Union. It aims to ensure that decisions are taken as close as possible to the citizen, verifying that the action to be taken at the community level is justified with respect to the possibilities offered by the action at the national, regional or local level. However, in countries where energy policy is not fragmented, the yield in RES has been higher; for example, this happened in Luxembourg, where RES production growth has increased significantly in recent years. Therefore, surely to obtain a higher yield, it is necessary that the energy policy adopted is unified throughout the territory.
It should also be noted that in the states where more and various forms of subsidies are foreseen, growth seems to be greater. For example, in France, although the population density is higher than in Luxembourg, the production growth of RES H&C has been higher. Therefore, more clean energy is produced for a higher population density. It is believed that the main difference is due precisely to the greater number and greater variability of incentives. This is also evident compared to Belgium, which, by combining green certificates with FIT and FIP subsidy systems, could achieve greater results in terms of energy efficiency. Belgium has a position of merit, however, for the amount of incentives provided for research; it would be necessary for each state to invest in research, particularly Germany, where it could be possible to make more use of the resources of the territory, especially solar energy. Renewables in some situations have reached record levels compared to other states, but much remains to be carried out to decarbonize the country, above all avoiding job losses: investing in research could help remedy the problem and increase the use of resources from neglected energies, such as solar energy. On the other hand, the German RES-T results are excellent. In this regard, there seems to be no great variability, since almost all the sample states make use of a quota system as with Germany; indeed, Germany has been the subject of criticism from both the IEA and the RES LEGAL database, yet the results obtained are commendable [51]. This is believed to be due to the loan system by KfW. Such a loan system should be used in all states, as it appears to lead to good results. Additionally, in Holland, which seems to hold the primacy for the whole of Europe in terms of RES-T, the forms of subsidy for the purchase of electric cars not only for citizens but also for public transport lead to an increase in the use of renewable resources and a decrease in CO2 emissions.
Belgium also appears to be currently engaged in a progressive elimination of nuclear power, but the policy on this matter is not unanimous, and most scientific reports recommend extending the nuclear license in order to reduce the current pressure on supply uncertainty [52].
Having said this, it was previously reported that the member states of the European Union have published new national energy–climate plans. The European Commission has finished analyzing them, and ad hoc assessments have been carried out for each European nation (also collected and summarized by the IEA) which should be integrated into the definitive national energy plan for 2050. As of today, according to Brussels, the documents still make insufficient contributions to achieve the energy efficiency targets for 2050.
Moreover, if energy plans are not carefully designed, they can distort the functioning of the energy market and entail higher costs for European families and businesses [53].
In addition, support schemes should be flexible and respond to falling production costs. As technologies become obsolete, the patterns should gradually be removed. For example, feed-in rates should be replaced by premium feeds and other support tools that incentivize manufacturers to respond to market developments, and it has been seen that not all states have provided or are replacing incentive tools now obsolete for the needs of their national market. At the same time, the economic and financial crisis has blocked investment in new construction generation capacity. Low demand, combined with increased deployment of wind and solar energy, has also pushed down wholesale electricity prices in some member states such as Germany, Belgium or Spain, putting pressure on public service yields.
5.1. Policy Implications
Starting from the reports made by international and European institutions and from the conclusions of the researchers on the subject, it is possible to proceed with the following recommendations and implications.
The Austrian government (Figure 16) should standardize, clarify and linearize its energy efficiency legislation, invest more economic resources or allocate the subsidies according to specific time frames, provide innovation stakeholders with adequate funding certainty and medium-term strategic visibility and, finally, review the division of competences between the state and the regions. Meanwhile, the Belgian government (Figure 16) should identify a more realistic target for 2030, possibly differentiated for the various types of RES, increase the diversification of energy sources, decrease supplies from third countries, make RES legislation more certain and predictable to attract critical investments in the energy sector and, finally, implement subsidies for renewables.
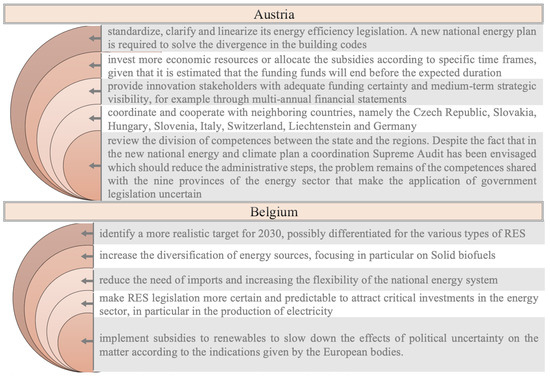
Figure 16.
Austria and Belgium: final recommendations and implications.
The French government (Figure 17) should take a greater account of the consequences deriving from the elimination of nuclear power, reduce delivery times related to onshore and offshore wind farms [54] and work further for market opening, competition and consumer empowerment in the retail gas and electricity markets. Additionally, the government should provide adequate resources to regulators and consumers, consider phasing out regulated tariffs for residential users and eliminate regulated electricity tariffs [55] and reticence towards investments [55].
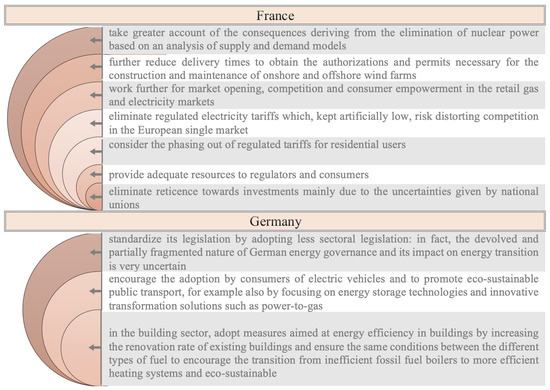
Figure 17.
France and Germany: final recommendations and implications.
The German government (Figure 17) should standardize its legislation by adopting less sectoral legislation [56], encourage the adoption by consumers of electric vehicles to promote eco-sustainable public transport [57] and adopt measures aimed at energy efficiency in buildings [58].
The Luxembourg government (Figure 18) should gradually introduce carbon pricing tools, reduce duties and barriers to entry for RES suppliers and take political measures in favor of electric mobility [59,60].
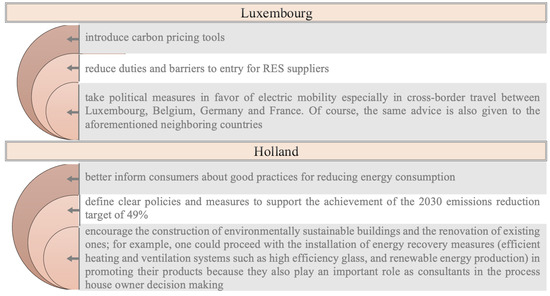
Figure 18.
Luxembourg and Holland: final recommendations and implications.
Finally, the Dutch government (Figure 18) should define clear policies and measures to support the achievement of the 2030 emissions reduction target of 49%, encourage the construction of environmentally sustainable buildings and the renovation of existing ones [61] and better inform consumers about good practices for reducing energy consumption [62].
5.2. Final Remark
In this study, the actions implemented by some states to support the development of renewable policies were analyzed. Attention was focused on Western European countries, believing that the heterogeneity of these territories, relating to more than one aspect, constitutes, in this context, an interesting element of comparison. The analysis of policies and actions to support renewable energies was focused on the shares of RES-E, RES-T and RES-H&C. It should be noted that there is a variety of initiatives on the topic of renewable energy support that are often highly fragmented; therefore, this work has been useful for defining a comprehensive critical framework.
Of the states studied, Luxembourg’s energy policy appears to be the most successful. It started from a lower level than the other sample states, yet its renewable growth was greater. An obvious difference, compared to the policies of the other countries taken into consideration, would seem to be the use of more forms of incentives that combine FIT and FIP systems, such as the Prime House.
In general, it should be underlined that one of the major obstacles to the diffusion of renewable energies is represented by the difficulty of access and by the degree of awareness of the advantages inherent in the diffusion of these energies. Governments therefore need to improve these aspects in the future. Furthermore, the analyses carried out have shown that it is necessary that the energy policy is uniform in the territory. That is, the sectorial aspect should be avoided since it entails divergences in economic terms and in the exploitation of resources between the various regions or Länder and between north and south.
On the subject of RES-T, it would be necessary to favor investments in electric cars such as those seen in Holland or Germany.
Finally, in this regard, governments should also take into account that, to promote the energy transition after 2030, the renewables that will play a key role are still biomass, wind power and solar photovoltaics [63,64], with solar photovoltaics representing RES solar energy with a faster growth rate [65]. Meanwhile, the transition towards the use of alternative fuels for transport will focus the attention on biofuels, electricity, natural gas, liquefied petroleum gas and hydrogen [64,66]. Based on the above considerations, in the future, this study will continue to study the benefits of the main renewable sources. To this end, the three well-known aspects of the concept of sustainability will be analyzed, i.e., economic, social and environmental, according to a multi-criteria optimization criterion.
Author Contributions
F.C.: Conceptualization, Supervision, Writing—review & editing; A.C.: Data curation, Investigation, Writing—original draft; M.R.: Conceptualization, Supervision, Writing—review & editing; V.A.: Data curation. All authors have read and agreed to the published version of the manuscript.
Funding
This research received no external funding.
Institutional Review Board Statement
Not applicable.
Informed Consent Statement
Not applicable.
Data Availability Statement
Not applicable.
Conflicts of Interest
The authors declare no conflict of interest.
Nomenclature
| BMDW | Ministry of Digital and Economic Affairs |
| CITE | Crédit d’impôt pour la transition énergétique—Tax credit for the energy transition |
| CREG | Commission for the regulation of electricity and gas |
| FIP | Feed-in prize |
| FIT | Feed-in tariff |
| GC | Green certificates |
| GFCoE | Gross final consumption of energy |
| GSC | Groene stroom certificaten |
| ktoe | Thousand tons of oil equivalent |
| MIP | Environmental and Energy Technology Innovation Platform |
| OEMAG | Clearing Agency for Green Electricity |
| ÖSG | Ökostromgesetz—Green electricity law |
| PPE | Programmation pluriannuelle de l’énergie—Multi-year energy programming |
| RES | Renewable energies |
| RES H&C | Renewable heating and cooling |
| RES-E | Renewable electricity |
| RES-T | Renewable transport |
| SDE + | Stimulering Duurzame Energieproductie—Subsidy for the production of renewable electricity |
| TND | Tender contract |
| TPES | Total primary energy supply |
| UFI | Betriebliche Umweltförderung im Inland—An environmental assistance program |
References
- Mikova, N.; Eichhammer, W.; Pfluger, B. Low-carbon energy scenarios 2050 in north-west European countries: Towards a more harmonised approach to achieve the EU targets. Energy Policy 2019, 130, 448–460. [Google Scholar] [CrossRef]
- Turner, R.K.; Pearce, D.W.; Bateman, I. Environmental Economics: An Elementary Introduction; Johns Hopkins University Press: Baltimore, MD, USA, 1993. [Google Scholar]
- Pérez-Díaz, J.I.; Jiménez, J. Contribution of a pumped-storage hydropower plant to reduce the scheduling costs of an isolated power system with high wind power penetration. Energy 2016, 109, 92–104. [Google Scholar] [CrossRef] [Green Version]
- Jurasz, J.; Dąbek, P.B.; Kaźmierczak, B.; Kies, A.; Wdowikowski, M. Large scale complementary solar and wind energy sources coupled with pumped-storage hydroelectricity for Lower Silesia (Poland). Energy 2018, 161, 183–192. [Google Scholar] [CrossRef]
- Schmidt, J.; Cancella, R.; Pereira, A.O., Jr. The role of wind power and solar PV in reducing risks in the Brazilian hydro-thermal power system. Energy 2016, 115, 1748–1757. [Google Scholar] [CrossRef]
- Park, E. Potentiality of renewable resources: Economic feasibility perspectives in South Korea. Renew. Sustain. Energy Rev. 2017, 79, 61–70. [Google Scholar] [CrossRef]
- Cucchiella, F.; D’Adamo, I.; Gastaldi, M. Modeling optimal investments with portfolio analysis in electricity markets. Energy Educ. Sci. Technol. Part A Energy Sci. Res. 2012, 30, 673–692. [Google Scholar]
- Hashemizadeh, A.; Ju, Y.; Bamakan, S.M.H.; Le, H.P. Renewable energy investment risk assessment in belt and road initiative countries under uncertainty conditions. Energy 2021, 214, 118923. [Google Scholar] [CrossRef]
- Ramos, V.; Giannini, G.; Calheiros-Cabral, T.; Rosa-Santos, P.; Taveira-Pinto, F. Legal framework of marine renewable energy: A review for the Atlantic region of Europe. Renew. Sustain. Energy Rev. 2021, 137, 110608. [Google Scholar] [CrossRef]
- Wang, Z.; Carriveau, R.; Ting, D.; Xiong, W.; Wang, Z. A review of marine renewable energy storage. Int. J. Energy Res. 2018, 43, 6108–6150. [Google Scholar] [CrossRef]
- Chang, Y.-C.; Wang, N. Legal system for the development of marine renewable energy in China. Renew. Sustain. Energy Rev. 2017, 75, 192–196. [Google Scholar] [CrossRef]
- Adams, S.; Klobodu, E.K.M.; Apio, A. Renewable and non-renewable energy, regime type and economic growth. Renew. Energy 2018, 125, 755–767. [Google Scholar] [CrossRef]
- Gisler, T.; Capezzali, M.; Guittet, M.; Burkhard, R.; Favrat, D. Evaluation and recommendation of a subsidy instrument for new large hydropower plants, use case of Switzerland. Sustain. Energy Technol. Assess. 2018, 26, 6–16. [Google Scholar] [CrossRef] [Green Version]
- Di Dio, V.; Favuzza, S.; La Cascia, D.; Massaro, F.; Zizzo, G. Critical assessment of support for the evolution of photovoltaics and feed-in tariff(s) in Italy. Sustain. Energy Technol. Assess. 2015, 9, 95–104. [Google Scholar] [CrossRef]
- Mackenbach, J.P.; E Kunst, A.; Cavelaars, A.E.; Groenhof, F.; Geurts, J.J. Socioeconomic inequalities in morbidity and mortality in western Europe. Lancet 1997, 349, 1655–1659. [Google Scholar] [CrossRef] [Green Version]
- Crouch, C. Social Change in Western Europe; Oxford University Press: Oxford, UK, 1999. [Google Scholar]
- Bernholz, P. A financial history of Western Europe: A review. Rev. World Econ. 1985, 121, 779–785. [Google Scholar] [CrossRef]
- Rucht, D.; Kriesi, H.; Koopmans, R.; Duyvendak, J.W.; Giugni, M.G. New Social Movements in Western Europe: A Comparative Analysis. Contemp. Sociol. A J. Rev. 1997, 26, 335. [Google Scholar] [CrossRef]
- Jeremy, R. Policy Styles in Western Europe (Routledge Revivals); Routledge, Taylor & Francis Group: London, UK, 1982. [Google Scholar]
- Lynch, M.Á.; Tol, R.S.; O’Malley, M.J. Optimal interconnection and renewable targets for north-west Europe. Energy Policy 2012, 51, 605–617. [Google Scholar] [CrossRef] [Green Version]
- Brouwer, A.S.; Broek, M.V.D.; Zappa, W.; Turkenburg, W.C.; Faaij, A. Least-cost options for integrating intermittent renewables in low-carbon power systems. Appl. Energy 2016, 161, 48–74. [Google Scholar] [CrossRef] [Green Version]
- Deane, J.; Driscoll, A.; Gallachóir, B.Ó. Quantifying the impacts of national renewable electricity ambitions using a North–West European electricity market model. Renew. Energy 2015, 80, 604–609. [Google Scholar] [CrossRef]
- Seebregts, A.; Groenenberg, H. How may CCS technology affect the electricity market in North-Western Europe? Energy Procedia 2009, 1, 4181–4191. [Google Scholar] [CrossRef] [Green Version]
- Graabak, I.; Korpås, M.; Jaehnert, S.; Belsnes, M. Balancing future variable wind and solar power production in Central-West Europe with Norwegian hydropower. Energy 2019, 168, 870–882. [Google Scholar] [CrossRef]
- Steininger, K.W.; Voraberger, H. Exploiting the Medium Term Biomass Energy Potentials in Austria: A Comparison of Costs and Macroeconomic Impact. Environ. Resour. Econ. 2003, 24, 359–377. [Google Scholar] [CrossRef]
- Dell, G.; Egger, C.; Grübl, A. Renewable energy in Austria. Renew. Energy 1996, 9, 1116–1119. [Google Scholar] [CrossRef]
- Simoes, S.; Zeyringer, M.; Mayr, D.; Huld, T.; Nijs, W.; Schmidt, J. Impact of different levels of geographical disaggregation of wind and PV electricity generation in large energy system models: A case study for Austria. Renew. Energy 2017, 105, 183–198. [Google Scholar] [CrossRef]
- Monacchi, A.; Egarter, D.; Elmenreich, W.; D’Alessandro, S.; Tonello, A.M. GREEND: An energy consumption dataset of households in Italy and Austria. In Proceedings of the 2014 IEEE International Conference on Smart Grid Communications (SmartGridComm), Venice, Italy, 3–6 November 2014; pp. 511–516. [Google Scholar]
- Broughel, A.E.; Hampl, N. Community financing of renewable energy projects in Austria and Switzerland: Profiles of potential investors. Energy Policy 2018, 123, 722–736. [Google Scholar] [CrossRef] [Green Version]
- Würzburg, K.; Labandeira, X.; Linares, P. Renewable generation and electricity prices: Taking stock and new evidence for Germany and Austria. Energy Econ. 2013, 40, S159–S171. [Google Scholar] [CrossRef] [Green Version]
- Dujardin, J.; Kahl, A.; Kruyt, B.; Bartlett, S.; Lehning, M. Interplay between photovoltaic, wind energy and storage hydropower in a fully renewable Switzerland. Energy 2017, 135, 513–525. [Google Scholar] [CrossRef]
- Hansen, K.; Mathiesen, B.V.; Skov, I.R. Full energy system transition towards 100% renewable energy in Germany in 2050. Renew. Sustain. Energy Rev. 2019, 102, 1–13. [Google Scholar] [CrossRef]
- Sühlsen, K.; Hisschemöller, M. Lobbying the ‘Energiewende’. Assessing the effectiveness of strategies to promote the renewable energy business in Germany. Energy Policy 2014, 69, 316–325. [Google Scholar] [CrossRef]
- Koster, D.; Minette, F.; Braun, C.; O’Nagy, O. Short-term and regionalized photovoltaic power forecasting, enhanced by reference systems, on the example of Luxembourg. Renew. Energy 2019, 132, 455–470. [Google Scholar] [CrossRef]
- Limpens, G.; Jeanmart, H. Electricity storage needs for the energy transition: An EROI based analysis illustrated by the case of Belgium. Energy 2018, 152, 960–973. [Google Scholar] [CrossRef]
- Krakowski, V.; Assoumou, E.; Mazauric, V.; Maïzi, N. Feasible path toward 40–100% renewable energy shares for power supply in France by 2050: A prospective analysis. Appl. Energy 2016, 171, 501–522. [Google Scholar] [CrossRef]
- Bulavskaya, T.; Reynès, F. Job creation and economic impact of renewable energy in the Netherlands. Renew. Energy 2018, 119, 528–538. [Google Scholar] [CrossRef] [Green Version]
- Kranzl, L.; Hummel, M.; Müller, A.; Steinbach, J. Renewable heating: Perspectives and the impact of policy instruments. Energy Policy 2013, 59, 44–58. [Google Scholar] [CrossRef]
- Förderthemen und Förderprogramme. Available online: https://www.umweltfoerderung.at/alle-foerderungen.html (accessed on 28 June 2021).
- GREG, Commission for Electricity and Gas Regulation. Available online: https://www.creg.be/en (accessed on 28 June 2021).
- Andriosopoulos, K.; Silvestre, S. French energy policy: A gradual transition. Energy Policy 2017, 106, 376–381. [Google Scholar] [CrossRef]
- Poinssot, C.; Bourg, S.; Ouvrier, N.; Combernoux, N.; Rostaing, C.; Vargas-Gonzalez, M.; Bruno, J. Assessment of the environmental footprint of nuclear energy systems. Comparison between closed and open fuel cycles. Energy 2014, 69, 199–211. [Google Scholar] [CrossRef] [Green Version]
- Legifrance. Available online: https://www.legifrance.gouv.fr/ (accessed on 28 June 2021).
- Energy in Transition—Powering Tomorrow. Available online: http://www.energiewende-global.com/en/ (accessed on 28 June 2021).
- Wüstenhagen, R.; Bilharz, M. Green energy market development in Germany: Effective public policy and emerging customer demand. Energy Policy 2006, 34, 1681–1696. [Google Scholar] [CrossRef] [Green Version]
- Bechberger, M.; Reiche, D. Renewable energy policy in Germany: Pioneering and exemplary regulations. Energy Sustain. Dev. 2004, 8, 47–57. [Google Scholar] [CrossRef]
- Condemi, A.; Cucchiella, F.; Schettini, D. Circular Economy and E-Waste: An Opportunity from RFID TAGs. Appl. Sci. 2019, 9, 3422. [Google Scholar] [CrossRef] [Green Version]
- Grau, T.; Huo, M.; Neuhoff, K. Survey of photovoltaic industry and policy in Germany and China. Energy Policy 2012, 51, 20–37. [Google Scholar] [CrossRef] [Green Version]
- IEA. Germany—Countries & Regions; IEA Data Browser. 2020. Available online: https://www.iea.org/countries/germany (accessed on 15 September 2020).
- Deuten, S.; Vilchez, J.J.G.; Thiel, C. Analysis and testing of electric car incentive scenarios in the Netherlands and Norway. Technol. Forecast. Soc. Chang. 2020, 151, 119847. [Google Scholar] [CrossRef]
- IEA. Energy Policy Review; International Energy Agency: Paris, France, 2020. [Google Scholar]
- Cachorro, J.D.F.; Willeghems, G.; Buysse, J. Strategic investment decisions under the nuclear power debate in Belgium. Resour. Energy Econ. 2019, 57, 156–184. [Google Scholar] [CrossRef] [Green Version]
- Technical Guidance for Deriving Environmental Quality Standards. Common Implementation Strategy for the Water Framework Directive (2000/60/EC); Guidance Document No. 27; European Communities: Brussels, Belgium, 2011; Available online: http://ec.europa.eu (accessed on 12 March 2013).
- IEA. Energy Policies of IEA Countries; International Energy Agency: Paris, France, 2016. [Google Scholar]
- Méritet, S. French Energy Policy within the EU Framework: From Black Sheep to Model? In Toward a Common European Union Energy Policy; Palgrave Macmillan: New York, NY, USA, 2011; pp. 145–167. [Google Scholar]
- Hajdinjak, M.; Asenova, D. Energy policy Household energy use Energy infrastructure Germany. In Energy Demand Challenges in Europe; Fahy, F., Goggins, G., Jensen, C., Eds.; Palgrave Pivot: Cham, Germany, 2019. [Google Scholar]
- Chen, C.; Xue, B.; Cai, G.; Thomas, H.; Stückrad, S. Comparing the energy transitions in Germany and China: Synergies and recommendations. Energy Rep. 2019, 5, 1249–1260. [Google Scholar] [CrossRef]
- European Commission. On the Draft Integrated National Energy and Climate Plan of Germany Covering the Period 2021–2030. 2019. Available online: https://ec.europa.eu/energy/sites/default/files/documents/ec_courtesy_translation_de_necp.pdf (accessed on 28 June 2021).
- Baustert, P.; Navarrete Gutiérrez, T.; Gibon, T.; Chion, L.; Ma, T.-Y.; Mariante, G.L.; Klein, S.; Gerber, P.; Benetto, E. Coupling Activity-Based Modeling and Life Cycle Assessment—A Proof-of-Concept Study on Cross-Border Commuting in Luxembourg. Sustainability 2019, 11, 4067. [Google Scholar] [CrossRef] [Green Version]
- International Energy Agency. Luxembourg 2020—Energy Policy Review. 2020. Available online: https://www.oecd-ilibrary.org/deliver/54355dd7-en.pdf?itemId=/content/publication/54355dd7-en&mimeType=pdf (accessed on 28 June 2021).
- Broers, W.M.H.; Vasseur, V.; Kemp, R.; Abujidi, N.; Vroon, Z.A.E.P. Decided or divided? An empirical analysis of the decision-making process of Dutch homeowners for energy renovation measures. Energy Res. Soc. Sci. 2019, 58, 101284. [Google Scholar] [CrossRef]
- Backhaus, J. Turning off the Gas Tap: Sustainable Energy Policies, Practices and Prospects in the Netherlands. In Energy Demand Challenges in Europe; Fahy, F., Goggins, G., Jensen, C., Eds.; Palgrave Pivot: Cham, Germany, 2019. [Google Scholar] [CrossRef] [Green Version]
- International Renewable Energy Agency (IRENA). Renewable Energy Prospects for the European Union; International Renewable Energy Agency (IRENA), European Commission: Abu Dhabi, United Arab Emirates, 2018. [Google Scholar]
- Potrč, S.; Čuček, L.; Martin, M.; Kravanja, Z. Sustainable renewable energy supply networks optimization—The gradual transition to a renewable energy system within the European Union by 2050. Renew. Sustain. Energy Rev. 2021, 146, 111186. [Google Scholar] [CrossRef]
- Eurostat. Renewable Energy Statistics. Available online: https://ec.europa.eu/eurostat/web/energy/data/shares (accessed on 28 June 2021).
- Navas-Anguita, Z.; García-Gusano, D.; Iribarren, D. A review of techno-economic data for road transportation fuels. Renew. Sustain. Energy Rev. 2019, 112, 11–26. [Google Scholar] [CrossRef]
Publisher’s Note: MDPI stays neutral with regard to jurisdictional claims in published maps and institutional affiliations. |
© 2021 by the authors. Licensee MDPI, Basel, Switzerland. This article is an open access article distributed under the terms and conditions of the Creative Commons Attribution (CC BY) license (https://creativecommons.org/licenses/by/4.0/).