Article

Non-Linear Inductors Characterization in Real Operating Conditions for Power Density Optimization in SMPS

1
Department of Engineering, University of Palermo, 90128 Palermo, Italy
2
Institute for High Performance Computing and Networking (ICAR), National Research Council (CNR), 90146 Palermo, Italy
*
Author to whom correspondence should be addressed.
Energies 2021, 14(13), 3924; https://doi.org/10.3390/en14133924
Submission received: 3 June 2021 / Revised: 21 June 2021 / Accepted: 25 June 2021 / Published: 30 June 2021
(This article belongs to the Special Issue Challenges and Opportunities in Modern Power Electronics)

Abstract

:
The exploitation of power inductors outside their linear region in switching converters can be achieved by raising the current until a decrease in the inductance can be noticed. This allows using a smaller magnetic core, increasing the power density of the converter. On the other hand, a detailed description of the magnetization curve including the temperature is required. Since this information is often not included in the inductor’s datasheets, this paper shows how to identify the behavior of an inductor when it is operated up to saturation and its temperature rises. In order to characterize the inductor in real operating conditions, a dedicated measurement rig was developed. It consists of a switching converter that encompasses the inductor under test and is controlled by a virtual instrument developed in LabVIEW. The characterization system was tested by retrieving the inductance and the magnetization curves vs. current for two commercial inductors at core temperatures up to 105 °C. The magnetic core was then characterized by the saturation current vs. inductance, obtaining an expression for the whole family of inductors sharing the same core. Finally, we experimentally analyzed the thermal transient of the inductors in operating conditions, confirming the fundamental role of the temperature in changing the current profiles and the core saturation condition.

1. Introduction

Inductors are crucial components of switch-mode power supply (SMPS) circuits, where they are employed to store and release energy according to the operation of power switches. Currently, the inductor is often the most cumbersome component in an SMPS. In the near future, the continuous increase in switching frequencies will allow the integration of magnetic components with embedded windings directly in the PCB, a practical and cost-effective solution for a wide range of applications [1]. In order to increase the power density and reduce the weight of modern SMPSs, the inductors can be operated up to the so-called “practical limit” (also defined as the “linearity limit” or “saturation”) of power inductors [2]. This operation, where the differential inductance is reduced to half of its maximum value, is gaining attention. The behavior of inductors approaching saturation has already been of interest for low-frequency applications [3,4] due to its influence on the current in the circuit where it is employed. Additionally, in higher-frequency applications concerning SMPS, the inductor can be advantageously exploited outside of the linear zone to reduce its cost and weight [2,5,6].
Among available magnetic materials for the inductor core, ferrite exhibits low losses and relatively high saturation induction; for this reason, it is suitable for power electronics applications [7]. In SMPS, the inductor is operated with a DC current offset and AC components imposed by the converter operation. Moreover, the inductor’s non-linear operation modifies the triangular-shaped waveform of its current [8], raising its peak value and leading to a situation that can affect the stability of the converter. In fact, outside the linear zone, the current peak’s growth raises the losses, increasing the temperature. In general, the rise in the temperature influences the inductance, lowering its value. This can bring about a runaway situation requiring a more detailed thermal analysis [9,10,11].
This paper focuses on the inductor’s behavior up to saturation, including the role of the temperature, considering the differential inductance reduced to half of its maximum value [2]. Recently, some papers analyzed SMPS inductors operated outside the linear zone. In [8,12,13,14,15,16], the time-domain waveforms were derived and compared to the experimental ones, with a good agreement, in different steady-state conditions using different models and approaches. Issues related to modeling the temperature effects were assessed in [5], where current profiles for different temperatures of the inductor were obtained in steady state. In [17], the thermal transient was analyzed, showing that, despite a lowering of the value of inductance due to the increase in the temperature, small power inductors operating under partial saturation are not subjected to thermal drift. A model to reproduce the thermal transient in SMPS simulations showing different current waveforms during the thermal transient was proposed in [10]; this approach adopts a behavioral model based on electrical parameters where the temperature is obtained as output. It should be noted that [17] derives the inductor temperature starting from the inductor total power dissipation and the inductor thermal resistance; even if the former can be calculated, the latter may depend on non-predictable conditions such as the circuit layout, air flow and dust due to aging. Moreover, it considers a fixed frequency control (FFC) for the converter. In this paper, we will discuss how the converter can be preserved by a variable frequency control (VFC).
All the papers mentioned above agree to adopt basic low-power DC/DC converters (buck or boost) as case studies to test their methods since results can be re-assessed for few-kilowatt output power DC/DC converters. However, we show that as the power is augmented, increased losses will contribute to lower the output voltage, requiring a feedback correction. The voltage feedback can overtake the current limit. Indeed, we aim to show the inductor operation in two different situations starting from the temperature measured on the inductor. Even if it requires an additional measurement, i.e., the inductor temperature, it allows monitoring the proper and safe operation (sustainable saturation operation) in real operating conditions. Different from the linear operation, the temperature of the inductor strongly influences the overall stresses. Additionally, the effect of the feedback is discussed.
Inductor exploitation outside its linear zone requires a detailed characterization that often goes beyond the basic information supplied in the manufacturers’ datasheets; in fact, saturation is mostly defined as the point in which the inductance is reduced by 10% only, and the value of such a current is given at the environment temperature [10]. However, the temperature is subjected to a relevant increase, especially exploiting saturation. Further, it is influenced by external factors such as the PCB layout, the proximity of the power switch heatsink and air cooling that are difficult to take into account. For this reason, we propose measuring the temperature at a suitable point of the inductor, retrieving information based on this value. A dedicated measurement system was set up for this purpose by the authors.
Measurement systems to retrieve the inductance value of inductors with a ferrite core have been proposed in [18] and recently in [19]. However, those two papers deal with inductors under low-power sinusoidal solicitations; therefore, the solutions are of limited interest for power electronics applications where inductors are simultaneously interested in a DC offset (average output current) and an AC signal (current ripple). Since the AC signal has a high-frequency content and must be amplified to a suitable level before the acquisition, an RF amplifier is often needed. Even if a lock-in amplifier can improve the noise-to-signal ratio [20], this approach generally leads to an expensive system. A measurement system addressing real operating conditions has recently been proposed in [21], where a large signal characterization is performed by using two suitable AC and DC generators to supply the inductor. An automated measurement system for core loss characterization was proposed in [22], where the attention is focused on transformers and inductors for SMPS. The heat generation and thermal model issues were discussed in [23] and [24], considering the inductor operated in the linear zone. A commercial system has been developed for testing inductors in quasi-real operating conditions exploiting a DC bias current generator and a triangular current ripple generator placed in parallel with the inductor under test [25]. In the literature, the proposed approaches try to supply the inductor under test by emulating the operating conditions. The same approach has been followed by [26], adopting an SMPS to improve the method of [27] based on a power amplifier for modeling core losses. It has to be underlined that all papers considering the temperature of the inductor, in order to characterize its behavior, do not analyze the distribution of the temperature inside the core.
Based on these considerations, this paper analyzes the results obtained with a switching converter, driven by an automated measurement system that performs the test of power inductors in real operating conditions. The feasibility of such a system was previously examined in [28], where the circuit of the SMPS was controlled by a LabVIEW virtual instrument in order to vary the load. In this paper, a new complete version of the circuit is presented including the following improvements: (a) the temperature is taken into account, which allows characterizing the inductor at constant temperature; (b) the parasitic resistance of the winding is preliminarily estimated, and the related drop voltage is considered; (c) the measurements are repeated to assess the mean value and the standard deviation of the results, giving an estimation of the error; (d) a new inductor current sensor is adopted to avoid any influence in the measurement; € the PCB layout is optimized to minimize parasitic inductances and consequent voltage ringing during commutation. The proposed system returns the core saturation curve vs. inductance to be retrieved, as well as the magnetization curve profile, showing the inductance variation with the measured temperature. As an example of application, the characterization of two commercial inductors is proposed here, including them inside the SMPS circuit, retrieving the inductance vs. current curves at different temperatures. Different from [18], the proposed approach can be generalized for power inductors; it is cheaper compared to [22], which uses a temperature chamber, and a commercial system such as [25] and can be built for laboratory purposes. The inductor thermal behavior and modeling are relevant to the DC/DC converter and EMI filter design [23,24,29,30,31]. Our contribution addresses this issue since the characterization always takes into account the temperature measured on the core. Finally, the knowledge on the inductor can be exploited in converters with different layouts since the measured temperature will represent the real operating conditions.
This paper is organized as follows. After the introduction, the main features of soft ferrites are presented in Section 2. Section 3 describes the DC/DC converter and the measurement system, while Section 4 contains a description of the virtual instrument developed to characterize the inductor and acquire the current profiles. Section 5 analyzes the error due to the method; the role of the temperature on the inductor losses is addressed in Section 6. Two inductor models considering the temperature are presented in Section 7, and, finally, experimental results showing how the current profiles are influenced by the temperature are provided in Section 8.

2. Magnetic Materials for Power Electronics

Among different magnetic materials used in power electronics, ferrites are common due to their low losses in a wide frequency range and high specific resistivity. Additionally, the magnetic properties are isotropic, the Curie temperature is around 700 °C, several fabrication techniques can be used and different shapes can be obtained. The saturation induction ranges from 0.25 to 0.45 T (lower than iron and cobalt alloys), and the initial relative permeability ranges from 1000 up to 20,000 for some new materials [7]. A higher cross-sectional area allows the use of ferrite for high-power inductors to prevent saturation, increasing the weight and the cost of the component. The bulk resistivity is always high; it permits distinguishing the behavior of MnZn (0.1–10 Ω∙m) and NiZn (104–106 Ω∙m), depending on the temperature and frequency. Such high resistivity is advantageous in keeping the core losses low, even at higher frequencies where eddy current losses are dominant: the losses are inversely proportional to the resistivity of the core material and increase approximately with the square of the frequency. Moreover, the parasitic capacitance short-circuits the crystal boundaries at high frequencies, further decreasing resistivity [
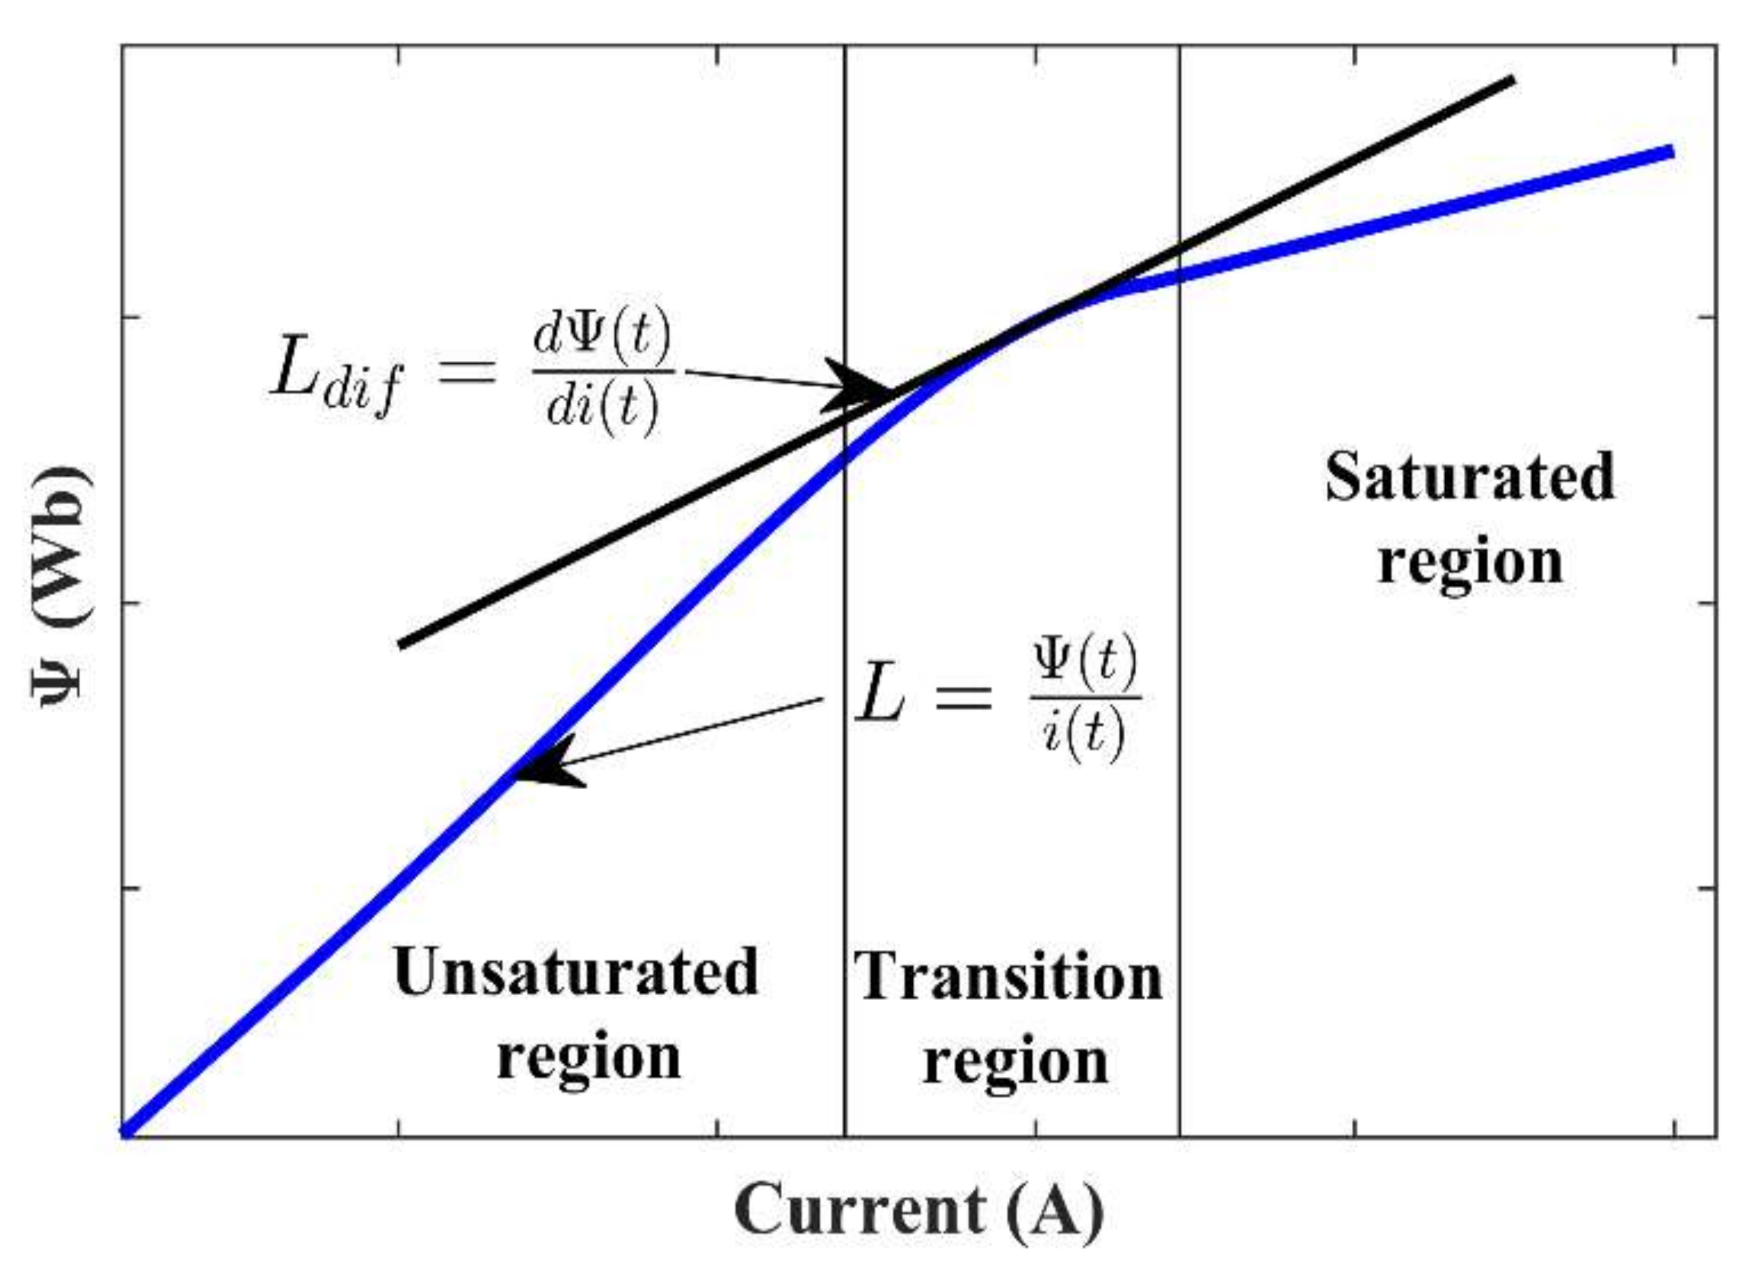
7]. It should be remarked that the ferrites mentioned above are “non-microwave ferrites”, meaning that they can be used only up to some hundreds of kilohertz. The magnetization curve of ferrites depends both on physical properties and on the manufacturing process. For this reason, the 
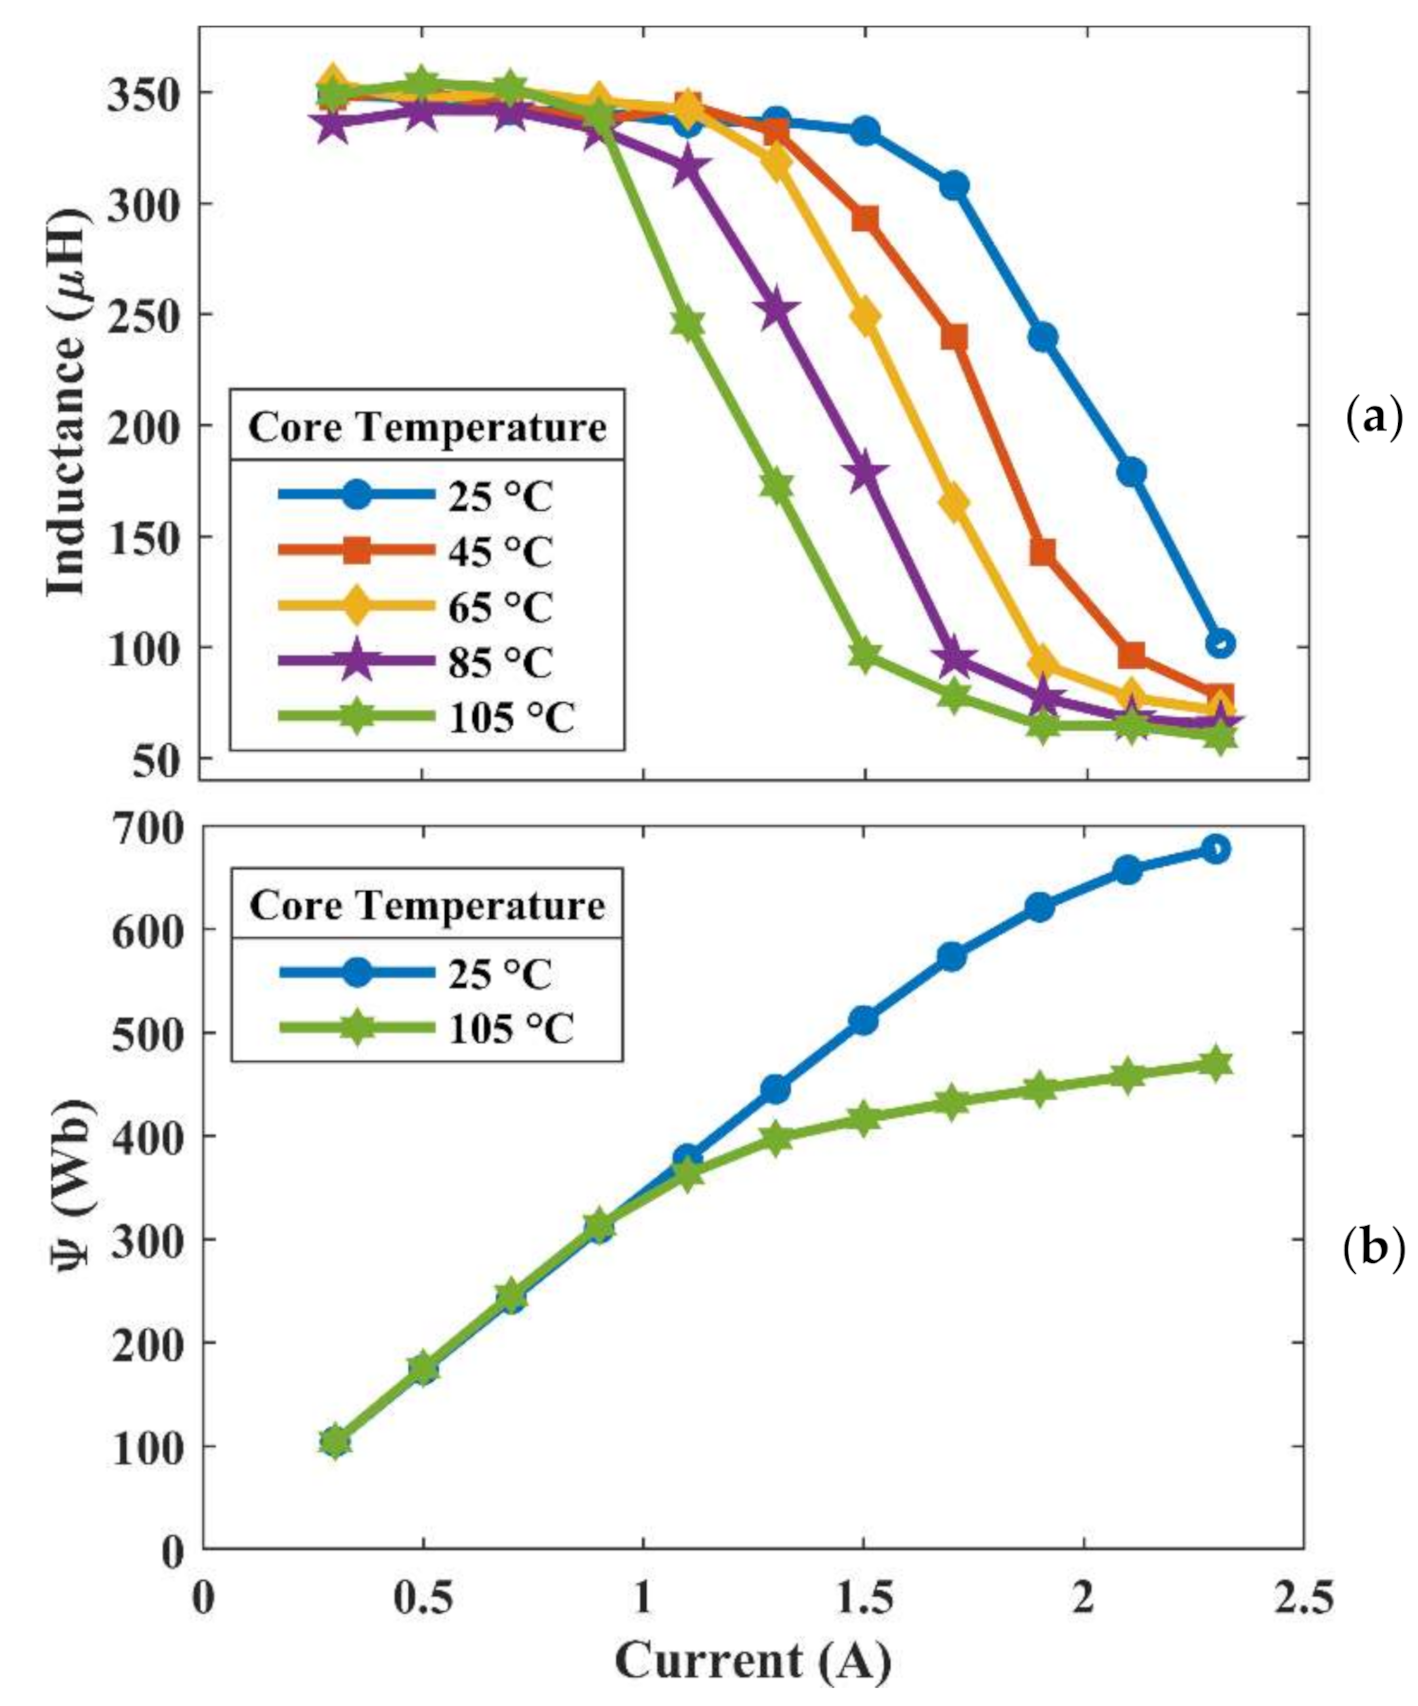
B-H loops at several frequencies and temperatures need to be measured directly on samples. For ferromagnetic materials, it is convenient to adopt the differential inductance, Ldif, defined as the incremental ratio on the plane Ψ vs. i (Figure 1), where Ψ is the total flux linkage, i is the magnetizing current, Φ is the flux linkage per turn and N is the number of turns [2].
L d i f = d Ψ d i = N d Φ d i
The practical limit in power electronics (the so-called linearity limit or saturation point) is defined as the point where the differential inductance is reduced, due to saturation, to half of its maximum value [7]. This definition sometimes differs from the value adopted by manufacturers, who consider the point at which the inductance is reduced by 10% only. It can be noted that the differential inductance coincides with the general inductance definition (L = Ψ/i) inside the unsaturated region. When the flux density exceeds saturation, due to a reduction in inductance, a higher current variation is needed to reach the same flux variation as in the linear region. The effect of heating can be appreciated by comparing the hysteresis curves taken at different temperatures. In general, heating flattens the hysteresis curve, lowering the value at which saturation occurs [32]; such a lowering, due to the higher temperature, corresponds to a decrease in permeability and, consequently, to a lower inductance value. The abrupt fall in the inductance, caused by a similar variation in the permeability, can be avoided by introducing small air gaps inside the magnetic path; this results in the “shearing” of the hysteresis loop [32]. Consequently, the permeability remains constant in a wide range, making the coil characteristics less dependent upon the initial permeability of the core. On the other hand, the lower inductance needs more turns with more consequent copper losses; thus, a trade-off is necessary [32]. The use of soft saturation ferrites is an alternative to materials with an air gap core.

3. The DC/DC Converter and the Measurement System

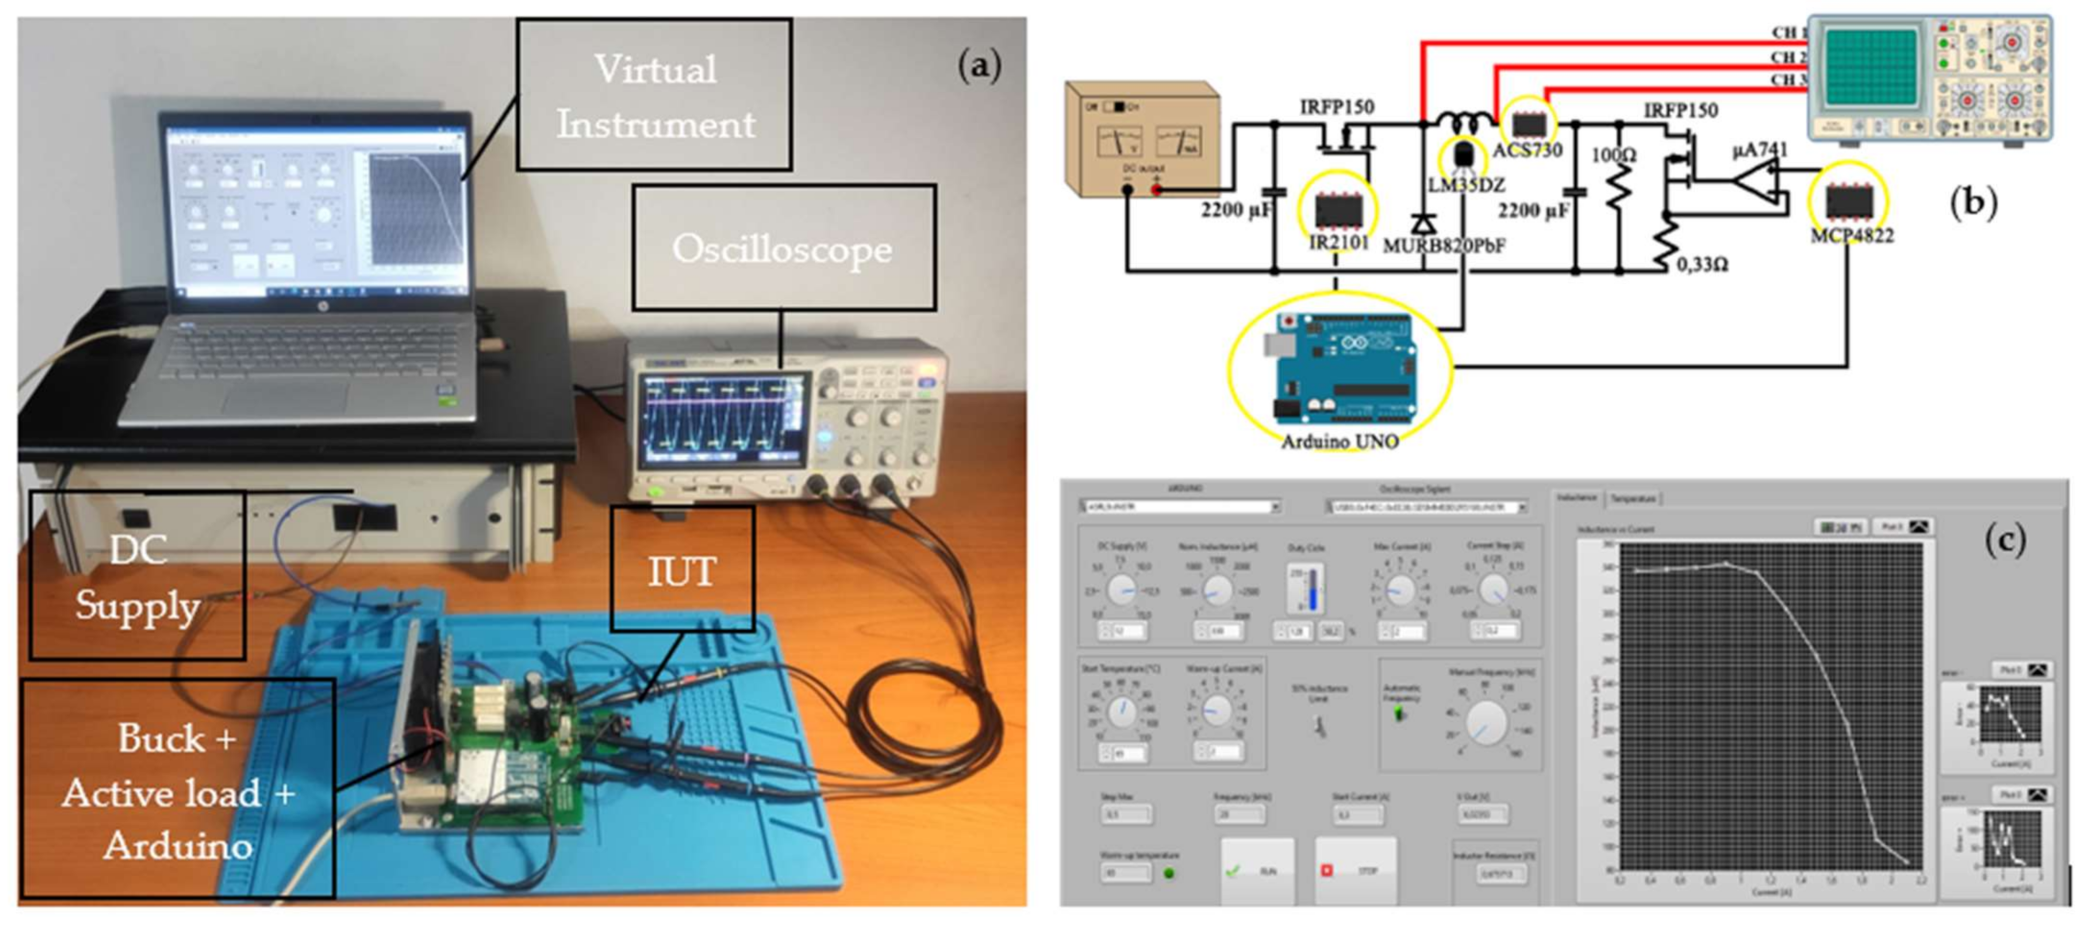
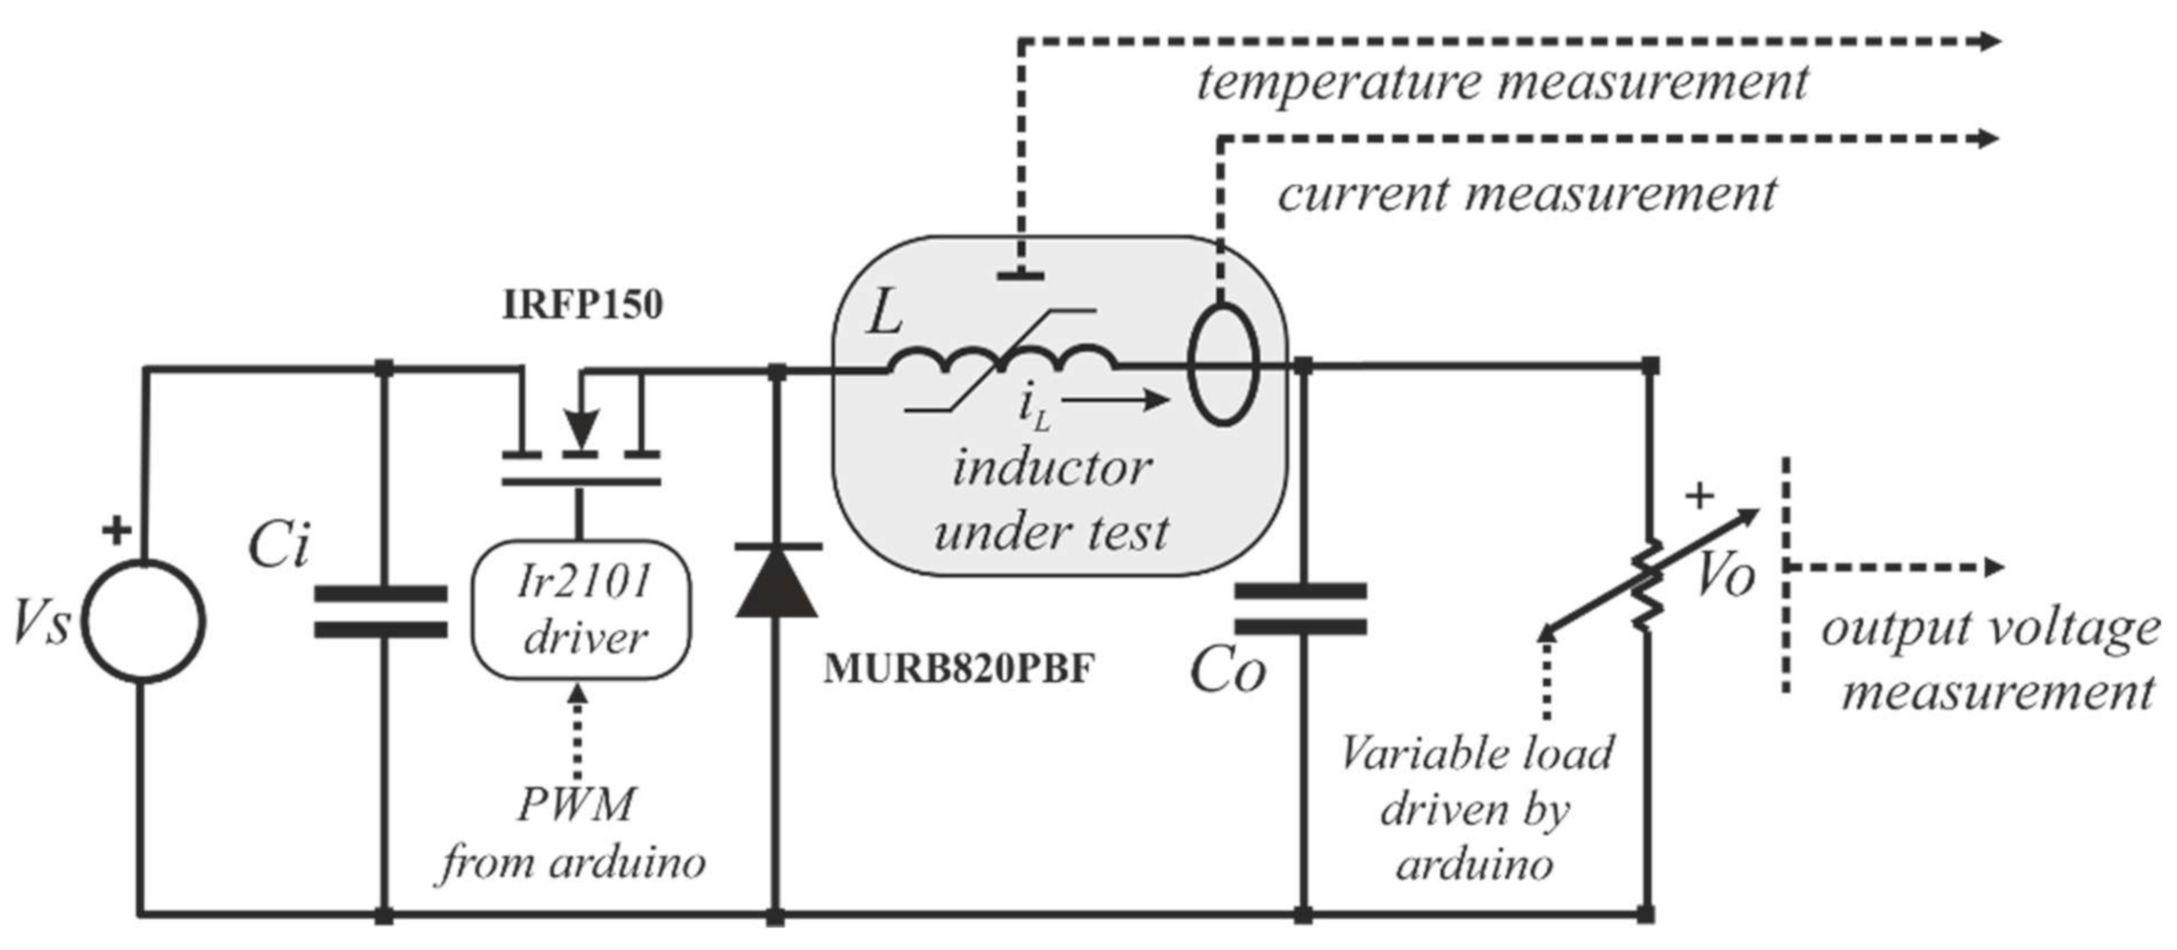
The circuit in which the inductors were tested is a buck converter working in continuous conduction mode (CCM). It was realized on a dedicated PCB. The converter switch is a power MOSFET IRFP150 with an IR2101 driver. The freewheeling diode is a MURB820PBF. The current through the inductor is measured by a Hall effect current sensor, ACS730 by Allegro.
The variable load was devised to obtain a constant current on a resistive load. A reference voltage, provided by the output of a digital-to-analog converter (DAC), MCP4822, controls an LM741 OP-AMP, which, together with an IRFP150 MOSFET and three 1Ω power resistors in parallel, connected between the source and ground, implements a current sink circuit. The MOSFET drain is connected to the buck converter’s output, thus acting as a constant current resistive load. Due to power dissipation, the MOSFET is mounted on a suitable heatsink. A schematic of the circuit is presented in Figure 2.
The Arduino Uno board, connected to a notebook via USB, varies the DAC output voltage, and the frequency and duty cycle of the PWM signal, according to the data received from LabVIEW; moreover, it acquires the temperature of the inductor by an LM35DZ sensor stuck onto the core through a thermal pad. This information is also useful to keep the inductor temperature constant during measurements. It should be noted that the temperature of the inductor on the surface of the core can be considered uniform for the geometry, size and type of the inductors under study [9].
The test rig comprised a DC linear power supply (12 V, 10 A), a digital oscilloscope, Siglent SDS 1104X-E, a personal computer and the PCB with the DC/DC converter including the inductor under test (IUT). For the measurements shown in this paper, the following parameters were set: duty cycle of the DC/DC converter fixed at 50%, switching frequency set automatically by the system to limit the current ripple of the inductor below 0.4 A (more details will be given in the next paragraphs), warm-up current equal to the saturation current that, at the lower temperature step, provides 50% of the rated inductance value. Figure 3a shows all the parts described before: the circuit PCB, the control PC, the benchtop power supply and the oscilloscope with its three probes to measure the current and the voltage across the inductor.
As already anticipated, the measurement system was based on a DC/DC buck converter, where the IUT is a part of the circuit. The variable load allows varying the DC component of the inductor current during measurements. The tests were performed on the same inductor with different DC operating points to obtain the inductance Ldif vs. the inductor current i at different temperature points. In this way, the inductor is tested in real operating conditions.
The PWM square wave, controlling the switching MOSFET of the DC/DC converter, is generated by the Arduino Uno board, with a programmable frequency and duty cycle. Changing these parameters makes it possible to vary the amplitude of the current ripple in the IUT around the DC offset. The switching frequency is automatically set by the measurement system; it can be manually increased until inductance changes are recorded. To assess the role of the switching frequency, we repeated the measurement with frequency up to 100 kHz without noting differences in the inductance curves. Indeed, the manufacturer declares in the DO5010H datasheet that the inductance is constant up to 1 MHz. Our system was not conceived to overcome such a frequency; therefore, we limited our measurements at a lower frequency.
The current signal and the input and output voltages of the DC/DC converter are acquired by the oscilloscope that sends data to the virtual instrument developed with National Instruments LabVIEW. Once the signals have been acquired, the following formula derives the differential inductance value, where i and VL are the current through the inductor and its voltage, respectively.
L d i f = V L d i / d t
The current time derivative (di/dt) is calculated during the conduction time (Ton) when the inductor is subjected to a constant voltage and the current grows like a ramp. Only about 90% of the ramp is considered for calculating the current slope, allowing a good estimation and excluding the oscillations during commutation; then, the current is sampled, and its slope is retrieved based on linear regression. The current is sampled at 500 Ms/s. The electric schematic of the buck converter is shown in Figure 3b.

4. The Virtual Instrument

The virtual instrument allows the management of the converter and the measurement system; in addition, it arranges acquired data to be presented in graphic form. The main panel is shown in Figure 3c. The instrument manages the converter parameters and acquires the measurements from the oscilloscope and the temperature sensor. Moreover, it can: (i) calculate the parasitic resistance of the inductor; (ii) plot the value of inductance L vs. the inductor current i for a given temperature; (iii) visualize the curves of inductance; and (iv) store all the measurement data on the computer memory for offline post-elaboration. Several virtual potentiometers and switches are available, through which the user can set the following parameters before starting the measurement: (a) the nominal value of inductance; (b) the maximum DC current to reach; (c) the duty cycle of the converter; (d) the voltage of the external power supply; (e) the temperature at which the measurement must be performed; (f) the current to heat the inductor when necessary. Besides that, it is possible to set the switching frequency of the DC/DC converter manually. Alternatively, it can be automatically chosen by the program according to the pre-set parameters.
After the communications with the oscilloscope and the Arduino board are initialized, the measure can start. Firstly, the parasitic resistance of the inductor is calculated; then, the temperature is brought to the set value by powering the DC/DC converter until the desired temperature is reached. Based on the geometrical characteristics of the core and on the material, its temperature can be assumed constant; for this reason, a thermochamber is not required [9]. The inductance evaluation is repeated for the increasing DC current until the maximum pre-set current is reached; for each measurement, the core temperature is checked and eventually corrected by running or stopping the converter. An example of data retrieved by the virtual instrument is proposed in Figure 3. The measurement process is schematized concisely in Algorithm 1.
Algorithm 1: Inductance measurement.
repeat
if Inductor_Temp < Set_Temp                   //Temperature check
  Converter←ON                        //Turn on the converter
  Output_Load←Warm-up_Load           //Set a current to warm-up the inductor
end if
if Inductor_Temp > Set_Temp                  //Temperature check
  Converter←OFF            //Turn off the converter to cool down the inductor
end if
if Inductor_Temp == Set_Temp                  //Temperature check
  Converter←ON                        //Turn on the converter
  Voltage Acquisition                    //Acquire voltage waveform
  Current Acquisition                     //Acquire current waveform
  Inductance Calculation                     //Compute Ldif via (2)
  Out_Load←Out_Load−Step_Load            //Reduce load and increase current
end if
until Inductor_Current<MaxCurrent       //Stop measurement at maximum current
Converter←OFF                        //Turn off the converter

5. Error Analysis

According to (2), inductance is calculated by dividing the voltage applied to the inductor (constant during Ton) by the current slope. For the inductance calculation, the measurement of the current and its time derivative is repeated several times; the mean value of the calculated inductance is assumed as the true value, whereas the standard deviation of the results returns the error. Twelve acquisitions were revealed, most of the time, as an acceptable trade-off, allowing the error to settle without overheating the inductor or excessively increasing the acquisition time. By applying the error propagation on (2) and considering the voltage VL as not being affected by any error, the following expression is obtained:
Δ L d i f = V L V L D i Δ V L + D i V L D i Δ D i = 1 D i Δ V L V L D i 2 Δ D i V L D i 2 Δ D i
where, for the sake of clarity, Di indicates the time derivative of the current in the denominator of (2). Since Ldif is proportional to VL/Di, the contribution of ΔVL to the overall error is ΔVL/Di. However, the error ΔVL can be neglected since the voltage on the inductor is imposed by the difference between the voltage source and the load voltage (in ON state) or by the load voltage only (in OFF state). As it concerns the voltage delivered by the voltage supply, a precision stabilized voltage supply was used. The error on the voltage measured across the load terminals was minimized by a low-pass filter, since this voltage is the sum of a DC quantity, and the first harmonic of the ripple corresponds to the switching frequency (the large output capacitor Co assures a ripple of 2%). It can be noted that the error ΔLdif on the value of Ldif decreases when the derivative value increases. This means that the inductance measurement improves outside the linear region, where the current slope increases.

6. Analysis of the Impact of Temperature on Inductor Losses

As concerns the behavior of the inductor in a DC/DC converter, it is operated with a DC current bias, and the flux density variations are imposed by the two levels of voltage depending on the state of the power MOSFET. The temperature can influence losses that can be classified into ohmic losses, skin effect losses and magnetic losses.
Ohmic losses depend on the inductor’s wire resistance. The wire is made of copper; hence, the wire resistance can be calculated by
R J = ρ l T S
where ρ is the electric resistivity of the copper wire, S represents the cross-section area and lT is the length of the conductor. The copper resistivity varies with the temperature according to
ρ = ρ r e f 1 + ξ T T r e f
where ξ = 0.00393 is positive, meaning that the resistance increases with temperature.
Skin effect losses are due to a skin effect for which the conductive current is closer to the surface of the conductors; it increases the resistance of the copper conductor. The effect can be calculated by a correction coefficient KT whose expression is given by [33]
K T = M T sinh 2 M T + sin 2 M T cosh 2 M T cos 2 M T + 2 M T sinh 2 M T sin 2 M T cosh 2 M T + cos 2 M T
M T = d w i r e π 2 δ n
where dwire is the copper wire diameter and δn refers to the skin depth, calculated as
δ n = ρ C u π n f s µ 0
where n is the number of layers of the winding, fs is the switching frequency and µo is the vacuum permeability.
Magnetic losses can be calculated by the revised generalized Steinmetz equation (RGSE) since, for the waveforms typical of power converters, the current exhibits a quasi-triangular shape, with a DC offset and temperature dependency. The power loss can be expressed as
P L t = V e k 1 v L t n S α B A C β α t
where Ve is the effective volume of the core, BAC is the component of the flux density as the difference between the whole flux density B(t) and its mean value BDC, n is the number of turns and α and β are the Steinmetz coefficients [9].
In power inductors, the increase in the temperature on the magnetic material flattens the hysteresis cycle, and the maximum value of the flux density is diminished [27]. For this reason, the slope of the hysteresis cycle, at a given current, is reduced, and the inductance is lowered. An increase in the temperature increases the inductor parasitic resistance, increasing Joule losses. On the other hand, magnetic losses are lowered since the increased drop voltage on the inductor’s parasitic resistance reduces the voltage applied at the inductor terminals and, consequently, the value of the magnetic induction B.

7. Results on Inductor Characterization

Two commercial inductors were tested inside the developed buck converter; for each of them, the following information was retrieved: (a) inductance vs. temperature, (b) saturation current vs. temperature, (c) magnetization curve. Then, the characterization of the core was compared with the data given by the manufacturer.

7.1. Inductor 1

Inductor 1 under test is the Coilcraft DO5010H-104 [34]. For this inductor, the datasheet shows an inductance of 100 µH ± 20%, with a saturation current, providing a 10% inductance drop, of 3.0 A. The inductance curve measured at 25 °C is shown in Figure 4a, where the red circles are the mean inductance value for each current and the error bands represent the 95% confidence interval. It can be noted that the value of inductance in the linear region lies within the tolerance interval provided by the manufacturer. The manufacturer defines the saturation current as “the DC current at which the inductance drops 10% from its value without current”. From this definition and considering a measured mean value of the nominal inductance at 25 °C of 90 μH, a value of about 3.2 A (at 81 μH) is derived from the graph. Nevertheless, measurements were performed exceeding the 50% inductance drop according to the literature [7] and coherently with the exploitation range for power applications. The corresponding current was found as 4.0 A at 25 °C. In all measurements, the error remained inside the tolerance exhibited by the manufacturer, and, as expected, it reduces for higher currents.
These measurements were repeated at temperature steps of 20 °C up to 105 °C. The corresponding curves are reported in Figure 4b. It can be noted that the saturation current decreases as the temperature increases, meaning that the higher the temperature, the greater the variations in the current with the same voltage applied. Moreover, the slope of the inductance plot in the saturation region slightly increases with the temperature. Based on the inductance curve, the magnetic flux vs. current can be retrieved by
Ψ = L d i f d i
This curve has the same shape as the magnetization curve since the flux is proportional to the induction B and the current to the magnetic field H. Hence, it can be used to verify the extension of the linear zone with the temperature. The flux curve calculations at 25 °C and 105 °C are shown in Figure 4c. These curves show that, at low temperatures, the linear zone has a broader range, while, for higher temperatures, the “knee” is reduced to about 2.3 A. This represents the boundary of the linear zone.

7.2. Inductor 2

Inductor 2 under test is the Coilcraft DO5010H-334 [34]. This inductor belongs to the same series as the previous one and shares the same core. The datasheet provides an inductance of 330 µH ± 20% and defines the saturation current based on a drop of 10% as 1.9 A at 25 °C. This value is confirmed experimentally in Figure 5a considering the plot at 25 °C, while the corresponding flux curve is shown in Figure 5b. The characterization was extended to 105 °C and to 2.2 A (current providing a drop of 50% of the rated value at 25 °C).

7.3. Core Characterization and Comparison with Data Provided by the Manufacturer

The two considered inductors exploit the same core. Based on the obtained results, the core can be characterized by the saturation current vs. inductance, provided at different temperatures. The manufacturer provides this information only at 25 °C [34]. It should be remarked that the manufacturer defines the saturation current as the “DC current at which the inductance drops 10% from its value without the current”. This differs from the definition proposed by the literature that considers a drop of 50%; for the sake of comparison, the values based on the obtained results were calculated adopting the manufacturer’s definition.
The saturation current of an inductor (Isat), as defined in [35], can be expressed as a function of the saturation flux density (Bsat), where lm is the mean magnetic path length, N is the number of turns and µsat is the permeability of the core at saturation, which is equal to the permeability of the core µ at zero current multiplied by a proportionality factor C (0.5 for the literature standard, 0.9 for the manufacturer’s standard):
I s a t = B s a t l m μ s a t N = B s a t l m C μ N
The nominal inductance Lnom is then calculated considering Ac, the area of the core section:
L n o m = μ N 2 l m A c
A new expression linking the saturation current to the nominal inductance can be obtained combining (5, 6) and through a proportionality factor K containing the geometrical and physical properties of the core:
I s a t ( L n o m ) = B s a t C l m μ A c L n o m = K L n o m
From the experimental data regarding inductor 1 at 25 °C, the proportionality factor K can be evaluated by Equation (13) multiplying both members by L n o m , resulting in a value of 30.375 × 10⁻³ [A∙H0.5]. Using this value, the saturation current as a function of the nominal inductance can be retrieved. This method is valid for all the inductors of the same series, sharing the same ferrite core. Such a comparison is highlighted in Figure 6a, showing an excellent fit with the datasheet information at 25 °C; the same result is obtained with the data retrieved from inductor 2, confirming the correctness of this approach.
Furthermore, the saturation current for inductor 1 (Isat-ind1) depends on the temperature (Tcore considered in °C), and it can be interpolated by a straight line, obtaining (14):
I s a t - i n d 1 ( T c o r e ) = 0.0126 T c o r e + 3.5168
By multiplying (14) by the square root of the nominal inductance (a mean measured value of 90 µH for inductor 1), it is possible to retrieve the expression of the proportionality factor K as a function of the temperature; it should be noted that K depends on the geometrical and physical properties of the core and is also temperature-dependent.
K ( T c o r e ) = ( 0.1195 T c o r e + 33.363 ) × 10 3
Figure 6b shows the comparison between the data obtained from (13) and the expression of K(Tcore) extrapolated from the measurement of inductors 1 and 2. Both expressions of K result in similar values of the saturation current for the whole Lnom range; nonetheless, a smaller range of inductance is shown in Figure 6b for the sake of tidiness. The quantitative data shown in Figure 6b are listed in Table 1.
Since the expression of K as a function of the temperature is known, it is possible to extend the manufacturer’s information, including the temperature behavior, to the whole family of inductors sharing the same core. Such dependence is presented in a 3D surface in Figure 7a, whereas the projection for a given nominal inductance (defined at 25 °C) is presented in Figure 7b and at a constant core temperature in Figure 7c. As previously remarked, Isat has a linear dependence on the temperature (Figure 7b). Moreover, at 105 °C, the saturation current is 36% lower than its corresponding value at 25 °C; this property is valid for all inductors sharing the same core. Such a drop cannot be ignored during the SMPS design process, especially when the inductor is exploited in partial saturation. Such analysis provides a complete characterization of the Coilcraft DO5010H inductor family since each inductor of this series has the same ferrite core. This analysis can be extended to other inductors and is independent of the information available in the datasheet. It is worth noting that, although several inductors of the DO5010H series cannot be measured by the system presented here due to the limited range of current provided by the power supply, it is possible to extrapolate the characteristics of the saturation current vs. the core temperature through (13) for the whole family once the proportionality factor K is retrieved from the measurement of one suitable inductor of the same series.
Finally, this approach is helpful for retrieving information regarding the saturation and temperature behavior of power inductors in the non-linear region. The additional information can help designers adopt a cost-effective design of SMPS exploiting non-linear inductors, allowing them to address the adverse effects of saturation.

8. Experimental Analysis of the Temperature Effect

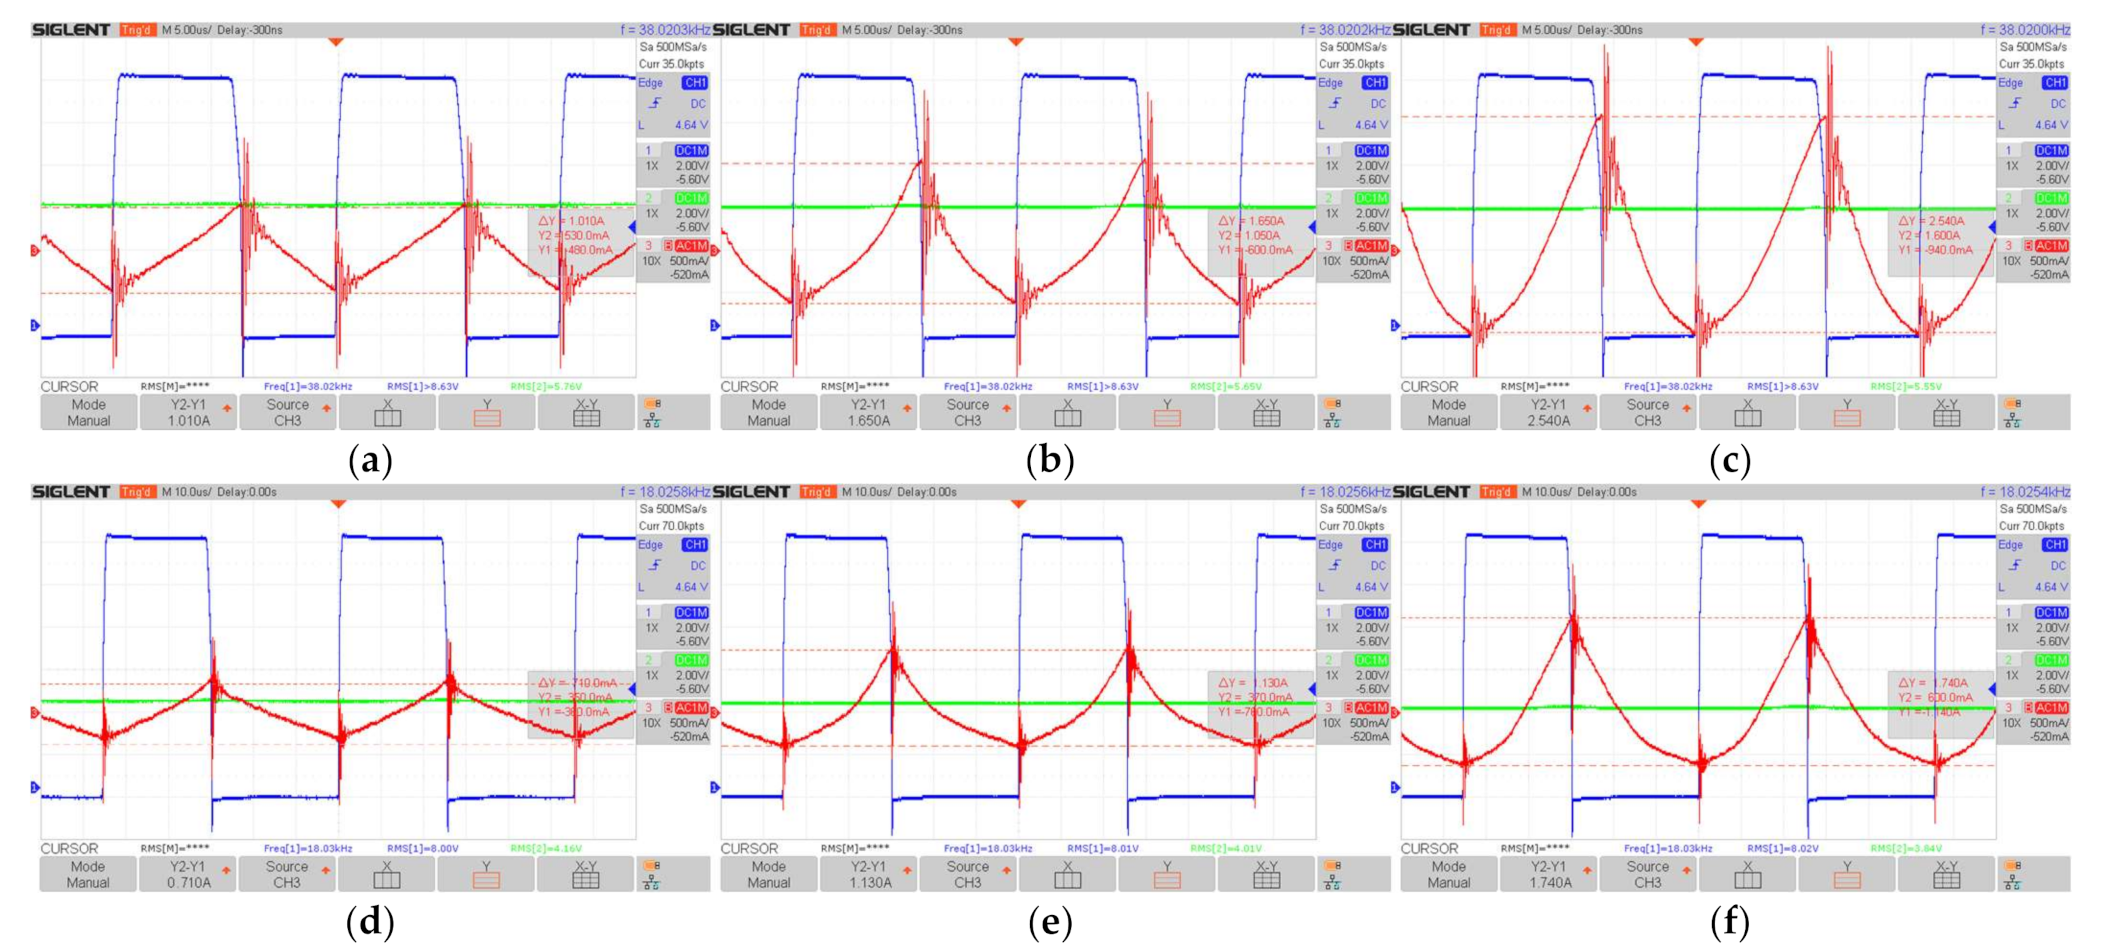
In order to assess the temperature impact on the inductor behavior, the two inductors previously characterized were further investigated in real operating conditions. Some current profiles are shown to highlight how the temperature of the inductor influences the current shape and, consequently, the performance of the converter. The tests were conceived based on the models of the two inductors that were previously retrieved. The knowledge of the model is crucial since it allows forecasting the maximum current imposed by the lowering of the inductance. The two inductors were investigated in real operating conditions to assess the temperature impact on the inductor behavior. We aimed to reach the current corresponding to the saturation for each inductor; this can be obtained with a suitable TON of the power MOSFET that corresponds to different switching frequencies. The switching frequency was chosen to reach a current near the saturation value (inductance reduced to half of its maximum value) at 95 °C with the same ripple for both inductors of about 1 A. A switching frequency of 38 kHz was set for the test on inductor 1; since the imposed ripple is the same for the two inductors, we had to change the switching frequency of inductor 2 accordingly to a value of 18 kHz.
For each inductor, the test was performed starting from the environmental temperature, with a fixed duty cycle and load. The mean current through inductor 1 was equal to 3.2 A, whereas the mean current through inductor 2 was equal to 1.7 A. In both cases, we exceeded the manufacturer’s limit. The oscilloscope outputs, shown in Figure 8, contain the diode voltage (blue trace), output voltage (green trace) and the inductor current AC component (red trace). Three pictures corresponding to the core temperature at the environment temperature (25 °C), 55 °C and 95 °C are provided for each inductor. The corresponding measurement values are listed in Table 2.

8.1. Test on Inductor 1

As concerns inductor 1, the switching frequency was set to 38 kHz. Figure 8a shows the waveforms at the environmental temperature, where it can be noted that the current exhibits a triangular waveform corresponding to a linear behavior. The maximum value of the current in this operating condition can be measured by the oscilloscope, where only the AC component is shown (the reference level corresponds to the mean current, i.e., 3.2 A), which is equal to 3.7 A. During operation, the temperature rises due to the losses in the magnetic core; Figure 8b,c show that the current ripple in the inductor increases, as well as the maximum current. The current ripple measured at 95 °C is about 250% higher than the ripple at the environmental temperature, and the maximum current reaches 4.7 A (without considering the parasitic oscillations that can be filtered out). Moreover, a lowering of the output voltage can be appreciated; this is due to the increase in Joule drops; in particular, the output voltage from 5.76 V measured at 25 °C falls to 5.55 V at 95 °C. Since the converter is operated in an open loop, there is no automatic increase in the duty cycle to compensate the voltage drop; however, considering that the voltage has decreased by 3.6%, roughly an equal rise in the duty cycle should be expected. This corresponds to increasing the conduction time of the power switch from 15 to 15.5 μs. In this case, the estimated peak of the current increases up to 4.9 A due to the non-linearity.

8.2. Test on Inductor 2

As concerns inductor 2, the switching frequency was set to 18 kHz. Figure 8d shows the waveforms at the environmental temperature. Additionally, in this case, it can be noted that the current shows a triangular waveform corresponding to a linear behavior. In this case, the mean current through the inductor is equal to 1.7 A, and the maximum current is 2.1 A. During operation, the temperature rises due to the losses in the magnetic core, and the current ripple in the inductor increases as well as the maximum current, as shown in Figure 8e,f. The current ripple measured at 95 °C is about 245% higher than the ripple at the environmental temperature, and the peak of the current reaches 2.7 A. The output voltage decreases from 4.16 to 3.84 V, corresponding to a lowering of 7.7%. To compensate it by feedback, the duty cycle has to be raised; this implies increasing the conduction time of the power switch from 25.5 to 27.7 μs. In this case, the estimated maximum value of the current reaches 2.46 A.
In any case, the effect of the temperature starting from a linear operation leads the inductors to overtake the threshold current corresponding to saturation. Additionally, the feedback further worsens the overall stress of the circuit since it tries to compensate, by increasing the duty cycle, the voltage drop. This phenomenon becomes more relevant when the power increases as the voltage drop increases as well. The overtaking of the saturation limit current is due to the FFC operation. Differently, by adopting VFC, it is possible to impose the duty cycle D by increasing the switching frequency Fs, with a Ton such that the current limit is not exceeded. In fact, considering that D = Ton/T = Ton·Fs, it is possible to increase the duty cycle just by increasing the switching frequency, i.e., reducing Toff.
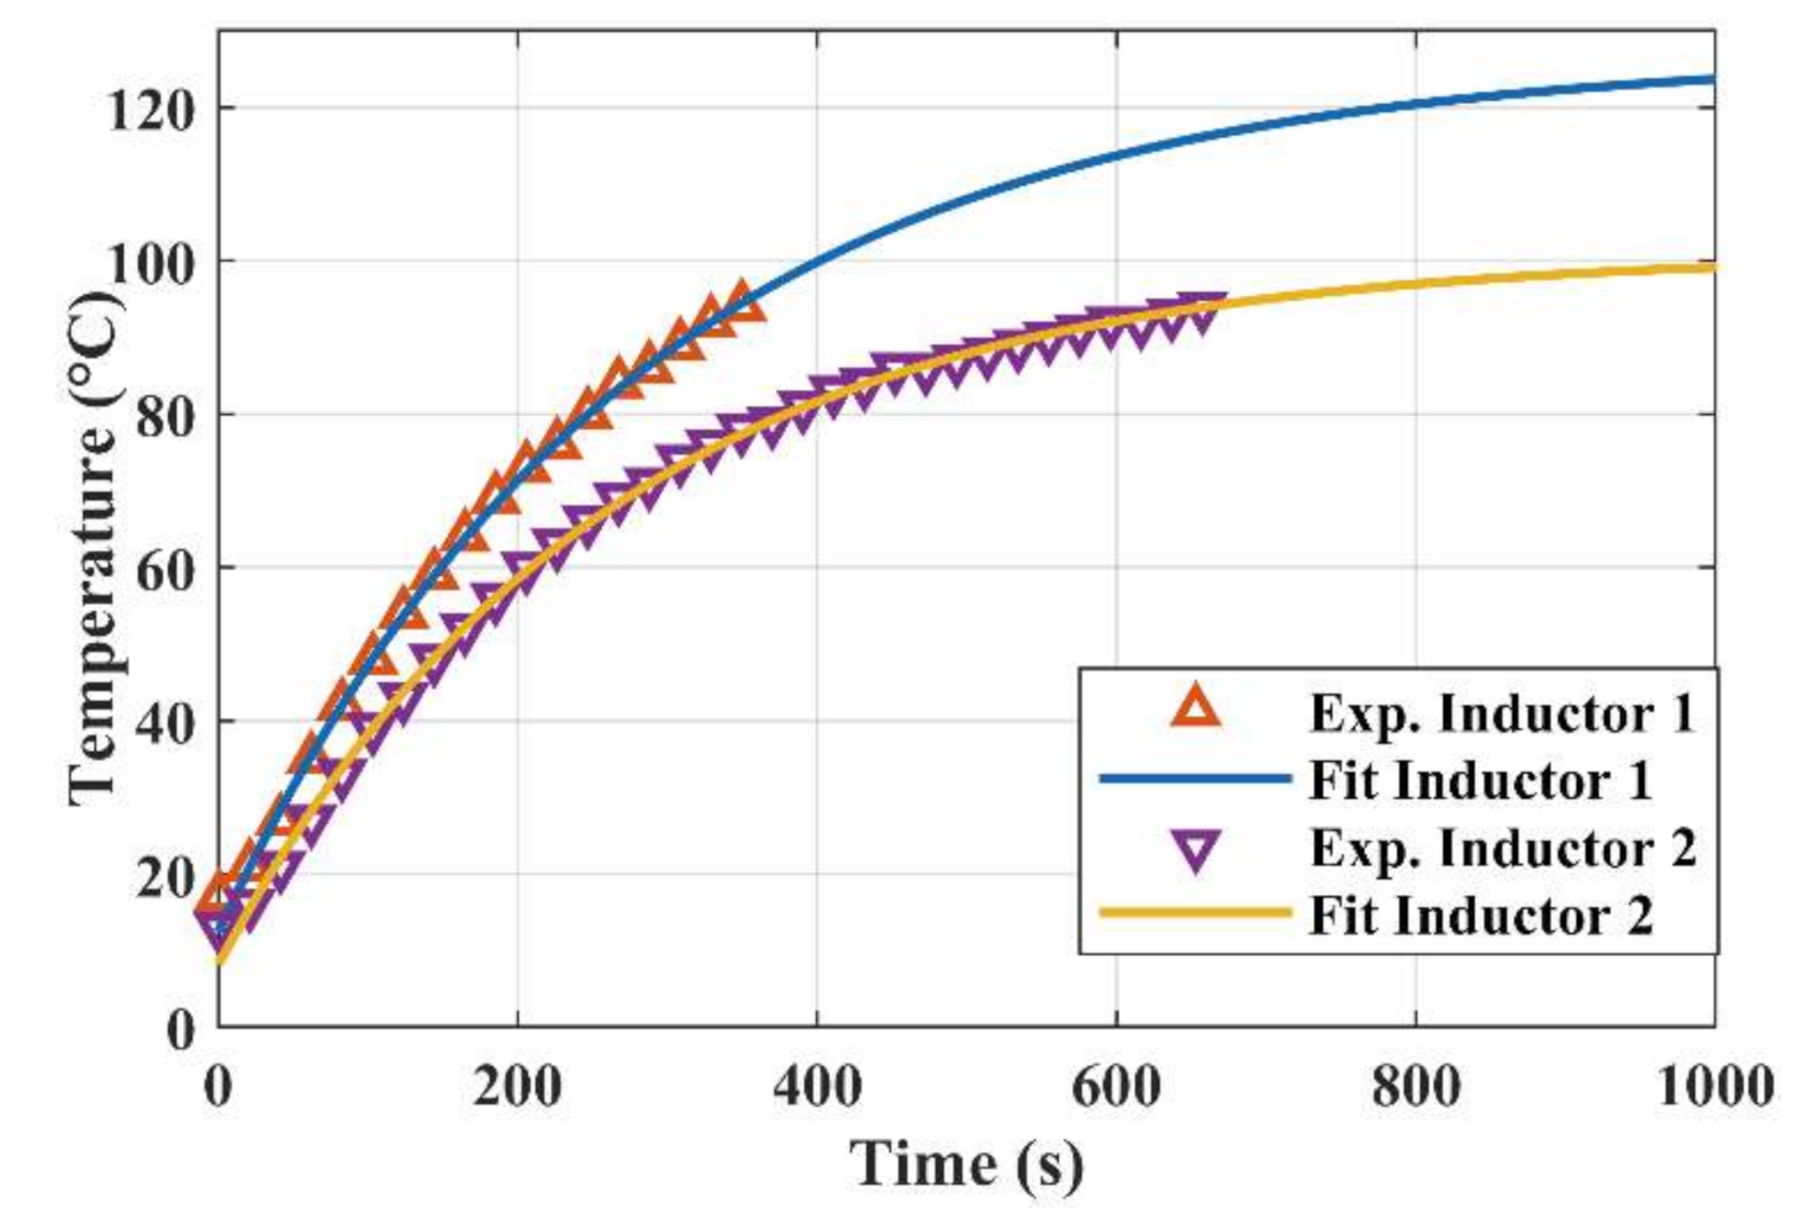
Figure 9 shows the curves of the temperature vs. time. We stopped the tests when the temperature reached 95 °C to avoid damaging inductor windings; indeed, the insulation is made of polymers such as polyurethane, polyamide and polyester. These materials usually degrade when the temperature exceeds 80–150 °C [36], with consequent failure of the insulating film covering the copper and short circuits among wires. Furthermore, the manufacturer guarantees a constant IRMS current up to 85 °C [34]. Experimental data were fitted to retrieve the exponential curve describing the temperature transient. It can be noted that inductor 1 reaches the maximum temperature before inductor 2, as expected, since a greater current flows through it. The curve corresponding to inductor 2 tends to stabilize around the maximum temperature, whereas the curve of inductor 1 rises to about 120 °C. It should be underlined that these transients describe the rise in the temperature starting from the environmental temperature and a linear operation; the losses drive the inductor in the non-linear zone, further raising the maximum peak of the current and lowering the output voltage.
The obtained results have general validity and can be applied to any inductor belonging to a DC/DC converter; they show that the temperature can drive an inductor outside the linear zone, and that in the neighborhood of saturation with FFC, a slight increase in the duty cycle causes a dramatic increase in the current peak.

9. Conclusions

A full characterization of power inductors is essential to exploit the saturation region; it must encompass the magnetization curve, and the temperature as a parameter since it plays a crucial role when an inductor is operated in saturation. The behavior of two different inductors wound on the same core and placed in a buck converter was verified when the saturation was exploited, showing how the current profiles vary.
The inductance characterization was based on the current derivative and voltage across the inductor; some cautions ensure that the error is minimized within tolerance. Moreover, the inductor under test was characterized in real operating conditions since it is part of a switching converter, ensuring a high-precision measurement. The temperature of the inductor was measured at a suitable point of the core.
The measurement system provides a complete characterization of the inductance vs. temperature, up to the saturation current, defined as the current at which the inductance value drops at half its maximum. The measurement error was lower than the tolerance defined by the manufacturer. The magnetization curve can also be retrieved, and the core saturation current vs. inductance can be calculated. Experimental tests were conceived to show how the temperature influences the current profile and, consequently, both the maximum current through the same inductor and the output voltage of the converter. The feedback of the converter can further increase the overall stress, and this is emphasized by increasing the rated power.
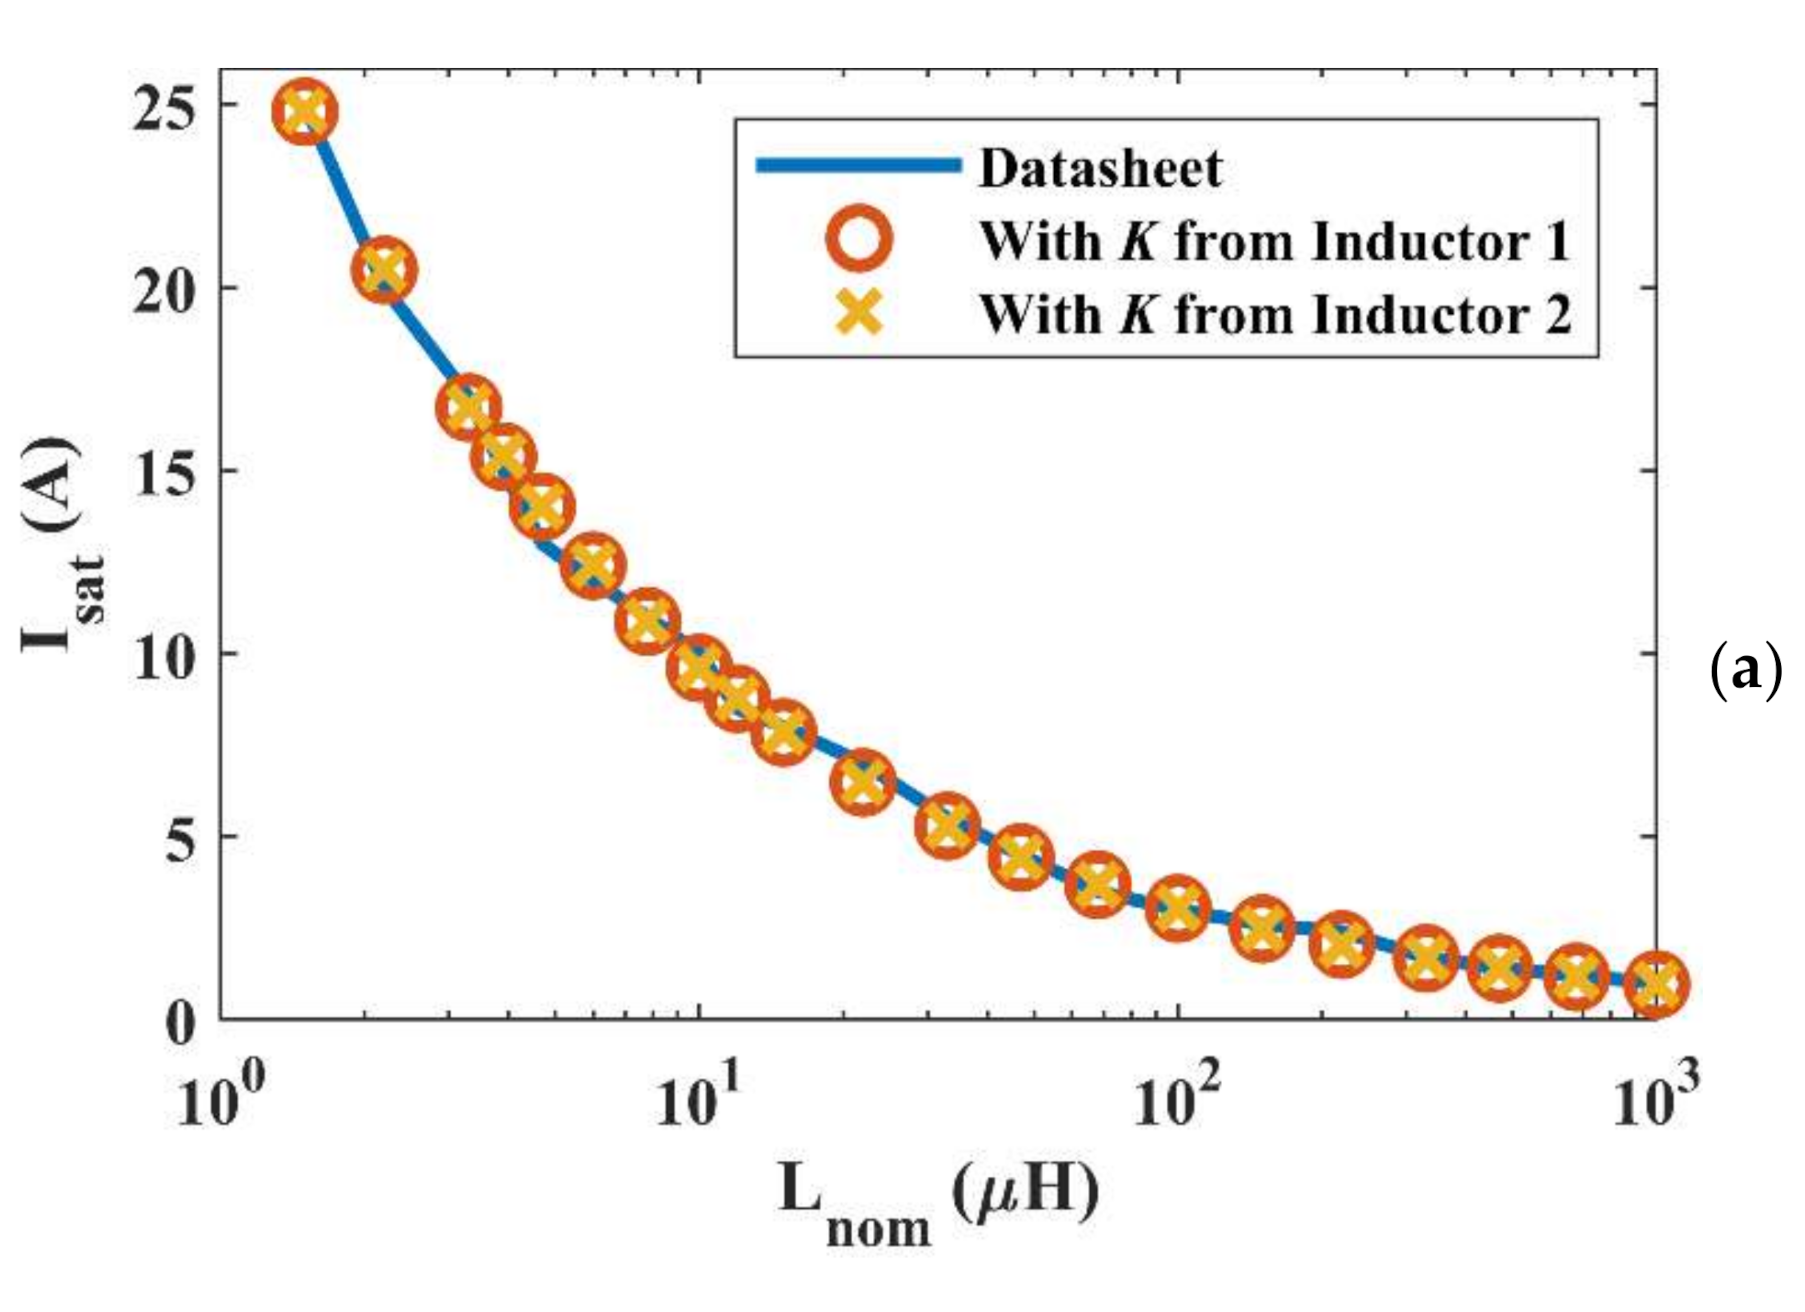
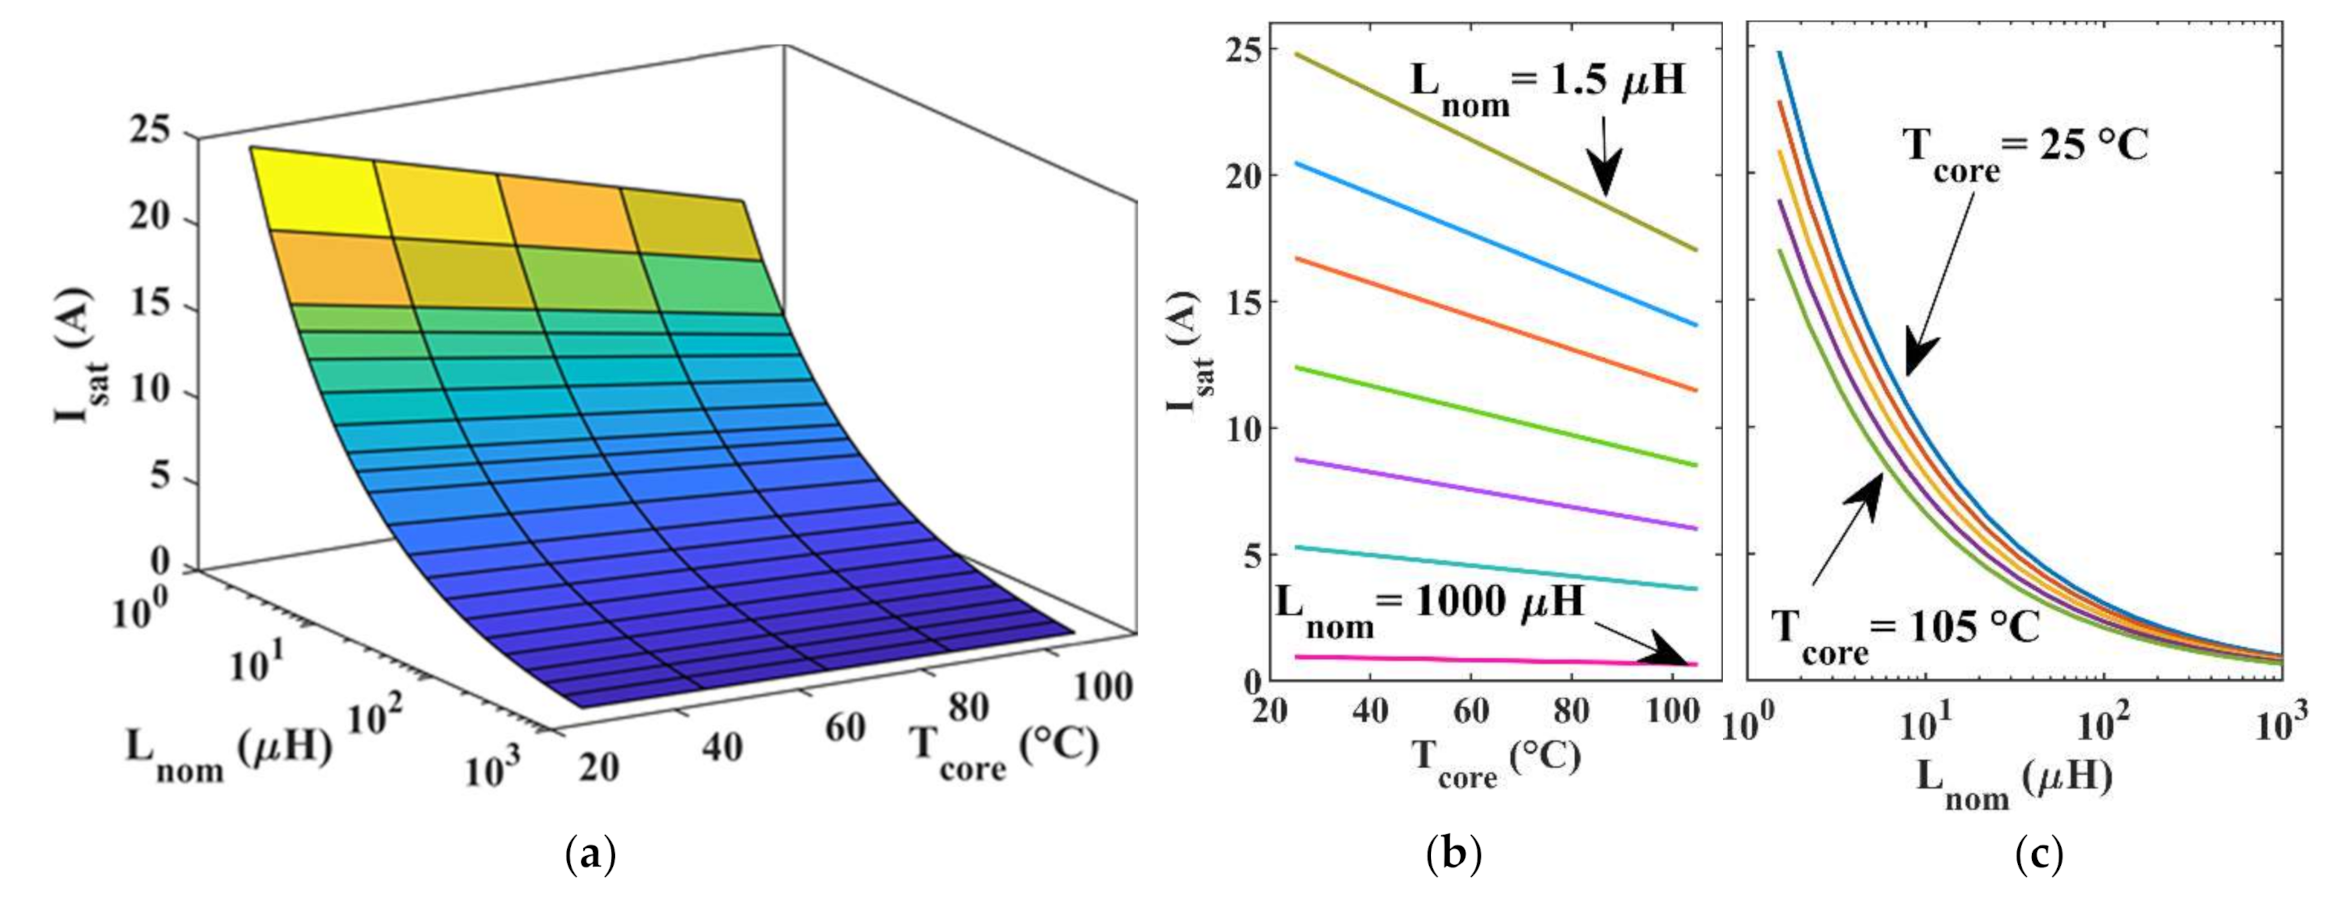
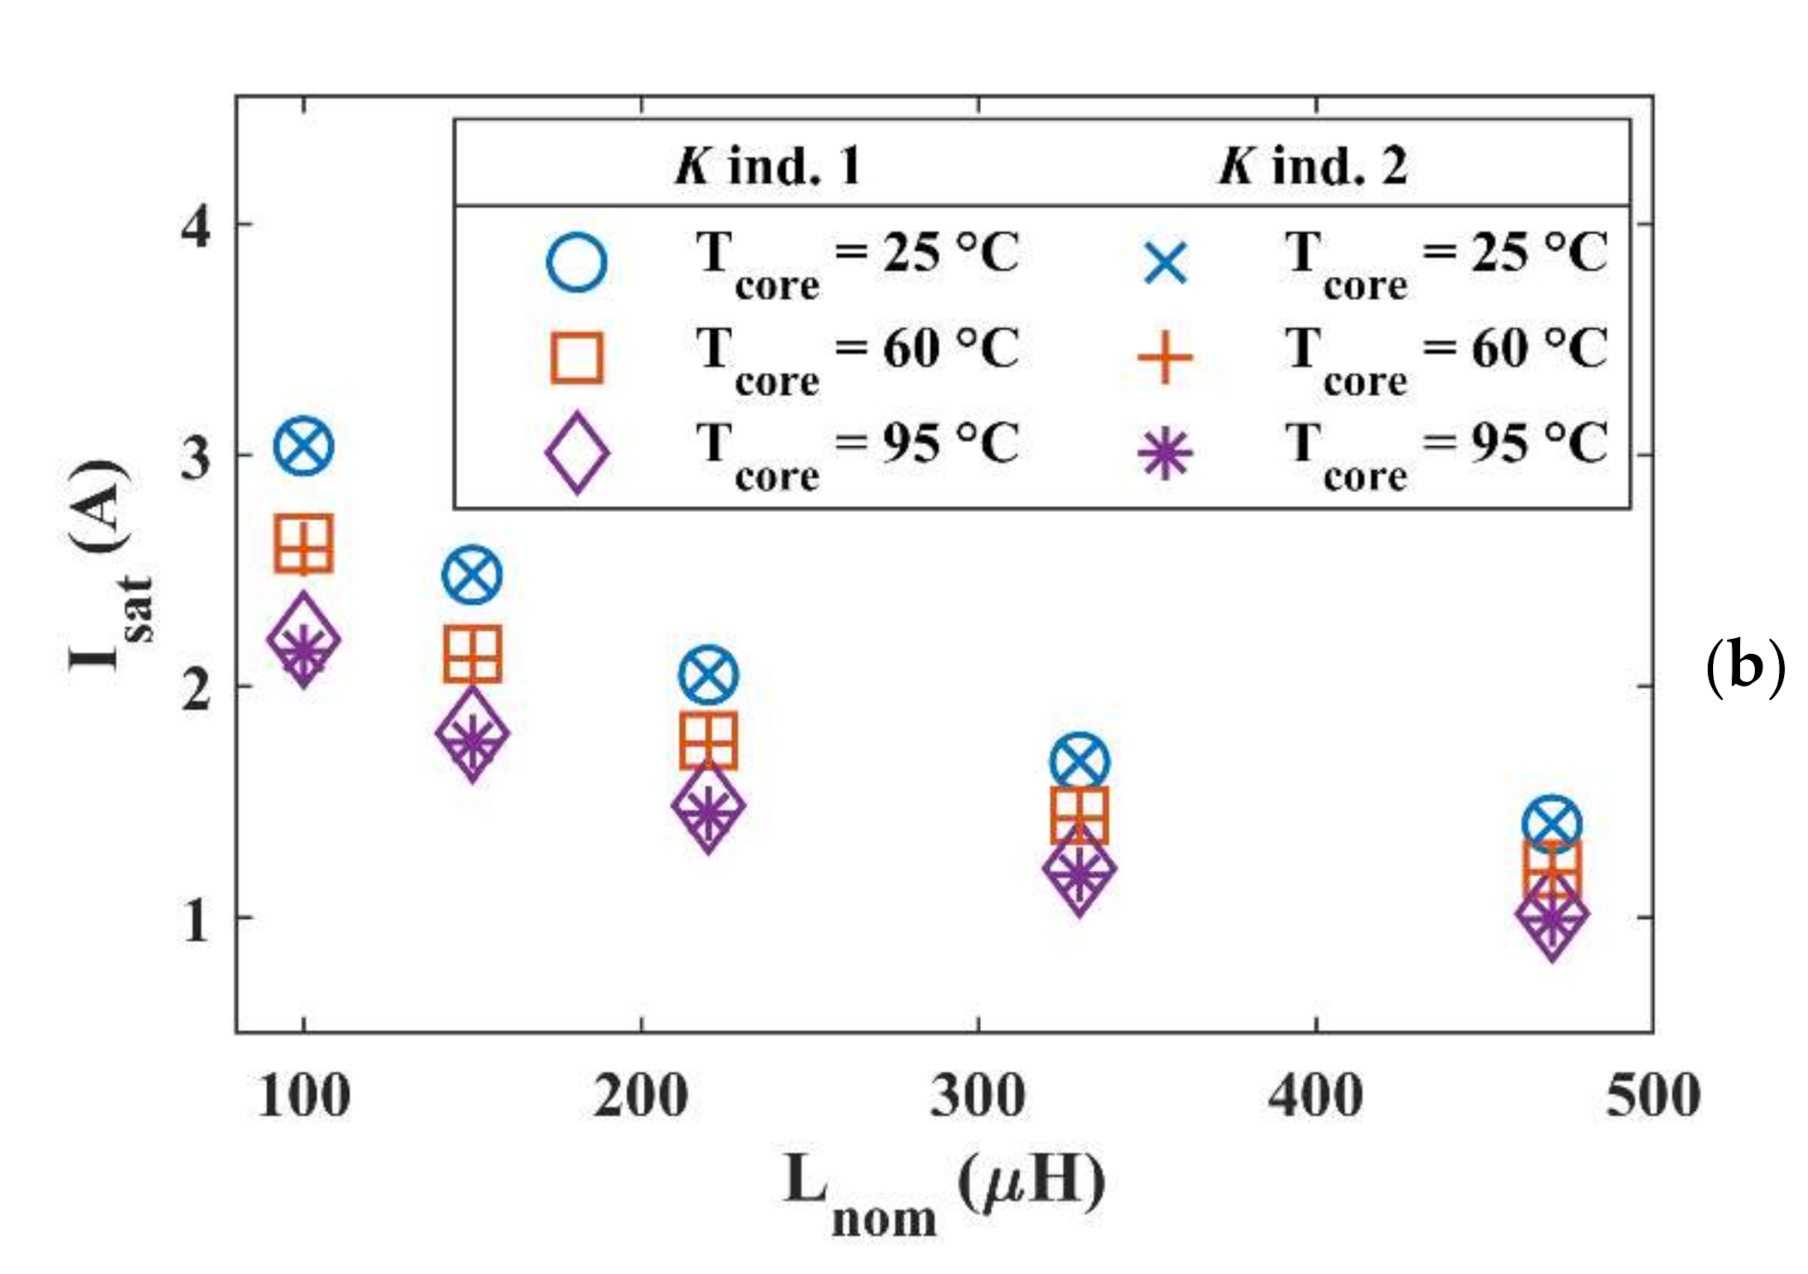
Finally, we demonstrated that it is possible to extrapolate the characteristics of the saturation current vs. the core temperature for a whole family of inductors sharing the same core once the proportionality factor K is retrieved from the measurement of one suitable inductor of the same series. This approach is thus helpful for retrieving information regarding the saturation and temperature behavior of power inductors in the non-linear region, allowing designers to address the adverse effects of saturation. Based on the detailed characterization of the power inductor, it is possible to extend its current range and to adopt, during the design, a smaller core compared to the core of an inductor in linear operation; in this way, the power density of the converter can be increased.

10. Highlights

10.1. Purpose of the Paper

The purpose of this paper was to propose a measurement system able to provide a complete characterization of inductance vs. temperature, up to the saturation current, defined as the current at which the inductance value drops at half its maximum.

10.2. Methodology

The inductor is connected as the power inductor in SMPS; in this way, real operating conditions are created.

10.3. Findings

The proposed system returns the core saturation curve vs. inductance as well as the magnetization curve profile, showing the inductance variation with the measured temperature.
The results obtained for the considered core can be used for characterizing inductors wound on the same core.

10.4. Research Limits

The maximum current at which the inductor can be tested is currently limited in our system both by the voltage supply and the variable load.

10.5. Practical Implications

The data related to inductor characterization up to saturation are often not provided by the manufacturer; on the other hand, by this information, in the design of SMPS, an inductor with a smaller core in which saturation is exploited can be adopted, saving cost and weight.

10.6. Originality of the Paper

The proposed system is based on equipment usually available in a laboratory, and hence it is relatively cheap. It performs measurements automatically, and it does not require preliminary information about the inductor to be tested.

Author Contributions

D.S. first author, G.V. corresponding author and co-author, M.V. co-author, G.L. last author. All authors have read and agreed to the published version of the manuscript.

Funding

This research received no external funding.

Institutional Review Board Statement

Not applicable.

Informed Consent Statement

Not applicable.

Data Availability Statement

The data presented in this study are available from the corresponding author upon reasonable request.

Conflicts of Interest

The authors declare no conflict of interest.

References

  1. Yan, Z.; Qimi, C.; Junbo, Z. Predicting core losses under the DC bias based on the separation model. IEEE J. Emerg. Sel. Top. Power Electron. 2017, 5, 833–840. [Google Scholar] [CrossRef]
  2. Perdigão, M.S.; Trovão, J.P.F.; Alonso, J.M.; Saraiva, E.S. Large-Signal Characterization of Power Inductors in EV Bidirectional DC-DC Converters Focused on Core Size Optimization. IEEE Trans. Ind. Electron. 2015, 62, 3042–3051. [Google Scholar] [CrossRef]
  3. Sima, W.; Peng, D.; Yang, M.; Liu, Y.; Duan, P.; Deng, J.; Qian, H. Low-frequency model for single-phase transformers based on the three-component Preisach model considering deep saturation. Int. J. Electr. Power Energy Syst. 2019, 110, 107–117. [Google Scholar] [CrossRef]
  4. Khalilifar, M.; Shahrtash, S.M.; Fateminia, M.; Ranjbar, A.M. Reactor modelling with saturation characteristic and inter-phase magnetic coupling. Int. J. Electr. Power Energy Syst. 2020, 123, 106228. [Google Scholar] [CrossRef]
  5. Di Capua, G.; Femia, N. A novel method to predict the real operation of ferrite inductors with moderate saturation in switching power supply applications. IEEE Trans. Power Electron. 2016, 31, 2456–2464. [Google Scholar] [CrossRef]
  6. Di Capua, G.; Femia, N.; Stoyka, K. Switching power supplies with ferrite inductors in sustainable saturation operation. Int. J. Electr. Power Energy Syst. 2017, 93, 494–505. [Google Scholar] [CrossRef]
  7. Valchev, V.C.; Van den Bossche, A. Inductors and Transformers for Power Electronics, 1st ed.; CRC Press: Boca Raton, FL, USA, 2018; ISBN 9781315221014. [Google Scholar]
  8. Beraki, M.W.; Trovao, J.P.F.; Perdigao, M.S.; Dubois, M.R. Variable Inductor based bidirectional DC-DC converter for electric vehicles. IEEE Trans. Veh. Technol. 2017, 66, 8764–8772. [Google Scholar] [CrossRef]
  9. Vitale, G.; Lullo, G.; Scire, D. Thermal stability of a DC/DC converter with inductor in partial saturation. IEEE Trans. Ind. Electron. 2021, 68, 7985–7995. [Google Scholar] [CrossRef]
  10. Bizzarri, F.; Lodi, M.; Oliveri, A.; Brambilla, A.; Storace, M. A nonlinear inductance model able to reproduce thermal transient in SMPS simulations. In Proceedings of the IEEE International Symposium on Circuits and Systems, Sapporo, Japan, 26–29 May 2019; IEEE: Sapporo, Japan, 2019; Volume 2019, pp. 1–5. [Google Scholar]
  11. Oliveri, A.; Di Capua, G.; Stoyka, K.; Lodi, M.; Storace, M.; Femia, N. A power-loss-dependent inductance model for ferrite-core power inductors in switch-mode power supplies. IEEE Trans. Circuits Syst. I Regul. Pap. 2019, 66, 2394–2402. [Google Scholar] [CrossRef]
  12. Oliveri, A.; Lodi, M.; Storace, M. Accurate modeling of inductors working in nonlinear region in switch-mode power supplies with different load currents. In Proceedings of the SMACD 2018-15th International Conference on Synthesis, Modeling, Analysis and Simulation Methods and Applications to Circuit Design, Prague, Czech Republic, 2–5 July 2018; IEEE: Prague, Czech Republic, 2018; pp. 233–236. [Google Scholar]
  13. Burrascano, P.; Di Capua, G.; Laureti, S.; Ricci, M. Neural models of ferrite inductors non-linear behavior. In Proceedings of the IEEE International Symposium on Circuits and Systems, Sapporo, Japan, 26–29 May 2019; IEEE: Sapporo, Japan, 2019; Volume 2019. [Google Scholar]
  14. Scire, D.; Lullo, G.; Vitale, G. Design and modeling of an interleaving boost converter with quasi-saturated inductors for electric vehicles. In Proceedings of the 2020 AEIT International Conference of Electrical and Electronic Technologies for Automotive, AEIT AUTOMOTIVE 2020, Turin, Italy, 18–20 November 2020; IEEE: Torino, Italy, 2020; pp. 1–6. [Google Scholar]
  15. Migoni, G.; Romero, M.E.; Bergero, F.; Kofman, E. A Mixed modeling approach for efficient simulation of PWM switching mode power supplies. IEEE Trans. Power Electron. 2019, 34, 9758–9767. [Google Scholar] [CrossRef]
  16. Stoyka, K.; Femia, N.; Di Capua, G. Power inductors behavioral modeling revisited. IEEE Trans. Circuits Syst. I Regul. Pap. 2020, 67, 5636–5649. [Google Scholar] [CrossRef]
  17. Femia, N.; Di Capua, G.; Stoyka, K. Saturation and thermal stability of power inductors. In Proceedings of the ICECS 2020-27th IEEE International Conference on Electronics, Circuits and Systems, Glasgow, Scotland, UK, 23–25 November 2020; IEEE: Scotland, UK, 2020; pp. 1–4. [Google Scholar]
  18. Uno, M. A direct-reading instrument for measurements of inductance of ferrite-core coils. IEEE Trans. Instrum. Meas. 1982, 31, 139–140. [Google Scholar] [CrossRef]
  19. Waltrip, B.; Seifert, F. A programmable capacitor for inductance measurements. IEEE Trans. Instrum. Meas. 2017, 66, 1572–1578. [Google Scholar] [CrossRef]
  20. Lu, J.; Pan, D.A.; Yang, B.; Qiao, L. Wideband magnetoelectric measurement system with the application of a virtual multi-channel lock-in amplifier. Meas. Sci. Technol. 2008, 19, 045702. [Google Scholar] [CrossRef] [Green Version]
  21. Fernandez, C.; Pavlovic, Z.; Kulkarni, S.; McCloskey, P.; O’Mathuna, C. Novel high-frequency electrical characterization technique for magnetic passive devices. IEEE J. Emerg. Sel. Top. Power Electron. 2018, 6, 621–628. [Google Scholar] [CrossRef] [Green Version]
  22. Batista, A.J.; Fagundes, J.C.S.; Viarouge, P. An automated measurement system for core loss characterization. IEEE Trans. Instrum. Meas. 1999, 48, 663–667. [Google Scholar] [CrossRef]
  23. Cheng, T.; Lu, D.D.C.; Siwakoti, Y. Electro-thermal modeling of a boost converter considering device self-heating. In Proceedings of the 2019 IEEE 4th International Future Energy Electronics Conference, Singapore, 25–28 November 2019; IEEE: Singapore, 2019. [Google Scholar] [CrossRef]
  24. Górecki, K.; Detka, K. Application of average electrothermal models in the SPICE-aided analysis of boost converters. IEEE Trans. Ind. Electron. 2019, 66, 2746–2755. [Google Scholar] [CrossRef]
  25. Thone, M.; Wens, J. Bodo’s Power Systems; Bodo’s Power Systems: Laboe, Germany, 2015; pp. 52–54. [Google Scholar]
  26. Lee, F.C.; Wang, S.; Li, Q. Next generation of power supplies-design for manufacturability. IEEE J. Emerg. Sel. Top. Power Electron. 2020, 6777, 1. [Google Scholar] [CrossRef]
  27. Matsumori, H.; Shimizu, T.; Wang, X.; Blaabjerg, F. A practical core loss model for filter inductors of power electronic converters. IEEE J. Emerg. Sel. Top. Power Electron. 2018, 6, 29–39. [Google Scholar] [CrossRef]
  28. Lullo, G.; Rosato, S.; Scirè, D.; Vitale, G. Characterization of non-linear inductors including thermal effects for power applications. Renew. Energy Power Qual. J. 2018, 1, 728–734. [Google Scholar] [CrossRef]
  29. Saeed, S.; Georgious, R.; Garcia, J. Modeling of magnetic elements including losses-application to variable inductor. Energies 2020, 13, 1865. [Google Scholar] [CrossRef] [Green Version]
  30. Liu, Y.; Yin, S.; Pan, X.; Wang, H.; Wang, G.; Peng, J. Effects of nonlinearity in input filter on the dynamic behavior of an interleaved boost PFC converter. Energies 2017, 10, 1530. [Google Scholar] [CrossRef] [Green Version]
  31. Gorecki, K.; Detka, K. Influence of power losses in the inductor core on characteristics of selected DC-DC converters. Energies 2019, 12, 1991. [Google Scholar] [CrossRef] [Green Version]
  32. McLyman, C.W.T. Transformer and Inductor Design Handbook, 4th ed.; CRC Press: Boca Raton, FL, USA, 2017; ISBN 9781315217666. [Google Scholar]
  33. Huo, X.; Xu, K.; Liu, R.; Chen, X.; Li, Z.; Yan, H. A structure-reconfigurable soft-switching DC-DC converter for wide-range applications. Energies 2019, 12, 2905. [Google Scholar] [CrossRef] [Green Version]
  34. Coilcraft Inc. SMT Power Inductors-DO5010H Series. Available online: https://www.coilcraft.com/en-us/products/power/unshielded-inductors/ferrite-drum-surface-mount/do/do5010h/ (accessed on 1 September 2020).
  35. Erickson, R.W.; Maksimović, D. Fundamentals of Power Electronics; Springer: Boston, MA, USA, 2001; ISBN 978-1-4757-0559-1. [Google Scholar]
  36. Barili, A.; Brambilla, A.; Cottafava, G.; Dallago, E. A simulation model for the saturable reactor. IEEE Trans. Ind. Electron. 1988, 35, 301–306. [Google Scholar] [CrossRef]
Figure 1. Example of a magnetization curve for a ferrite core.
Energies 14 03924 g001
Figure 2. Simplified circuit schematic of the DC/DC buck converter.
Energies 14 03924 g002
Figure 3. (a) Measurement setup. (b) Simplified circuit schematic with the black components assembled on a PCB. (c) Virtual instrument interface.
Energies 14 03924 g003
Figure 4. Inductor 1 characteristics as a function of current and temperature: (a) inductance vs. current at Tcore = 25 °C with error band representing the 95% confidence interval; (b) inductance vs. current; (c) flux curve vs. current.
Energies 14 03924 g004
Figure 5. Inductor 2 characteristics as a function of temperature: (a) inductance vs. current; (b) flux curve vs. current.
Energies 14 03924 g005
Figure 6. Simulations of the saturation current vs. inductance characteristic of the inductor family. The K factor of (13) was extrapolated from the experimental data of inductors 1 and 2: (a) Comparison of the simulation calculated with K extrapolated from inductor 1 and inductor 2 with the information given by the datasheet at Tcore = 25 °C. The abscissa is on a logarithmic scale for better visualization. (b) Comparison of the simulated saturation currents obtained at different temperatures with K extrapolated from inductor 1 and from inductor 2.
Energies 14 03924 g006aEnergies 14 03924 g006b
Figure 7. Saturation current behavior for the inductor family simulated from (13) and (15): (a) saturation current (Isat) vs. nominal inductance (Lnom) vs. core temperature (Tcore); (b) Isat vs. Tcore for a given Lnom; (c) Isat vs. Lnom at constant Tcore. The inductance axis is on a logarithmic scale for better visualization.
Energies 14 03924 g007
Figure 8. Experimental measurement of the diode voltage (blue), output voltage (green) and inductor current in AC coupling (red) for different inductors and temperature conditions. First row depicts measurement conducted on inductor 1 (Lnom = 100 µH) for Fs = 38 kHz, with a mean inductor current of 3.2 A at: (a) 25 °C, (b) 55 °C, (c) 95 °C. Second row depicts measurement conducted on inductor 2 (Lnom = 330 µH) for Fs = 18 kHz, with a mean inductor current of 1.7 A at: (d) 25 °C, (e) 55 °C, (f) 95 °C.
Energies 14 03924 g008
Figure 9. Thermal transient for inductor 1 (blue) and inductor 2 (orange).
Energies 14 03924 g009
Table 1. Saturation currents at different temperatures with K derived from inductor 1 (100 µH) or from inductor 2 (330 µH).
K i n d 1 T c o r e = ( 0.1195 T c o r e + 33.363 ) × 10 3
Lnom (µH)Saturation Current @25 °CSaturation Current @60 °CSaturation Current @95 °C
1003.0382.6192.201
1502.4802.1391.797
2202.0481.7661.484
3301.6721.4421.212
4701.4011.2081.015
K i n d 2 T c o r e = ( 0.1271 T c o r e + 33.585 ) × 10 3
Lnom (µH)Saturation Current @25 °CSaturation Current @60 °CSaturation Current @95 °C
1003.0412.5962.151
1502.4832.1201.756
2202.0501.7501.450
3301.6741.4291.184
4701.4031.1970.992
Table 2. Experimental measurement for different inductors and temperature conditions.
Temperature (°C)Output Voltage (V)Inductor Current Ripple (A)
Inductor 1
(Lnom = 100 µH)
255.761.01
555.651.65
955.552.54
Inductor 2
(Lnom = 330 µH)
254.160.71
554.011.13
953.841.74
Publisher’s Note: MDPI stays neutral with regard to jurisdictional claims in published maps and institutional affiliations.

