Abstract
If left uncontrolled, electric vehicle charging poses severe challenges to distribution grid operation. Resulting issues are expected to be mitigated by charging control. In particular, voltage-based charging control, by relying only on the local measurements of voltage at the point of connection, provides an autonomous communication-free solution. The controller, attached to the charging equipment, compares the measured voltage to a reference voltage and adapts the charging power using a droop control characteristic. We present a systematic study of the voltage-based droop control method for electric vehicles to establish the usability of the method for all the currently available residential electric vehicle charging possibilities considering a wide range of electric vehicle penetrations. Voltage limits are evaluated according to the international standard EN50160, using long-term load flow simulations based on a real distribution grid topology and real load profiles. The results achieved show that the voltage-based droop controller is able to mitigate the under voltage problems completely in distribution grids in cases either deploying low charging power levels or exhibiting low penetration rates. For high charging rates and high penetrations, the control mechanism improves the overall voltage profile, but it does not remedy the under voltage problems completely. The evaluation also shows the controller’s ability to reduce the peak power at the transformer and indicates the impact it has on users due to the reduction in the average charging rates. The outcomes of the paper provide the distribution grid operators an insight on the voltage-based droop control mechanism for the future grid planning and investments.
1. Introduction
The electrification of the transportation sector provokes many challenges in the power system operation, most notably in the low voltage (LV) distribution networks [1,2,3]. If left uncontrolled, private electric vehicles (EV) are more likely to be charged at high coincidence when most of the EV owners return home from their work. As a result, EV charging raises the already existing peak demand at the distribution transformers in this period leading to many operational problems: voltage drops; increased power losses; increased probability in overloading of distribution transformers and cables; higher risk of service interruptions [1,2,4,5,6,7,8]. Demand side management (DSM) strategies exploit the flexibility of EV charging to reduce these adverse impacts on the grid operation [9,10,11,12]. In this manner, DSM approaches enable the efficient use of existing network capacity and reduce the cost-sensitive grid reinforcements even at high EV penetrations.
Voltage-dependent charge control methods are discussed as a feasible solution for the voltage deviations arising from EV charging [6,13,14,15,16]. Depending only on local voltage measurements at the point of connection, these controllers work on a simple droop control mechanism, which can be easily installed in already existing electric vehicle supply equipment. In contrast to other approaches, a voltage dependent control mechanism demands no communication infrastructure [17]. It can be easily integrated into the existing network at low costs and is robust as it is not subject to potential communication failures. The potential of this approach to improve grid voltage profile has been demonstrated using LV distribution grid simulations. Relevant publications are reviewed hereafter, an overview of the referenced work and existing approaches in literature being provided in Table 1.

Table 1.
An overview of literature on voltage-based charging control and the proposed study.
The impact of the voltage droop charging method for EVs in a large LV residential grid comprised of 1020 households is assessed by Al-Awami et al. [6]. The authors consider three different EV penetrations ( assuming a charging power of kW. The mobility behavior of the EVs are modeled using a Gaussian distribution. Voltage variations in extreme nodes, average charging time and total loading in the grid are evaluated for a period of a single day. The results indicate that this method is capable of eliminating the voltage violations caused by EV charging in cooperation with voltage control devices.
Geth et al. [13] evaluate the voltage droop charging method in a residential feeder for two scenarios. In the first scenario, only one out of 20 EVs is controlled by the droop mechanism. In the latter, all EVs are controlled by the droop mechanism. The paper demonstrates the potential voltage improvements with droop controlling in a distribution grid and evaluates the impact on the average charging rates. Comparing the two scenarios, the authors conclude that the effectiveness of the method improves with increasing number of controlled electric vehicles.
Leemput et al. [14] evaluate the voltage droop method for EVs using long-term simulations (for a period of a half year), considering a scenario with a total number of 39 EVs and a charging power of kW. The LV grid model consists of a main feeder with 39 households and five other parallel feeders. These parallel feeders are modeled in a simplified manner with a total load equal to the aggregated load of the main feeder. The compliance with the EN50160 voltage standards [18], charging time of the EVs and the maximum transformer power are discussed in detail in the results. The authors conclude that the impact on the charging time is very limited and, the droop control alone does not provide the results in compliance with the EN50160 standard.
Álvarez et al. [15] study four voltage dependent solutions for controlling the charging of EVs in a real Danish network. The network consists of a main feeder with 43 households and three other feeders that are represented by a single aggregated load. 43 EVs and a maximum charging power of kW are considered. The simulations are conducted assuming a typical winter day, i.e., a high load case. The impact of the proposed methods on the voltage profiles of several important nodes are analyzed in the paper. They conclude that a simple droop controller together with a hysteresis comparator improves the power quality of a power system.
An analysis on the voltage droop charging method for EVs on a Victorian LV grid with an EV penetration of is presented by Xia et al. [16]. The voltage improvements on all the nodes and the total grid power are evaluated for a single day.
Three-phase home charging with 11kW power is now preferred in most European countries, owing to the availability of three-phase electricity at households. None of the available research investigates the applicability of the voltage droop control mechanism for 11kW EV charging. Therefore, it is unclear whether the conclusions drawn hold equally with regard to 11kW charging. Furthermore, most of the references discussed, only evaluate the results for a small set of EV penetrations. Except the work by Leemput et al. [14], which considers a simulation time of half a year, the presented publications base their results on single day or weekly simulations. Only the authors in [14] present a comprehensive analysis on the voltage profile and evaluate the compliance with the voltage magnitude standards as defined in ENE50160. Therefore, no comprehensive assessment on the benefits and limitations of the voltage-based control for charging EVs in a distribution grid has yet been provided. Our goal is to find, if the LV distribution grids are able to comply with the voltage magnitude standards with droop controlled EV charging for all combinations of penetrations and currently available residential charging power levels. To this end, we present a systematic study of voltage-based EV charging control, taking into account:
- three currently available charging power levels ( kW, kW, 11 kW);
- a full range of EV penetrations (5%, 10–100%, in steps of 10%);
- long term simulations (half a year);
- real distribution grid topology and load data.
We present our results including an assessment of:
- the voltage magnitude compliance with the standards;
- the peak power in the grid;
- the average charging rates over a range of EV penetrations and three charging power levels.
2. System Modeling
2.1. Voltage Based Controller Characteristics
Reducing voltage deviations stemming from EV charging, and, thereby improving the voltage profile of distribution grids, is the main objective of the voltage-based control approach considered. To facilitate the control mechanism, it is assumed that each EV charging infrastructure is equipped with a droop controller accompanied by an advanced metering infrastructure (AMI) at the point of connection [19] capable of measuring the voltages. The general concept of the voltage droop mechanism is depicted in Figure 1.
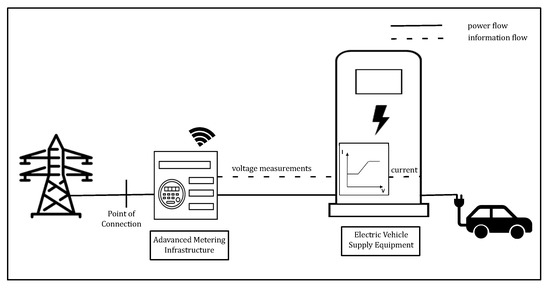
Figure 1.
Voltage droop control mechanism.
The measured voltage of the AMI at the point of connection serves as input to the voltage droop control mechanism. The charging current of the EV is set according to the droop characteristics, as shown in Figure 2.
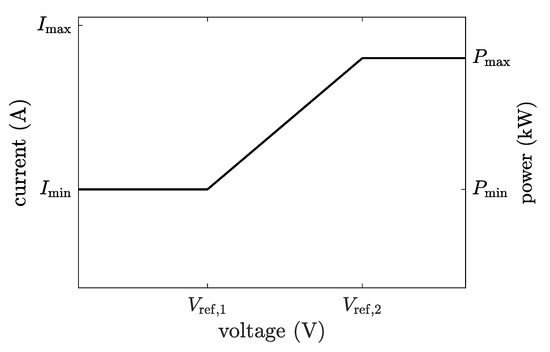
Figure 2.
Voltage droop characteristics for EV charging current control.
As defined in Equation (1), if the node voltage V, measured at the point of connection, falls below the lower reference value , the charging current I is limited to the minimum charging current . According to the IEC-61851 EV charging standards, this is to be 30% of the rated charging current. If the node voltage exceeds the upper reference value , the charging is not limited by the controller and allowed to be carried out at the maximum current . This limit for charging current is determined based on the nominal charging power levels. If the voltage lies between the lower and upper voltage reference values, the charging current is controlled in accordance to the linear droop characteristics.
2.2. Simulation Framework
The topological data and grid parameters of a real Austrian distribution grid were provided by the local distribution system operator (DSO), Vorarlberger Energienetze GmbH [20]. The simulated LV grid comprises two 630 kVA, 10/0.42 kV step down 3-phase transformers with 221 load nodes. The grid supplies 600 residential consumers, 52 business units, and 99 other consumer units which include heat pumps, public facilities, etc. Figure 3 shows the geographical representation of the simulated LV network.
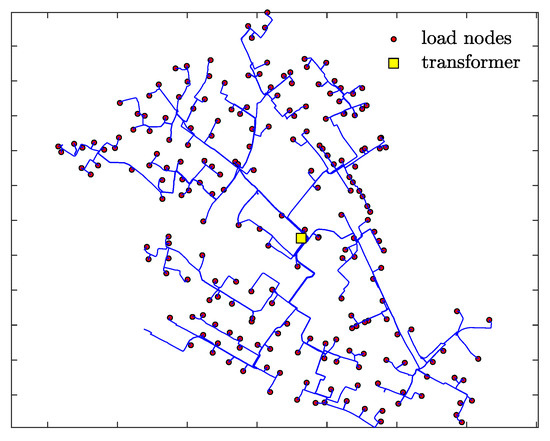
Figure 3.
LV distribution grid model.
An in-house simulation tool [21] for load flow simulations is used. It is implemented in MATLAB [22] and provides interfaces to implement DSM strategies for flexible devices and energy storage systems. The load flow calculation is implemented using the backward forward sweep flow method as proposed by Ghatak and Mukherjee [23]. For the load flow calculation, the load currents are calculated in the backward sweep and the bus voltages are calculated in the forward sweep based on the currents determined. The process is repeated until convergence of node voltages with respect to a limiting tolerance value. To map the voltage-base control of EVs, in each iteration the charging current is calculated according to the droop control characteristics. In our study, we conducted a balanced three-phase load flow simulations with a time resolution of 15min for randomly chosen 25weeks in the winter season, where the electricity demands are typically high.
Residential loads are modeled using real smart meter data recorded in a field test by the local energy provider illwerke vkw AG (VKW) [24]. The consumption data over a year for 351 households with a time resolution of 15 min were available. The smart meter data are assigned to the household loads by mapping the annual energy demand. Non-residential loads are modeled using standard load profiles of the Austrian clearing and settlement agency [25]. These standard profiles are scaled in accordance with the annual energy demand of a specific consumer. The power factor for the loads was tuned to based on active and reactive power measurements at the substation.
Existing PV generations with an installed capacity of kWp are considered in the simulation. Typical PV power profiles from the region of the grid with a 15-min resolution are used and scaled to match the installed capacity of a particular PV installation.
2.3. EV Model
A linear model is used to characterize the system dynamics of the EV battery. The energy content of the EV battery at time t, can be expressed mathematically by
where is the time dependent energy content of the battery, is the charging power and is the discharging power at time t. is the charging efficiency of the charging equipment and is the time step. The model neglects the standby losses of the battery.
The state of charge of the ith EV at discrete time step n is given by
and refer to the initial SOC and the SOC at time step n of the ith EV, respectively. is the battery capacity of the ith EV. N is the total number of time steps and I is the total number of EVs present.
The battery capacity of an EV is set to kWh which corresponds to a Nissan Leaf [26]. The charging efficiency is set to . Three currently available residential nominal charging power levels were considered in the study: kW, kW, 11 kW.
The EV usage behavior is modeled using the statistical data from the Austrian national mobility survey conducted in 2013 [27]. The survey provides detailed data on the departure and arrival times, as well as the distances traveled for all journeys recorded. Based on these data, the user behavior profiles are generated, which include energy consumption and availability for charging at each time step. The energy consumption is computed based on the distances driven and the duration of the journey, assuming a specific energy consumption of kWh/km [28]. Furthermore, it is assumed that the vehicle is available at home before it departs for the first trip and after it returns from the last trip of the day. The entries with long daily distances are excluded from the data to comply with the electric ranges of the EVs. Moreover, it is assumed that the EV charging is controlled only at private charging infrastructure. The 15-min based usage profiles for EVs are generated by taking the differences in weekend and weekday journeys into account. After cleaning the data of the available on the survey, 15,320 weekday and 5696 weekend driving profiles were created and used as a library for usage behavior modeling. These profiles were assigned for the EVs randomly.
The EVs are randomly assigned to the network nodes for a given penetration, with a maximum of one EV per household. The same random pattern is kept over all the scenarios to assure the consistency. At each subsequent penetration the new EVs are progressively added to the existing EV fleet.
2.4. Scenarios
To evaluate the implications of the droop control charging on grid operation, several scenarios were simulated. An overview is given in Table 2.
Table 2.
Overview of the scenarios considered in the simulations: benchmark scenario (BM), uncontrolled scenarios (U1–U3) and controlled scenarios (C1–C3) for three different charging power ratings each.
For all the six scenarios except the benchmark scenario, eleven EV penetrations (5%, 10–100%, in steps of 10%) were considered, resulting in a total of 67 grid simulation runs over a time horizon of half a year.
The reference voltages for the voltage-based controller are set to p.u. and p.u. to comply with the voltage magnitude standards specified in ENE50160. The lower voltage reference limit was chosen to account for the maximum possible voltage drop in the cable connecting the load node to the charging controller.
3. Results
The plausibility of voltage-based control for EV charging in complying with the voltage magnitude standards was investigated for different charging power levels and a full range of EV penetrations. The analysis was performed considering several aspects, separately discussed in the sections hereafter: the compliance with the voltage magnitude standards defined in EN50160; the normalized charging rate; the peak power at the transformer; a statistical analysis on the nodal voltages.
3.1. Compliance of the Voltage with the International Standard EN50160
For the satisfactory operation of the customer electrical equipment, the voltage magnitude should be maintained within a regulated range. The European standard EN50160 specifies that the 10-min rms value of the supply voltage in LV distribution networks should not deviate from the nominal value more than 10% for 95% of the time within a week. Additionally, the 10-min rms values of the supply voltage has to remain in the range of in any case. The first condition will be referred to as the time limit, the latter to as the minimum and maximum voltage limit, respectively.
To investigate the impact of the droop-control on the voltage magnitude, we evaluated the compliance with the voltage magnitude standards defined in EN50160 as described above. The evaluation is conducted on a weekly basis for the 25 weeks simulated. Figure 4 shows the maximum duration of the rms values of the nodal voltages exceeding a % of the nominal voltage value and the violations of the % voltage limit. Table 3 summarizes the voltage compliance for the two conditions (time and voltage limit) defined in the EN50160 standard for the six scenarios.
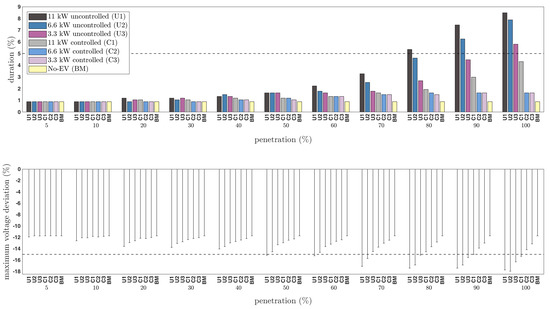
Figure 4.
Maximum duration of the rms voltage deviation below the % threshold (top), minimum voltage deviation (bottom) for the benchmark case (BM), the uncontrolled (U1–U3) and controlled (C1–C3) scenarios. The dashed lines show the threshold limits defined in the EN50160 standard.
Table 3.
Compliance with the EN50160 voltage standards for the six scenarios (uncontrolled U1–U3 and controlled C1–C3) for the range of penetrations; −/−: compliant with the time limit and compliant with the minimum voltage limit; −/+: compliant with the time limit and violation of the minimum voltage limit; +/−: violation of the time limit and compliant with the minimum voltage limit; +/+: violation of the time limit and violation of the minimum voltage limit. Shaded text is used to highlight the mitigation effects achieved by the droop controller.
As illustrated in the bottom plot of the Figure 4, the voltage deviation exceeds the %-limit already in the benchmark scenario (without EVs). Nevertheless, the grid voltage is in compliance with the EN50160 voltage standards as the maximum duration below the %-limit is less than 5% of the time. The compliance with time limit is met in all the scenarios up to 70% penetration as illustrated from the top plot of Figure 4, however, utilization of the available voltage reserves grows steadily with increasing penetration for the uncontrolled scenarios (U*), most notably in the scenario U1 (uncontrolled 11kW-scenario). In contrast, the minimum voltage deviation exceeds the %-limit already at lower penetrations, resulting in a violation of the voltage limit defined in the ENE50160 standards. Specifically, at 50% penetration in case of 11kW (U1) followed by kW (U2) at 70% penetration, and 80% for the kW (U3) charging rate.
With 11kW charging power level, the droop controller (C1) eliminates the time and voltage limit violations for 50%–80% penetrations, ensuring the compliance with the EN50160 voltage standards up to 80% penetration. For the penetrations above 80%, the controller is not capable of eliminating the violation of the %-limit (voltage limit) anymore. With kW and kW scenarios (C2, C3), the droop controller mitigates the time and voltage limit violations successfully, and ensures the voltage compliance with the EN50160 standard for penetration rates where it is violated in case of uncontrolled charging, cf. Table 3.
The outcomes of Leemput et al. [14] states that the droop controlling fails to meet the time limit defined in ENE50160 for a EV charging rate of kW at 100% penetration. In contrast, the results of this research show that the droop controlling assists in complying with the defined time limit at this charging rate. The reason for this discrepancy is the differences in the voltage reference points in the controller. The authors in this paper use a lower and upper voltage reference point of 0.85 p.u. and 0.90 p.u., respectively. In contrast, we use a more restricted set of reference points, with the lower and upper reference points being set at 0.92 p.u. and 0.96 p.u., respectively.
The results indicate that at high charging power (11kW) and at high penetrations (at 90% and above), although the controller does not contribute to the compliance with the minimum voltage limit, i.e., %, the compliance with the time limit is achieved. However, even in these cases the grid voltage is very close to the threshold limits. Furthermore, even the controlled scenarios with low charging power levels approach the minimum voltage limit, at high penetrations, exhibiting a reduced voltage reserve. Therefore, DSOs should be aware of the fact that though the method is well suited to mitigate the voltage problems when charging at low power levels and low penetrations, it does not provide a full assurance at high charging power levels and high penetrations.
3.2. Average Charging Rate
In order to estimate the impact on the user comfort due to prolonged charging times caused by the control mechanism, the relative average charging rate was examined. Table 4 summarizes the average charging power normalized to the respective nominal charging power for the scenarios and penetrations considered. Already for the case of lowest load increase (kW charging rate at 5% penetration), a significant impact with a reduction of 20% is observed with the controlling. In the extreme case of a high charging power of 11kW and full EV penetration, a noticeable impact on the charging rate of 57% is observed. For the increasing penetrations from low 5% to high 100%, the average charging rate reduces by over 10% for all the charging power levels considered.
Table 4.
Normalized average charging rate for the droop controlled scenarios (C1–C3).
3.3. Peak Power
As a consequence of the changes in the charging demand due to the intervention of the controller, the power profile at the transformer changes, which, in turn, affects the peak power. To show this effect, the peak power and the relative reduction in the peak power at the transformer resulting from the droop controlled charging are depicted in Figure 5. Peak power increases with progressive EV penetration in all six scenarios. At high penetrations, the peak power exceeds the transformer rated capacity in the uncontrolled scenarios (U*). In the voltage droop controlled scenarios, a consistent reduction in relative peak power at the transformer could be noticed: from %, over %, up to % for the different penetration rates of 5%, 50%, and 100%, respectively. This shows that in addition to the voltage regulation services provided to the DSOs, the method provides a reduction in peak power at the transformer, preventing potential transformer upgrades.
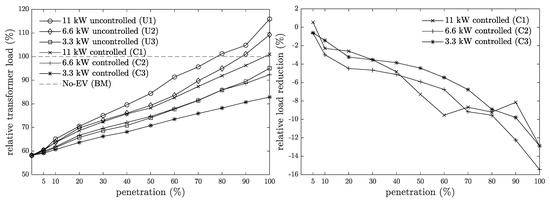
Figure 5.
Maximum relative peak power at the transformer for the six scenarios (left), relative reduction in the peak power at the transformer by the voltage droop controlling (right).
3.4. Nodal Voltages
We conducted a quantitative analysis of the number of under voltage events in order to gain a more in-depth understanding of the voltage droop control. The histograms in Figure 6 compare the number of under voltage events for the six scenarios at 10% and 90% penetration. The histograms show that the number of under voltage events has been reduced in the three droop controlled scenarios (C1–C3) for both penetrations. In addition, the evaluation confirms the elimination of severe under voltage events due to the droop control, which occur in uncontrolled charging at high penetrations. Furthermore, it clearly shows the direct dependency of the relative reduction in under voltage events on the EV penetration rate.
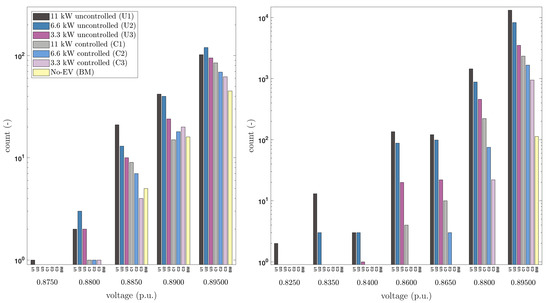
Figure 6.
Comparison of the histograms of the voltages below the lower voltage threshold p.u. for the droop controlled EV charging and uncontrolled EV charging for 10% EV penetration (left), and 90% EV penetration (right).
4. Conclusions
This paper presents a detailed systematic study on the voltage-based droop control method for EV charging to determine its aptitude in view of recent trends in residential charging infrastructure. We evaluated the results using long-term load flow simulations, considering real topological parameters of a residential grid and load profiles. The impact on the grid voltage status was investigated, considering a wide range of EV penetrations and three currently available residential charging power levels focusing particularly on 11kW charging.
The results indicate that, at low EV charging power levels, the voltage-based droop control method facilitate the compliance with the the voltage magnitude standards defined in ENE50160 for the full range of EV penetrations. For EV penetrations up to 80%, the droop-controller is capable of mitigating the violations even for 11kW charging ensuring the compliance with the voltage magnitude standards as discussed in previously published literature. However, the grid is not in compliance with the EN50160 standards with a high penetrations of EVs charging at 11kW charging, as the droop control is not capable of curtailing the voltage deviation such that it is kept above the limit of % at all times.
In addition to the grid voltage improvements, the droop controller is also capable of providing peak power reduction at the transformer by over 10% at 100% penetration. In this manner, voltage droop method has the potential to reduce the stress on the distribution transformers. However, the EV users will experience longer charging times most particularly at 11kW charging as charging rates are reduced by up to 43%. This limitation can be ameliorated by adding local PV production, which can recover the charging droops.
The voltage-based control method is discussed as a relatively inexpensive and easy-to-deploy solution, which only requires the local voltage measurements at the point of connection. However, it is highly necessary to investigate the usability of the method also for upcoming trends in the EV deployment, as the grid planning and investments are intended for long-term. Our results show that the method does not guarantee the safe operating conditions in the grids at high charging power levels and high penetrations. However, it can be concluded that the approach is well suited for the early stages of EV market penetration, and even can provide a solution for high penetration rates, if low nominal EV charging power levels are deployed which would allow DSOs more time until sophisticated methods are available.
Author Contributions
Conceptualization, P.K.; methodology, P.K.; software, M.A.S.T.I.; validation, M.A.S.T.I.; formal analysis, M.A.S.T.I.; data curation, M.A.S.T.I. and R.L.-B.; writing—original draft preparation, M.A.S.T.I.; writing—review and editing, P.K., M.A.S.T.I. and R.L.-B.; supervision, P.K.; funding acquisition, P.K. All authors have read and agreed to the published version of the manuscript.
Funding
The financial support by the Austrian Federal Ministry of Science, Research and Economy and the National Foundation for Research, Technology and Development is gratefully acknowledged.
Institutional Review Board Statement
Not applicable.
Informed Consent Statement
Not applicable.
Data Availability Statement
The data that support the findings of this study are available from the corresponding author upon request.
Acknowledgments
The authors are grateful to the project partner Vorarlberger Energienetze GmbH for providing the real data for the distribution grid model. A special thank you to Lukas Schober for the fruitful discussions on voltage-based control, who brought our attention to this very interesting topic. We would like to acknowledge Markus Preißinger for his comprehensive review and valuable insights to the paper.
Conflicts of Interest
The authors declare no conflict of interest.
References
- Shao, S.; Pipattanasomporn, M.; Rahman, S. Grid integration of electric vehicles and demand response with customer choice. IEEE Trans. Smart Grid 2012, 3, 543–550. [Google Scholar] [CrossRef]
- Babrowski, S.; Heinrichs, H.; Jochem, P.; Fichtner, W. Load shift potential of electric vehicles in Europe. J. Power Sources 2014, 255, 283–293. [Google Scholar] [CrossRef] [Green Version]
- Green, R.C., II; Wang, L.; Alam, M. The impact of plug-in hybrid electric vehicles on distribution networks: A review and outlook. Renew. Sustain. Energy Rev. 2011, 15, 544–553. [Google Scholar] [CrossRef]
- Kelly, L.; Rowe, A.; Wild, P. Analyzing the impacts of plug-in electric vehicles on distribution networks in British Columbia. In Proceedings of the 2009 IEEE Electrical Power &Energy Conference (EPEC), Montreal, QC, Canada, 22–23 October 2009; pp. 1–6. [Google Scholar]
- Clement, K.; Haesen, E.; Driesen, J. Coordinated charging of multiple plug-in hybrid electric vehicles in residential distribution grids. In Proceedings of the 2009 IEEE/PES Power Systems Conference and Exposition, Seattle, WA, USA, 15–18 March 2009; pp. 1–7. [Google Scholar]
- Al-Awami, A.T.; Sortomme, E.; Akhtar, G.M.A.; Faddel, S. A voltage-based controller for an electric-vehicle charger. IEEE Trans. Veh. Technol. 2015, 65, 4185–4196. [Google Scholar] [CrossRef]
- Lopes, J.A.P.; Soares, F.J.; Almeida, P.M.R. Integration of electric vehicles in the electric power system. Proc. IEEE 2010, 99, 168–183. [Google Scholar] [CrossRef] [Green Version]
- Shareef, H.; Islam, M.M.; Mohamed, A. A review of the stage-of-the-art charging technologies, placement methodologies, and impacts of electric vehicles. Renew. Sustain. Energy Rev. 2016, 64, 403–420. [Google Scholar] [CrossRef]
- O’Connell, N.; Wu, Q.; Østergaard, J.; Nielsen, A.H.; Cha, S.T.; Ding, Y. Electric vehicle (EV) charging management with dynamic distribution system tariff. In Proceedings of the 2011 2nd IEEE PES International Conference and Exhibition on Innovative Smart Grid Technologies, Manchester, UK, 5–7 December 2011; pp. 1–7. [Google Scholar]
- Amjad, M.; Ahmad, A.; Rehmani, M.H.; Umer, T. A review of EVs charging: From the perspective of energy optimization, optimization approaches, and charging techniques. Transp. Res. Part D Transp. Environ. 2018, 62, 386–417. [Google Scholar] [CrossRef]
- García-Villalobos, J.; Zamora, I.; San Martín, J.I.; Asensio, F.J.; Aperribay, V. Plug-in electric vehicles in electric distribution networks: A review of smart charging approaches. Renew. Sustain. Energy Rev. 2014, 38, 717–731. [Google Scholar] [CrossRef]
- Solanke, T.U.; Ramachandaramurthy, V.K.; Yong, J.Y.; Pasupuleti, J.; Kasinathan, P.; Rajagopalan, A. A review of strategic charging–discharging control of grid-connected electric vehicles. J. Energy Storage 2020, 28, 101193. [Google Scholar] [CrossRef]
- Geth, F.; Leemput, N.; Van Roy, J.; Büscher, J.; Ponnette, R.; Driesen, J. Voltage droop charging of electric vehicles in a residential distribution feeder. In Proceedings of the 2012 3rd IEEE PES Innovative Smart Grid Technologies Europe (ISGT Europe), Berlin, Germany, 14–17 October 2012; pp. 1–8. [Google Scholar]
- Leemput, N.; Geth, F.; Van Roy, J.; Delnooz, A.; Büscher, J.; Driesen, J. Impact of electric vehicle on-board single-phase charging strategies on a flemish residential grid. IEEE Trans. Smart Grid 2014, 5, 1815–1822. [Google Scholar] [CrossRef]
- Álvarez, J.N.; Knezović, K.; Marinelli, M. Analysis and comparison of voltage dependent charging strategies for single-phase electric vehicles in an unbalanced Danish distribution grid. In Proceedings of the 2016 51st International Universities Power Engineering Conference (UPEC), Coimbra, Portugal, 6–9 September 2016; pp. 1–6. [Google Scholar]
- Xia, L.; Mareels, I.; Alpcan, T.; Brazil, M.; de Hoog, J.; Thomas, D.A. A distributed electric vehicle charging management algorithm using only local measurements. In Proceedings of the ISGT 2014, Washington, DC, USA, 19–22 February 2014; pp. 1–5. [Google Scholar]
- Faddel, S.; Al-Awami, A.T.; Mohammed, O.A. Charge control and operation of electric vehicles in power grids: A review. Energies 2018, 11, 701. [Google Scholar] [CrossRef] [Green Version]
- CENELEC. Voltage Characteristics of Electricity Supplied by Public Electricity Networks; Technical Report EN50160; German Institute for Standardisation: Berlin, Germany, 2010. [Google Scholar]
- Mohassel, R.R.; Fung, A.; Mohammadi, F.; Raahemifar, K. A survey on advanced metering infrastructure. Int. J. Electr. Power Energy Syst. 2014, 63, 473–484. [Google Scholar] [CrossRef] [Green Version]
- Vorarlberger Energienetze GmbH. Available online: https://www.vorarlbergnetz.at/ (accessed on 20 December 2019).
- Schuler, M.; Faessler, B.; Preißinger, M.; Kepplinger, P. A Method for Grid Simulation Assessing Demand Side Management Strategies. In Tagungsband des 12. Forschungsforum der österreichischen Fachhochschulen (FFH) 2018; Fachhochschule Salzburg GmbH: Salzburg, Austria, 2018; p. 11. [Google Scholar]
- MATLAB. Version: 9.7.0,1165820 (R2019a); The MathWorks Inc.: Natick, MA, USA, 2019. [Google Scholar]
- Ghatak, U.; Mukherjee, V. An improved load flow technique based on load current injection for modern distribution system. Int. J. Electr. Power Energy Syst. 2017, 84, 168–181. [Google Scholar] [CrossRef]
- illwerke vkw AG. Available online: https://www.vkw.at/ (accessed on 15 December 2019).
- Synthetic Load Profiles APCS—Power Clearing & Settlement. Available online: https://www.apcs.at/en/clearing/physical-clearing/synthetic-load-profiles (accessed on 15 December 2019).
- Nissan-Leaf-Data-Sheet. Available online: https://goelectricyyc.com/wp-content/uploads/2019/07/Nissan-Leaf-Data-Sheet.pdf (accessed on 15 July 2020).
- Tomschy, R.; Herry, M.; Sammer, G.; Klementschitz, R.; Riegler, S.; Follmer, R.; Gruschwitz, D.; Josef, F.; Gensasz, S.; Kirnbauer, R.; et al. Österreich Unterwegs 2013/2014; Bundesministerium für Verkehr, Innovation und Technologie: Wien, Juni, 2016. [Google Scholar]
- Van Roy, J.; Leemput, N.; De Breucker, S.; Geth, F.; Tant, P.; Driesen, J. An availability analysis and energy consumption model for a flemish fleet of electric vehicles. In Proceedings of the European Electric Vehicle Congress (EEVC), Brussels, Belgium, 26–28 October 2011. [Google Scholar]
Publisher’s Note: MDPI stays neutral with regard to jurisdictional claims in published maps and institutional affiliations. |
© 2021 by the authors. Licensee MDPI, Basel, Switzerland. This article is an open access article distributed under the terms and conditions of the Creative Commons Attribution (CC BY) license (https://creativecommons.org/licenses/by/4.0/).