1. Introduction
Hydroelectricity is one of the more established forms of renewable energy, catering for up to 16.4% of world’s electricity consumption [
1]. Power generation in power plants is accomplished by connecting synchronous generators and induction generators in the power transmission grid. Several papers discuss the frequency control and protection requirements for the parallel connection of induction machines and synchronous machines in the power grid [
2,
3]. Pham [
2] describes the inherent issues of connecting the induction machine to a power grid. The author analyzes power flow, short circuit, stability and protective devices. The results solve problems related to excitation, overvoltage, harmonic flow and system failures. Pham [
2] indicates induction machines for power cogeneration projects due to low cost, simplicity of operation, low maintenance and lack of synchronization.
Most electrical power systems can be simulated to reproduce in computational environment the characteristics of the real system. Simulations reduce project costs and make predictions for the systems analyzed. In the literature there are several works that present simulation for parallel operation of induction machines and synchronous machines connected to power grid [
4,
5]. Bogalecka [
5] presents a computational model of the induction machine connected to the distribution network in parallel with the synchronous machine, where the induction machine control system regulates active and reactive power, voltage and frequency.
To design the simulation, it is needed the modeling for the real system and all parameters precisely identified. Modeling the power generation system require knowledge of generator parameters the classical procedures to obtain machine parameters are performed according to IEEE standards. IEEE STD 115 [
6], establishes the procedures for traditional testing of synchronous machines, and IEEE STD 112 [
7] establishes tests for induction machines.
Old machines present specific obstacles to obtain electrical parameters, such as: data tag loss, component aging, parts swap, among others [
8]. Performing tests to obtain the electrical parameters of an old or refurbished machine is laborious. Obtaining these parameters at the machine operating site streamlines and reduces the simulation process cost. Furthermore, classical tests for induction machines and synchronous machines consist of laboratory procedures and are difficult to perform, especially in machine operating environment [
9]. Goldemberg et al. [
10] obtains model for the induction machine through analytical process that establishes the equivalent circuit through catalog data and numerical calculation. The obtained models results are validated by comparing the simulated results with experimental data. The methodology proposed by Goldemberg et al. reproduces static and dynamic behavior, and makes predictions on tested induction motors.
The synchronous generator parameters can be determined using the load rejection test [
11]. Zaker et al. [
11] propose a novel method to improve the synchronous generator parameters-estimation, taking the saturation effect. For increasing the estimation, were performed load rejection tests for axis
parameters, taking into account the saturation. A load angle measurer was designed and built to extract
components for the stator terminal voltage and current. The validation try-outs were performed in distinct operational points of the system and, the results compared to simulations using the estimated parameters. The results showed that the proposed method can precisely estimate the synchronous generator parameters, considering the saturation effect.
In the research, some methods are used to estimating parameters for simplified generators, as the Kalman [
12] filter and the Trajectory Sensitivity Method (TSM) [
13]. Farias et al. [
13] propose an online hybrid method to estimate the transitional model parameters for induction generators, from disturbed measurements. The hybrid algorithm based on trajectory sensitivity and the mapping optimization of the mean-variance uses practical measurements, as voltage and current on the generator terminals. The method was tested using real measurements obtained from a small energy system designed in a laboratory. The results shown the success of catching the correct estimations and the model capacity to represent precisely the system dynamic response.
Another method to obtain the machines internal parameters at the workplace is the parametric regression [
14]. Parametric regression is the methodology used to determine the internal parameter values of real systems using optimization process [
15,
16]. Parameter estimation is addressed in [
17], using a set of internal measurements which are difficult to obtain in practice. Le and Wilson [
18] apply least squares estimators to obtain synchronous machine parameters with online measurements, applying perturbations to machine terminals. The advantage of the method proposed by Le and Wilson is that only requires linear optimization techniques to determine the parameters, ensuring convergence. The classical least squares estimator penalizes the errors for each measurement equally. In several practical situations, there need distinct weights for some error values. As a disadvantage, increasing uncertainty for the measurements can happen, causing noises in the data. The results indicate that the method can be used to identify equivalent dynamic system models.
González-Cagigal et al. [
19] present a parameter estimation technique for generation sets. The research includes the synchronous machine itself along with the whole set of regulators, as: Speed Governor, Automatic Voltage Regulator and Power System Stabilizer. Both state and parameters from these elements are jointly estimated using Unscented Kalman Filters (UKF) and measurements obtained at the generator terminal bus. A UKF implementation is proposed to perform the joint estimation of the state variables and parameters of a fully regulated two-axis synchronous machine squares estimators to obtain synchronous machine parameters with online measurements, applying perturbations to machine terminals. The model requires an initial state that are obtained by solving the steady-state case. A case study has shown that the proposed estimator yields accurate enough results when using different initialization strategies.
There are several studies that require the system internal parameters, among them, the study of repowering of plants to fulfill the growing demand for electricity. Repowering is indicated for hydropower plants that are in operation for over 30 years [
20]. The natural aging process of the units is inevitable and consequently, after a few years, the unit performance decreases [
21]. The typical repowering case occurs when there is idle power capacity in the turbine that is not being harnessed by the generator already installed. In some cases the parallelism is used for repowering, which occurs by adding the second generator coupled to the turbine shaft, in this case the induction generator can be used [
22].
Gagliano et al. [
23] perform study to evaluate the technical and economic feasibility of repowering the Catarrate hydro power plant, in disuse in Italy. A comparison is made between the data obtained through simulation and the generation data from the year of 1972. The results indicate that the power plant contributes to the local community energy independence, with expected annual renewable energy production of approximately 220 MWh, preserving historical industrial heritage. Maldonado et al. [
20] present a study case for repowering of a SHP in Sodre, São Paulo/Brazil. The aim is to present the viability of repowering, increasing the generation of electricity for the system and meeting future demands. The power plant has three generators of 200 kW each, and the results indicate that repowering can provide up to
of the installed power, replacing the 200 kW generators currently in use with new generators of 350 kW. The technical and economic feasibility, besides considering equipment values and current electricity costs, incorporates environmental and social benefits, especially the generation and market of carbon credit, allowing the amortization of invested capital.
Goldemberg et al. [
10] determine the induction machine parameters through the catalog data, regardless of parameter changes due to machine aging, refurbishment or modernization. Le and Wilson [
18] present method that applies disturbances in the synchronous machine terminals to determine the internal parameters, without considering (i) repowering, (ii) parallelism with another type of machine and (iii) electric power grid. González-Cagigal et al. [
19] present method is based on the Unscented Kalman Filter to estimate parameters of fully synchronous generator, without considering experimental tests for the initial data. Zaker et al. [
11] identify the synchronous generator parameters using two load rejection tests: the first for axis
d parameters and the other for axis
q parameters. In [
11] are used machine catalog data, not considering remodeled and old machines. Gagliano et al. [
23] evaluate the technical and economic viability of repowering, without consider, among other parameters, the changing due to machine aging. The gap explored by this work is the use of parametric regression as a process to find the parameters regarding the systems joint operation: (i) electricity distribution network, (ii) nonlinear load, (iii) induction machine and (iv) synchronous machine, operating in parallel on the repowering system.
The main objective of this work is to apply parametric regression in the determination of electrical parameters of synchronous and induction generators operating in parallel in the electric power repowering system. The specific objectives are: (i) determine the electrical parameters of synchronous machine and induction machine, (ii) validate the system repowering model composed by the synchronous generator and induction generator operating in parallel, subject to nonlinear loads, and connected to the common bus, (iii) analyze the results of computer simulation, regarding the system repowering and harmonic flow and (iv) perform computational model validation with the real system.
This study is applied to old machines that have already been remodeled and are difficult to remove from the workplace. This paper is structured as follows:
Section 2 presents the theoretical basis for modeling the three-phase induction generator and three-phase synchronous generator, as well as the study of optimization and parametric regression,
Section 3 details the proposed methodology for estimating the system internal parameters, describe the parameter optimization and validate the system,
Section 3 continues by introducing the analysis of the repowering data and harmonic flow,
Section 4 presents the experimental results using the proposed methodology and the discussion and
Section 5 presents the conclusions.
2. Theoretical Background
Based on the existing theory about synchronous machine and induction machine, it is possible to prepare the simulation and through the optimization process, adjust the model to obtain the electrical parameters. Using the adjusted computational model, it is possible to analyze the electrical machines connected to the power grid and subject to nonlinear loads.
2.1. Three-Phase Induction Generator
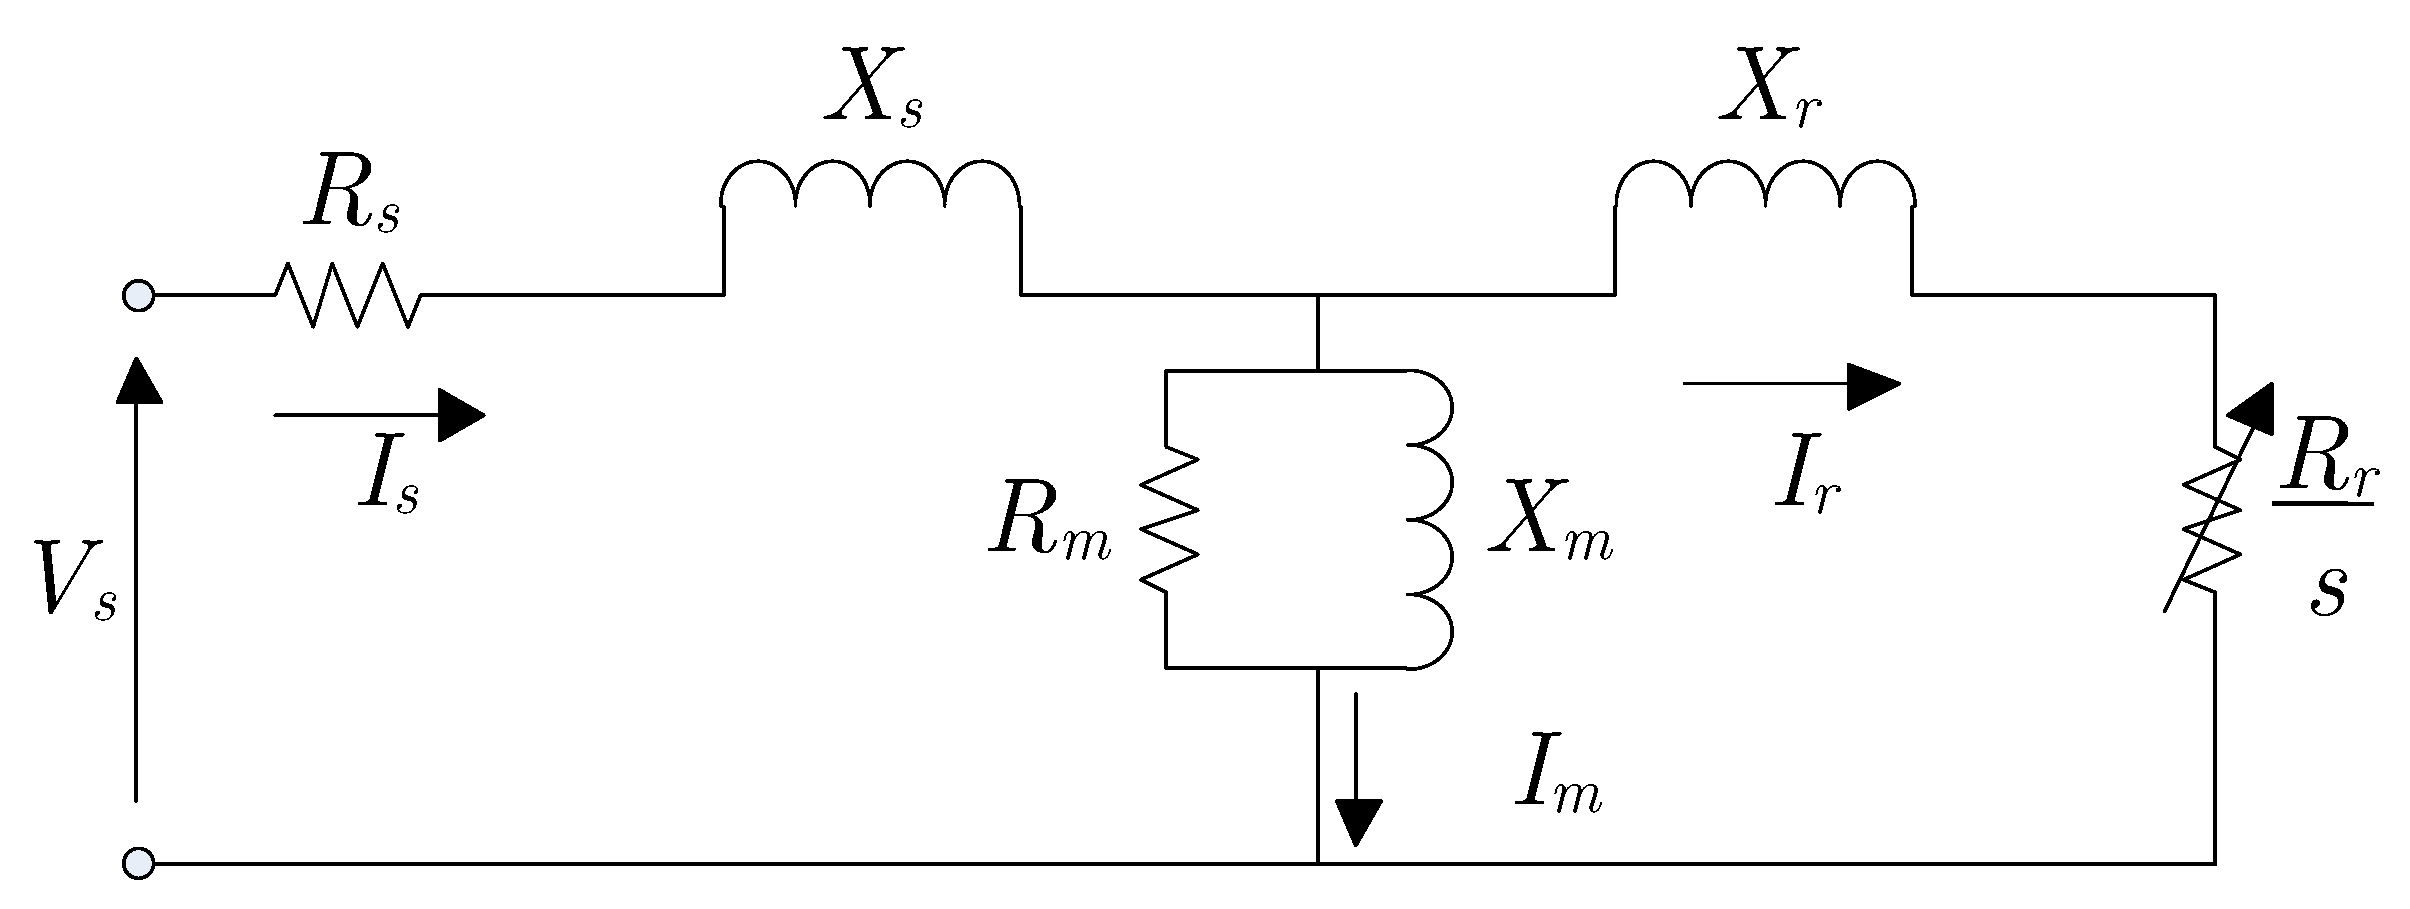
The equivalent electrical circuit that models the induction machine, represented by phase and referred to the stator is illustrated in
Figure 1, wherein
is the stator resistance,
is the stator leakage reactance,
is the rotor resistance referred to the stator,
is the rotor leakage reactance referred to the stator,
is the magnetization resistance,
is the magnetization reactance,
is the stator current,
is the rotor current,
is the magnetization current,
s is the slip and
is the stator phase voltage [
24].
The induction machine mathematical model is composed of fundamental parameters such as: resistances, self-inductance and mutual inductance. For computer simulation of models is necessary identify the machine fundamental parameters, which are usually provided by the manufacturers. When the fundamental parameters are not known it is possible to perform tests on the induction machine to obtain them. The fundamental parameters can be determined by performing several types of tests [
24,
25], where is determined for example:
,
,
,
,
and
.
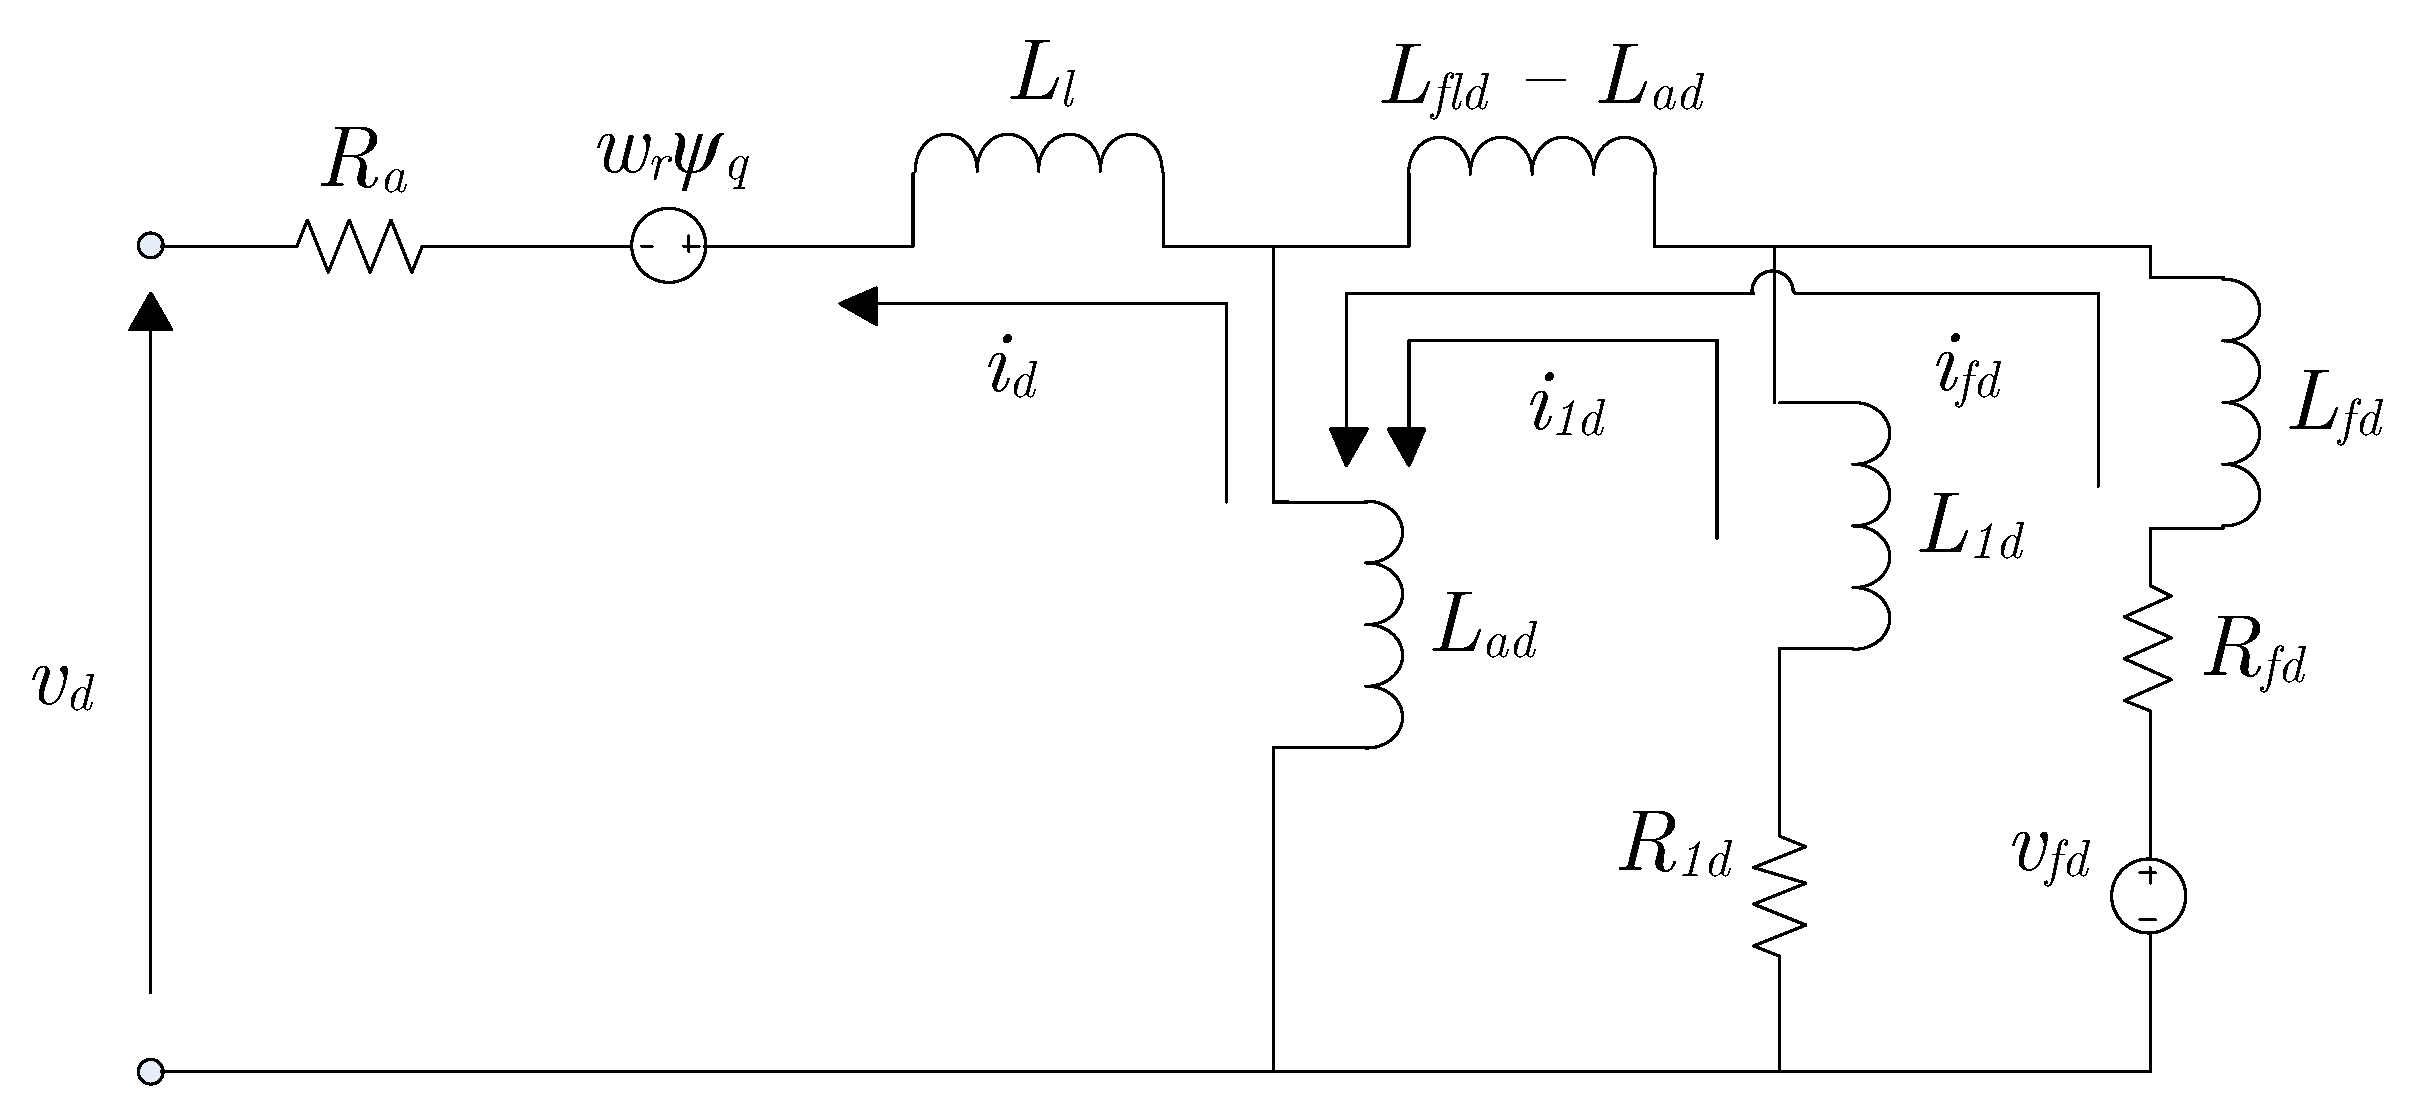
2.2. Three-Phase Synchronous Generator
To simplify the mathematical development of the synchronous machine, the Park transformation [
24], also known as the
model, is applied. The equivalent electrical circuits that model the synchronous machine represented in the
reference system with fixed rotor reference for the direct and quadrature axis [
24], respectively, are illustrated in
Figure 2 and
Figure 3.
Wherein is the phase voltage of the direct shaft stator, is the phase voltage of the quadrature axis stator, is the field winding voltage, is the direct current stator phase current, is the direct-axis k-th damping winding current, is the field winding current, is the quadrature axis stator phase current, is the quadrature shaft k-th damping winding current, is the direct-axis flux linkages, is the axis flux linkages quadrature, is the direct-axis mutual inductance between the armature and the rotor, is the quadrature axis mutual inductance between the armature and the rotor, is the leakage inductance, is the field winding leakage inductance, is the direct-axis damper winding leakage inductance, is the scatter inductance of the quadrature axis damping winding, is the inductance of the second quadrature axis damping winding and is the flux linkage between the field winding and damper winding.
To computationally simulate models, it is necessary to identify the fundamental machine parameters, which are generally provided by the manufacturers. When the fundamental parameters are not known, it is possible to perform tests on synchronous machines to obtain the standardized parameters, which are functions of the fundamental parameters. Standardized parameters can be determined by performing several types of tests [
24,
26].
Standardized parameters that can be determined are: the direct axis and quadrature axis synchronous reactances and , the direct axis and quadrature axis transient reactances and , the subtransitent straight axis and quadrature axis reactances and , the leakage reactance , the open circuit and short circuit transient time constants and , the open circuit and short circuit subtransitional time constants and , the stator resistance . The non-standardized parameters, can be determined by parametric regression: inertia coefficient and friction factor F, the leakage inductance , rotor resistance referred to stator , rotor inductance referred to stator and the magnetization inductance .
2.3. Optimization Process Applied
The optimization process involves three distinct steps: (i) define the optimization method, (ii) simulate the system to be optimized and (iii) evaluate the problem by the evaluation function
, wherein
is the vector with the parameters to be optimized.
Figure 4 illustrates the flowchart of optimization process.
There are several optimization methods, both deterministic and heuristic. Analyzing the existing algorithms from deterministic optimization method, the Nelder–Mead algorithm [
27] is the most widely applied. It is a method based on the creation of dynamic simplex, continuously modified by rules, determining which is the best rule to suit the local configuration. The method uses non-isometric movements to speed up the search. At each iteration the worst vertex is replaced by a new vertex obtained through the movements known as: reflection, expansion or contraction of the worst vertex.
For heuristic methods, genetic algorithm (GA) is one of the most widely used. It starts the search after setting some internal parameters, which are: (i) population size represented by matrix
where population matrix has
m individuals (possible solution of problem) with
n genes (number of parameters to be optimized), (ii) crossover rate which is defined as the value of the probability of crossing parent data; (iii) mutation rate which is defined as the rate of occurrence of the mutation operation on a given chromosome; (iv) stop criterion which is the parameter that indicates when the search process should cease and (v) maximum number of generations
. Control of these genetic algorithm parameters affects their performance and are usually chosen empirically as they vary from problem to problem [
28].
The classical genetic algorithm the initial population, which is the matrix formed by the problem possible solution, is simulated and evaluated by . If the optimal solution is not found, the process becomes iterative through genetic manipulators and genetic operators. In classical GA, genetic manipulators are formed by elitism and selection, in which elitism consists of copying/keeping the best individual in the population and ensuring that they will participate in the next generation. This ensures that in the worst case, the best individual does not get lost. Selection is the mechanism that chooses individuals from the population that will generate the individuals from the next population (parents) according to the values obtained by for each individual. In classical GA, genetic operators are formed by recombination and mutation. Recombination is the operator responsible for genetic exchange during the breeding process, allowing future generations to inherit characteristics from previous generations. Mutation is the process of random alteration of genes, either in location or content. This operator is important for diversity and evolution, and can make the individuals more fit or not, to be eliminated in natural selection.
2.4. Parametric Regression
Parametric regression, illustrated in
Figure 5, is a methodology used to determine internal parameter values of real systems using optimization process. The output values for the model and the real system are obtained using the same input variables for both systems. With the output values of both (model and real system), the optimization process is used to modify the values of the model’s internal parameters, comparing the output of real system with the model output [
29], in order to reach equal or approximately equal outputs values for both systems.
The steps for the parametric regression process are: (i) construction of a model representing the real system in which the internal parameters are to be estimated, (ii) experimental tests dealing with the collection of experimental input and output data in the real system, (iii) experimental output that represents the data collected to validate the values of the system internal parameters, (iv) simulated output representing the tested values of the system internal parameters, (v) comparison, which is the validation criterion, where the actual system output values are compared to the model (simulated) output values and (vi) optimization which is the analytical/numerical procedure that determines the parameters values to be tested.
The input-output data set for the real system are known and used in the model simulation. There is a simulation round for each sample. The input-output data set are confronted through the evaluation function. The system internal parameters values are obtained by the optimization process and will be determined athwart the optimization method solution.
The set of measurements for experimental tests should be performed with as much information as possible to better represent the system to be modeled. It is important that the experimental data for parameter optimization be different from the data for model comparison and validation, i.e., after optimizing the internal parameters, new input values not yet used in the tests are needed to compare with the simulated values using the optimized parameters.
3. Methodology
This study proposes to acquire all internal parameters for old and refurbished generator machines through the parametric regression method. By the system-modeling is possible to simulate and optimize the model parameters. The parametric regression methodology proposed in this work allows internal parameters optimizing of the generator, comparing the output data from the real system and simulator. The real system data can be obtained at the workplace, no need to remove the machinery. The optimization process sets the generator’s internal parameters aiming to build the model based on the system input-output data set.
The proposed methodology allows the performance of computational tests and analysis of the interconnected power system (IPS) from the validated real system model. The repowering model is composed of two parallel connected generating units subject to nonlinear loads, all connected to the same bus. For validation and analysis of repowering and harmonic distortions, data collection is performed through four measurement points strategically arranged in the real system and in the model.
3.1. Model Configuration
The system model consists of synchronous generator
, induction generator
and nonlinear load
. Nonlinear load
consists of a three-phase rectifier (
Three-Phase AC Voltage Controller—TPACVC) [
30] that provides power to lamp sets. The primary machine used for
is a diesel cycle engine and the primary machine for
is an induction motor with frequency inverter. The primary machines of
and
are fed through an isolated bus. Simulations are performed by connecting the nonlinear load
to the common bus. In these simulations the objective is to obtain the harmonical distortions of the electrical system illustrated in
Figure 6,where
is the primary feeder,
is the transformer,
,
,
are circuit breakers and
,
,
and
are electrical parameter meters. The
meter records data such as power and harmonic values to evaluate the increase in power generated and the harmonic changes in the system. In the measurement points the recorded data indicate respectively the
,
, and
that expresses the electrical relationships at the nonlinear load, induction generator, and synchronous generator terminals, respectively.
The simulation of the system shown in
Figure 6 is performed after creating the electrical system model. Using the created model, the methodology is developed as the procedures: after the load is connected, the synchronous generator
and the induction generator
are connected to the common bus. Then it is measured the generated power to verify the system repowering and the changes in the harmonic content, analyzing the effect of both generators in the system. After analyzing
and
in the system, the induction generator
is disconnected from the common bus and the effects of only
are measured. Following,
is disconnected and connects only
. Thus, it is possible to analyze of each generator separately and together, aiming to measure the effects produced by both and separately.
3.2. Parameter Estimation
For simulation of the electrical system illustrated in
Figure 6, the following values are necessary: (i) system input parameters and (ii) parameters of the equipment used. The input parameters for the simulation are the same as those adopted in the practical procedure that is used in the comparison between model and real system, as illustrated in
Figure 5. The equipment parameters are usually provided by the manufacturers. In the event of the absence of the equipment parameters, the parametric regression is used.
The parametric regression is performed separately for each equipment/machine, following the steps: (i) the Step 1 determines the parameters of the induction machine, where the system consists of induction generator
and the modeled power grid and (ii) the Step 2 determines the parameters of the synchronous machine, where the system is composed of synchronous generator
and the modeled power grid. The measurements for the parametric regression of
are performed using the device
and measurements for the parametric regression of
are performed using the device
as illustrated in
Figure 6.
For the induction generator the optimized constructive parameters are: (i) , (ii) , (iii) , (iv) and (v) . The system input parameter for is the speed . For the synchronous generator the optimized constructive parameters are: (i) and , (ii) , (iii) and , (iv) , (v) , (vi) and , (vii) , (viii) and (ix) F. The system input parameters for are the excitation voltage of the field and the mechanical power of the primary machine .
The methodology for parametric regression is developed in the following steps: (i) modeling of and generators, (ii) definition of the input parameters of generators and , (iii) model simulation and optimization of machine construction parameters (internal system parameters) and (iv) model validation by comparing the simulation output values with the values collected in the practical tests.
3.3. Parameter Optimization
The purpose of parametric regression is to obtain the internal parameters of and to adjust the model. The parametric regression method was performed in two steps: (i) Step 1: parametric regression for , with connected to the power grid and (ii) Step 2: parametric regression for , with connected to the main grid. Through practical tests, output data were collected in the system, varying the input parameters values for each generator connected to the grid. In practical tests, the nonlinear load was disconnected from the system.
The analyzed input parameters are (i) induction generator speed , (ii) mechanical power of the primary machine of , and (iii) excitation voltage of the synchronous generator field . The collected output parameters are (i) P, (ii) Q and (iii) S.
In the parametric regression method, the optimization process is repeated until the difference between the experimental output and the simulated output meets the stopping criteria (
Figure 5), obtaining the values of the internal parameters of the optimized model. After several attempts and tests with deterministic and heuristic optimization methods, it was decided to hybridize the Nelder–Mead and Genetic Algorithm (GA) methods, obtaining better results. The GA uses the uniform crossover operator and mutation operator with non-uniform probabilistic fine adjustment, changing values of the genes from the Gaussian distribution, guaranteeing the interval of each variable. Thus, each gene is disturbed by (
1), to promote local search.
where
r is the random number that is added to the gene value from the Gaussian distribution and
g is the current generation. The tournament selection method was used, and the initial population is randomly generated.
The GA starts the optimization process and, after some generations, delivers its best solution for the Nelder–Mead method. After completing its processing cycle, the Nelder–Mead method returns to the GA the best solution found, which will be part of the new population of solutions of the GA. The evaluation function used is given by:
wherein
is the current obtained experimentally,
is the largest value of the experimentally obtained current contained in the current vector × time,
is the simulated current obtained,
N represents the quantitative of collects for practical experiments and the simulations,
M is the number of phases for the current
I,
T is the number of samples in time.
and
use the same collect period, enabling comparison of the two time-vectors for the two cases since they are identical.
The Nelder–Mead algorithm does not need a derivative, it works with convex polyhedra, reducing the search space for the solution. GA is a heuristic algorithm with enough power in the mutation operator to get out of optimal locations. The proposed problem is a high nonlinearity problem. In this kind of problem, the algorithms should be hybridized to speed up the optimization process. In this case, it is necessary to choose a deterministic and heuristic algorithm, capable of solving high nonlinearity problems.
3.4. Simulation and Experimental Validation and Analysis
For the validation of the model, after optimizing the constructive parameters of the generators, a comparison between new practical data with new input values in the model and in the real system is necessary. Standard deviations are calculated for all validation tests performed for each separate equipment/machine and for the complete interconnected electrical power system (IPS). The parametric regression is performed on separate equipment/machines and then together so that the parameters found are representative in both steady state and transient or as close as possible. After validating the model, it is possible to perform tests and predictions.
Experimental tests in the real system are performed on the bench as shown in
Figure 6. Experimental data will be recorded by energy analyzers at measurement points
,
,
and
where the outputs collected are: (i) active power
P, (ii) reactive power
Q, (iii) apparent power
S, (iv) power factor
, (v) total harmonic distortion of voltage
and vi) total harmonic distortion of current
. From this data it is possible to perform: (i) verification of IPS repowering, (ii) evaluation of the harmonic content at the various measurement points of the system and (iii) comparison between simulated model and real system. It is still possible to perform analyses comparing the values obtained in the IPS with the limits defined by the IEEE STD 519 [
31] standards, where it is possible to verify the impact of voltage and current distortions on the IPS, subject to the nonlinear load at each measurement point.
4. Results
According to the proposed methodology it is possible to determine the electrical parameters of the synchronous machine and of the induction machine and validate the model presented in
Figure 6. Both units are powering in parallel the nonlinear load
composed by a Three-Phase AC Voltage Controller (TPACVC) that powers the three-phase 14 kW lamp sets. The primary machine of
was a
kW diesel engine and the primary machine of
was a
kW induction motor driven by a
kW frequency inverter. Information about the components used in the real system are given in
Table 1. The
machine was a KD 112 V model from the MWM brand while the
machine was a W22 model from the WEG brand. The harmonics performance about these machines was not provided by the catalog. Furthermore, the values would not represent reality, given that the machines were refurbished.
4.1. Parametric Regression
The parametric regression method was performed to determinate: (i) parametric regression for
and (ii) parametric regression for
. The input parameters values were varied, and the output data were collected in the practical procedure for each generator connected to the grid. The analyzed input parameters are: (i) induction generator speed
, (ii) mechanical power of the primary machine of
,
and (iii) excitation voltage of the synchronous generator field
. The collected output parameters are (i)
P, (ii)
Q and (iii)
S. The
Table 2 provides the parameters and variation range for
and
generators.
The optimization process was performed using the Nelder–Mead Genetic Algorithm (GA) hybrid method. The GA starts the optimization process with a random population of 100 individuals and, after 30 generations, delivers its best solution for the Nelder–Mead method. After, the Nelder–Mead method returns to the GA the best solution found, which will be part of the new population of solutions of the GA.
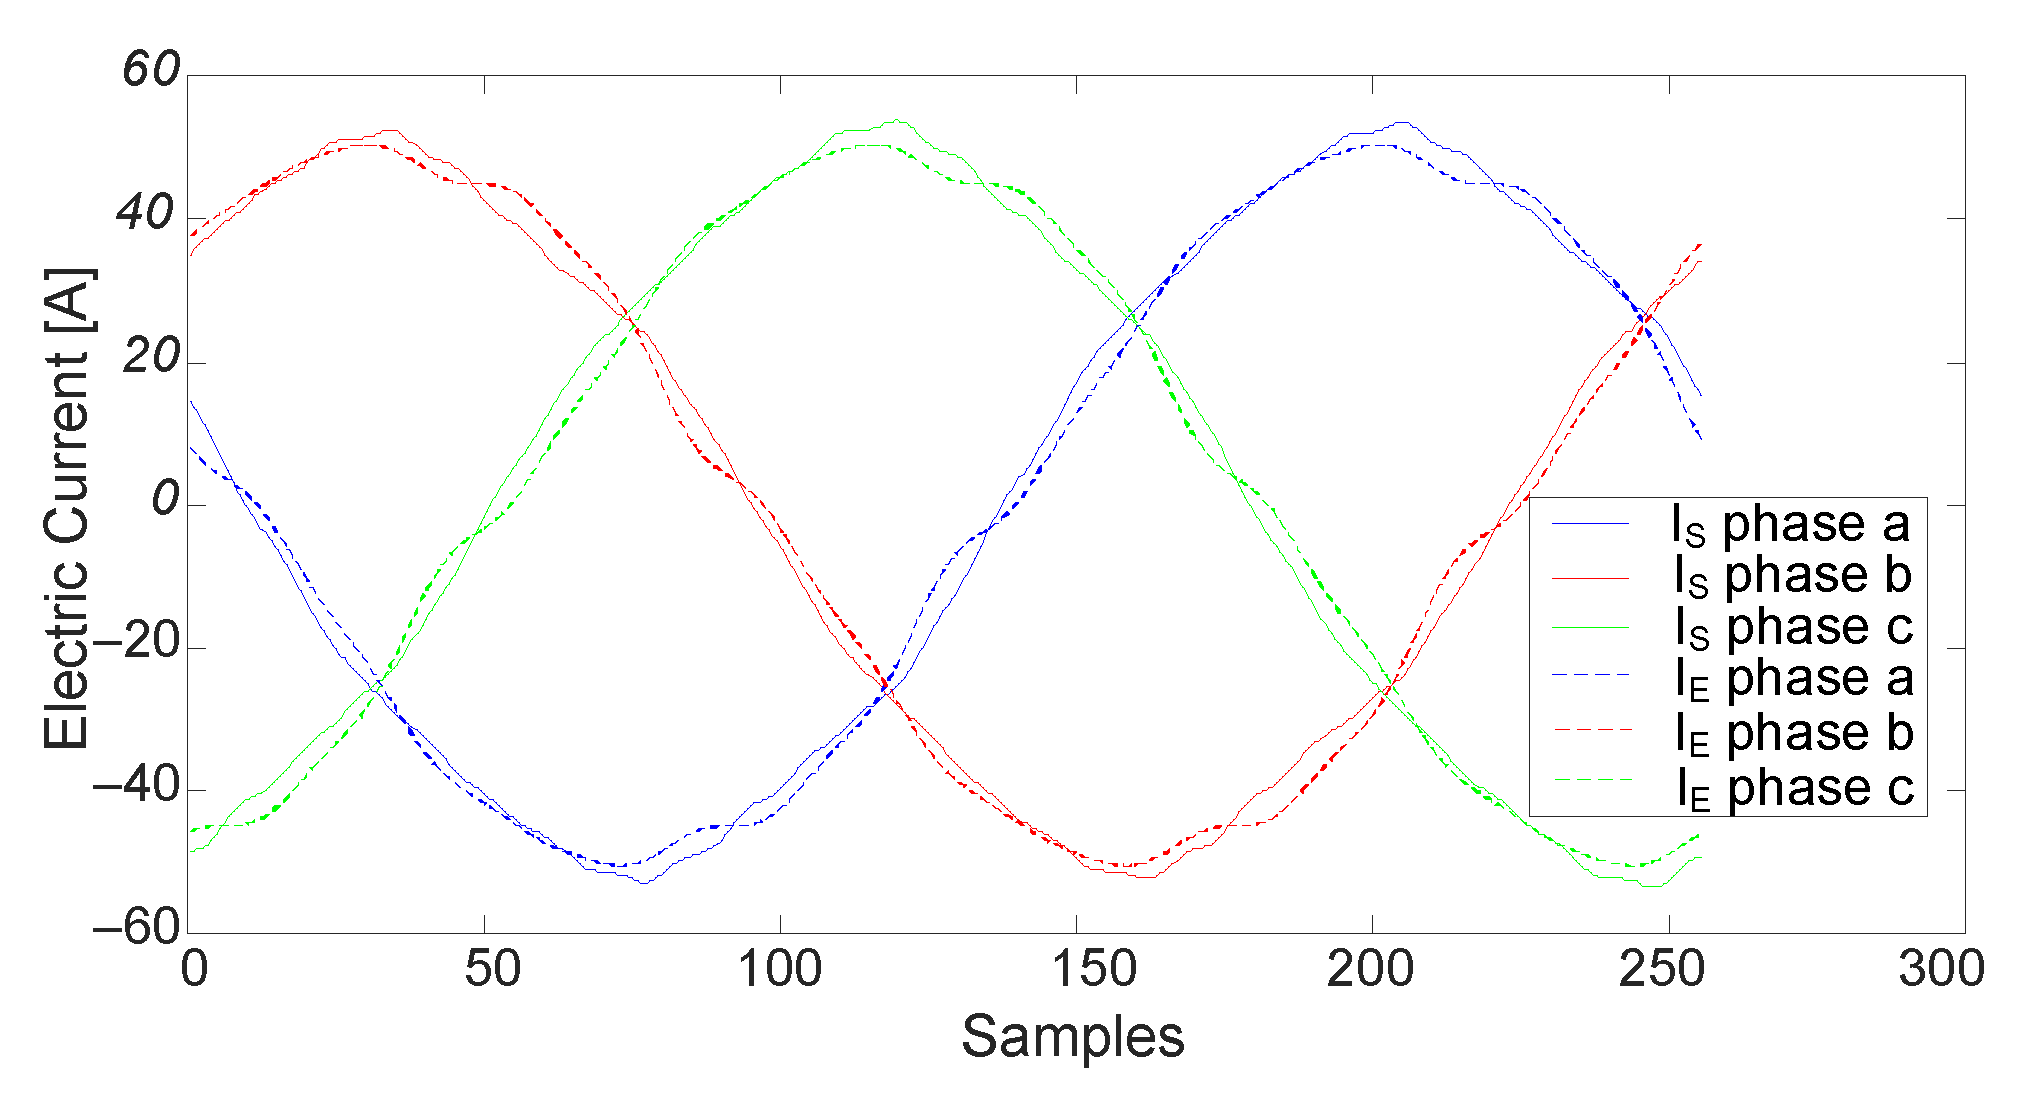
and
use the same collect period, enabling comparison of the two time-vectors for the two cases since they are identical. The sampling rate was 256 samples per cycle. The graphical results from
and
for
is shown in
Figure 7.
For the parametric regression of the induction machine, Step 1, the induction generator parameters presented in
Table 3 were obtained.
Table 3, besides setting the parameters obtained by parametric regression, also presents the values provided in the induction machine manufacturer’s manual.
The values of the induction machine parameters found by parametric regression differ from those provided by the manufacturer’s manual. This difference is less than 4 times. The difference in
is about 6 times.
Table 2 shows that the variation of the input parameter
is greater than 1800 rpm, which means that in all collections performed for the machine parametric regression method it was above the synchronous speed, functioning as an induction generator. Thus, in this work, the machine used as an induction generator was manufactured to operate as a motor, which possibly produced the difference between the values found and the values in the manufacturer’s manual. Another observation must be made in the parameters with the greatest differences,
and
, which are inductances related to magnetization and dispersion, respectively.
For the parametric regression of the synchronous machine, Step 2, the parameters shown in
Table 4 were obtained. The constructive parameters of the synchronous machine are found only by parametric regression, since it is an old and refurbished machine.
4.2. Model Validation
After determining the induction generator and synchronous generator parameters, the parameters must be validated to obtain the feasible model. Simulations and bench comparisons are performed with new input values. In the process of model validation, the simulation results are compared to the practice test results. For the practical tests, considered for the validation of the model, new collections are made with distinct operating conditions. For the optimization process we used the comparison of simulated and experimental current waveform, as presented in (
2). For validation, the following variables were used: (i)
P, (ii)
Q and (iii)
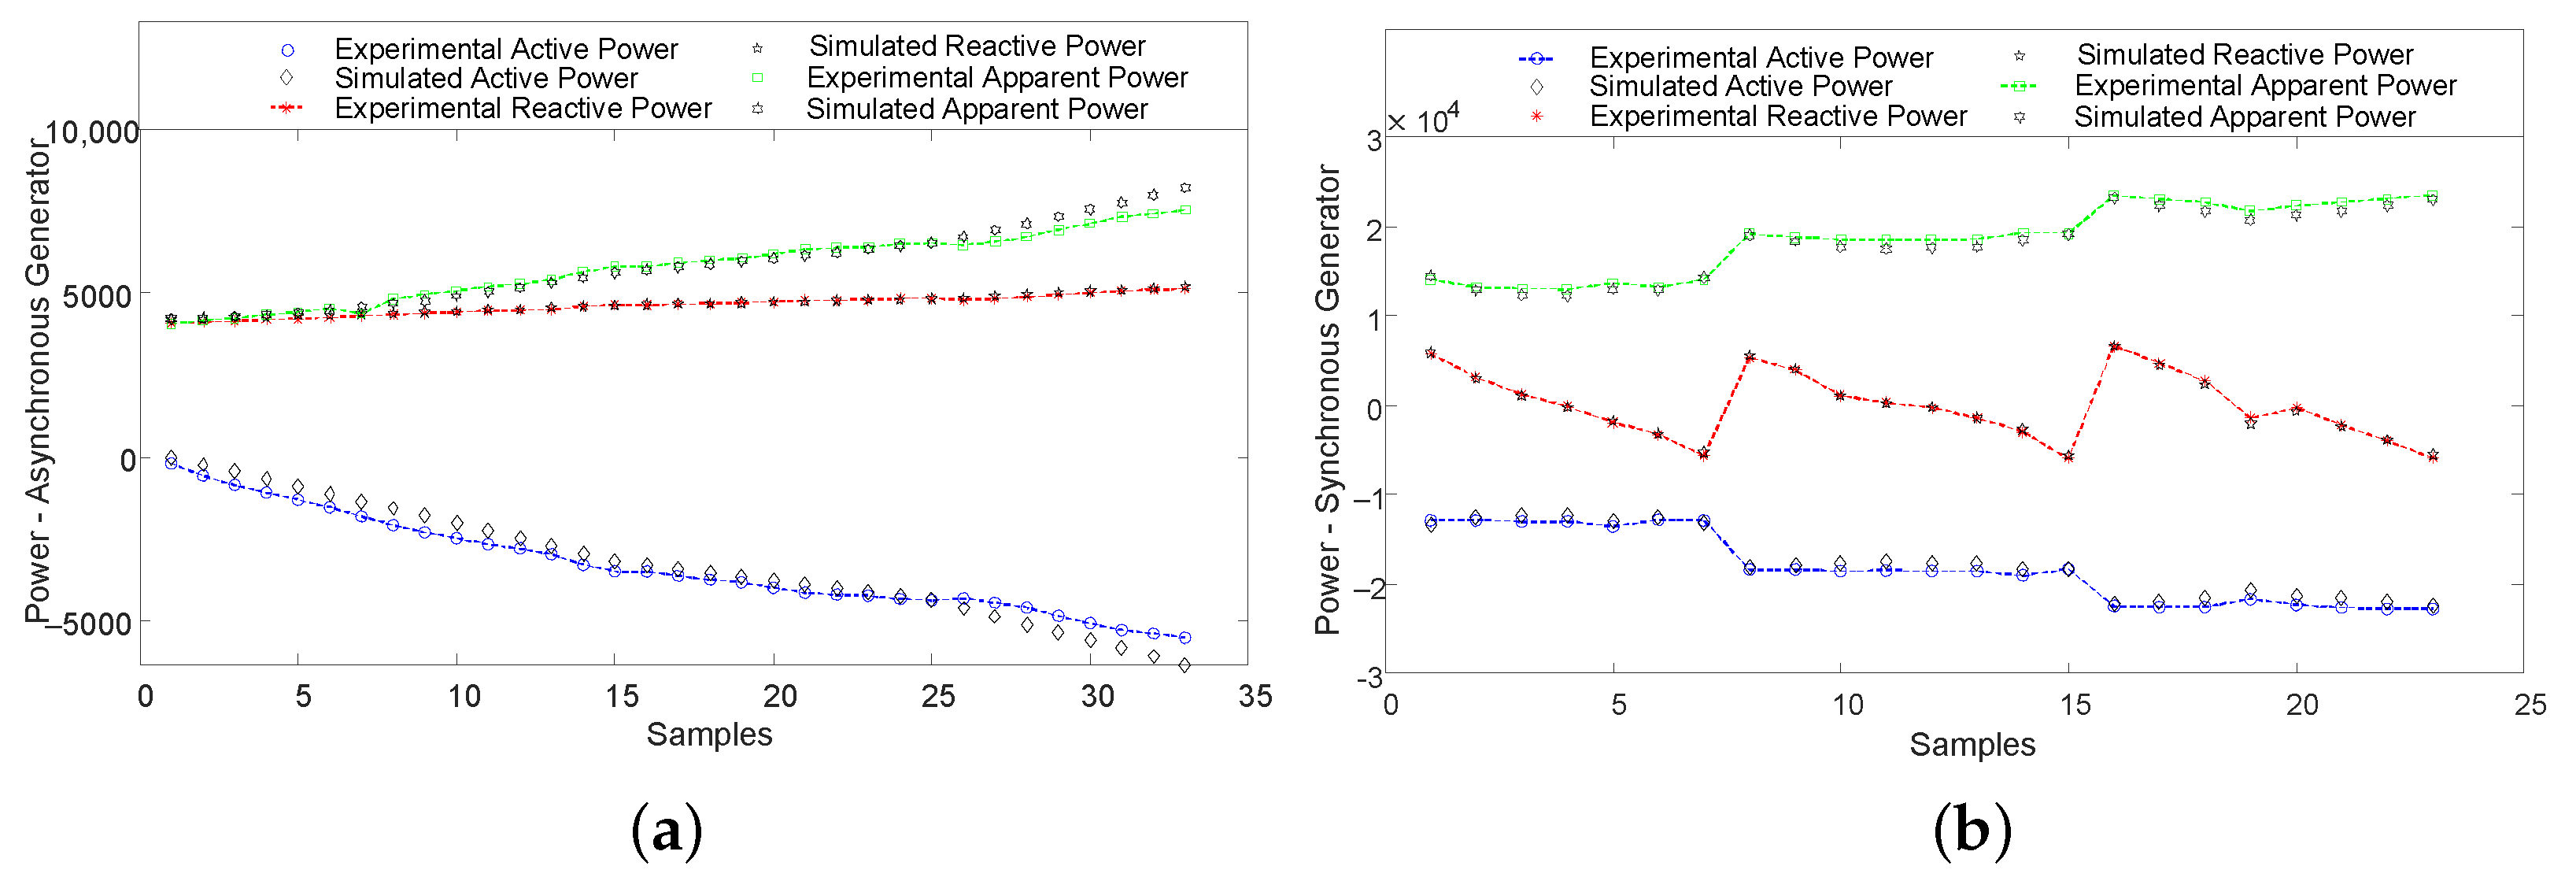
S. The input values are changed to analysis in new system operating regions. The comparison between experimental and simulated data for the induction generator and synchronous generator using the new input values is illustrated in
Figure 8.
Figure 9 presents the validation of the complete IPS system illustrated in
Figure 6, where the variables
P,
Q, and
S are related to the simulated and experimental currents used in (
2).
Table 5 provides the average value of the error
and the standard deviation
for comparing simulation and experimental results.
Figure 8a and
Table 5 presents experimental and simulated induction generator values for:
P where 78.8% within one standard deviation, whereas the experimental and simulated values of
Q are 63.6% within one standard deviation and lastly,
S experimental and simulated values are 72.7% within one standard deviation.
Figure 8b and
Table 5 present the experimental and simulated values of the synchronous generator, each within one standard deviation, for: (i)
P with
, (ii)
Q with
, and (iii)
S with
.
Figure 9 and
Table 5 present the experimental and simulated values of the full IPS for: (i)
P with
and the standard deviation, (ii)
Q with
and the standard deviation, and (iii)
S with
and the standard deviation. These considerations demonstrate the parametric regression procedure accuracy, in which it can be stated that the complete model represents the real system illustrated in
Figure 6. When validating the complete system, the induction generator and synchronous generator subsystems are also validated again.
The results show the methodology reliability for estimating unknown parameters of the synchronous and induction generators. The data displayed in
Table 5 show the error between the simulated and experimental values for the outputs:
P,
Q and
S is less than
. The comparative graphs of
Figure 8 and
Figure 9 confirm the proposed methodology accuracy for determining parameters through parametric regression.
System Operation Validation
For the IPS system illustrated in
Figure 6 and validated in
Section 4.2, all experimental output data were collected during the machine’s steady-state operation. Some of the synchronous machine constructive parameters that have been optimized are related to the transient state and thus it cannot be said that the parameters found of the synchronous machine are independent of the state (transient or permanent). To validate the parametric regression model, independent of the operating regime in which data were collected, a new simulation model was used in which all parameters are known. This model uses 200 MVA synchronous machine,
kV. This new model was simulated and obtained: (i) values of the constructive parameters of the synchronous generator; (ii) output data:
P,
Q and
S of the system in steady state and (iii) output data:
P,
Q and
S in transient regime.
Parametric regression was performed in the following steps: (i) optimization of machine constructive parameters with output data in steady state; (ii) optimization of machine constructive parameters with output data in transient regime. The data collection in transient and permanent regime occurred after 5 and 30 s of simulation, respectively.
Table 6 sets the known machine parameter values and output data collected in steady state and transient regime, as well as the error between the optimized parameter values and the initially known constructive parameters.
Table 6 indicates that the optimized parameters
,
,
,
,
,
and
F present smaller errors than the other parameters. The parameters
,
and
were optimized, except with errors ranging from 58% to 320%. Parameters:
,
,
,
,
and
depend on the transient regime to be determined and the other parameters can be determined in a steady state. From the data shown in
Table 6 it can be observed that the proposed parametric regression is a technique that is independent of the machine operating state, since the values of
,
and
obtained larger errors in both states.
Several methods are found in the literature for determining parameters. Le and Wilson [
18] use online data to determine the synchronous machine parameters, revealing a
error for
. González-Cagigal et al. [
19] use UKF implementation to estimate variables and parameters of a fully regulated two-axis synchronous machine with an error of
. Silva [
15] use GA and Load Rejection test to determinate synchronous machines parameters and present an error of
to
. The proposed methodology for this work does not require removal of the machine from the workplace, does not require an initial state [
19], does not perform destructive tests [
32] and it is a simple test that does not inflict risk of damage to the machinery [
33]. Through
Table 6 can be observed that
of the parameters has an error of less than
for both the transitional and the permanent regime. Thus, it is observed that the proposed method is feasible to obtain the parameters of the machines.
4.3. Repowering
A model validated with the real system, allows simulations to be performed to obtain the amount of power generated in the plant at measuring point
for the system illustrated in
Figure 6. The proposed system settings are: (i)
where the nonlinear load is connected to the system, (ii)
where the synchronous generator, induction generator and nonlinear load are connected to the system; (iii)
where the synchronous generator and nonlinear load are connected to the system and (iv)
where the induction generator and nonlinear load are connected to the system. For all repowering simulations, the generator operating condition has been set so that in the configuration
the power factor is greater than
and as close as possible to 1 [
24].
The input data for the simulation and experimental tests [
22] are the same for the four input parameters: (i) nonlinear load firing angle
, (ii) mechanical power of the synchronous generator primary machine
, (iii) induction generator speed
, and (iv) field excitation voltage of synchronous generator
. The operating conditions of
measured at
and
measured at
for the simulation and experimental collections are set forth in
Table 7, with inductive
, in which the configuration of
is receiving reactive power from the grid. It is performed measurements of the
P,
Q,
S, and
values.
Table 7 states that both
and
provide active power and receive reactive power from the power grid. The simulated and experimental values for
and
are close, where
P has a difference of
for
and
for
and
S, difference between
for
and
for
. Several measurements were made using the various settings.
Table 8 present the data measured at point
with inductive
, both simulated and experimental. The synchronous generator excitation has been adjusted to obtain power factor at
at the nearest
setting.
Considering the simulated system analysis, in the configuration
,
Table 8, the power grid provides active power of 3865 W. In the configuration
,
Table 8, the power grid receives active power of
W. In this case, we have the nonlinear load receiving 3865 W, the synchronous generator providing
W and the induction generator providing 4363 W, as indicated in
Table 7. The total amount of
W of supplied power. By disconnecting
, in the configuration
,
provides active power of
W (see
Table 7). The synchronous generator feeds the nonlinear load and supplies the grid with the remaining generated power. In this case, the power grid will receive active power of
W. It can be observed that with the insertion of the induction generator there is a system repowering with an increase of
in the active power generated compared to the configuration
. It is further noted that the power factor measured at
in the configuration
is
, this is because the power factor of the synchronous generator is
.
The operating conditions of
and capacitive
, in which the synchronous generator is providing reactive power to the system, are given in
Table 9. It is performed measurements of the
P,
Q,
S, and
values.
It can be observed from
Table 9 that both
and
provide active power and receive reactive power from the grid. The values for
and
, both simulated and experimental are close. For the active power
P, the difference is
for
and
for
. For the total power
S, the difference is
for
and
for
.
Table 10 shows data measured at point
with capacitive
, both simulated and experimental. The synchronous generator excitation has been adjusted to obtain a power factor of
in the
setting near the unit.
It can be observed from
Table 10 that in the
configuration, the power grid is providing 1082 W active power. In configuration
, the power grid is receiving active power of
W. In this case, the nonlinear load is receiving 1082 W, the synchronous generator providing
W, and the induction generator providing 4373 W, as provided in
Table 9. In configuration
, the power grid is receiving active power of
W. In this case, you have the nonlinear load receiving 1082 W, the synchronous generator providing
W, and the induction generator providing 4373 W, as provided in
Table 9. The system is providing
W (see
Table 10). With the disconnection of
in configuration
,
provides active power of
W (see
Table 9). In this case, the power grid will receive
W active power, as shown in
Table 10. It is also observed that with the insertion of the induction generator there is a system repowering, with an increase of
in the active power generated compared to configuration
. The power factor in
in configuration
is
, higher than with inductive
.
When
is capacitive and provides reactive for
at
, the power factor value is close to
for configuration
, as shown in
Table 10. In the case of inductive
the power factor value is
for configuration
as given in
Table 8.
can operate inductive or capacitive and in the case of induction machine repowering, it is usual to operate as capacitive as it will provide reactive for
. In this mode of operation,
has a higher power factor and still supplies the reactive demand of
when connected in parallel.
4.4. Analysis of Harmonics
Using the same model and simulator validated with the real system and with the same operating conditions as in
Table 3,
Table 7 and
Table 9, the harmonic distortion data was collected. For all harmonic analysis simulations, the generator operating condition has been established so that in configuration
the power factor is greater than
and close to the unit [
24]. The measured results of total current harmonic distortions
at the measurement points
,
,
and
were collected by observing the total harmonic voltage distortions
, within the limits set forth in IEEE STD 519 [
31]. The established values in IEEE STD 519 for voltage harmonics vary according to the voltage class at the point to be measured. Measurements were taken at the voltage of 380 V, the total distortion limit of the
voltage harmonics is
.
The
values obtained in the simulation were approximately
for all measurement points, with inductive and capacitive
. The
values obtained are shown in
Table 11 at measurement points
,
,
and
with
inductive and capacitive, respectively. The simulated and experimental values in configuration
with inductive
produce a difference of
for
,
for
,
for
and
for
. Configuration
with
capacitive, was obtained
difference for
,
for
,
for
and
for
.
Measurement point for inductive , the value decreases from for configuration to for configuration . The reductions in for configurations and also occur and are caused by the increased active power flow that causes harmonics to become spread in the ratio between active power and apparent power. In configuration the value of is on and on , this indicates that with repowering using different power generators, with greater than , harmonic content is higher on terminals than on terminals, again indicating that behaves as the preferred path for harmonic currents.
At measurement point
for capacitive
and configuration
, see
Table 11, it is noted that the value of
for configuration
at
is
and in the configuration
the value reduces to
. The values obtained from
at measurement points
and
with the capacitive
are similar to the experiment with inductive
, therefore is used the same analysis. It should be noted that the operating condition of the generators has been established so that in the configuration
has the power factor approximately one. For inductive
,
and
receive reactive power from the grid and for
capacitive,
provides reactive power to
, with a view to improving the power factor of the set. In the configuration
there is a reduction of
by
to inductive and capacitive
, indicating that with the repowering there is a reduction in harmonic content.
In configuration at and , there are more harmonics on the connection bus than on the connection bus. For inductive the at is and at is and for capacitive the at is and at is . When is greater than , proportionally, there will be more harmonics in than in . The results obtained from the comparison of computer simulation and experimental tests shows that the created model represents the real system. It can be concluded that with the validation of the computational model it is possible to predict the real system behavior with insertion of new perturbations.
4.5. Discussion
Several studies are carried aiming to determine the parameters for generators. However, there are no studies about parameter estimation for remodeled and old machines using parametrical regression to modeling repowering systems composed by synchronous and induction generators of different power, subject to current distortion caused by nonlinear loads. Due to the absence of practical tests to determine parameters, there is no risk of damage to the machine. Parametric regression does not require removal of the machine from the workplace and does not perform destructive tests on it. Several old hydroelectric plants have machines with idle power generation capacity, which can be re-powered. Through the proposed methodology the system can be modeled, and the induction machine can be used to repower the plant. Thus, it is possible to forecast the system and conduct simulation experiments, which represent the characteristics of the original system.
The methodology proposed in this work for studying IEPS is parcel out into three stages: (i) practical procedures for data collection, (ii) simulation procedures and (iii) test validation. For the simulation is necessary to find the parameters for the synchronous and induction generators, the groundwork for the computational model.
Some difficulties were faced when changing the range for the input parameters for data collection executed on the simulation process and comparison of practical and simulated repowering. The initial error was the attempt of determine the constructive parameters of synchronous through practical tests. The suggestions for this procedure are: (i) use of the system for the collection of practical data to determine the constructive parameters through the method of parametric regression, (ii) simulation using the mathematical model of the synchronous generator and induction generator in non-sinusoidal steady state, (iii) perform practical test collections in the transitional regime and (iv) collect the input parameter of the induction generator, for the machine operating as a generator and motor.
The behavior of the harmonic flow between the generators was validated by observing the relationship between the harmonic currents of the induction generator and the synchronous generator. This may be a new field that opens for studies on the best power ratio between the induction generator and the main generator, synchronous generator. Optimization methods can be used to determine the optimal power ratio of the induction generator, once the power of the synchronous generator is known.
The proposed model show error, between the simulated and experimental values, for the outputs:
P,
Q and
S of less than
, according to system validation. The
Table 12 show the error for the complete system repowering, comparing simulated and experimental, for the values obtained in
with
inductive and capacitive. The error for calculating repowering is greater for
inductive with a value of
. The proposed model is simplified but validates the proposed methodology. By making a more elaborate model, the process can be refined and errors reduced.
At parameters of the generators determination, the following can be observed: (i) data collection can easily be carried out at the operating site, (ii) cost reduction by carrying out on-site tests; (iii) ease in obtaining the electrical parameters of the machine without destructive tests, (iv) data collection without the need to disconnect the generator from the system and (v) data collections with the offline generator. In systems with repowering through the induction machine, it is observed: (i) increase in the useful life of the main machine, which is the synchronous machine, (ii) reduction in the acquisition and maintenance cost, since the induction machine has a lower cost than synchronous and (iii) easy to install due to the physical space, since the volume of the induction machine compared to the synchronous machine, for the same power, is less.
Electrical equipment operating at harmonic frequencies has greater losses and a greater possibility of insulation failures when compared to electrical equipment operating at the fundamental frequency. The use of frequency inverters contributes to the increase of harmonic contents in the electrical network [
34]. Through the repowering by the proposed methodology, the synchronous generator lifetime increases meanwhile the induction generator lifetime decreases. Meantime, the induction generator is approximately 40% cheaper compared to the synchronous generator. Furthermore, the induction generator needs about 85% less space in contrast to the volume of the synchronous generator. The induction machine offers greater ease and savings in maintenance and replacement. Analyzes in real systems with a focus on the useful life of generators and economic viability can be carried out as new research.
5. Conclusions
This work proposes to determine, through the parametric regression model, the constructive parameters of electric machines. The results show that with the parametric regression it is possible to determine the electrical parameters of the synchronous machine and the induction machine. The error between practical and simulated values for the outputs: active power, reactive power, and apparent power is less than . Concluding that the methodology of parametric regression to determine the parameters for synchronous and induction generators is efficient. In addition, it was presented that the method can be used regardless of the operating regime, whether permanent or transient, that the data are collected. Approximately of the parameters are determined, on a permanent and on a transient basis, with an error less than . It is concluded that the parametric regression methodology for determining parameters of the induction generator and synchronous generator independent of the operation regime is validated. The results validate the individual machine models and the complete IPS model, representing the real system.
The advantage of this method is that there is no need for catalog parameters from the machine. The method only requires the acquisition of output data from the machine in operation, allowing parameter determination of systems modified, reconditioned, old and others. With the complete validated real system model, it was possible to perform simulations and compare the simulated data with the experimental ones. In addition, there is no need to remove the machine from the workplace and ease of data collection, which is offline. With this validated model, it is possible to make predictions for the actual IPS system. This paper also presents the possibility of repowering using induction generator. The induction generator, besides being low cost, more robust, constructive simplicity, lower price, less maintenance and smaller size, when compared to the same power synchronous generator, is still able to repower the system.
The results show reductions in busbar harmonic distortion with both the synchronous generator connection and the induction generator connection. These results indicate that the induction generator provides preferential path for harmonic currents, even when the two generators produce or consume equivalent and proportional reactive powers. The synchronous generator behaves differently when it is underexcited or overexcited, reducing or increasing the bus harmonic currents subjected to nonlinear load.


 ,
, 


