1. Introduction
Many countries worldwide have integrated renewable energy sources into their power system, such as the generation section or distribution system, to achieve low carbon emissions and sustainable energy goals. Consequently, from the year 2009, the Japanese government has supports households that install solar panels by issuing the feed-in tariff (FIT). The FIT policy led to excessive generation of electricity from photovoltaic (PV) panels, since the households could sell the PV power and feed it into the distribution system. For this reason, solar panels have been widely installed in residential areas and connected to the distribution system. Recently, many communities apply smart systems, PV panels, or fuel cell (FC) cogeneration to general households [
1].
In Kitakyushu city, Fukuoka, Japan, an innovative smart community named Jono, installed solar panels using the FC cogeneration system in most houses in the area. Housing in the Jono area is aimed at a self-consumption model of energy. As PV technology is gaining attention rapidly due to the widespread use of self-consumption models, the consideration of suitable locations before the PV installation is essential [
2]. Some areas are not appropriate to install solar panels in because the shadow from buildings or trees covers the panel [
3].
Other important factors, such as the direction and the angle, need to be considered as well. Thus, the maximum possible amount of electricity generation is decreased by the mentioned factors [
4]. For this reason, new technologies and methods are applied before solar panel installation for a suitable location. The pyranometer is a popular tool to measure solar radiation and convert it to the panel’s output solar power. The pyranometer calculates solar power from as few panels as possible; however, is not appropriate for solar rooftops in all residential areas. Therefore, geographic information system (GIS) technology is widely applied to estimate the solar radiation values on panels by working with a real world model [
5].
GIS programs are currently widely used in many fields, such as driving support systems for electric vehicles [
6], city management [
7], estimating the amount of solar radiation on farmland for agriculture [
8], and creating solar radiation maps for checking the solar radiation on an entire focus area [
9]. There are many merits when applying GIS technology together with solar energy, such as estimating the solar irradiance output or the potential of a roof surface for PV installation from a large-scale residential area [
10]. With the rapidly rising number of solar rooftops in the distribution system, there are impacts on the distribution system, because the panels are integrated by connecting them directly to the grids [
11]. The effects from a large number of solar panels on the power system include voltage or frequency fluctuations due to the shadow effects from trees, buildings, or the surrounding area [
12,
13].
To show a solar radiation map and the shadow covering the solar panels, a digital elevation model (DEM), which represents the ground surface and the road network, from GIS technology was applied to create a landscape solar analysis [
14]. However, there are various methods to create solar radiation maps using a GIS program. As example is to apply a digital surface model (DSM) representing the elevations of the trees and buildings together with GIS technology representing the solar radiation map to find efficient solar power placement [
15]. Thus, in this research, we created a solar radiation map using a GIS program and DSM layer to estimate the solar radiation map from the real world residential area.
This research facilitates the distribution system with the solar panel high installation rate for future planning based on the Jono distribution area by simulating the solar radiation map with the distribution system. The real electricity consumption data from the households in the Jono distribution system were used in this research. In addition to the consumption data, the distribution model was adjusted to the existing residential area. With the GIS program, natural phenomena, such as the cloud movement process, were simulated in the solar installation map to consider the shadow’s impact on the voltage fluctuations in the distribution system [
16].
This work combines the actual distribution model together with the literal solar radiation output for the Jono research area, which was collected using the GIS technology to develop future distribution system planning. We focus on the voltage fluctuations considering the two scenarios of 50 and 100% of the maximum solar panel installation to the distribution system, comparing the results, and examining the amount of solar panel effects on the residential area. The results of this research accommodate the concepts of distribution system future planning. It is important to consider the impacts of the solar panel before PV rooftop installation. The eventual aim is to create and develop a realistic distribution system model before installing the rooftop solar photovoltaic in the residential area. This model can be adjusted according to the existing residential area or a residential planning area wherever in this world to use the model for distribution system planning.
2. GIS Technology
A geographic information system (GIS) is a technology for creating, gathering, managing, representing, searching, analyzing, and sharing geospatial information using a framework [
17]. The GIS program capabilities are numerous; for example, in this work, people employ new utilities to use in the advanced distribution management systems (ADMSs) or other similar systems. This may use programs with GPS and unmanned aerial vehicle (UAV) technology for photovoltaic power generation to conduct efficient inspection, maintenance, and asset management [
18].
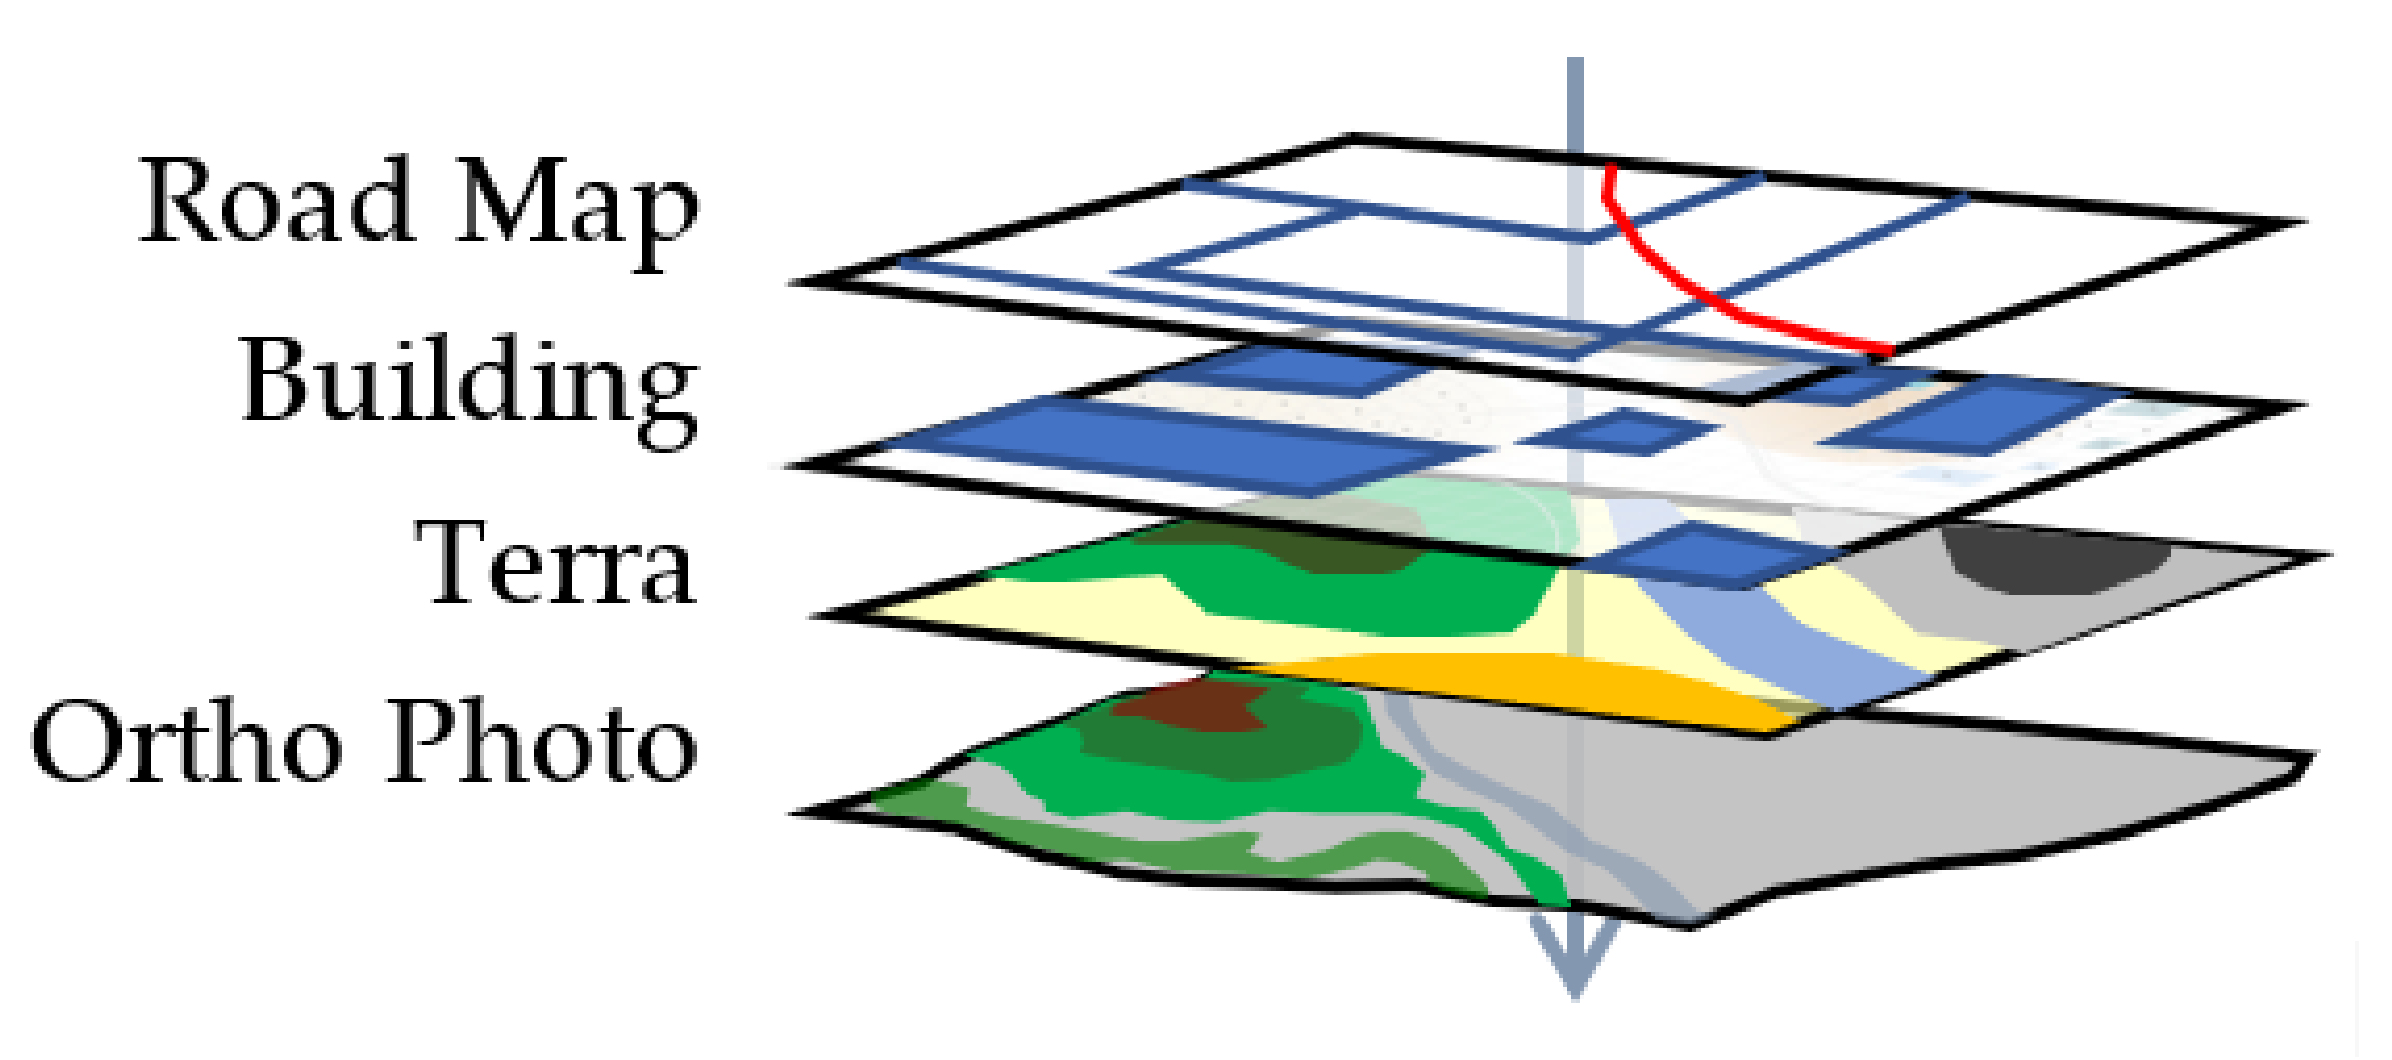
ArcGIS is a widely used program in employing cartography, statistical analysis, and database technology. This GIS program simulates the real world to a model and process layer by layer, for instance a road map information layer, building layer, terra layer, and orthophoto as shown in
Figure 1.
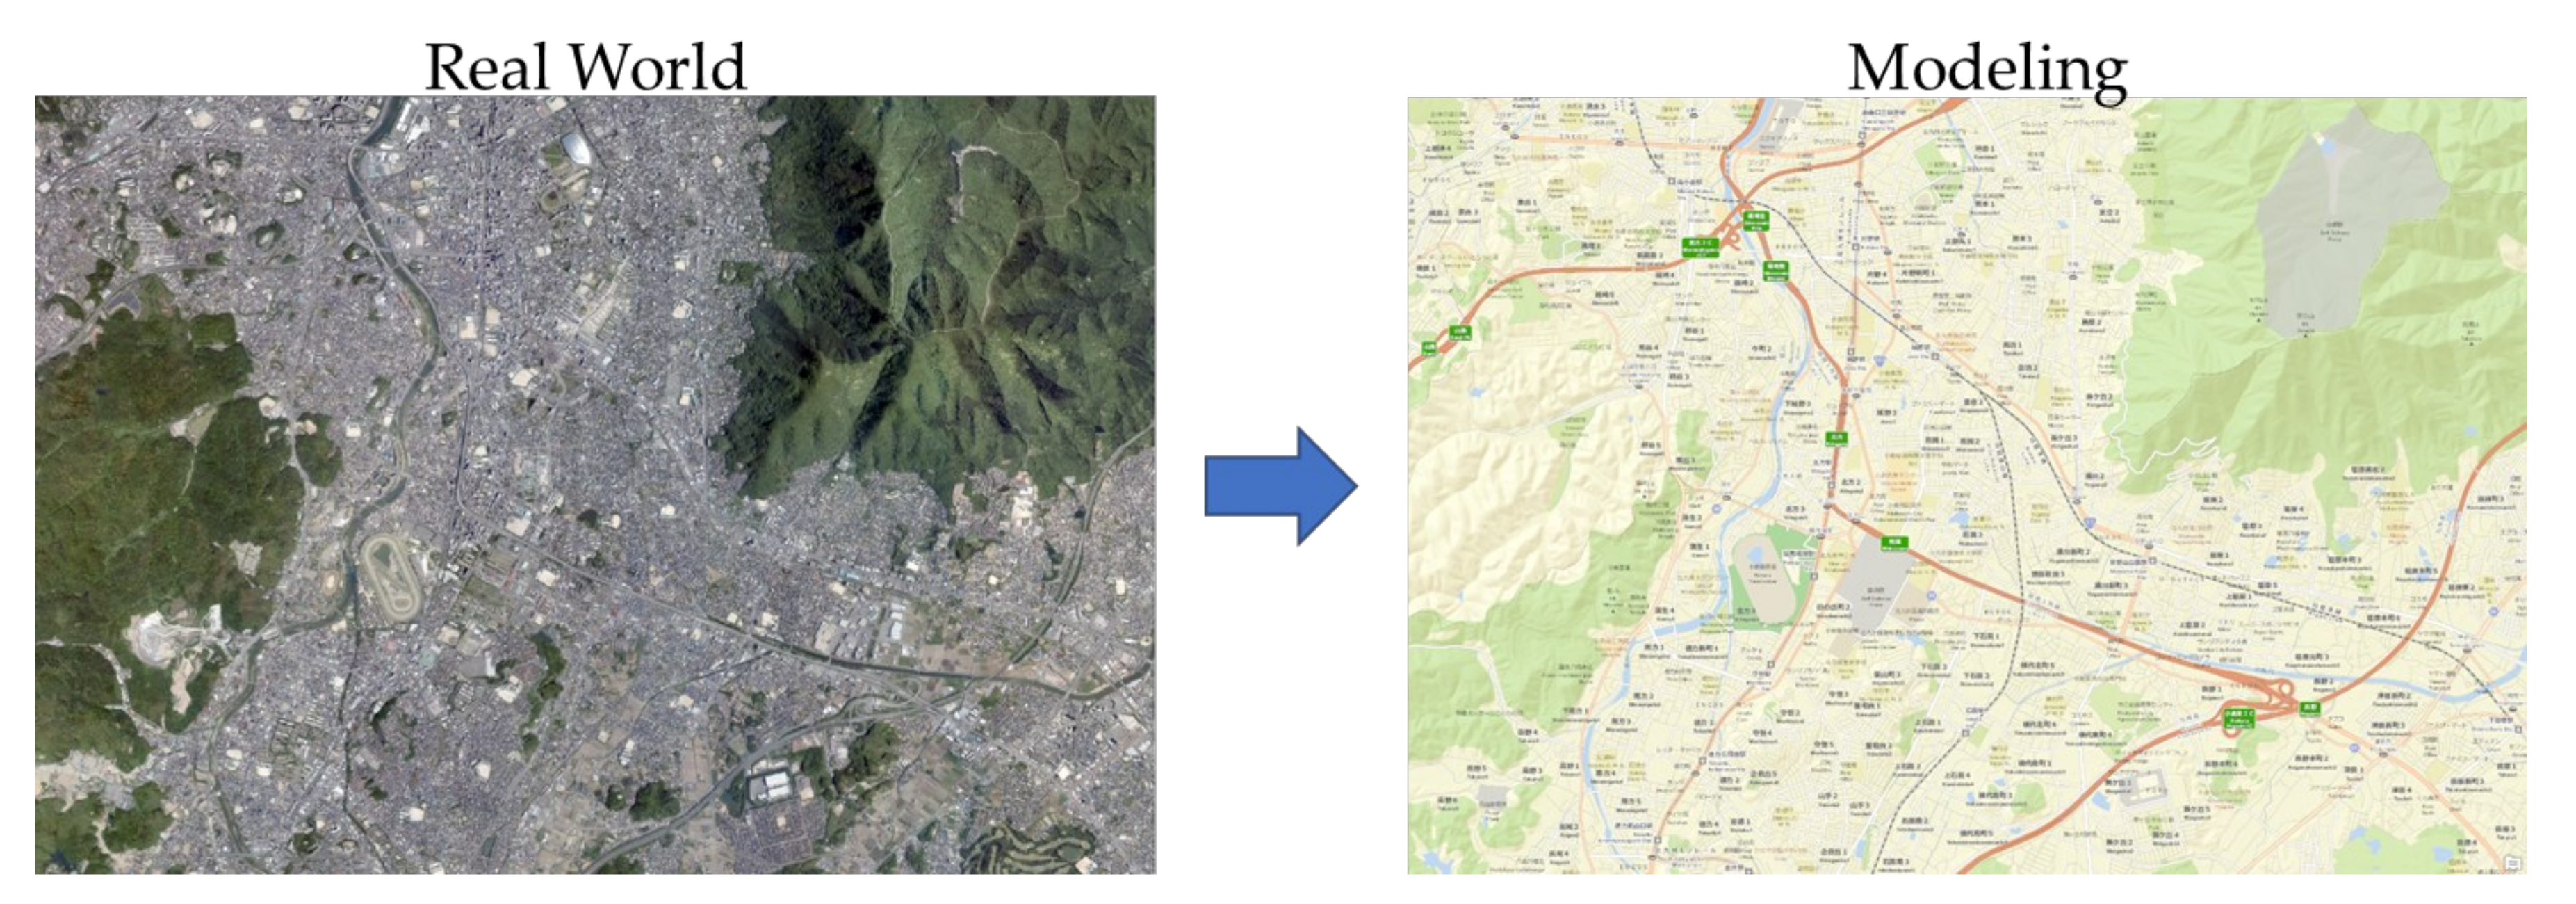
Figure 2 shows the ArcGIS program managing data by layers, consisting of specific geospatial data and an illustration of the real world. The functions and usability of this GIS program can be applied in many applications.
2.1. Digital Surface Model (DSM)
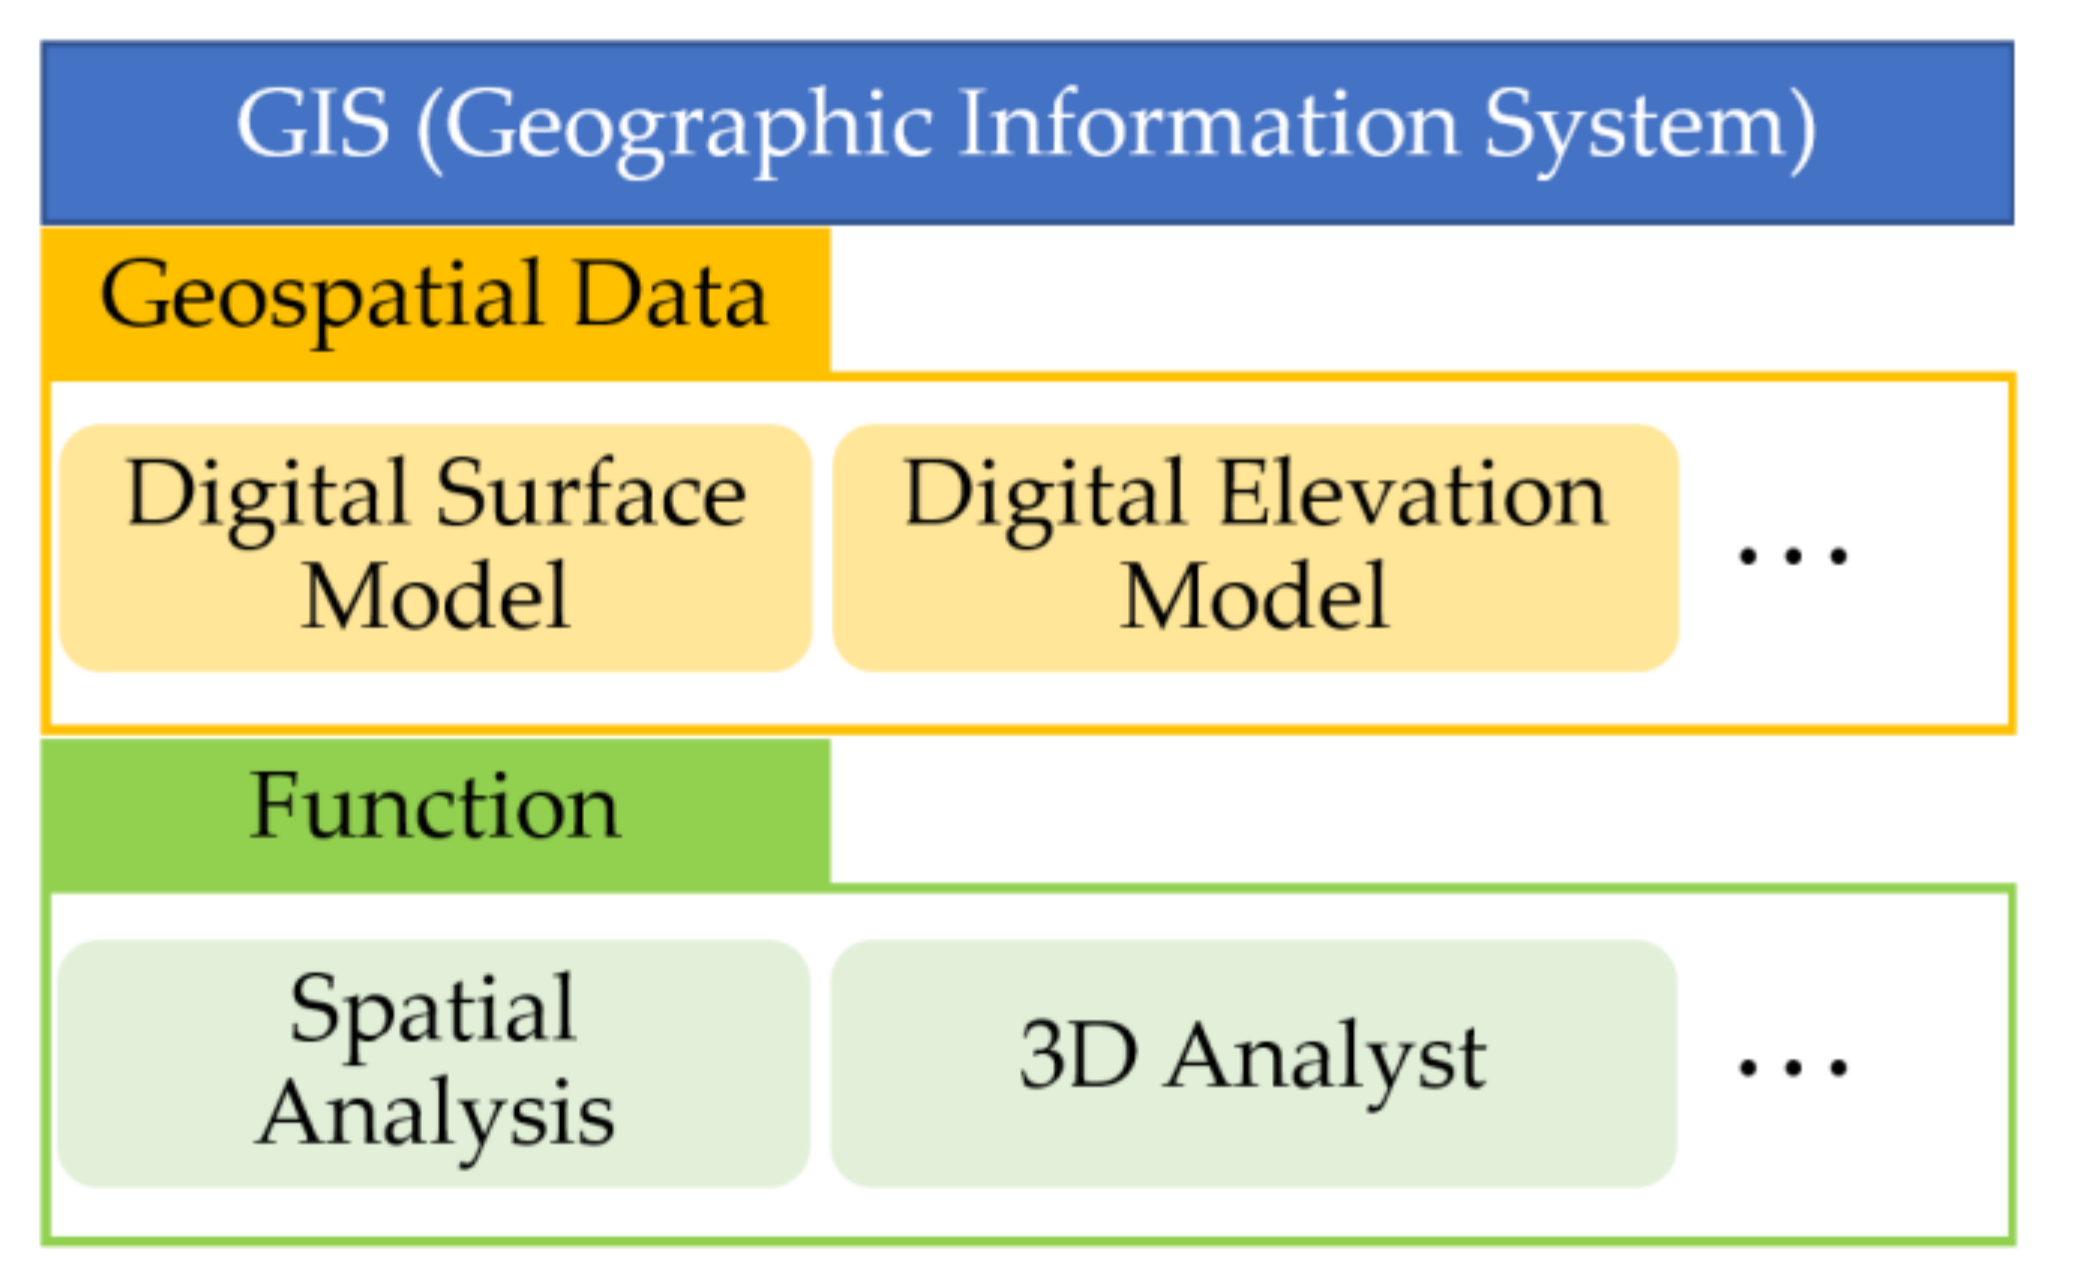
The ArcGIS program’s operation consists of two parts: geospatial data and program functions.
Figure 3 shows the related geospatial data and function of this research. There are two types of geospatial data processing, divided into vector and raster data models. The vector data model consists of layers, using points, lines, and polygons to store the boundaries of country borders or streets, while the raster data model encompasses a matrix of pixels organized into grids, as shown in
Figure 4.
The raster data model comprises of digital aerial photographs, the images from satellites or digital pictures. There are four main categories of raster data in the ArcGIS program: base maps or digital elevation models (DEMs), raster as surface maps or digital surface models (DSMs), raster as thematic maps, and raster as attributes of a feature [
19].
Figure 5 shows the difference between DSM and DEM layers. DSM layers contain elevation data from the surrounding areas, such as trees and buildings, while DEM layers represent the ground surface. The relevant categories of this research are the surface maps.
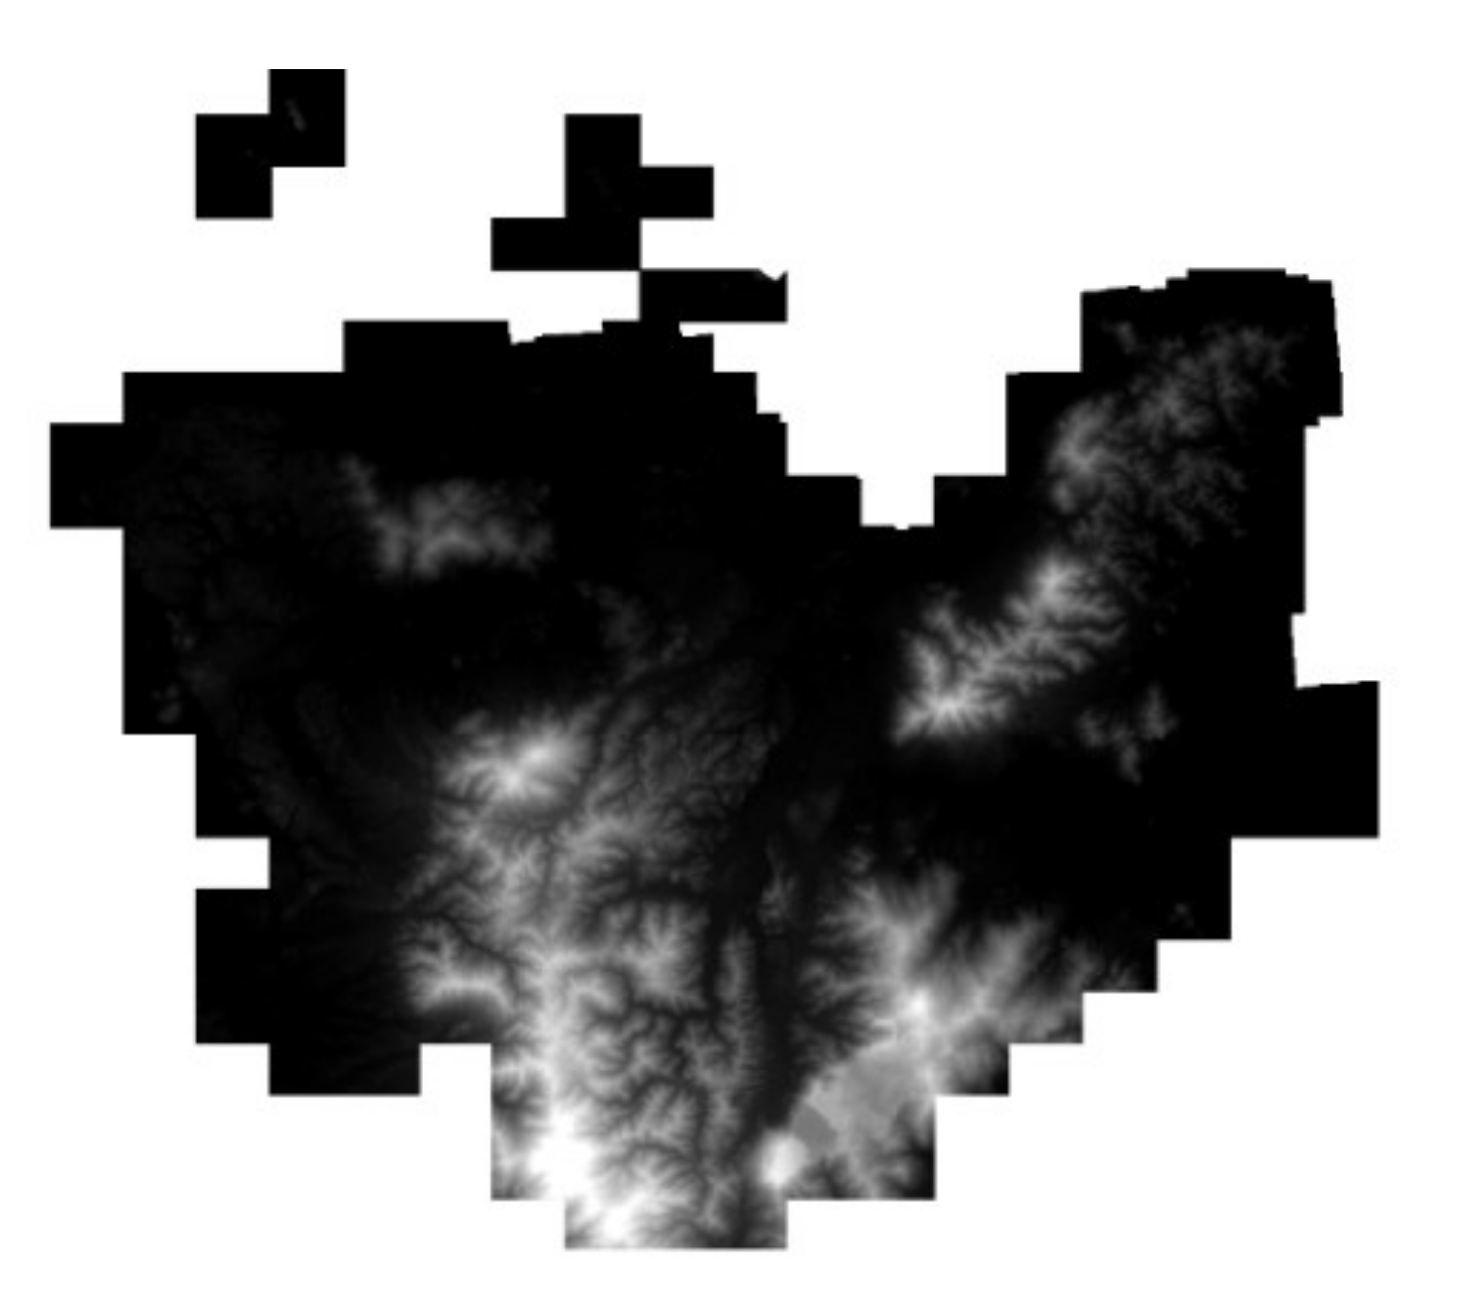
Raster layers as surface maps were applied in this research to represent the data of landscapes or surfaces. For example, the elevation values from the terrain and the values of rainfall, temperatures, solar radiation, or population density can be analyzed by the program’s function.
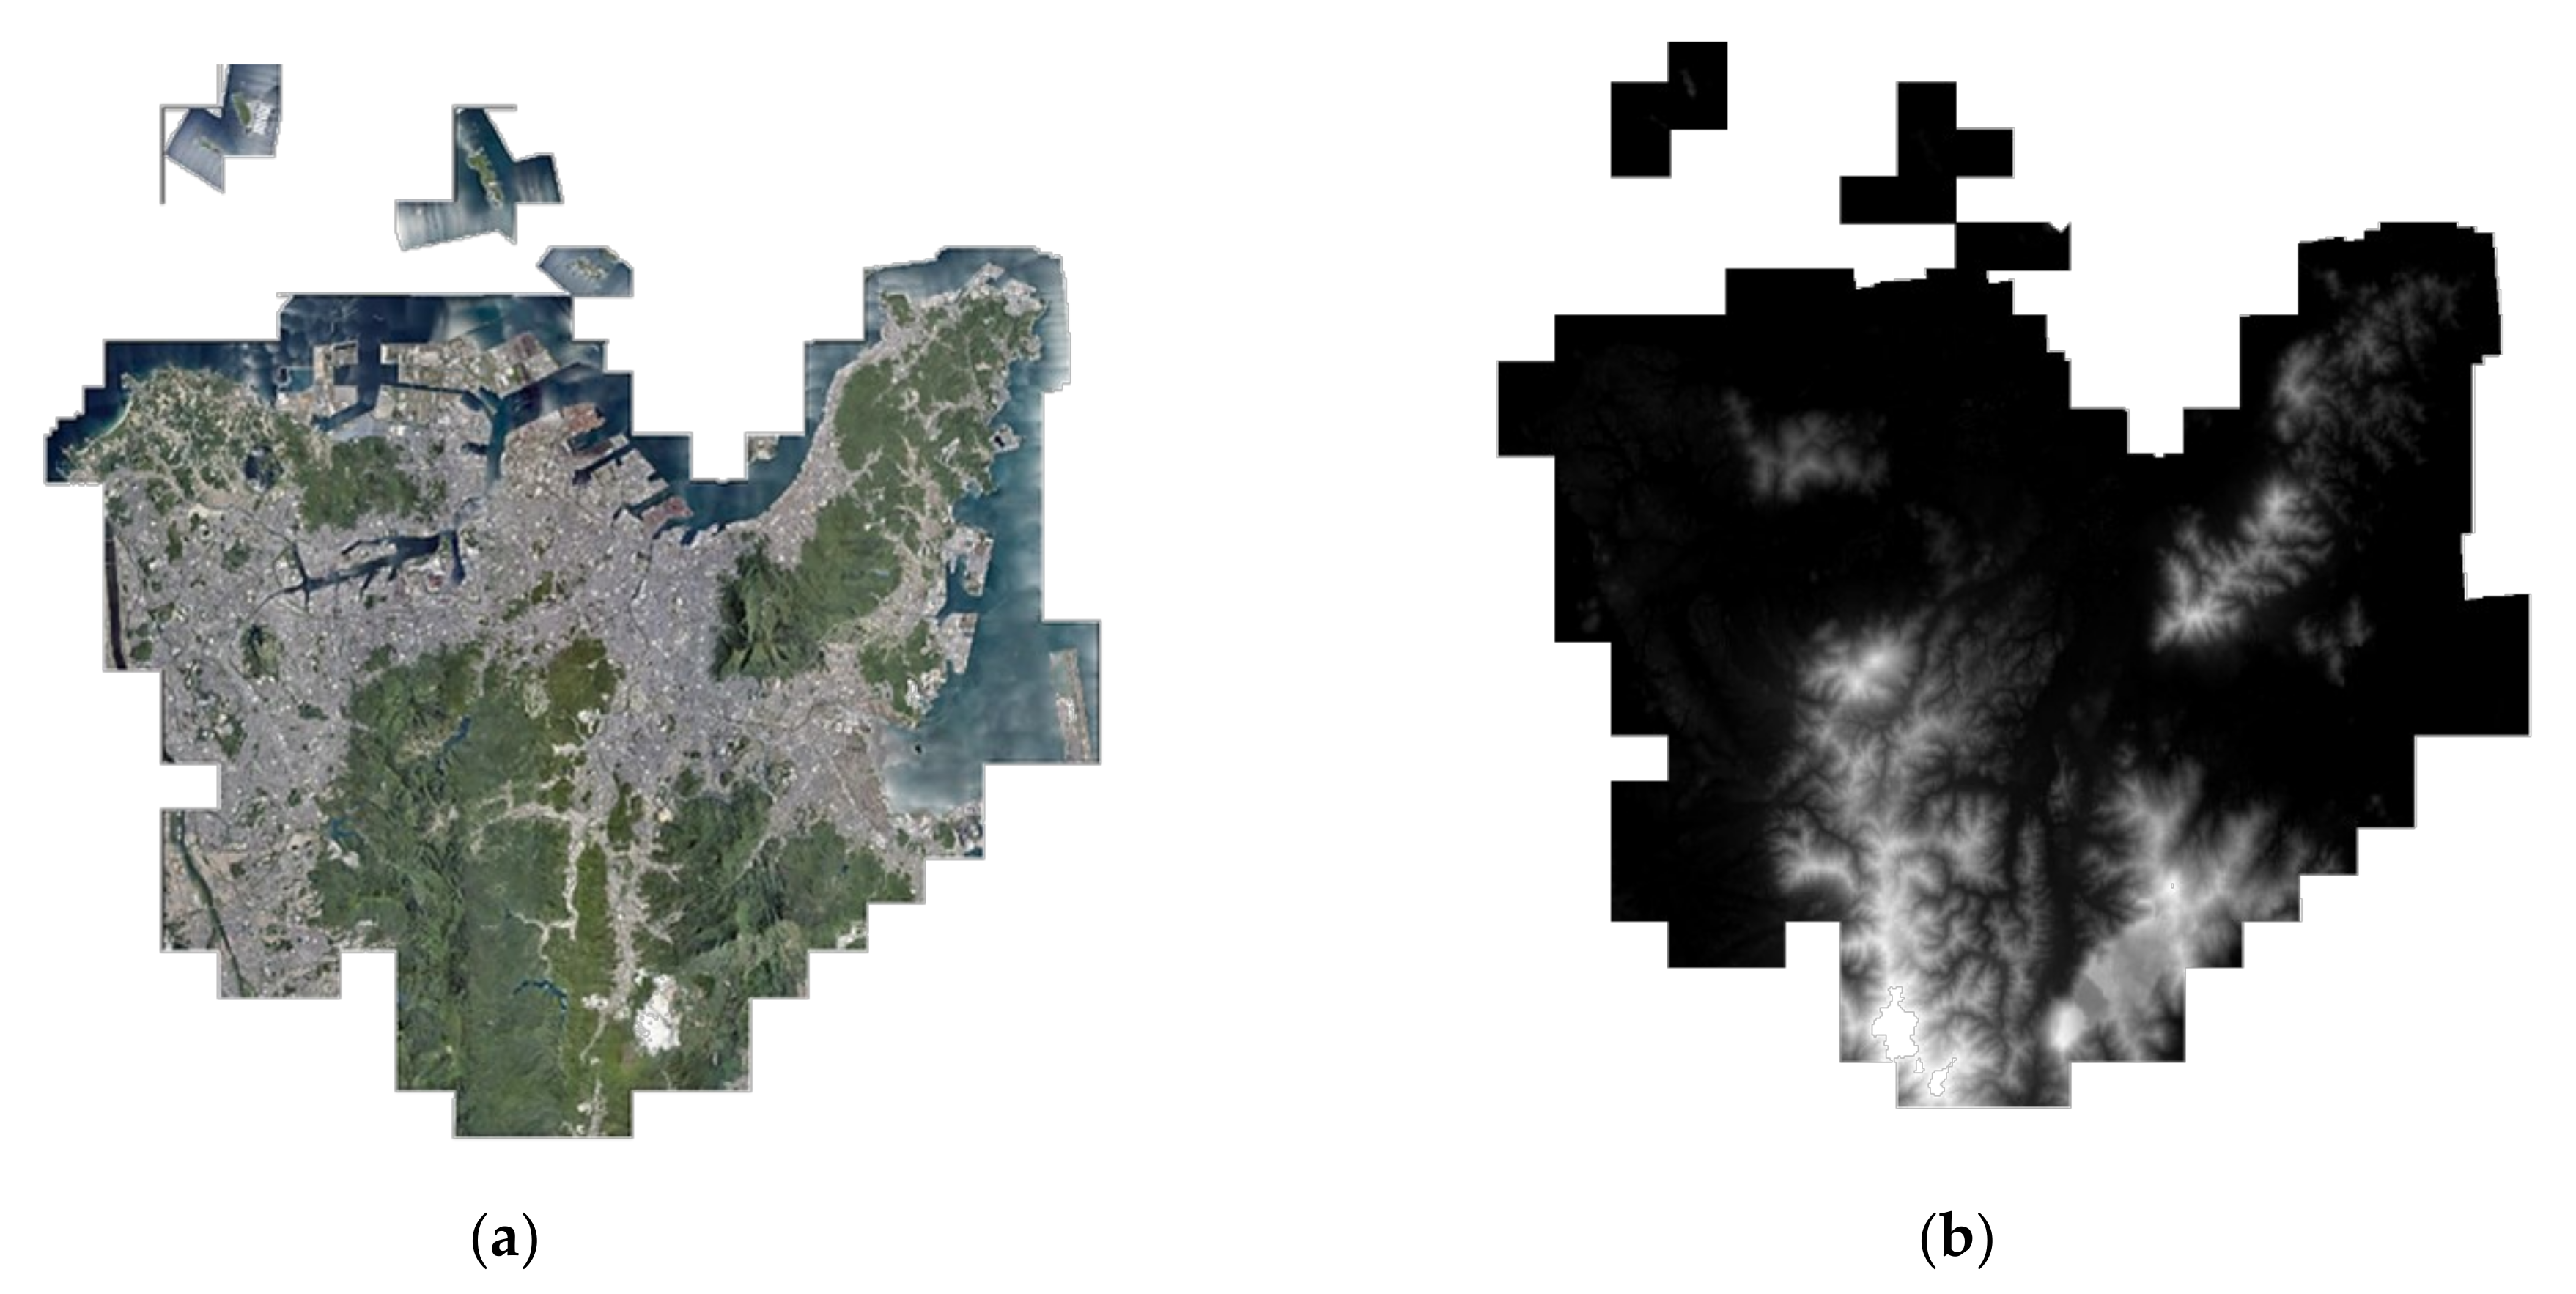
Figure 6 shows the elevation of Kitakyushu city terrain, and the height indicated by white coloring shows the highest area in the maps.
The real world information is represented by remote sensing images or aerial photographs, such as pictures from satellite or flying objects. An aerial photograph can create a digital surface model (DSM) by using the satellite image and estimating the solar radiation map [
20]. This work employed aerial photographs taken by flying a drone over the Jono research area, to create a map and determine the distance or elevation from the ratio between the map and the terrain.
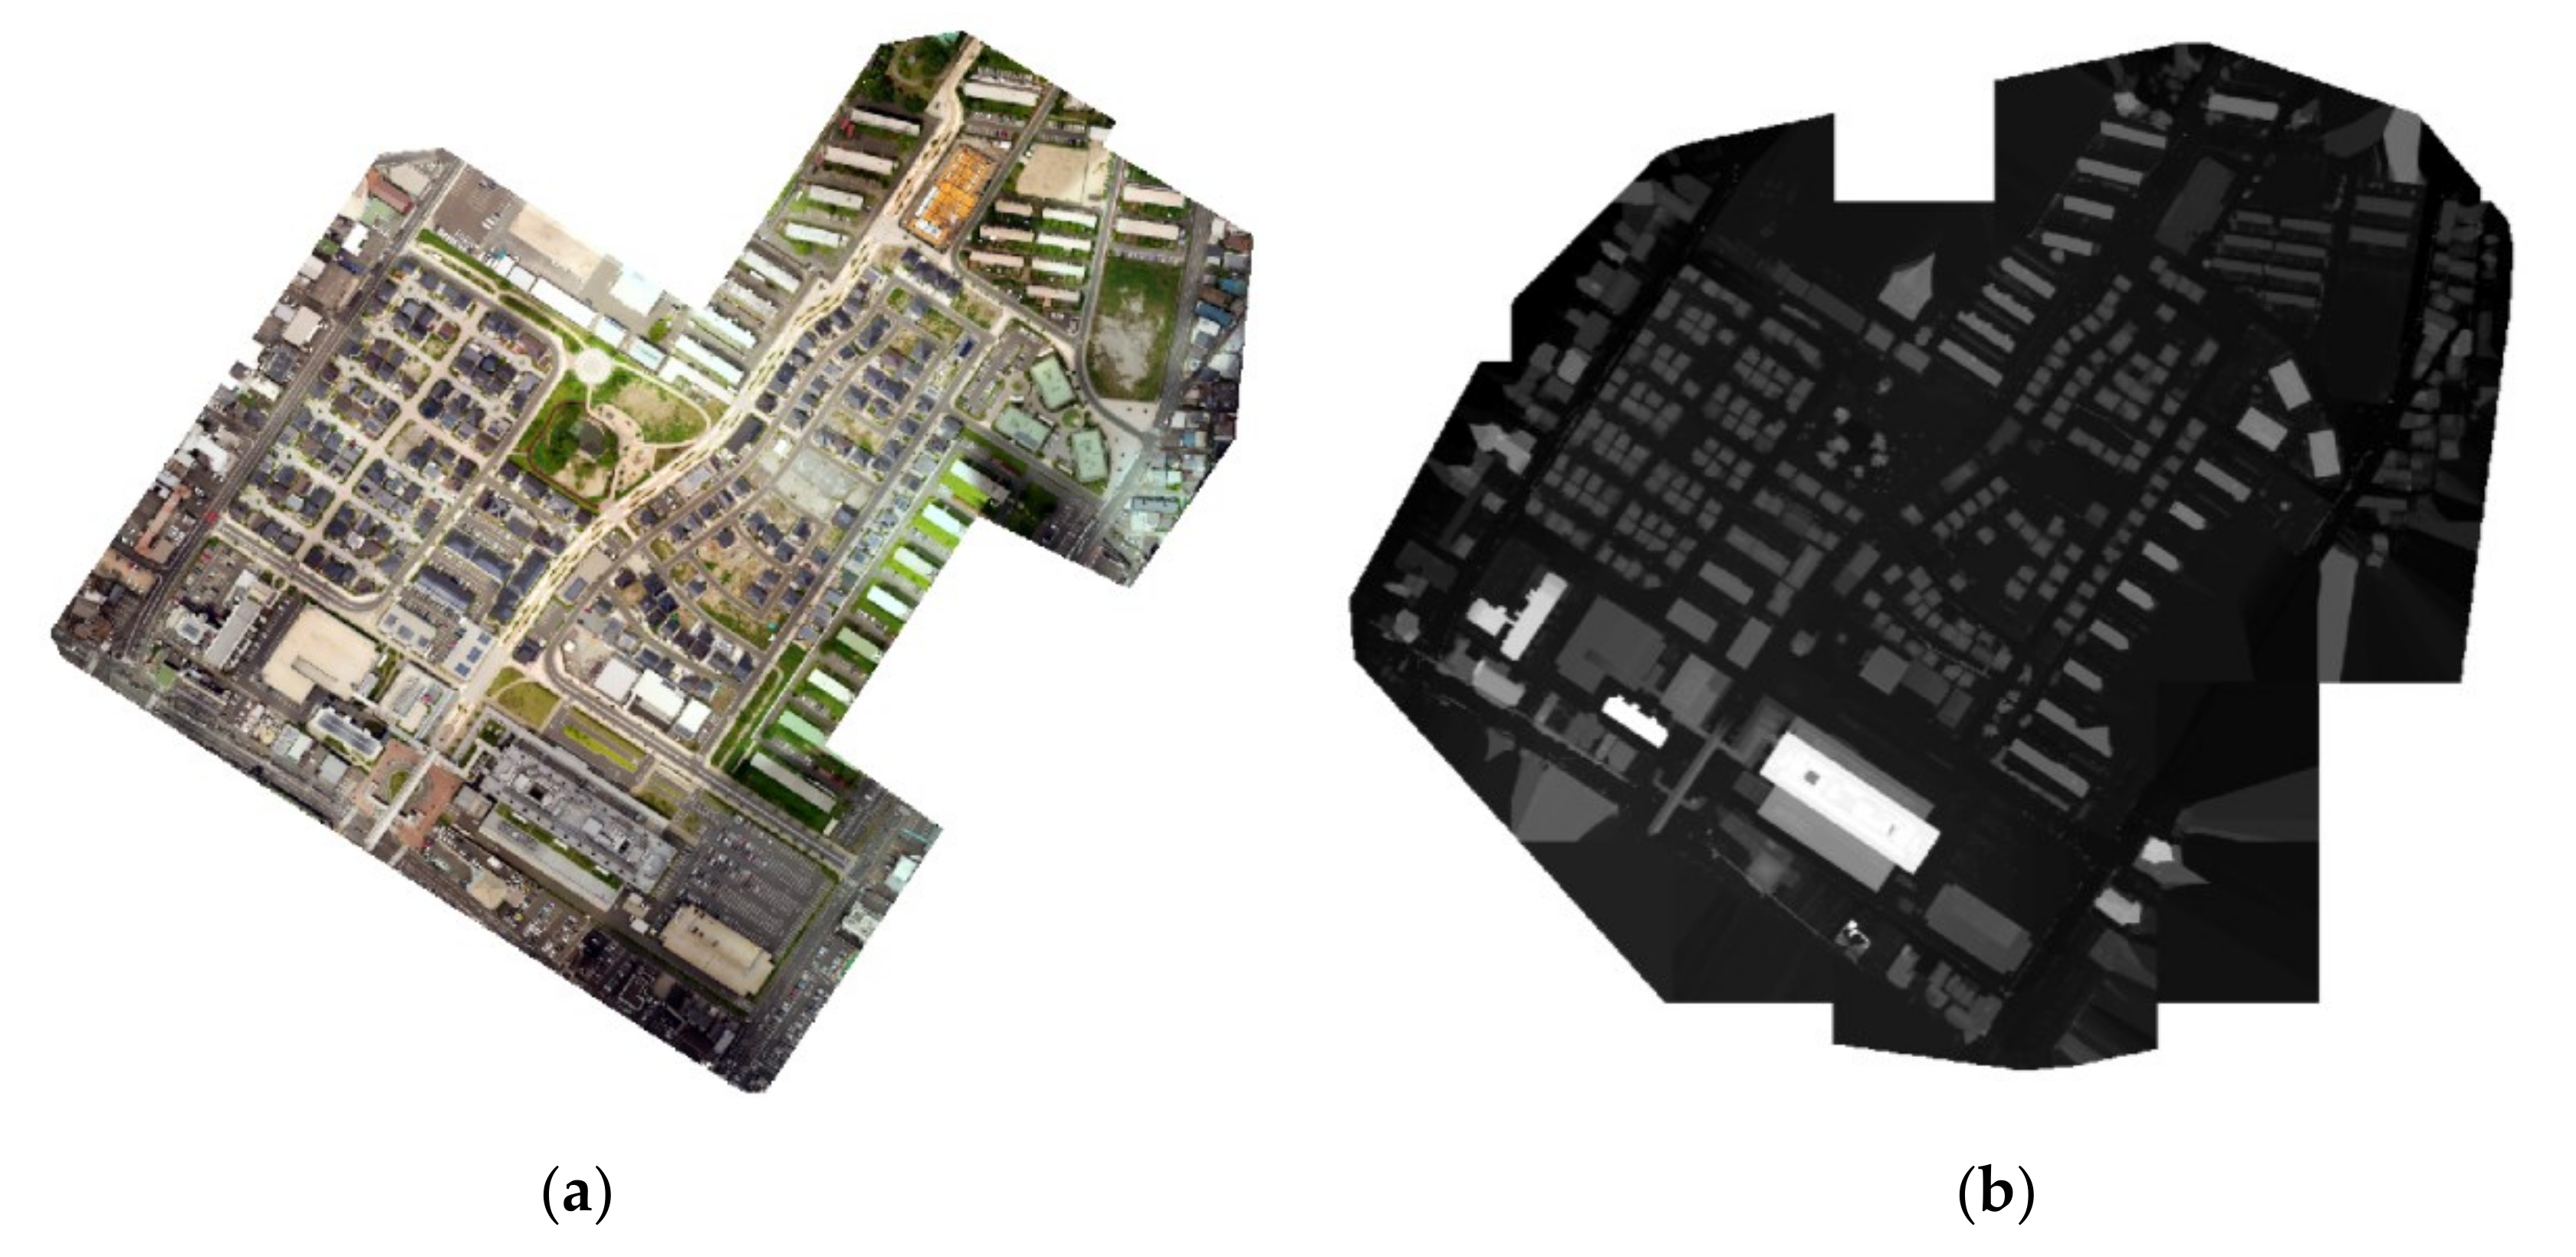
Figure 7a shows an aerial photograph of the Jono research area that was taken on 19 July 2019, in sunny conditions.
In the initial stages of this research, we applied aerial photographs of Kitakyushu city, taken by small aircraft, and studied the shadow’s impact on the Jono area. The Jono residential area was emphasized by expanding Kitakyushu city’s aerial photograph, as shown in
Figure 8a. Consequently, the Jono area’s resolution was decreased due to focusing on the area of interest. This work updated the aerial photograph from a low-resolution to a high-resolution map by using a UAV. Thus, the Jono residential area aerial photograph resolution was higher than that of the entire area of Kitakyushu city aerial photography.
For this reason, the resolution and the precision of the DSM layer of Jono residential area are higher than the Kitakyushu city DSM layer, as shown in
Figure 7b and
Figure 8b. In
Figure 7b, Jono’s DSM layer shows a dark color to bright color gradient that represents the area’s different elevations. The most luminous color or white–grey color shows the highest buildings in the area. The darker the color is, the lower the height of buildings or surrounding objects are.
To create the DSM layer of Jono for this work, high-resolution aerial photographs were applied to the program to create a layer and compute the distance or elevation from the ratio between the map and the terrain. The spatial analysis function was employed simultaneously with a real world map to determine the height of trees and buildings that are the causes of shadows (
Figure 9).
2.2. Solar Radiation Map
To create the solar radiation map in the area of interest at a specific time, the raster and vector data models, along with the spatial analyst toolbox, were employed. Area solar radiation functions were used to create a solar radiation map. The area solar radiation tools can derive incoming solar radiation from a raster surface. In this research, we created a solar radiation map in a specific area and time by the DSM layer of the Jono residential area, and the area solar radiation function worked together with the sun’s orbital data (
Figure 10). After creating the Jono solar radiation map, we assumed clear weather conditions (a sunny day) to obtain the solar radiation value at each bus point of the distribution system.
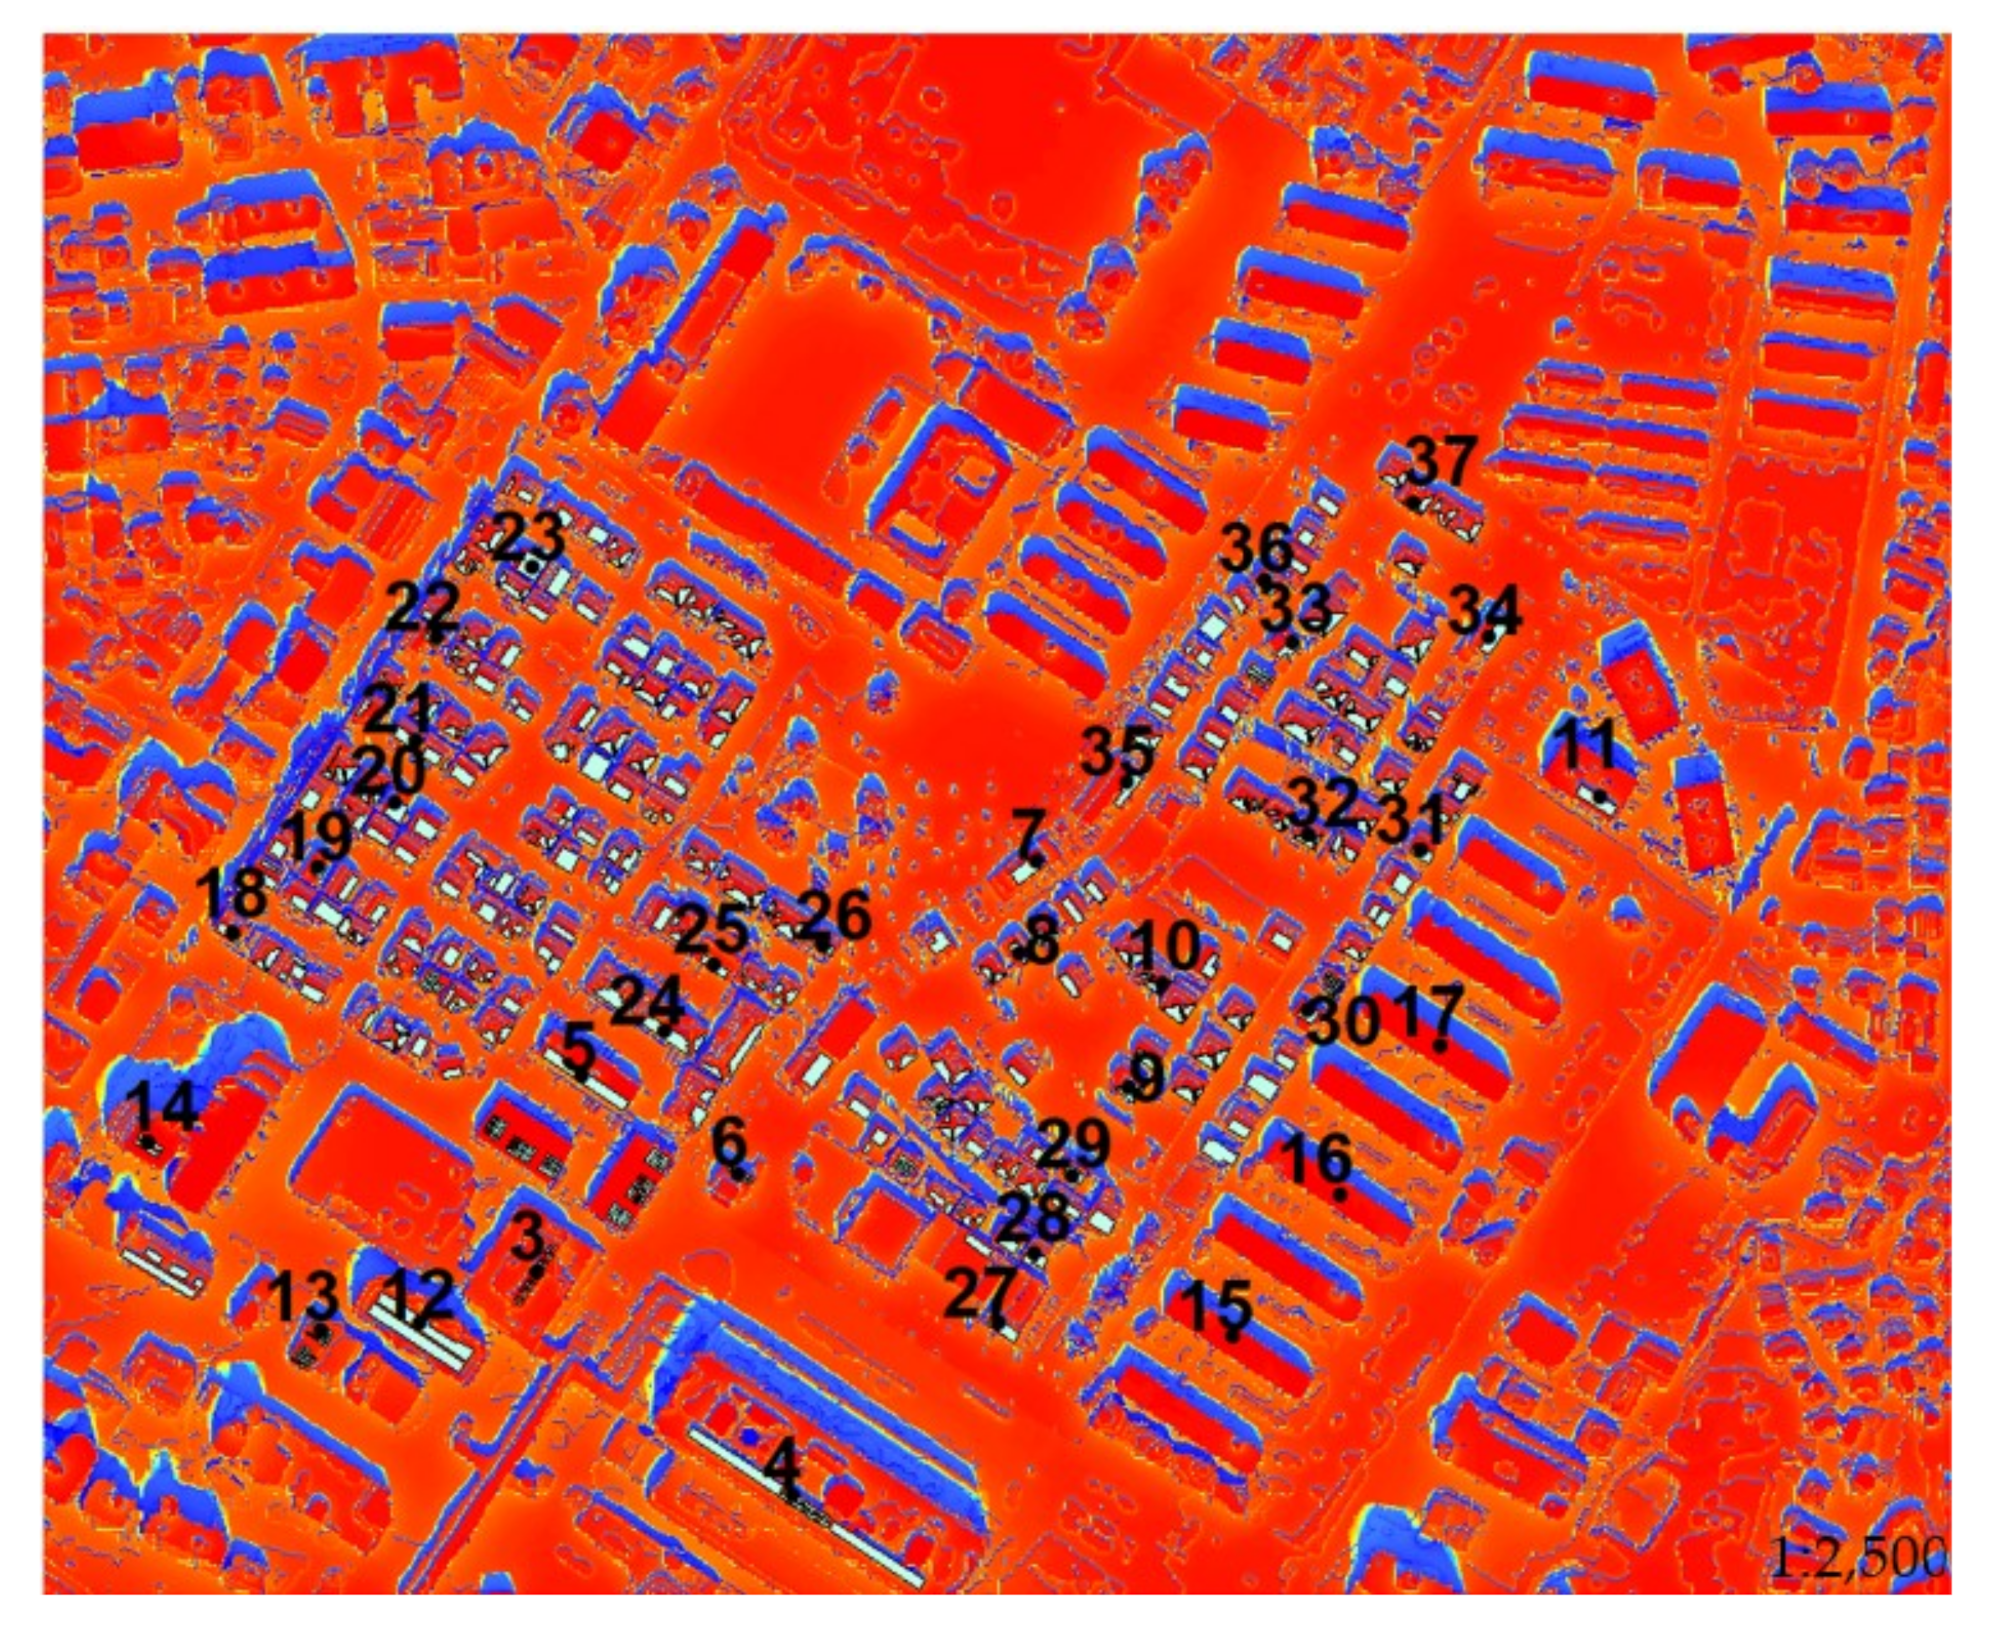
The simulation date was on 19 September 2019, from 12:00 to 12:30 p.m. The load-point affiliated with the Jono residential area can be defined from the GIS program, as shown in
Figure 11.
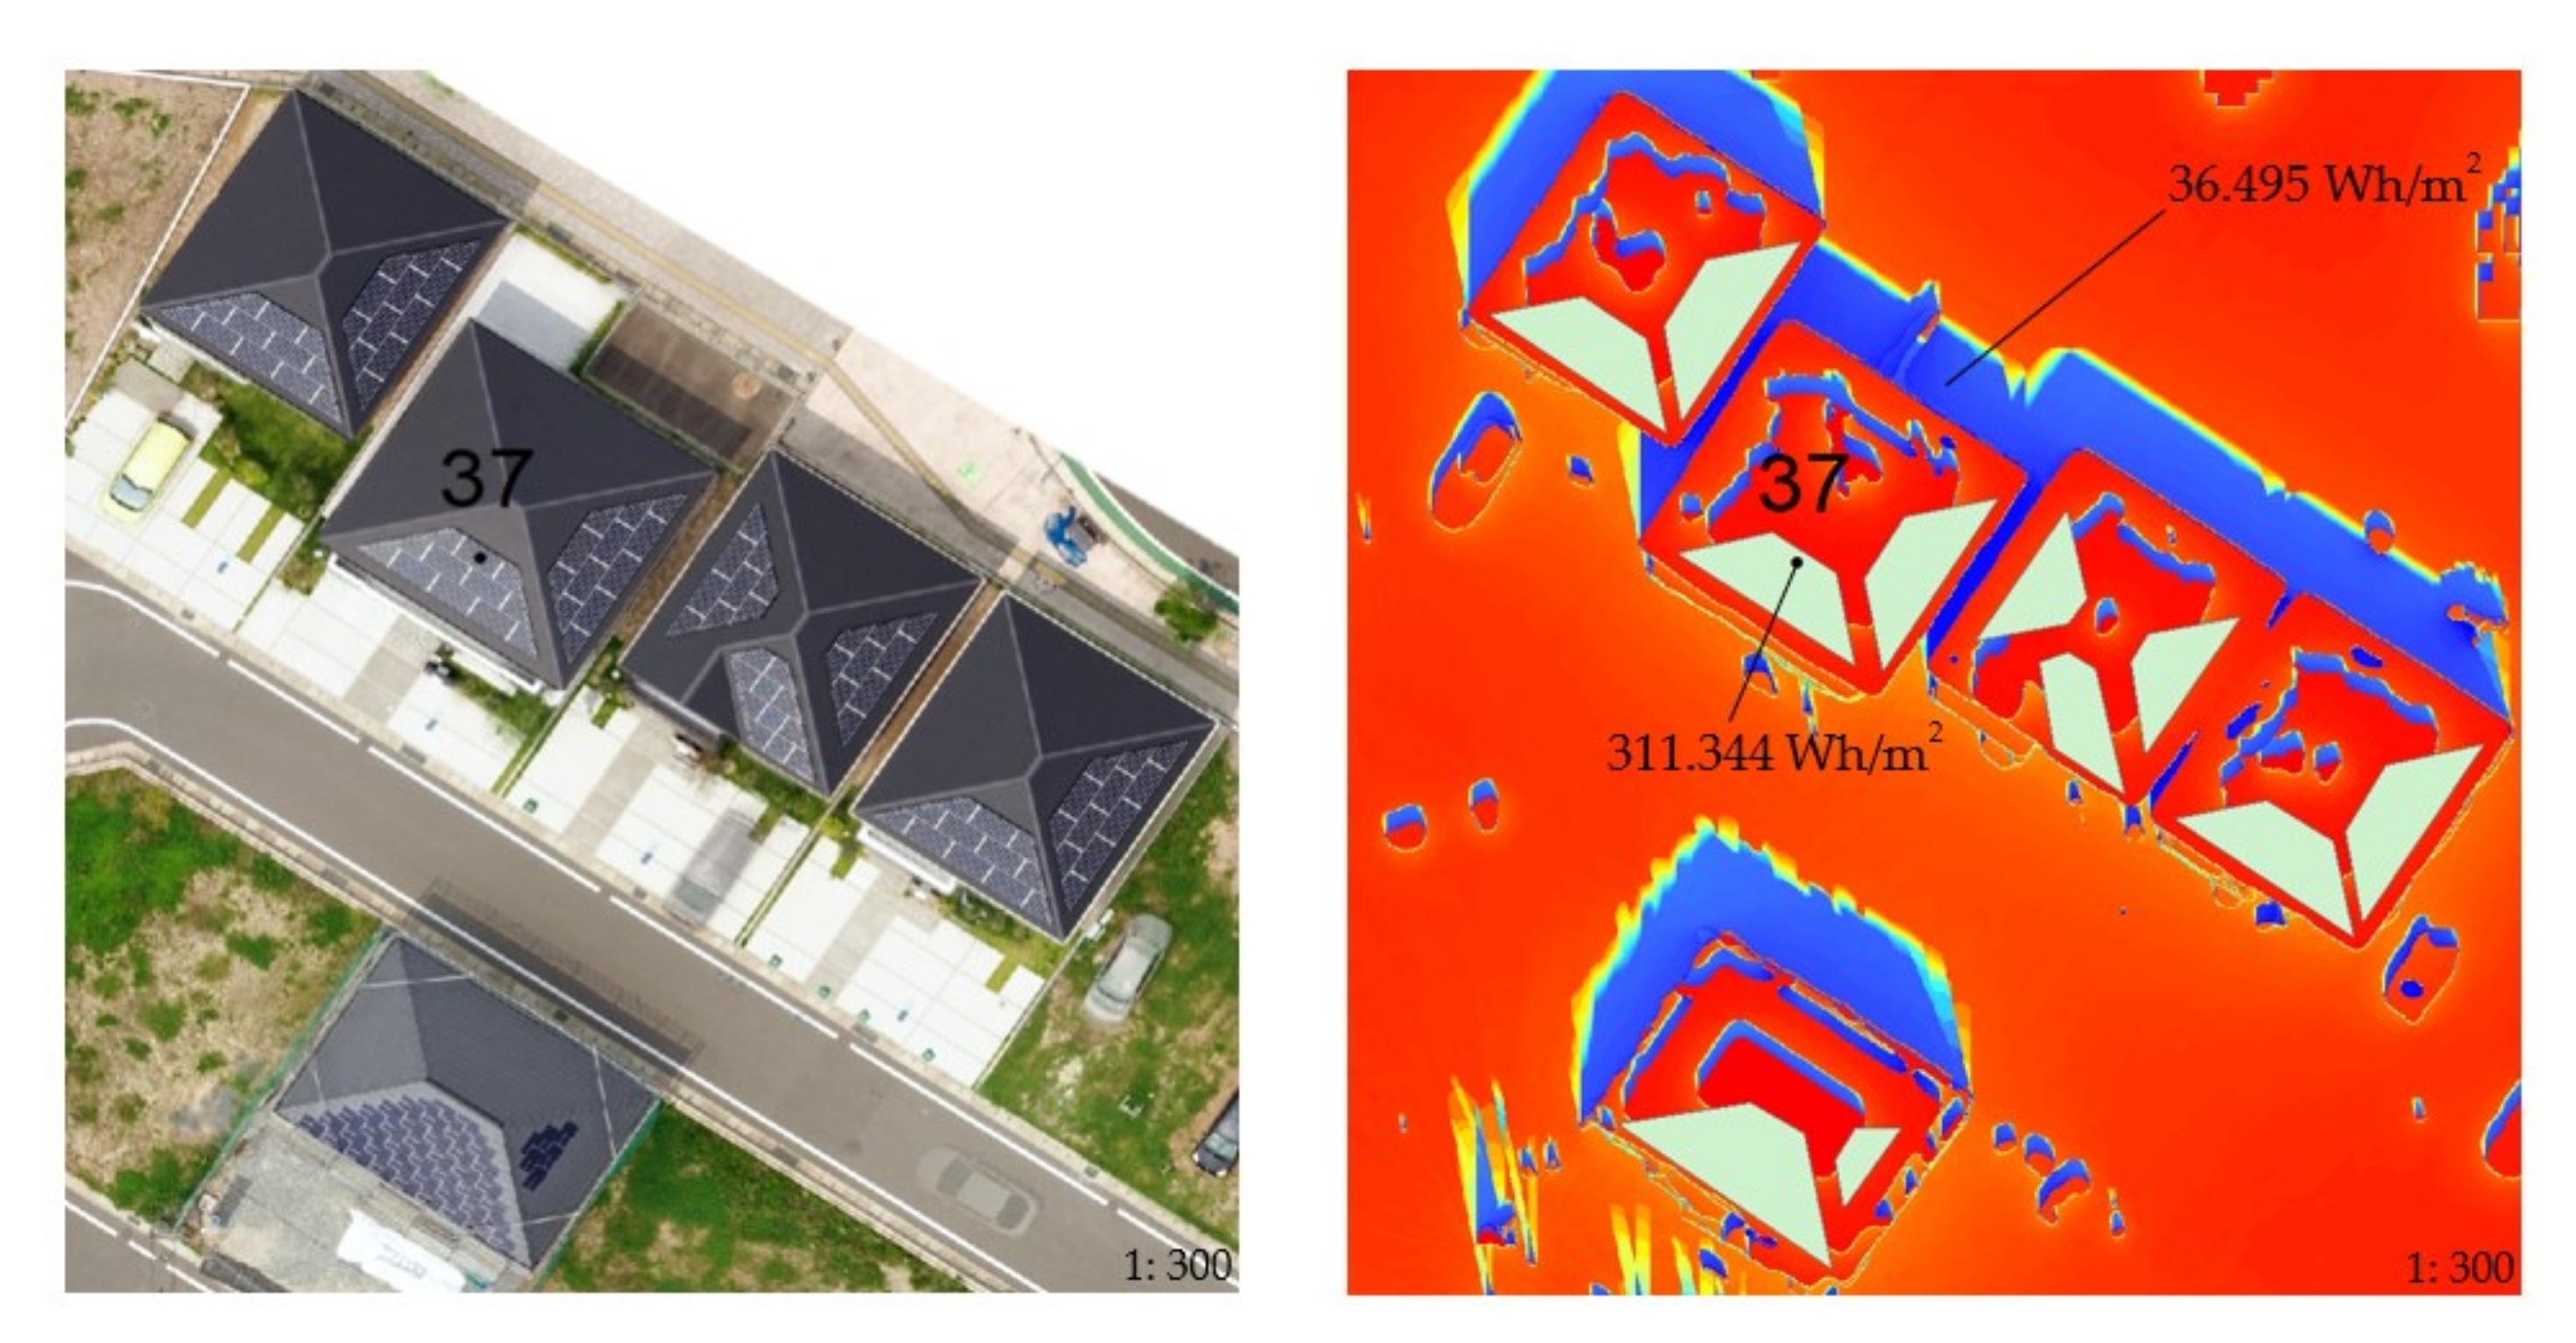
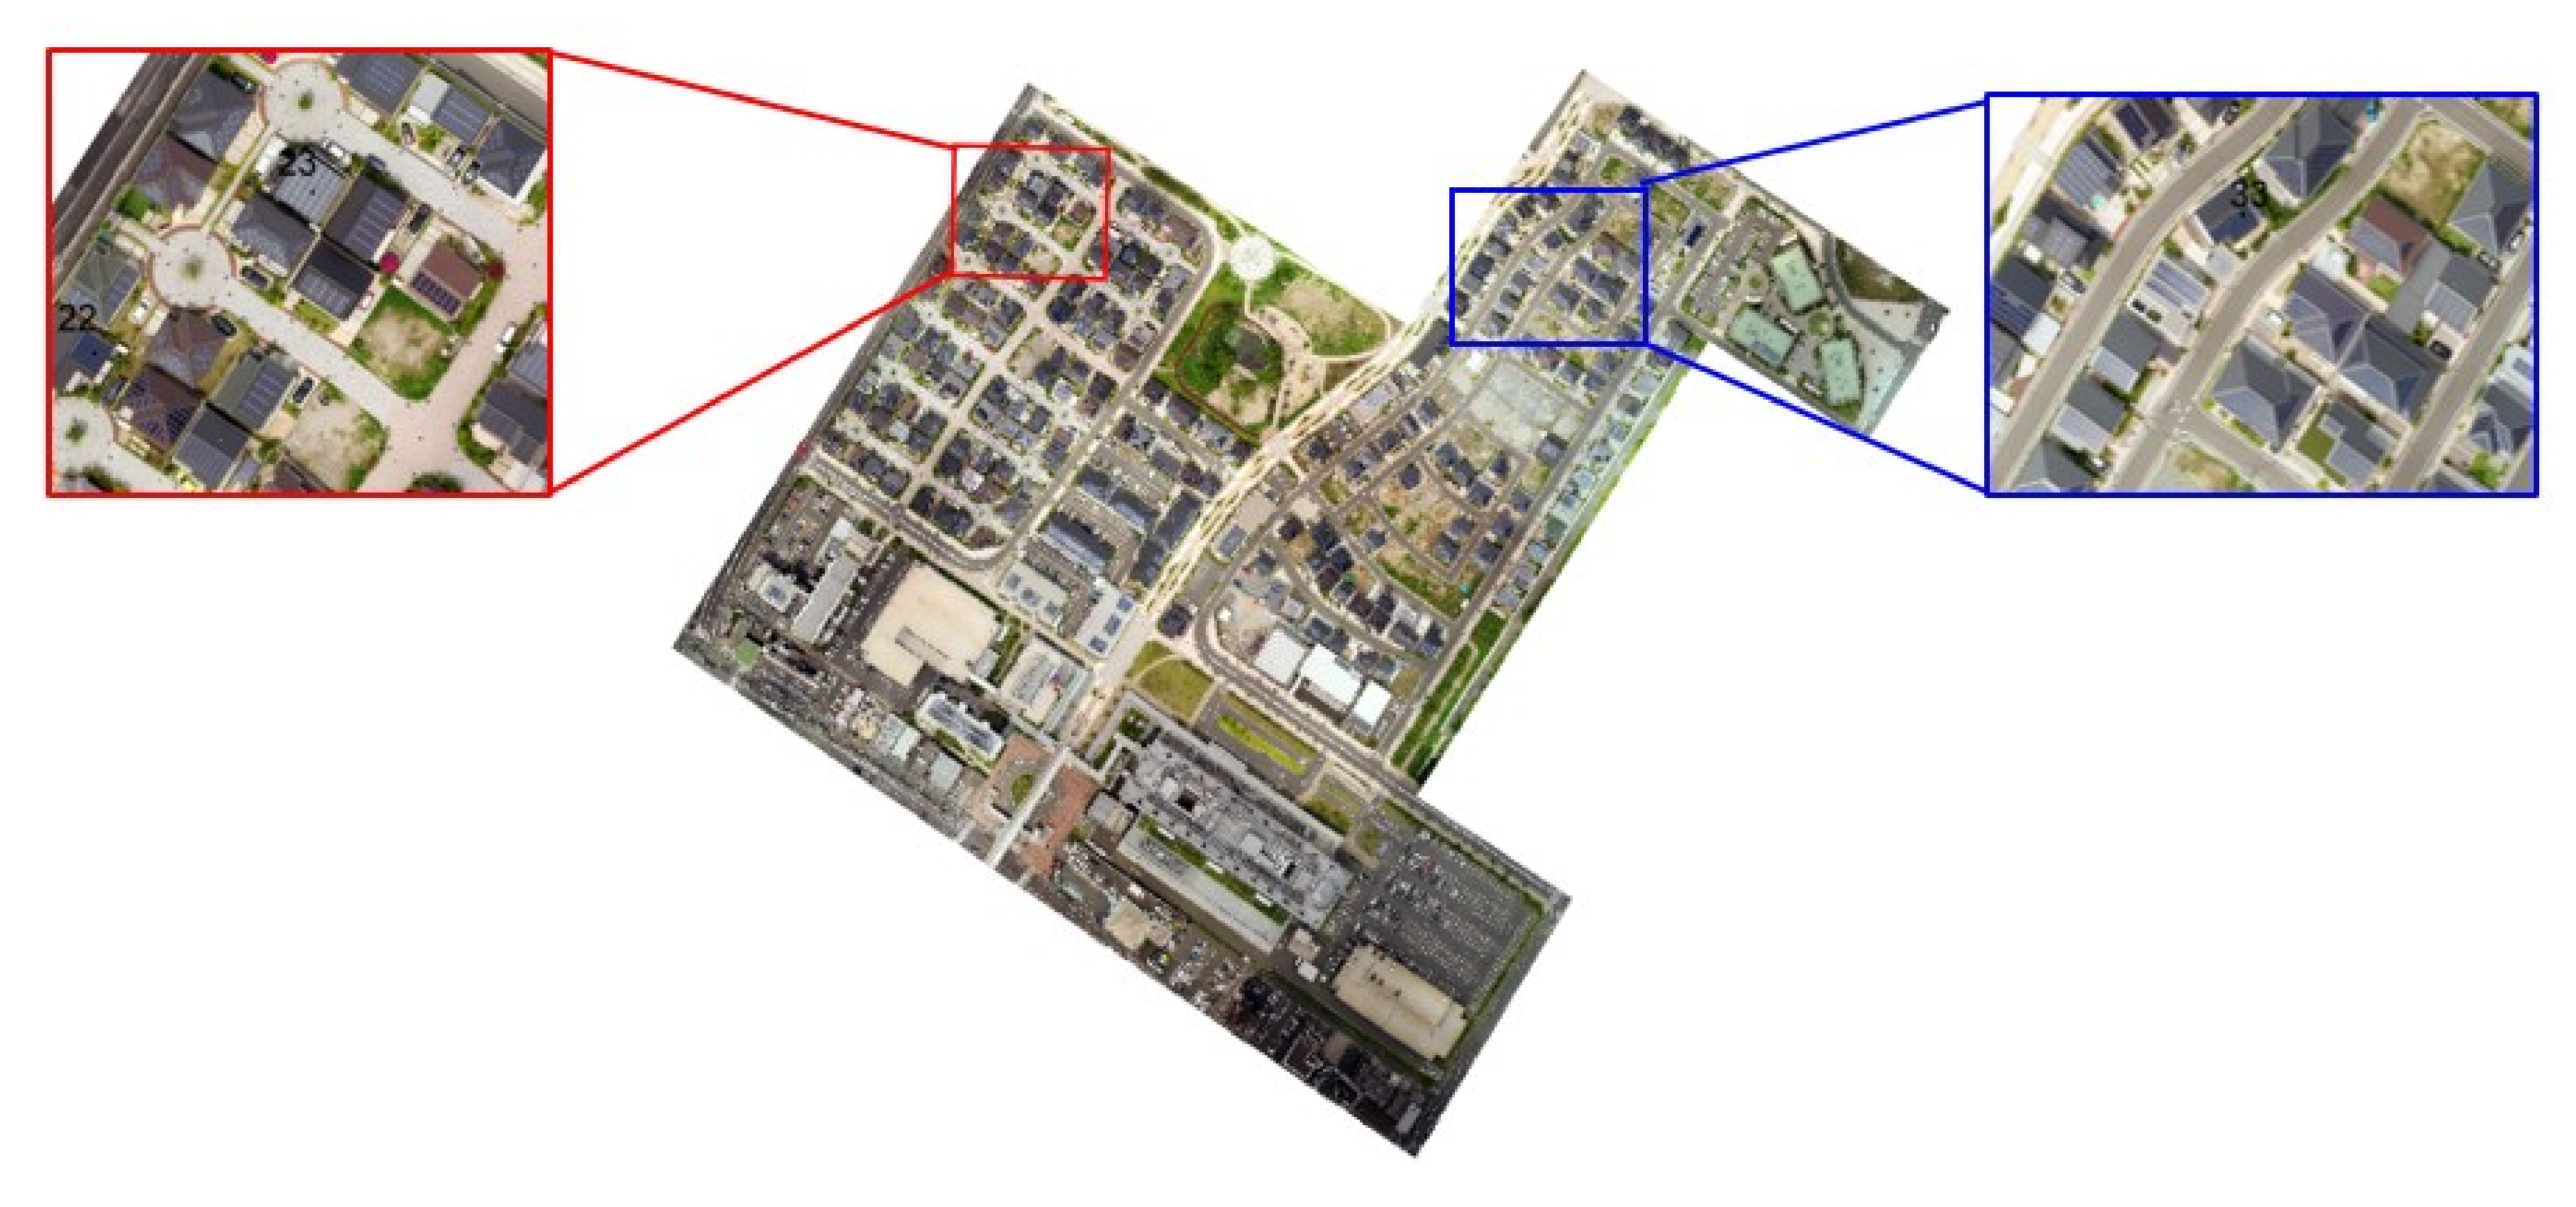
Figure 12 shows an expansion of the aerial photograph and the solar radiation map at the defined bus 37. The output results from the solar radiation map can be integrated with other data and features from the program. In this research, we created a cloud movement process to study the shadow effects on the area and applied this process to the distribution system.
To extract the entire solar radiation and shadow area from the Jono research area, this research focused on the effects of the shadows from the surrounding objects, such as trees, or buildings, when the shade covered the solar panels and reduced the PV generation.
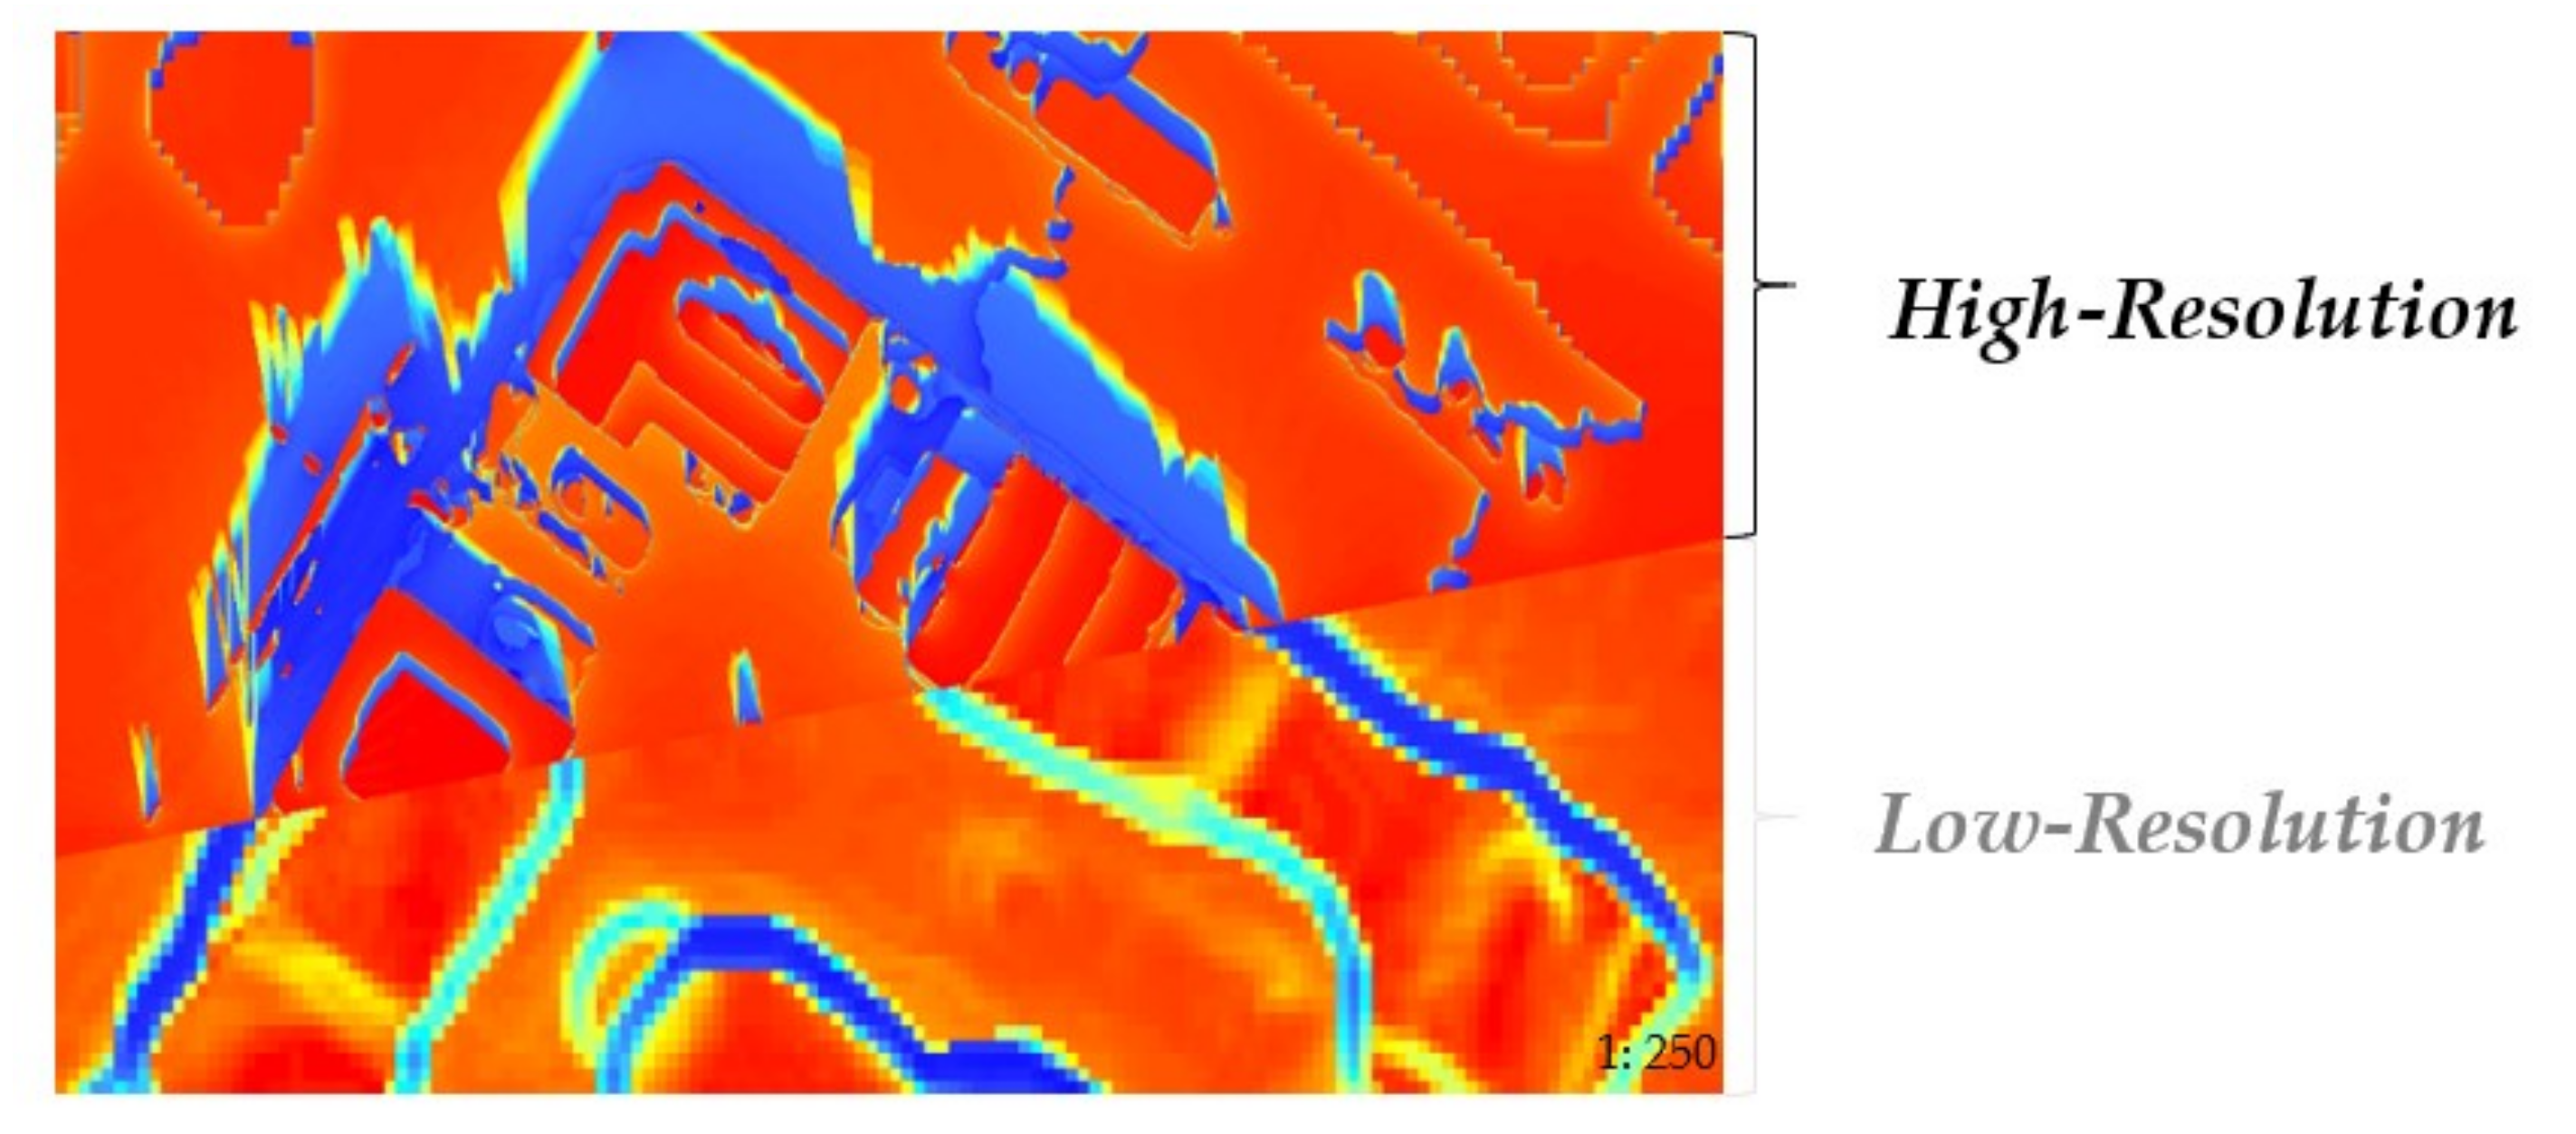
Figure 13 compares the aerial photograph of the Jono research area and the insolation map of the area between high and low-resolution.
After updating the DSM layer to high-resolution, the solar radiation map also improved to high-resolution. There are many merits of using the high-resolution Jono insolation map, such as better solar radiation estimates and a more precise solar panel size (
Figure 11). With the GIS program function, solar panels at each house can be defined according to the real world Jono residential area on the solar radiation map (
Figure 11). The green area from
Figure 12 shows some parts of the installed solar panels in a different pattern on each house in the Jono residential area.
Figure 12a shows the aerial photograph for one section of the Jono area.
Figure 12b,c, show the comparison between the high-resolution and low-resolution Jono solar radiation simulated by the GIS program in the same area but with different resolutions. When comparing
Figure 12b,c together, the shape of the surrounding area in
Figure 12b, such as the houses and shadows, can clearly be identified, as well as the shape, size, and angle of solar panel rooftops.
Figure 12c shows the low-resolution of the solar radiation map; by using the low-resolution map, it is difficult to precisely define the solar panel sizes on the rooftops.
For this reason, the solar power calculation cannot predict an exact value. Thus, it is better to employ a high-resolution map. However, high-resolution maps have the disadvantage of large data capacity. Due to the high-resolution, the size of the raster file is large. Thus, the compressed map size method is significant because of the limitations of computer performance. The compression procedure combines the low-resolution and high-resolution of the DSM layer using the mosaic to new raster tool and creating a new raster layer. Therefore, to efficiently analyze a wide area, it is necessary to combine a high-resolution map and a low-resolution map to compress the layer sizes.
Figure 13 shows the comparison between high- and low-resolution to demonstrate the difference.
3. Proposed Methodology and Simulation
This section demonstrates the methodology and the simulation of this research. After creating the specified date and time of the Jono solar radiation map, the cloud movement process was created and applied to the solar insolation map using the ArcGIS program. This was done to simulate the impact of cloud cover to the distribution system of the research area. Shadows from the surrounding area, such as trees and buildings, directly impact the solar panel, which reduces the power generation. The GIS program can calculate the solar radiation of the entire area.
The research area’s solar radiation with or without shadows can be represented on the map. However, the shade from the cloud cover cannot be demonstrated on the map in the solar radiation simulation. Thus, this research applied a novel cloud movement simulation algorithm created using the GIS program for solar radiation map simulation. This was done to assess the impact of cloud shadow on the distribution system. According to the Jono distribution model, the bus-point was defined by pinning it on the rooftop where the solar panel was located.
After obtaining the solar irradiance data, solar power from the designated bus area was estimated. The compatibility with the MATLAB/Simulink model of the Jono distribution system for analyzing the impact of shadows by clouds, buildings, and trees to voltage fluctuation in the distribution system was investigated. The cloud movement process, solar radiation map technique, PV power generation, and Jono distribution system are demonstrated further in the following section.
3.1. Cloud Movement Process
3.1.1. Cloud Movement Method
This section represents the methodology of capturing the cloud movement simulation on the real world’s solar radiation map created by the GIS program to apply the reduced solar radiation from the shadow of a simulated cloud’s path on the distribution system with a high percentage of solar panel installations. After creating the solar radiation map, the cloud paths were simulated for the specified date and time by considering the weather conditions.
The example simulation date and time was 19 September 2019, from 12:00 to 12:30 p.m. with sunny day conditions. We identified the decrease of the solar radiation value due to the cloud’s shadow covering the solar panel in the Jono research area. The solar irradiation map and value were configured from the Jono DSM layers and the solar radiation function using the GIS program. However, the solar radiation map can extract the entire research area’s solar radiation, and only the area covered by the shadow from the surrounding area.
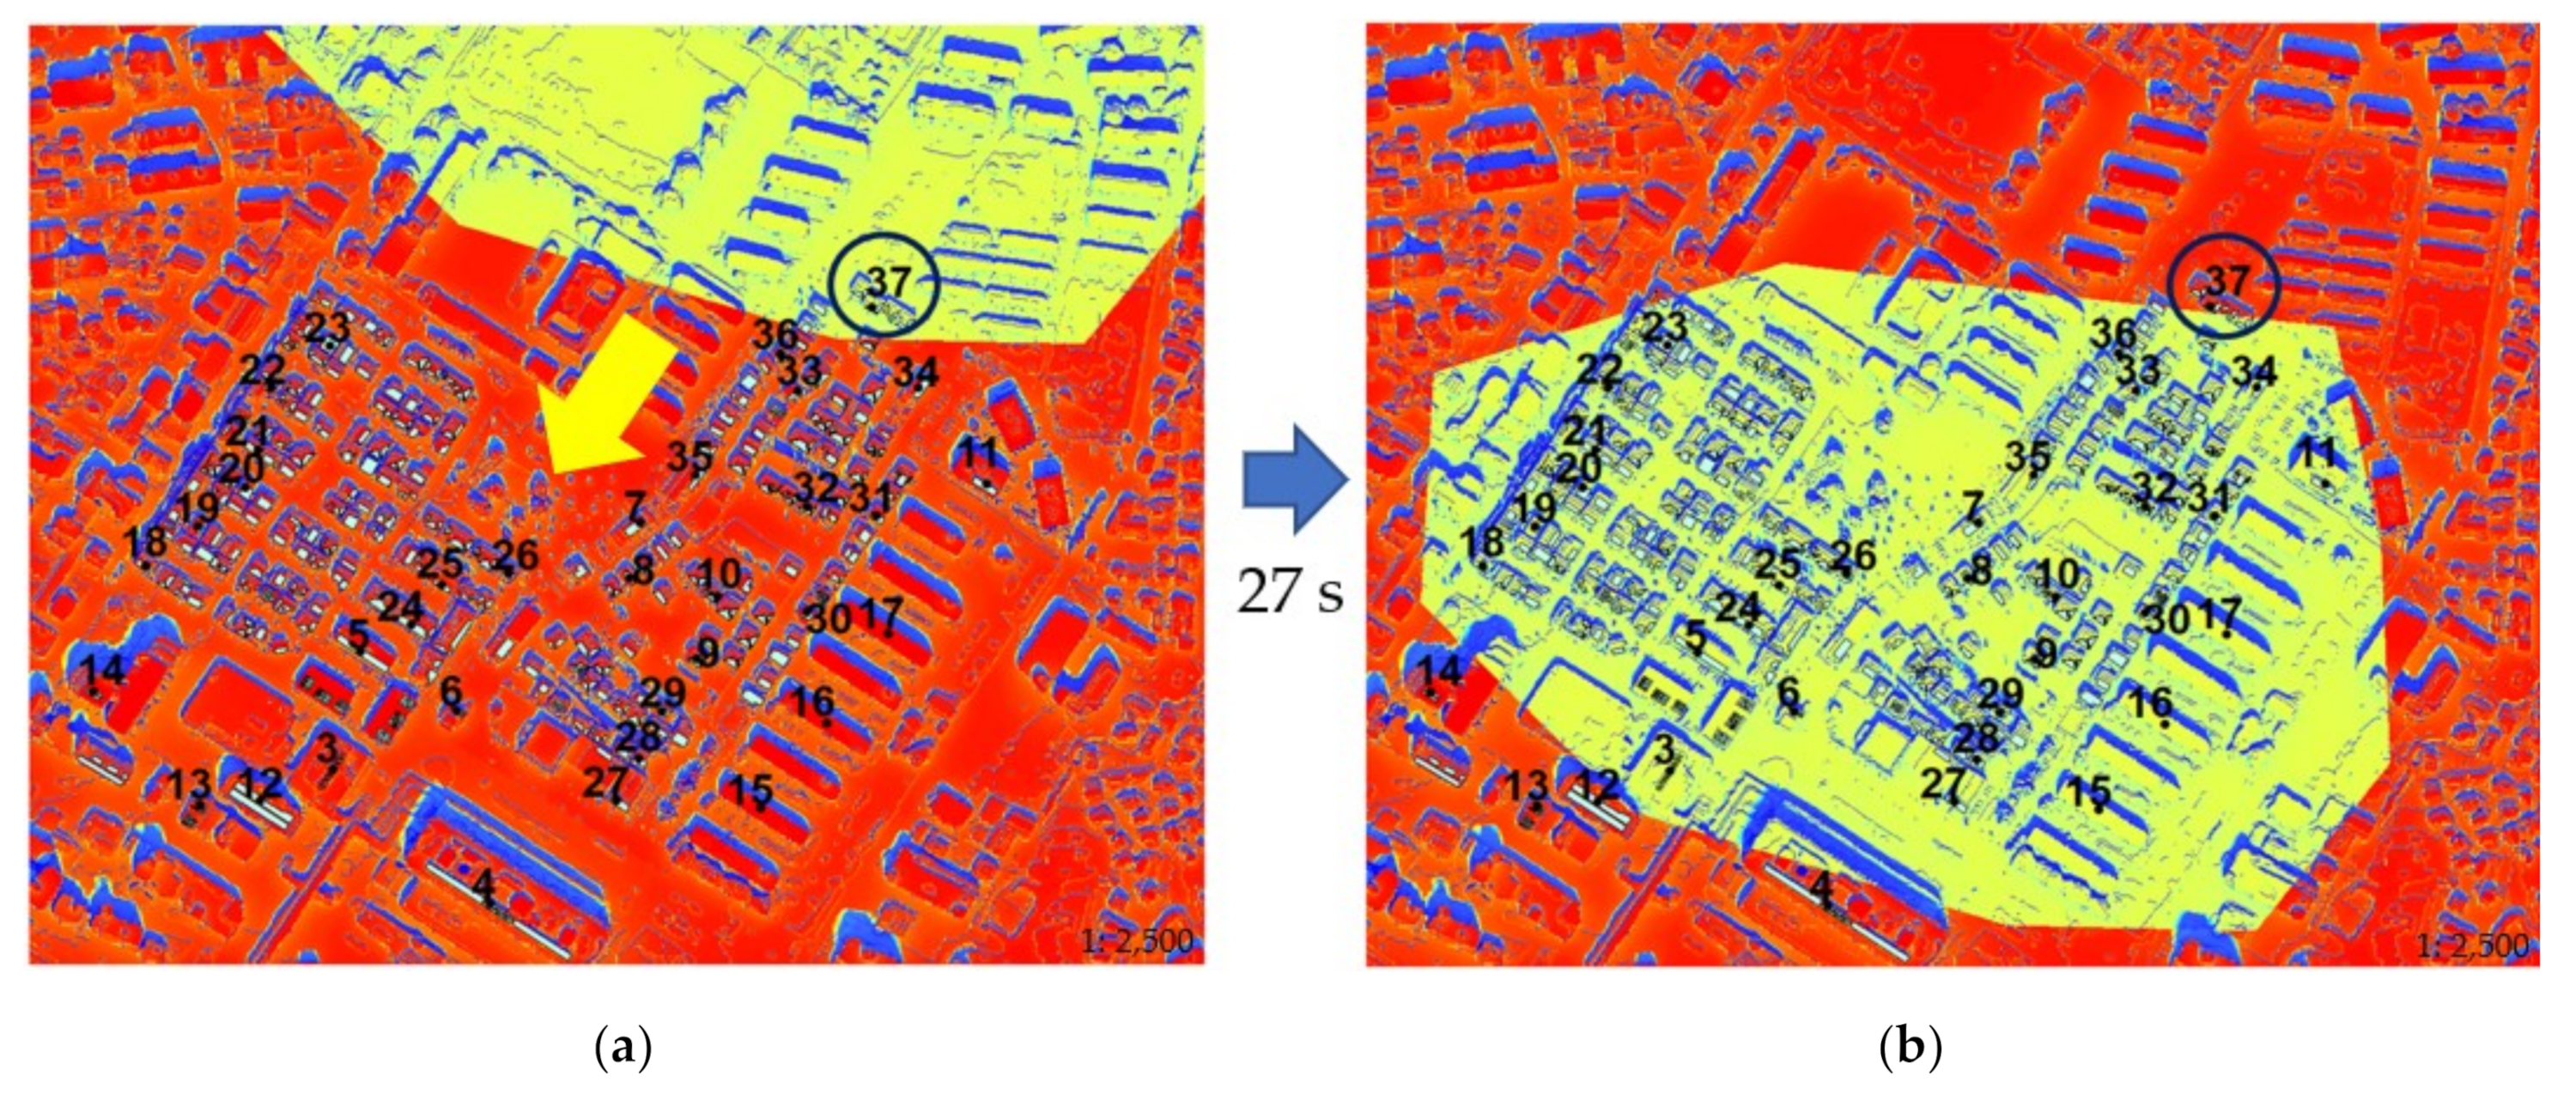
For this reason, the cloud movement method was applied to this work. We assumed a cloud path in 1 min (60 s), and only one cloud was used to cover almost the entire Jono area. We simulated 60 clouds (for 60 s) and one cloud per solar radiation map layer. The shadow from a cloud-covered area that decreased the solar radiation by 60.56% had to be determined. The calculation of the cloud’s transparency is interpreted further in
Section 3.1.2. At 7 s, the cloud started to move into the research area and covered bus 37.
We assumed the cloud moved in a southwest direction. After passing 27 s, the cloud moved out from bus 37 (at 34 s). At 59 s, the cloud departed from the research area at bus 4.
Figure 14 and
Figure 15 show the cloud movement process simulated on the solar radiation map created by the GIS program. The color of shade from trees and buildings is a blue color, and the shade from the cloud is a yellow color as displayed on the Jono solar radiation map. The solar radiation of the bus area is decreased due to the cloud shadow. For this reason, the solar power from the panels in the Jono area is reduced due to the cloud’s shadow from the simulation.
Figure 15 shows the cloud movement process workflow function. To create the cloud movement methodology, spatial analysis tools, and related functions were used to create a cloud in the solar radiation map and the movement process. The feature class function was used to create sixty pictures of the cloud per second and to combine them to create the cloud movement path. The clip function was used to combine the cloud picture and the solar radiation map to be in the same layer. Then, the times function was applied to define the transparency of the cloud. We assumed 60.56% of solar radiation to be cut by the cloud’s layer. Finally, the mosaic to a new raster function was employed to combine the cloud layer with the solar radiation map.
3.1.2. Transparency of the Cloud
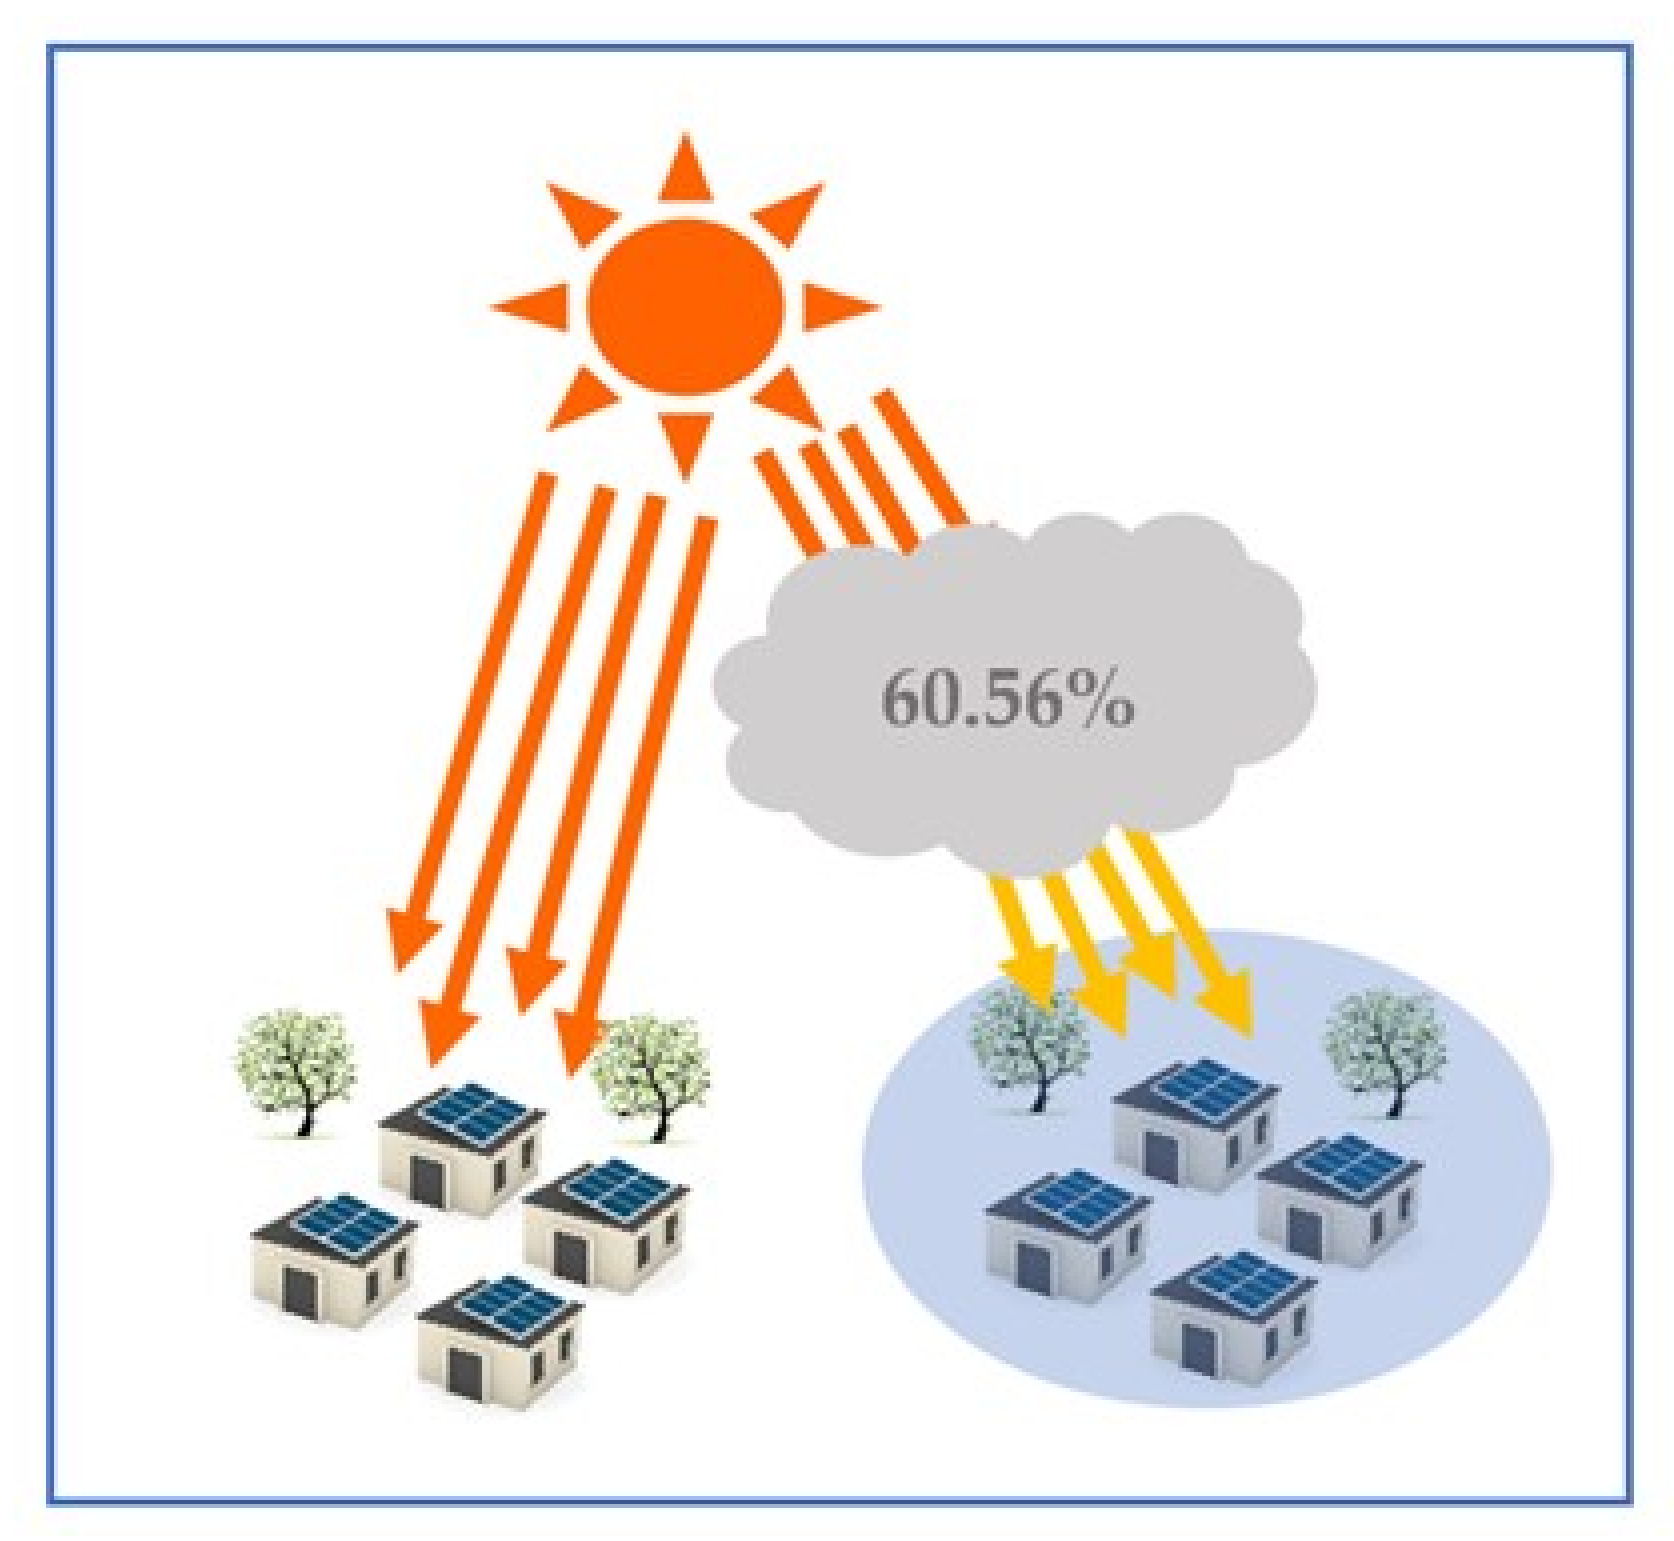
The cloud transparency is when the cloud allows light from the sun to pass through, and the shadow of the cloud covers the area. The high penetration of the solar rooftop area, which the cloud covers, was directly impacted by the shadows.
Figure 16 shows that the area that is not covered by the cloud obtained around 100% of the sun’s insolation.
On the other hand, for the area covered by the cloud, the solar radiation value was decreased due to the transparency from the cloud. For this reason, solar radiation after passing through the cloud was 60.56% of the solar radiation. The cloud layer openness in this research was 0.6056 or 60.56% of the solar radiation value as shown in the following Equation (1):
The transparency was calculated from the maximum solar radiation value in cloudy and sunny day conditions simulated by the GIS program. The sunny day insolation value was 404.083 Wh/m2 by picking up the value from 19 September 2019 (same date as the solar radiation map, the example day) and 244.711 Wh/m2 from the cloudy day conditions. Both solar radiation values were checked from the pyranometer installation on the laboratory’s rooftop, which collected the data in real-time.
3.2. PV Power Generation Calculation by Using Solar Radiation Map
The GIS program calculated the Jono solar radiation map on the sunny day conditions for 19 September 2019, with a simulation time of 12:00–12:30 p.m., with effects from trees, buildings, and clouds. The solar radiation map simulation was 30 min, because the area solar radiation function calculates the solar radiation map every 30 min. The real-time solar radiation values (Wh/m2) were collected from each defined bus from the Jono solar radiation map. For example, we collected the solar radiation at defined bus 37.
Figure 11 shows the defined bus 37 and panels (the light green color area) in the solar radiation map. From the map, the collected values are in watt-hour per m
2. This Jono solar radiation map had a maximum value of 313.058 Wh/m
2, the example bus 37 had 311.344 Wh/m
2, and the lowest solar radiation value (shaded area—blue color in the map) was 28.2 Wh/m
2. Thus, the solar radiation unit was transformed to kW/m
2 for compatibility with the Jono distribution model from the MATLAB/Simulink program. The transformation from Wh/m
2 to kW/m
2 is given by the following Equation (2):
where the solar radiation values were collected from each bus point from the solar radiation map in Wh/m
2. The value of 0.5 h corresponds to 30 min of the solar radiation simulation by function analysis.
At bus 37, after transforming the Wh/m2 unit to a solar radiation value in kW/m2 units, the solar radiation was 0.623 kW/m2. After applying the cloud movement process to the Jono residential area, we collected the solar radiation values with the reduced values in 1 min (60 s) for the duration when cloud moved past the area.
The solar radiation value when the cloud covered the bus 37 area was 0.378 kW/m
2. The solar power can be estimated by calculations from the solar radiation value collected from the solar radiation map and solar panel size. The reduced solar radiation value results were used in the Jono actual distribution system model created by MATLAB/Simulink. The unit of solar power used in the MATLAB/Simulink model is kW. The transforming equation from kW/m
2 to kW is given by the following Equation (3):
where the solar radiation value (kW/m
2) is applied. The average area of the PV panels in the Jono residential area as measured by the GIS program was 25 m
2, as the total solar rooftop size on each household varied between 10 to 30 m
2. Thus, in this work, we estimated the size of panels. The United States Environmental Protection Agency (EPA) provides a conservative best estimate of 15% efficiency and an 86% performance ratio. These values mean that the solar panels are capable of converting 15% of the incoming solar energy into electricity, and 86% of that electricity is maintained throughout the installation [
21].
After the solar power in kW unit transformation, the solar power values were used for compatibility with the Jono distribution model in the MATLAB/Simulink program to determine the impact from the shadows of clouds, buildings, and trees on the voltage fluctuations in the Jono distribution system. The distribution system in this research is interpreted in the following section.
3.3. Power Distribution System
In this work, the distribution model was created in the MATLAB/Simulink program. The distribution model was modified from the real world area in Kitakyushu city. The Jono Area is known as a smart community area with high solar panel installation and a FC cogeneration system. The Jono distribution system was chosen to consider the impact of the cloud movement process on the Jono distribution system with the solar panel high installation area and the real consumption data from the households in the research area. For this reason, the FC cogeneration system will be applied to the model in future work.
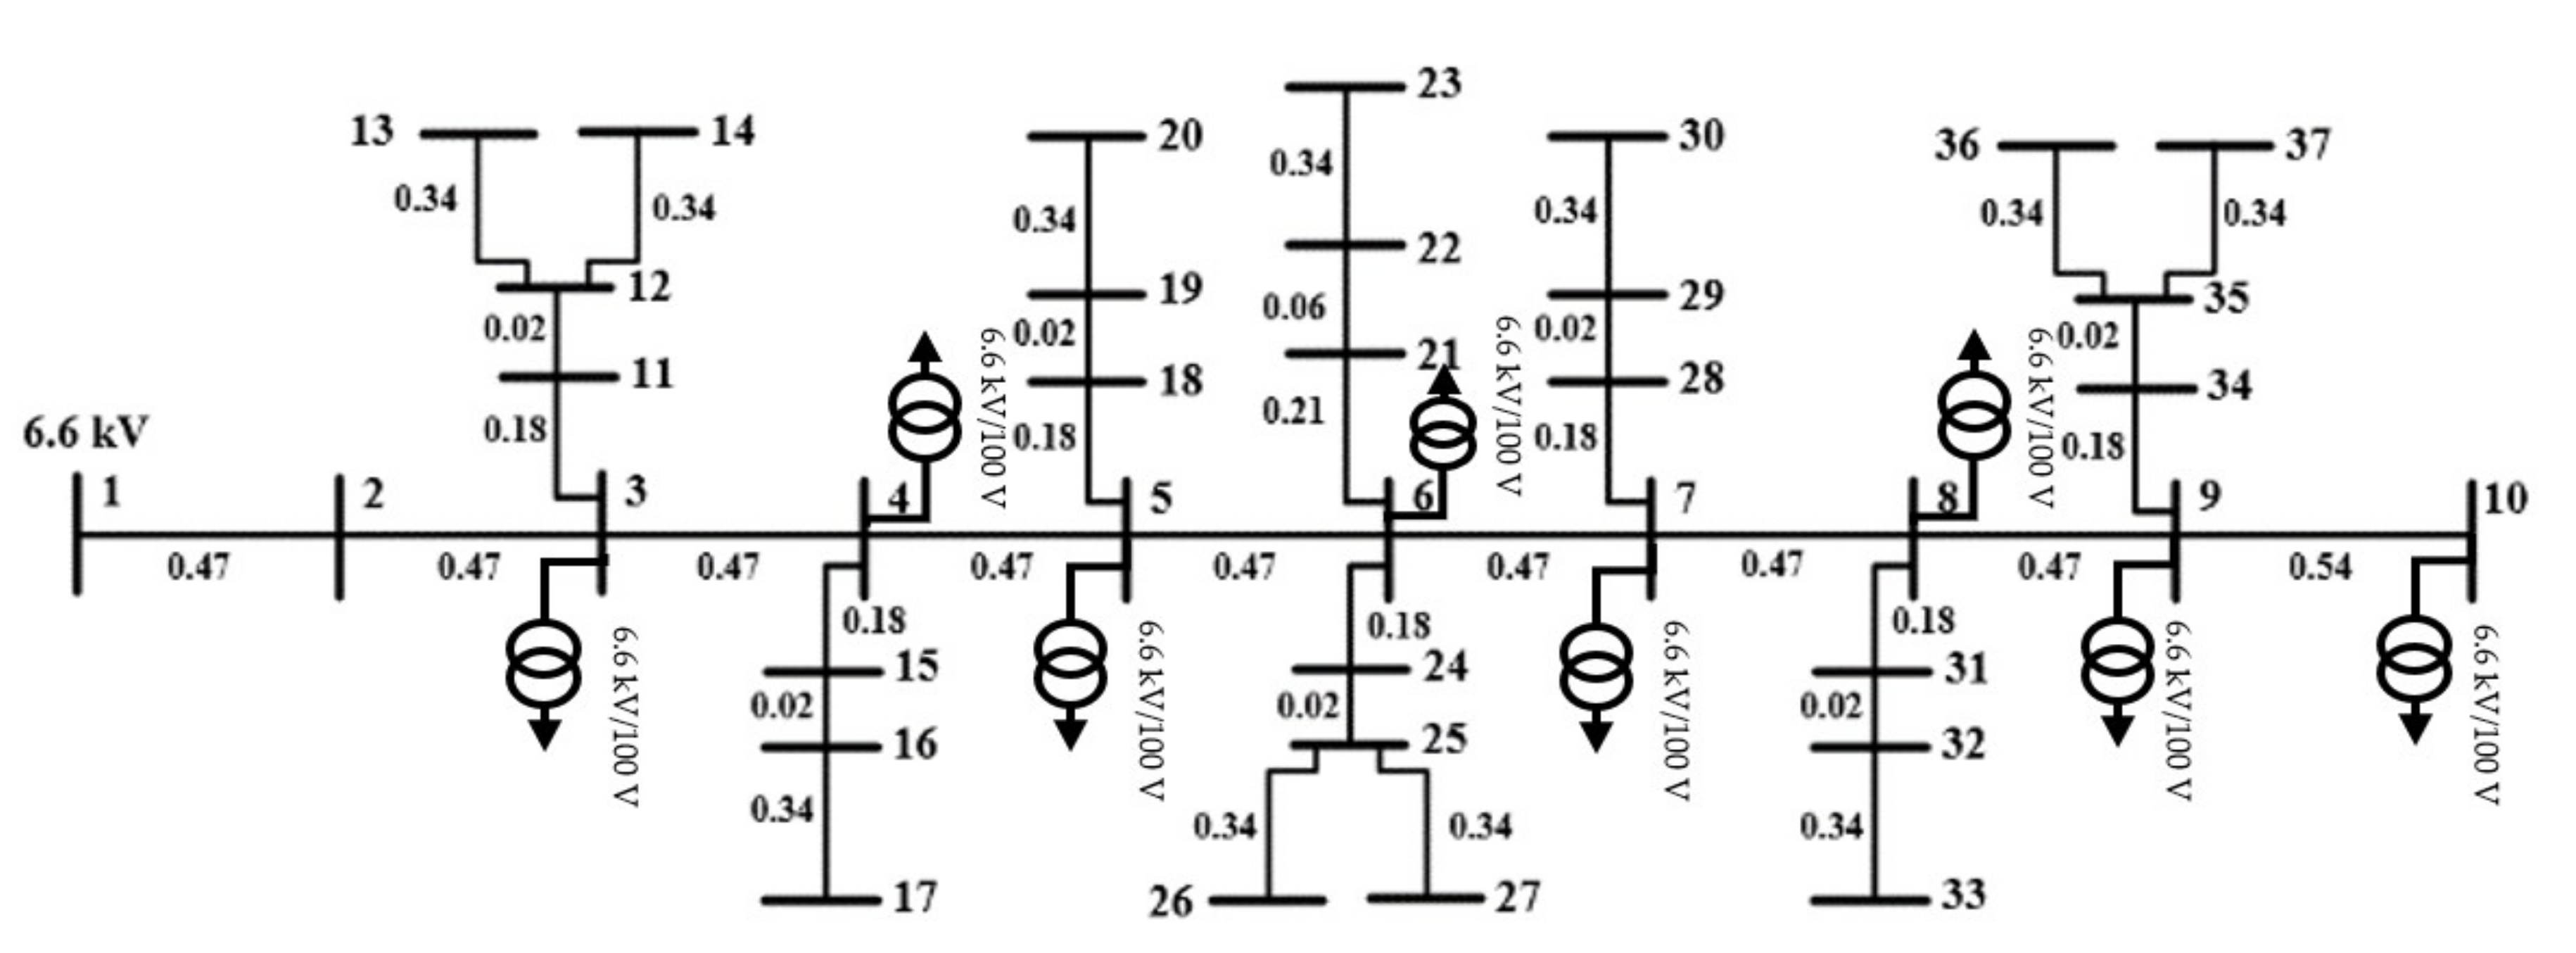
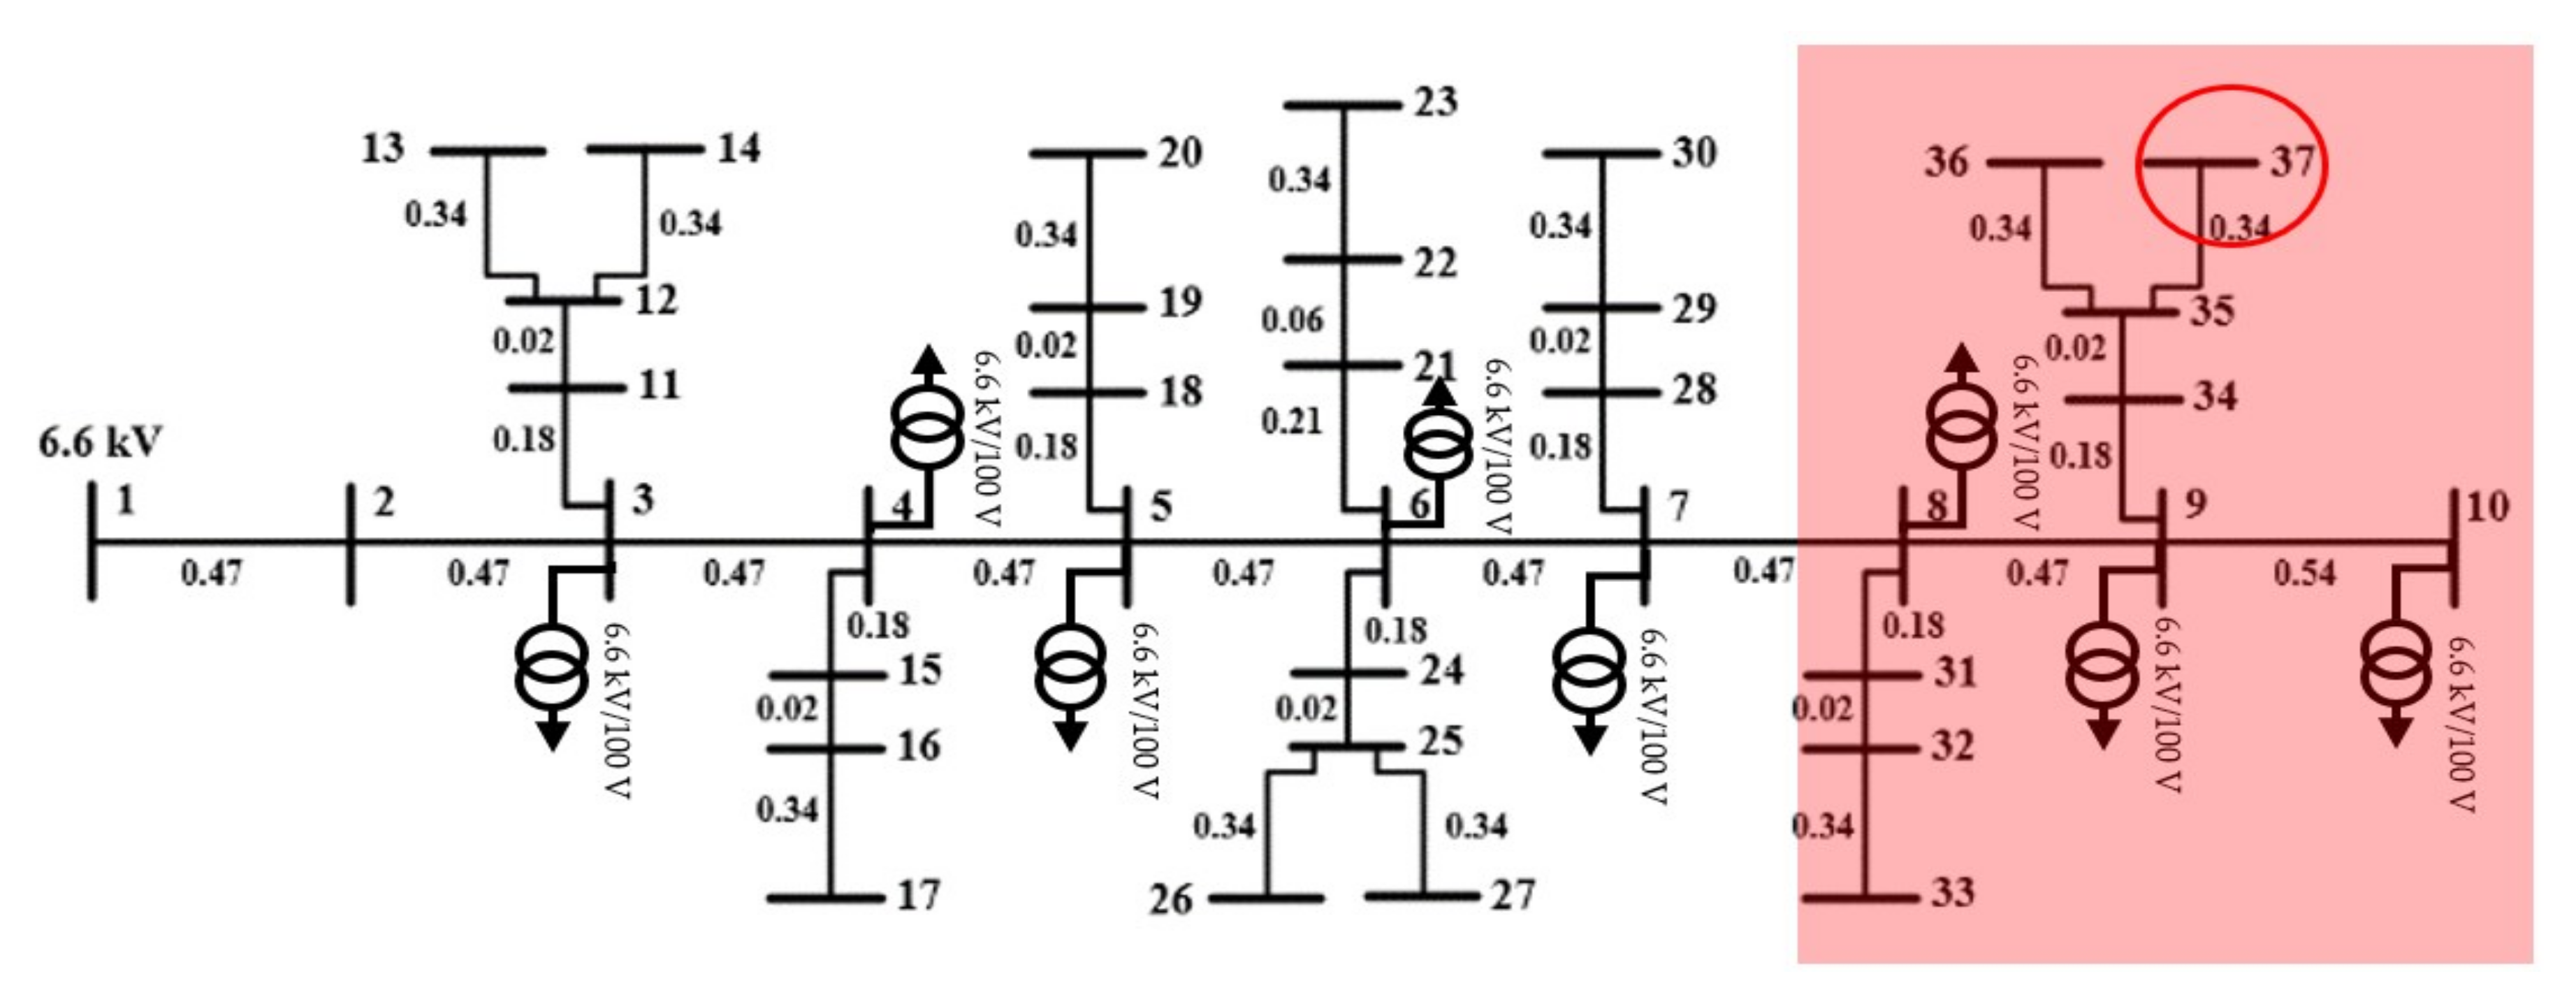
Figure 17 shows the Jono distribution model according to the real world residential area.
Figure 18 shows the designated bus area of bus 22, 23, and 33 as a real world map. According to the residential area in the Jono solar radiation map, this work defined household buses from bus 3 to bus 37 (35 buses). Bus 1, 2, 3, 4, 5, 6, 7, 8, 9, and 10 are the main buses; buses 1 and 2 are slack buses; and buses 11 to 37 are household buses. The buses were defined by choosing the solar panels in the Jono residential area to collect the solar radiation from solar radiation map and to predict the accurate solar power for each panel.
The voltage between buses was 6.6 kV, and the voltage on the household side was 100 V. This research assumed that there were 500 households and that, from bus 3 to bus 9 consisted of 12 households per bus, bus 10 to bus 36 consisted of 15 households per bus, and bus 37 consisted of 14 households per bus. This research simulated on the rooftop of every bus the rate of installation of panels as 50% and 100% of the connected houses. We examined the voltage fluctuations in the distribution system due to the shadows from cloud movement simulation together with half and full installation of solar panels. The Jono model input is solar power (Wh/m2) with the cloud movement process. The simulation and results analysis are described in the following section.
4. Results Analysis
The previous chapter described the simulation’s cloud movement process on 19 September 2019, with a simulation time from 12:00 to 12:30 p.m., at a specific research place in the Jono distribution system. In this section, the results are analyzed to prove the impact from cloud’s shadows on the cloud movement process and the environmental shading on the solar rooftop to the distribution system and to examine the system’s voltage fluctuation.
We assumed high installation of solar panels in the Jono distribution system in two simulations at 50% and 100% of the system’s solar panel installation potential. In the following sections, we interpret the results of the voltage fluctuation graph for the low voltage side (~100 V), meaning the voltage in the households’ area in the defined buses located on the solar panels, and the high voltage side (~6600 V), meaning the voltage between the distribution buses.
The voltage graphs from
Section 4.1 and
Section 4.2 show the voltage fluctuation simulation graph of 50%, meaning 50% of the solar panels installed in the Jono residential area, and 100%, meaning every house in the research area installed solar panels. This research assumed that the cloud moved into the research area at 7 s and covered the panels of bus 37.
Figure 19 shows the area of the distribution system that was directly impacted by the cloud’s shadow and the voltage drop that occurred on both sides (100 and 6600 V).
The voltage fluctuation graphs in the following sections show the two simulations while the cloud was covering above bus 37. The simulation of half and full solar panels installation shows the importance of planning the solar panels before installation together with the impact of the clouds on the distribution system. The results analysis is interpreted in the following sections.
4.1. The Simulation of 50% of Solar Panel Installation in the System
The simulation results are shown in
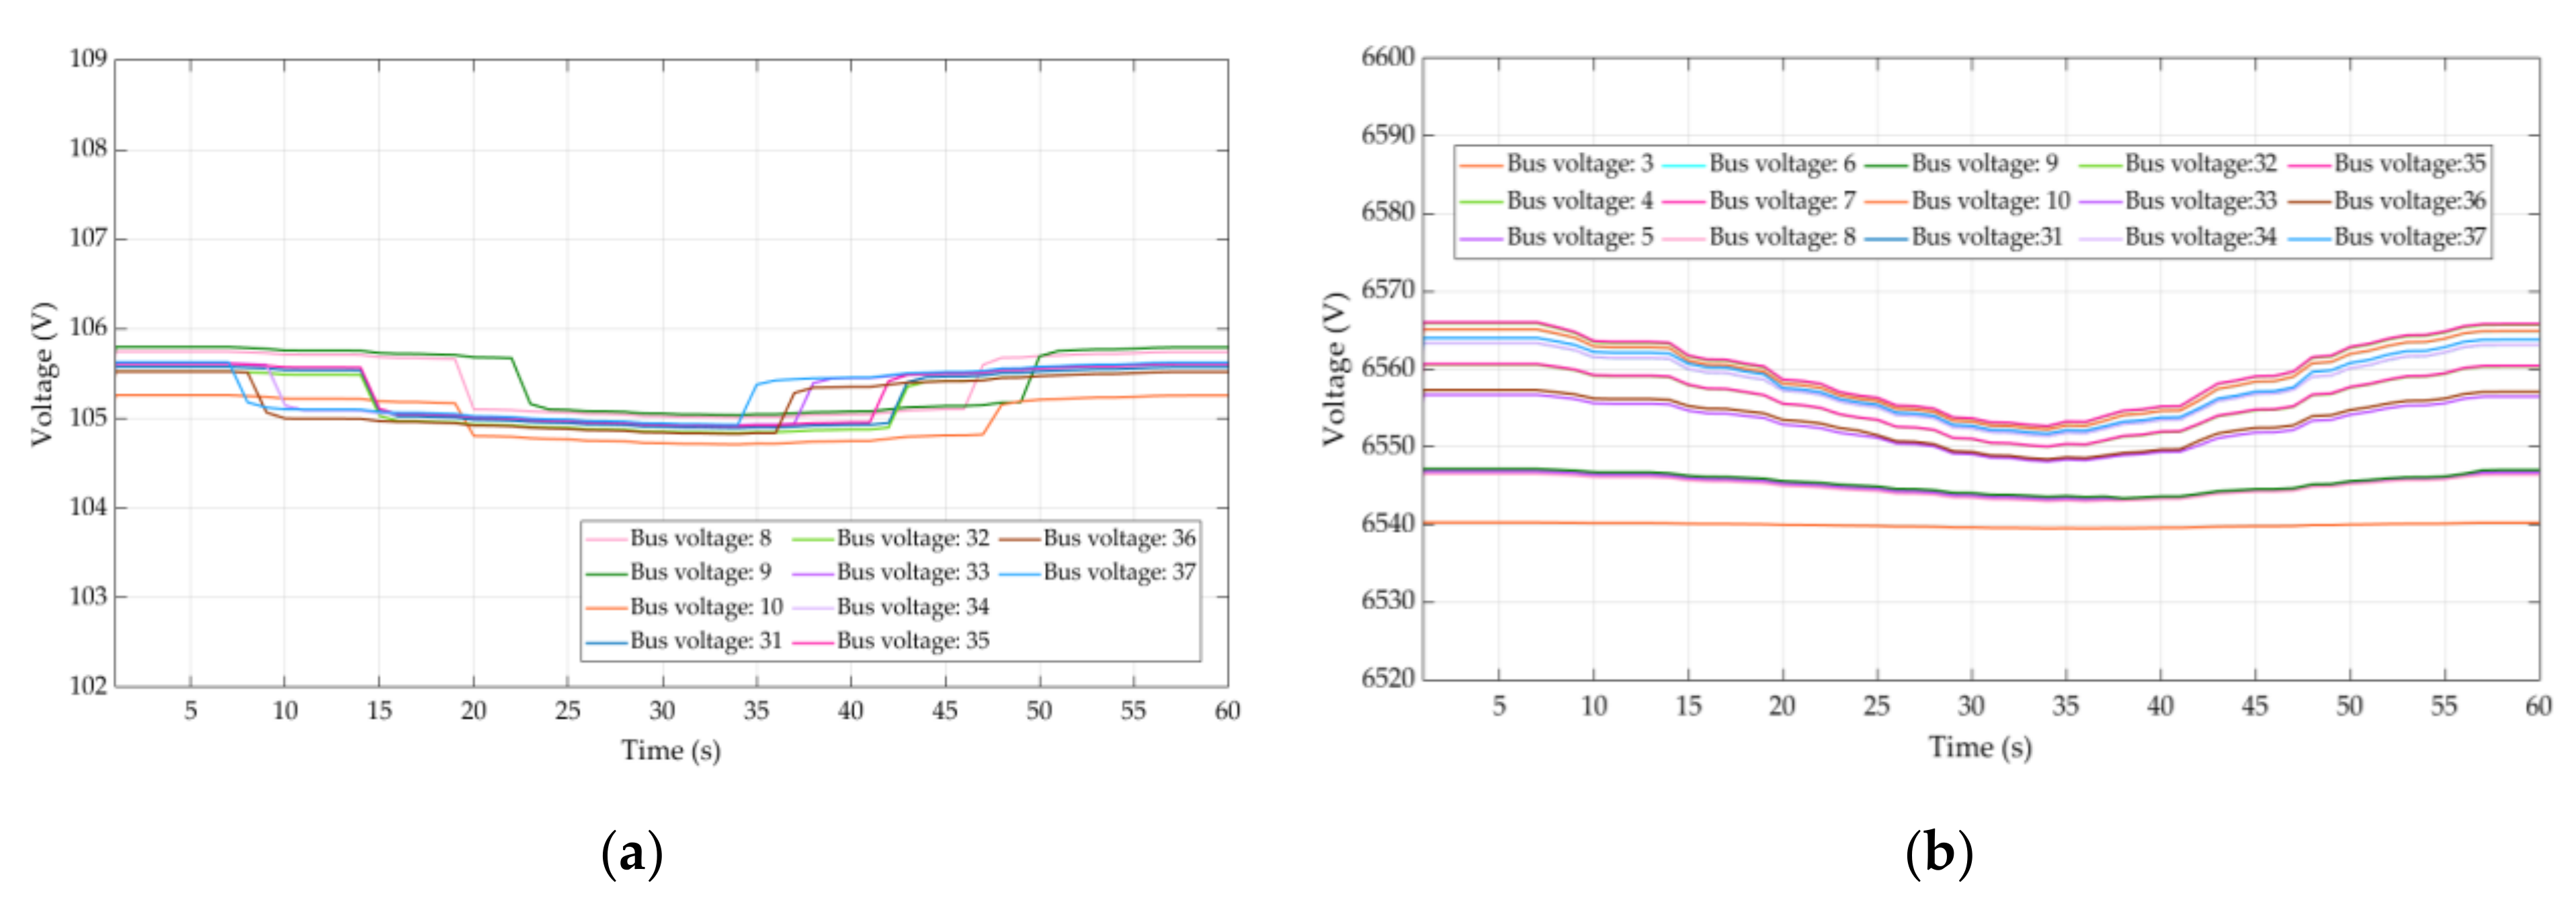
Figure 20a,b, while the cloud was covering bus 37. The graph of
Figure 20a shows the low voltage side (around 101 to 107 V) of each consumer’s household in the residential area.
Figure 20b shows the high voltage side (around 6600 V) between the distribution buses. Both sides have voltage fluctuations following the shadow from the cloud. This simulation assumed the Jono distribution system with 50% solar panel installation. The example bus of this graph is bus 37. When the cloud covered bus 37 (light-blue line in the graph), the voltage drop from 7 s to 33 s was as shown in
Figure 20a. At bus 37, the voltage dropped until the cloud passed over the bus 37 area, and then the voltage returned to the original voltage.
Figure 20b shows the influences of the voltage drop from bus 37 on the low voltage side (the residential area side) to the overall system. At 7 s, the cloud covered defined bus 37 made the voltage in the connected buses from the model (buses 8, 9, 10, 31, 32, 33, 34, 35, 36, and 37) drop, following the shade of a cloud. However, the others buses (such as the main buses) showed a voltage drop due to the cloud’s shade in descending order due to their respective distances from bus 37. In this way, those buses closest to bus 37, obtain influence from the voltage drop in the wide area as shown in
Figure 19 (red area).
The graph of 6600 V showed that, at 30 s, the curve of all lines dropped the most because the cloud covered almost the entire Jono residential area.
Figure 21 shows the cloud covering almost the entire residential area (at 33 s). The buses in the 6600 V (distribution side) area are directly connected to each other, leading to the ability to support each other’s voltages. On the other hand, the low voltage side (household side) buses are independent because the households at difference distribution buses are not connected to each other on the low voltage side. They simply connect to the 6600 V bus through a feeder.
4.2. The Simulation of 100% of Solar Panels Installation in System
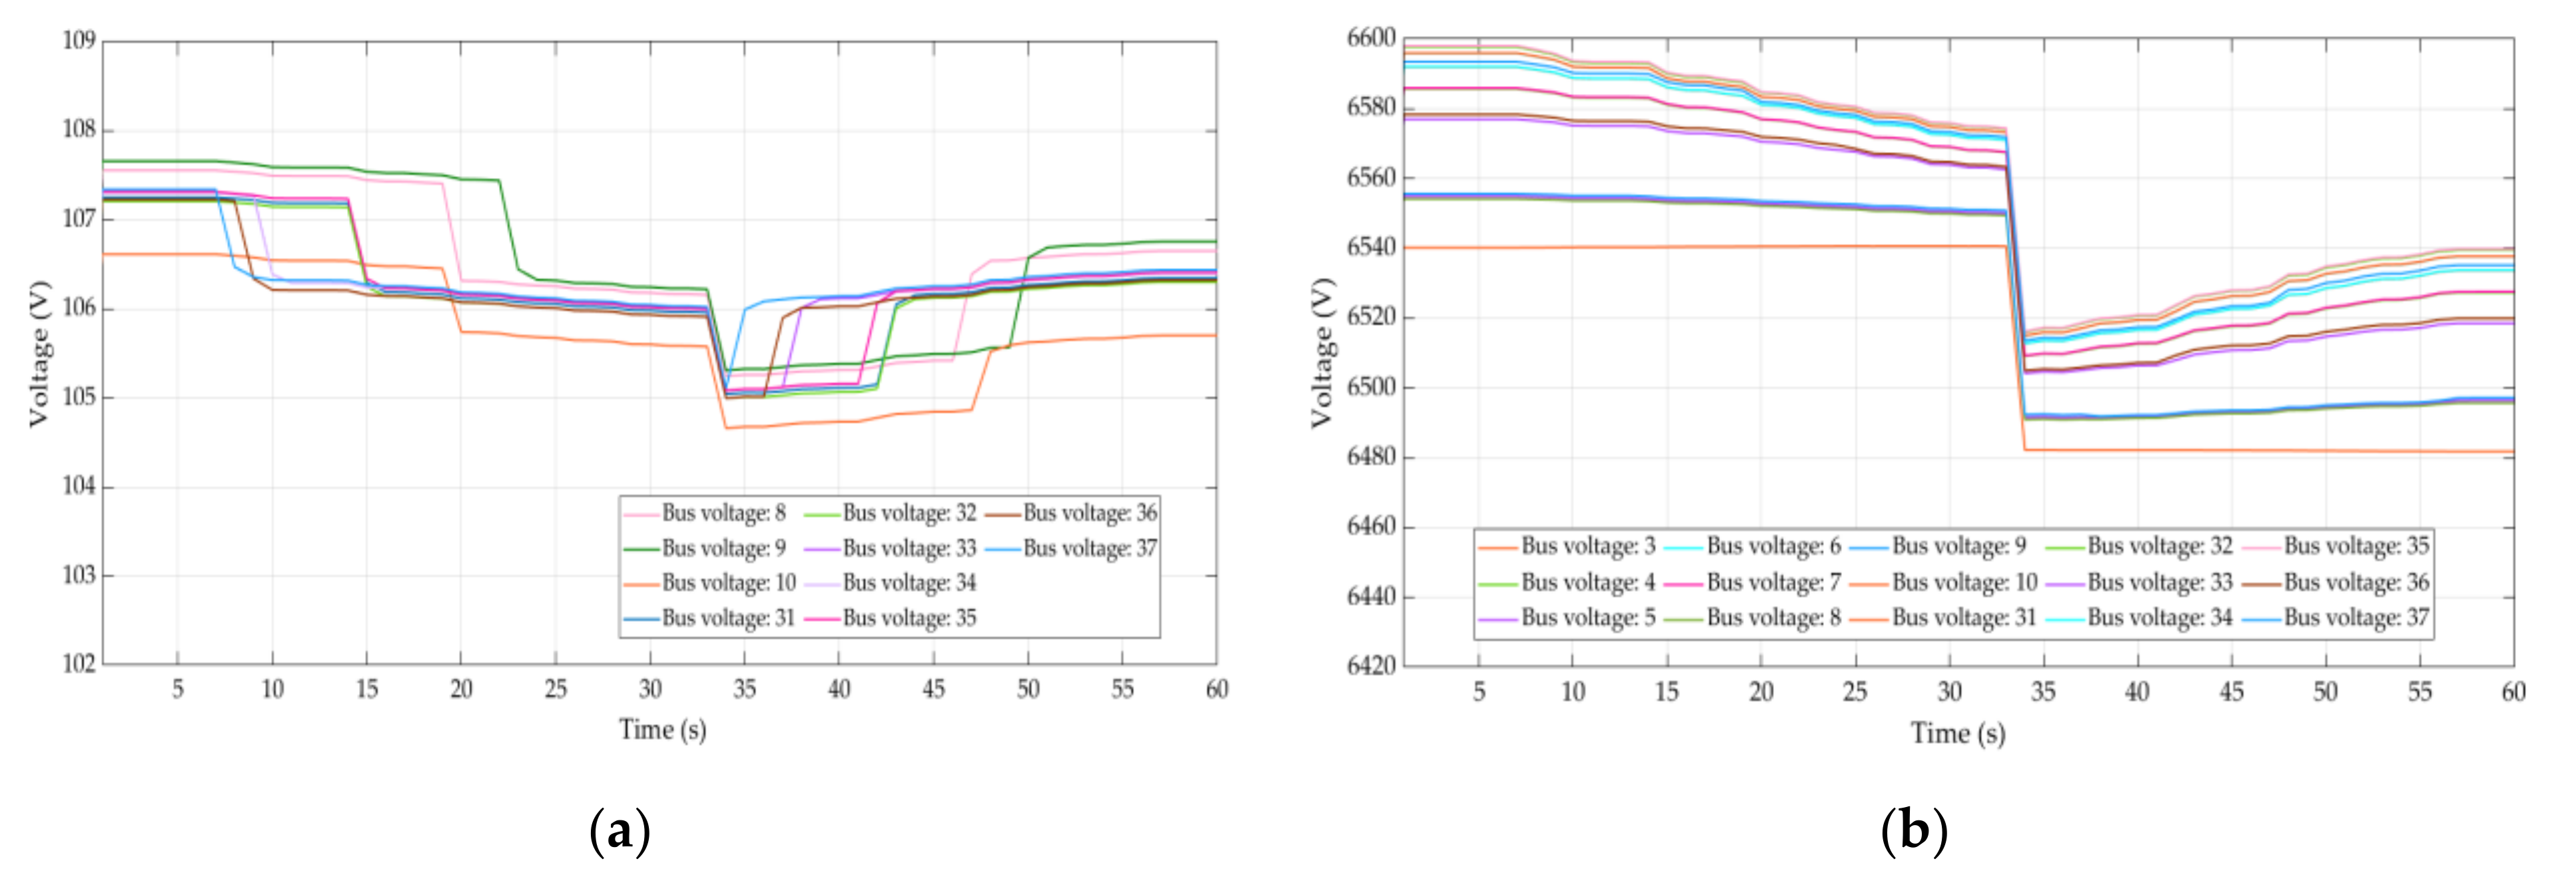
This part assumed 100% of solar panel installation in the Jono distribution system with the cloud movement method. Both graphs (
Figure 22a,b) show the voltage drop by following the cloud in descending order. At 33 s, the load ratio control transformer or LRT started operation and decreased the voltage in the system to the acceptable range. In this work, the LRT’s acceptable range was between 100 and 107.
Figure 22a,b, show the low voltage and high voltage graphs with the upper limit voltage in the bus from 1 s without the impact from the cloud, and the LRT worked 33 s later.
After the LRT change in the tap position, the voltages from the low voltage side and high voltage side decreased because LRT controlled the voltage to be under the acceptable range. For example, at bus 37, the low voltage and high voltage before LRT operation were 108.26 and 6652.43 V. After LRT operation, the voltages decreased to 106.9 and 6572.42 V. Compared with the 50% of solar panel installation, the voltage remained in the acceptable range with the maximum value of the low voltage side at 106.56 V and the high voltage side at 6566 V.
However, desired to investigate the real natural phenomena and full solar panel installation for the town. The merit of full installation of solar panels is that, even when the shade of clouds covers a large part of the residential area, the buses that are not covered by clouds will send solar power to compensate the buses covered by cloud shadow. This is because all the buses at 6600 V are all connected. For this reason, it is acceptable to install 100% of solar panels or more in the residential area because the LRT supports the voltage in the system to stay within the acceptable voltage range. In this way, the LRT might deteriorate over time due to the voltage fluctuations.
In future work, we aim to create a realistic scenario of the Jono distribution system and to control the voltage to support the LRT in a model with a high concentration of solar panels working together with the GIS program. These results are useful not only for the Jono area but can also be applicable as a model of a system with a large amount of PV installations in other regions of the world. This research can support in performing thorough distribution system planning before residential area construction.
5. Conclusions
The simulation and results analysis show effects from the cloud movement shadows into the Jono distribution system with a high percentage of solar panel installation in a residential area. Due to a large number of solar rooftops, installation in the households has a direct impact on the voltage fluctuations for the overall system on both the residential area side (100–127 V) and between connected buses (6.6 kV).
From the 50% solar panel installation results, the decrease of the solar radiation value in the shaded area was assessed according to the sun’s orbital data at different dates and times. The solar irradiation analysis and distribution system simulation showed that the solar radiation value was decreased due to the shade cast from buildings and trees, including the shadows of clouds. For this reason, the total solar power (kW) in the shadow area also diminished and affected the distribution system with a high concentration of solar panel rooftops.
With the full installation of solar panels, when the cloud moved into the town, the voltage drop was the same as the 50% solar panels installation, but the voltage in the entire system was higher than the acceptable range. The results showed the voltage as over the system’s acceptable range; however, a LRT controls the voltage in the distribution system to remain in the acceptable voltage after 30 s passed. Thus, installing the solar panels in a new residential area is possible because the voltage is compensated for if a shadow covers the solar panels in the nodes from the cloud and the voltage is controlled by an LRT.
In this research, we used updated aerial photography, which was used to create digital surface Model (DSM) layers, from low-resolution to high-resolution. In this work, comparison was made between the solar radiation maps created from high-resolution and low-resolution data. The merits of updating aerial photographs include the quality of the area pictures in high-resolution as, the more high-resolution of the aerial photo, the more precise the DSM layer.
Regarding the precision, the solar irradiation map showed higher accuracy of the radiation layer. In the GIS program, updating the map is highly recommended for more present and precise data for the area of interest. However, the demerit of using high-resolution layers is the need for a high-performance computer for data processing. To overcome this challenge, in this research, we utilized high and low-resolution layers and compressed the size with the GIS program for use in a general computer.
In this work, the ArcGIS program collected the real-time solar radiation values. The functions and features from the program were applied with the DSM layer to extract the solar radiation map for a specific place, date, and time. The cloud movement process or other functions were applied in the program to create real phenomena. We then used the data from the ArcGIS program to research and study the distribution system model.
In this way, studying the impact of diminished solar power on a system, such as frequency deviations or the trend of solar rooftop installation in the residential areas in Japan, can increase, answering the demand of electricity consumers. For this reason, the amount of PV panels in the residential area will expand and have impacts on the distribution system. It is vital to perform thorough distribution system planning before the construction of residential areas to ensure stability and reliability in the system.
