Abstract
This paper lays out a methodology that could be used by mini-grid developers to assess the design readiness and future design requirement to accommodate electric cooking (eCook). While mini-grids in developing countries continue to grow in popularity, typically their designs are not yet sufficiently developed to accommodate large power appliances. Moving towards clean cooking using electricity will cause technical risks for mini-grids in terms of voltage drop, voltage unbalances and capacity shortage. In this paper, these parameters are studied on a mini-grid network modeled in OpenDSS/MATLAB as a simulation platform, where the selected mini-grid topology is hub and spoke. Two network studies are considered, the first investigates the limitations of the mini-grid in terms of the generation capacity available to supply the demand for different levels of eCook penetration, while the second focuses on the network constraints for different eCook penetrations. In general, the results show that voltage drop and voltage imbalance issues can be reasonably and affordably addressed by using cables of a larger cross-sectional area. The main issue prohibiting higher penetrations of eCook centre on generation capacity requirements, which led to a techno-economic analysis being conducted to assess future mini-grid sizes as well as targeting economic and environmental objectives and meeting the overall demand on a generically representative mini-grid in a rural region in East Africa. The discussion section in this paper highlights the main barriers to the accommodation of eCook on rural mini-grids and presents suggestions for future work that addresses new design specifications for the next generation of eCook mini-grids.
1. Introduction
Transitioning to clean cooking has been particularly protracted in Sub-Saharan Africa and East Asia as it requires policies and programs to solve the key barriers of affordability, lack of supply and social/cultural acceptability. By 2030 it is predicted that 74% of the global population will have access to clean cooking, which is a considerable improvement; however, this is still a long way from the SDG 7 (Sustainable Development Goal) target of 100% clean cooking access by 2030 []. Developing a market for electrical cooking (or eCook as it has been referred to by others, and will be in this paper hereafter) as a form of clean cooking will ensure improvements to people’s health and wellbeing, impacting positively on the targets of many other SDGs. Hence, to enable the levels of eCook uptake required to meet the targets of SDG 7, an electrical system designed to provide universal energy access will be needed to meet the higher demand requirements which eCook inevitably places on these systems.
Africa’s electric demand in 2018 was approximately 700 TWh [] with 30% of this from Sub-Saharan countries excluding South Africa. Rapid economic expansion and population growth across Sub-Saharan Africa presents both challenges and opportunities for the energy sector and related supply chains and services. Although progress is being made, for example in Kenya, Ethiopia, Ghana, Senegal and Rwanda, most of the population with access to electricity are supplied through unreliable and inefficient transmission and distribution networks [], with insufficient generation capacity and network infrastructure required to meet current and future electrical demand. The main network features which could be affected at low voltage (LV) distribution level when adding eCook load to consumers are voltage instability, power losses, transformer overloading, reliability, power quality and lack of generation capacity shortage.
Energy poverty remains a huge challenge facing developing countries. In 2017 there were still around 840 million people without access to electricity, although this is anticipated to decrease to 650 million people by 2030 []. The international community is not on track to achieve the SDG 7 targets, despite the global rise in electricity access from 71% to 87% between 1990 and 2016 []. Furthermore, the impact of COVID-19 on the energy sector and future electricity access rates in developing countries are still unknown; however, a re-prioritization of international aid and funding could further slow progress towards achieving SDG 7.
To accelerate electricity access in conjunction with eCook, off-grid solutions particularly mini-grids will be essential, as they offer advantages over connections to the main grid, such as enhancing the reliability of supply, improved quality of power, better environmental performance and accommodate consumer electricity needs in remote areas where most of the population is located. In the past decade, the number of solar/solar-hybrid mini-grids installed globally has increased from 60 to 2099 [] and so this is not simply a niche area. Mini-grids therefore can open up the energy sector to independent power providers and expedite electricity access in rural regions with limited prospects of seeing the main grid extend to their location any time before the SDG target date of 2030.
Mini-Grid Definition
As the term “mini-grid” varies within current literature, there is a need to clarify its definition within the context of this study. The term mini-grid used henceforth in this paper relates to a network isolated from the main grid where local distributed generation is used to supply local demand. Power is conventionally generated from either a single energy source or from multiple sources such as hydro turbines, photovoltaic (PV) panels, diesel generators and wind turbines in order to meet local residential, commercial and industrial demands []. For an AC village mini-grid, which is considered in this research, the power capacity ranges between 1 kW and 300 kW.
Mini-grids can consist of AC, DC or AC/DC generation and distribution systems. This section introduces both the AC and DC system layouts, with the advantages and disadvantages for each.
The DC Mini-grid is commonly used in off-grid systems, the various components of the PV system are connected to the DC bus (Figure 1): the charge controller is connected to the PV array and system batteries to regulate their charging/discharging, and the inverter converts from DC to AC to serve any AC consumer loads connected to an AC bus, whilst the DC consumers are coupled to the DC bus. The diesel generator is connected to the AC bus and directly powers any AC loads when it operates [].
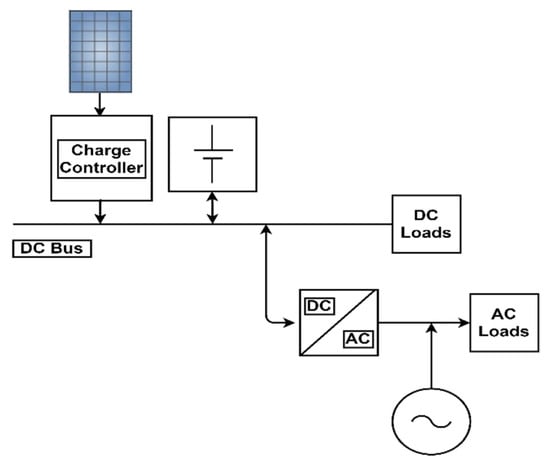
Figure 1.
DC-PV system.
The charge controller, with an in-built DC/DC converter, can also be used to step down the voltage from the PV array to the system batteries. Two types of charge controllers are available: a maximum power point tracking (MPPT) charge controller using a DC/DC buck converter and a PWM charge controller. The advantage of using a DC-coupled system is that it is highly efficient in discharging the battery at times when there is low or no PV available (at night), although, the system becomes more complex in the set up when multiple parallel PV strings are needed [].
The AC Hybrid Mini-grid is generally used for larger systems. It uses a grid-tie inverter that can ensure the inverter and generator output can be synchronized. The PV-inverter is used to convert the DC power output from the PV to AC, a sophisticated battery converter is connected between the battery and the AC bus to manage the charging/discharging of the battery. The backup diesel generator can be used during periods where PV and/or battery capacity is insufficient to supply the demand (Figure 2) []. This configuration provides modularity, enabling the uprating of the grid by the addition of any new equipment. It is slightly more efficient during sunshine hours as there will only be one conversion step (DC/AC) needed for AC supply for direct use of PV power. However, two conversion steps are needed for charging the battery, which can lower the efficiency. In general, this setup is widely considered more appropriate for meeting peak demand during sunshine hours at an acceptable levelised cost of energy [].
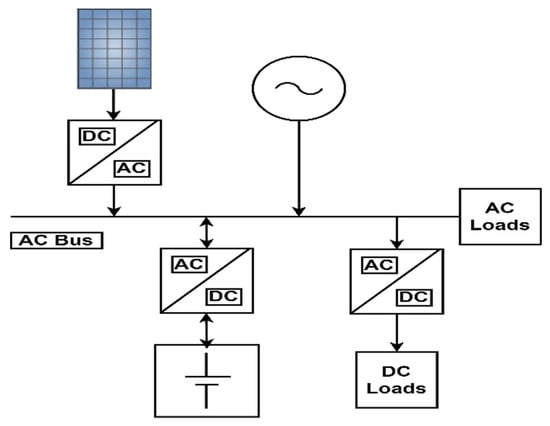
Figure 2.
AC-hybrid PV system.
This research aims to explore the potentialities of electric cooking on an AC hybrid mini-grid through analysing the main technical network constraints (voltage drop, voltage unbalance, system power losses and capacity shortage) and identifying future design requirements to enable the uptake of eCooks. The proposed methodology in Section 2 will be a useful tool for mini-grid developers in their planning for the deploying of eCook based mini-grids for rural communities. This section also presents in detail the demand modeling tool used to generate the daily non-eCook and eCook load profiles, the mini-grid network model design specification, and the energy dispatch strategy. Section 3 demonstrates the results of the two Use Cases (limited diesel generation capacity and significant diesel generation capacity) which allow the evaluation of “how fit for purpose” the mini-grid is to accommodate different eCook penetration. Section 4 conducts a techno-economic analysis to identify the optimal sizing of eCook mini-grids for feasible eCook deployment in terms of size and cost for different eCook penetrations as well as cable sizing for both the distribution and service cables. Section 5 presents a brief discussion on the findings and recommendations for the next generation of eCook mini-grids. Finally, Section 6 is the conclusion.
2. Methodology of the Research Study
Despite their advantages, it is important to examine the technical challenges which could arise when introducing eCook loads to mini-grids in their current form. For instance, the users’ base-load profile is a key element in determining the system’s critical parameters such as component sizes and overall network design. However, post-installation, demand may continue to increase over time as new consumers and appliances connect to the mini-grid. Unless this anticipated demand growth is properly factored into the initial mini-grid design, it can potentially lead to capacity shortages and violation of voltage and thermal constraints, ultimately leading to system outages and curtailment of demand.
Some mini-grid utilities in developing countries use large cross-sectional area (CSA) cables to mitigate any future demand growth and to comply with grid standards for main grid integration (if and when it arrives). Mini-grid developers in some countries such as Tanzania and Nigeria may be provided with subsidies and grants through a finance mechanism [] to prepare for this.
In this research work, a methodology was developed to investigate “how fit for purpose” these types of mini-grids are to accommodate increasing eCook demand, or indeed what design considerations or interventions would be required to make them so. The planning tool illustrated in Figure 3 can be used by mini-grid developers to assess the system’s performance and cost, which will give an insight into the existing problems and future design requirements to move towards electric cooking. The tool is divided into two main studies:
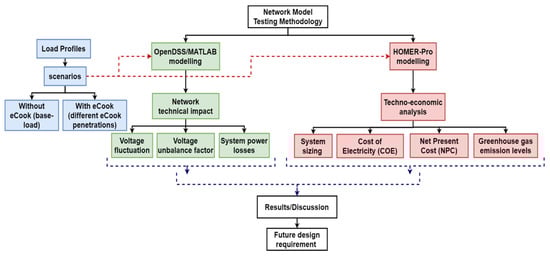
Figure 3.
Network model testing methodology.
- Network technical impact: in this part a mini-grid network was modeled in MATLAB/OpenDSS [] as a simulation platform, allowing the investigation into the impact of eCook on technical issues affecting network constraints such as voltage drop, power losses, voltage unbalance factor (VUF) as well as the limitations of power demand. The model was tested taking five eCook scenarios (0%, 20%, 50%, 80% and 100%).
- Techno-economic analysis: a key area for investigation is determining the sizes of mini-grids required to accommodate this new eCook demand, HOMER-Pro [] was used to assess and identify the optimal sizing and cost to accommodate the different levels of the eCook scenarios considered in this research, this was followed by calculating the system cable sizes needed.
The key findings paved the way, highlighting the specifications needed for future eCook mini-grids. The rest of the paper gives a more detailed description of the steps considered in these two studies and the main results.
2.1. Demand Modelling
One-minute intervals of daily non-eCook and eCook load data were generated using the CREST demand model by a group of researchers in the Modern Energy Cooking Services (MECS) team []. The CREST tool is open-source developed by Loughborough University for LV network analysis []. The model uses a high-resolution bottom-up approach to build representative individual end-user daily load profiles based on occupancy data as a core variable to decide whether the appliances are switched on/off by the occupants, as well as input data, collected from interviews or audits on electric appliances, electric needs and consumer habits. It uses probabilistic methods to account for demand diversity and allows changes of appliances and their usage pattern depending on the timing of the occupancy activity. The original model, however, was completed by inferring occupancy from the UK time use surveys and for this purpose researchers from the MECS consortium [] adjusted the tool to represent individual low-income household (HH) electricity demand representative of HHs in remote rural areas of Sub-Saharan Africa.
2.1.1. Non-eCook Load Profile
For the non-eCook load (i.e., base-load) the appliance ownership and utilization habits are taken from the ESMAP Multi-Tier framework [], where two HH categories are considered in this research. In the first category, the HH consumption is somewhere between Tier-1 (relatively lower baseload demand) and Tier-2 (relatively higher baseload demand). While in the second category, the HH consumption is strictly within Tier-2. These give an average daily energy consumption per HH of between 50–200 Wh. Figure 4 shows a daily aggregated non-eCook load profile for the 108 HHs connected to the mini-grid. There are two distinct peaks as is typical of most domestic load profiles: a morning peak between 6 a.m.–10 a.m., and an evening peak between 4 p.m.–10:30 p.m.
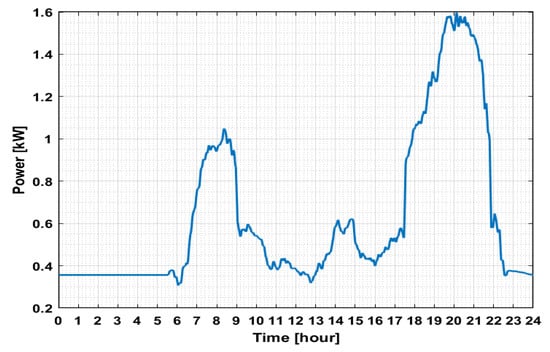
Figure 4.
Aggregated non-eCook load for 108 HHs.
2.1.2. eCook Load Profile
In this research, it is assumed that HHs are 100% transitioning to eCooks (Electric Pressure Cookers (EPC) and hotplate) which means that all the HH food is cooked with electricity. The data used for the cooking practice were collected during cooking trials which took place in Tanzania as part of the MECS programmed activity—for more information refer to “eCook Tanzania cooking diaries report” []. The data were input into the CREST model to generate representative HH electric cooking load profiles using a 1 kW hotplate for breakfast and lunch, while for dinner the HH could use either or both a hotplate and a 1 kW EPC, where the HH’s energy consumption is around 1.75–2.2 kWh per day for cooking only.
Figure 5 illustrates the aggregated eCook load for various levels of eCook penetration (20%, 50%, 80% and 100%) and the base-load. Note that 100% eCook penetration refers to the power consumption of all 108 HHs connected to the mini-grid, which use eCook devices exclusively when cooking their meals, as well as other non-cooking related HH appliances during the day. This gives three distinct peaks; morning, midday and evening (being the highest). Table 1 shows the daily peak demand and the proportion of overall peak demand made up by each of the eCook penetrations under consideration. From the results shown in Table 1 regardless of the level of eCook penetration, it accounts for more than 90% of the peak demand.
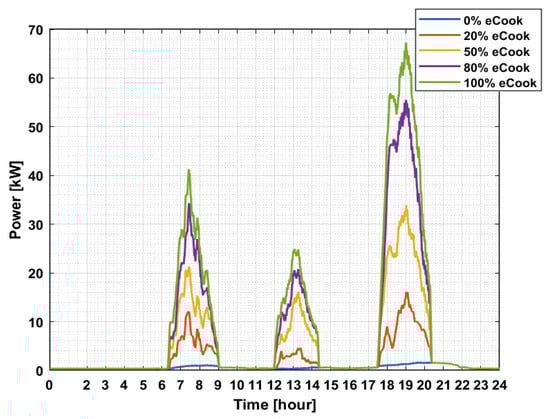
Figure 5.
Aggregated HH load profiles (eCook + non-eCook load) for different eCook penetrations.

Table 1.
eCook contribution with respect to the peak load.
2.2. Mini-Grid Network Model
The hybrid mini-grid shown in Figure 6 that forms the basis of the model developed for the studies conducted and presented in this paper, was developed as a composite of those designed and installed by practitioners and based on mini-grid design methods available in the literature. An AC hybrid mini-grid supplying 108 consumers was modeled in OpenDSS, which is interfaced with MATLAB. The system operates at 400 V at the distribution level and 230 V at the residential level. The mini-grid is sized to 30 kWp PV, 9 kW diesel generator, 41.4 kWh Battery, 8 kW battery converter and 10 kW PV-inverter. The mini-grid here is much larger in terms of its sizing compared to a standard mini-grid design for 108 customers without any eCook. For example for a rural mini-grid connected to 100 HHs and small business, the size required to meet the demand would be roughly 6 kWp PV and 7 kW diesel generator [], so, the type of mini-grid used in this study is 5 times greater in terms of PV size, however, it will accommodate around 20% eCook during a sunny day, also it will provide an opportunity for future research (not presented in this paper) to be carried out which will consider the concept of demand-side flexibility.
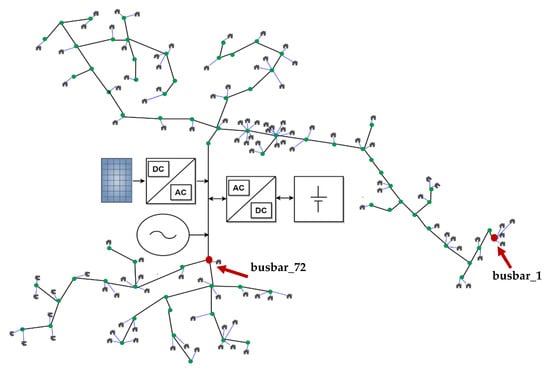
Figure 6.
OpenDSS hybrid mini-grid layout.
In OpenDSS the parameters and the location of the PV, the diesel, and the battery are defined. The battery’s generic model in OpenDSS was characterized using lithium-ion battery features (kWh, kW and % efficiency of charge/discharge); the batteries’ SoC is set to charge from 20% to 80% to safeguard battery health, prolong its life and minimize charging losses []; the round-trip efficiency of the battery is ≥95.3% []. For the electric network, the following parameters were included: the cable sizes, lengths, bus connection, resistance and reactance. The 108 consumer loads were allocated at their respective nodes and the daily load patterns were read from CSV files to represent the variation in power with time. For each of the eCook penetrations considered in this study, the cooking load was allocated starting with HHs which are far from the power substation in order to consider for the worst-case scenario, where HHs with high demand further from the substation will lead to higher voltage drop and higher power losses. This forms the basis of the OpenDSS modeling, after which, MATLAB software was used to develop a controller function for the energy dispatch strategy of the mini-grid to control the operation of the generators (PV\diesel) as well as the battery.
The PV output power was calculated directly from the daily irradiance and temperature patterns imported from the HelioClim service for Tanzania [] with a time resolution of 1 min, for a weekday in April.
Energy Dispatch Strategy Controller
The load following (LF) dispatch strategy is used to control the operational time of the generators (PV and diesel) and the battery in OpenDSS. Under the LF strategy, the diesel generator provides enough power to meet the load although it is not used to charge the battery. The battery only charges when there is excess power from renewable energy resources []. Figure 7 sums up the principle of the operation for the LF dispatch strategy in a flowchart which can be classified into three categories []:
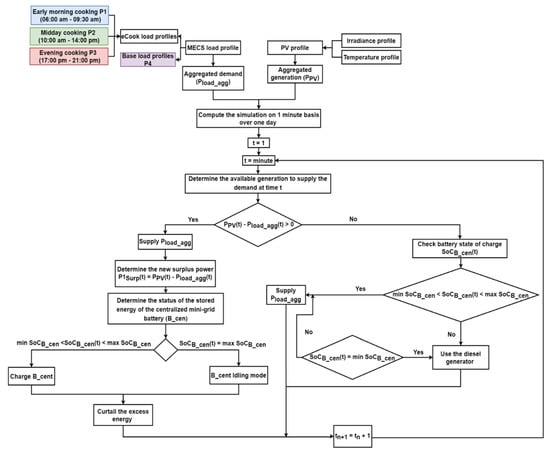
Figure 7.
Load following energy dispatch strategy flowchart.
- When the output PV power is equal to the load power during the day. Here, the PV array has a higher priority to supply the entire demand and does not charge the batteries, and the generator remains off-line.
- The excess PV power will be used to charge the batteries if they are not fully charged, in this case, the diesel generator remains off-line.
- In the case where the PV output power is less than the demand during periods of no sunlight or low solar radiation, the battery starts to discharge. The battery continues to supply the maximum power allowed by the converter, then finally the lowest priority is given to the diesel generator to meet the difference in demand not provided by the battery. If the battery’s SoC becomes too low, it switches to idling mode and the diesel generator is brought online to meet the net load (load minus renewable power). The generator only provides enough power to satisfy the net load.
3. Technical Impact on the Network
This section of the paper focuses on the limitations of the mini-grid in terms of the generation capacity available to supply the demand as more eCook load is connected, with the likely impact of increasing eCook adoption on the mini-grid considering different aspects such as voltage drop, power loss and voltage unbalance. Two Use Cases concerning eCook and the availability of co-located generation are considered in the following sections.
3.1. Use Case 1 (Limited Diesel Generation Capacity)
In Use Case 1 the base mini-grid model with 30 kWp PV, 9 kW diesel generator, 41.4 kWh lithium-ion battery, 8 kW battery converter and 10 kW PV-inverter was simulated over one day. The model was tested with different eCook penetrations ranging from non-eCook base-load to 20%, 50%, 80% and 100% eCook penetration (where the 100% eCook refers to all the 108 HHs using only eCooks for cooking as a worst-case scenario). This allows evaluation of the eCook demand met and not met without network reinforcement as penetration increases. For the distribution and service cables, the CSA are set to 50 mm2 and 16 mm2, respectively.
When connecting different levels of eCook to the mini-grid without any reinforcement, this imposes a constraint on the grid, translated into an increase in the daily energy shortage due to generation limitations. The system can meet the 0% eCook scenario and around 20% eCook (Figure 8a), however, as the number of eCook devices increases, demand cannot be met resulting in an increase in the daily energy shortage; for 100% eCook, the energy shortage is approximately 42% as shown in Figure 8a. For 50%, 80% and 100% eCook, the mini-grid fails to provide enough power to meet the aggregated load—this occurs in the morning and the evening as illustrated in Figure 8b. In the case of 20% eCook (22 HHs using eCooks), all the daily demand is supplied by the available generation; the early morning and evening demand is met by both the battery and the diesel generator while at midday there is sufficient power generated by the PV.
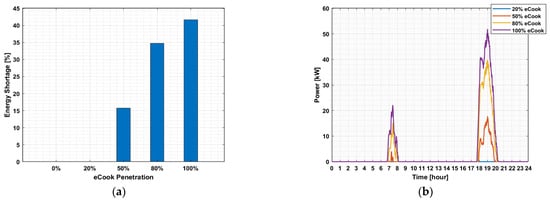
Figure 8.
(a) Energy shortage for a weekday in April; (b) Power not met for a weekday in April.
3.2. Use Case 2 (Significant Diesel Generation Capacity)
To ensure all demand is met as more eCook load is connected, in this Use Case, the 9 kW diesel generator was replaced with a 110 kW generator. This was performed to determine how “fit for purpose” the mini-grid was in terms of network cable size to accommodate increasing eCook demand. The remaining network parameters are the same as specified in Use Case 1.
3.2.1. Voltage Fluctuation
Figure 9 shows the 24-h voltage fluctuation before and after connecting 100% eCook load at busbar_1, which is located approximately 0.8 km from the substation where a high voltage drop will be seen (see Figure 6). The maximum voltage drop is around 0.9982 pu with the base-load (seen at phase C), and 0.9406 pu when connecting 100% eCook (seen at phase A and C), which exceeds the 5% [] allowed voltage drop limit considered in this case study. It is evident that as the eCook demand increases the performance of the min-grid is affected with the introduction of these new and increased demand peaks for the system to accommodate.
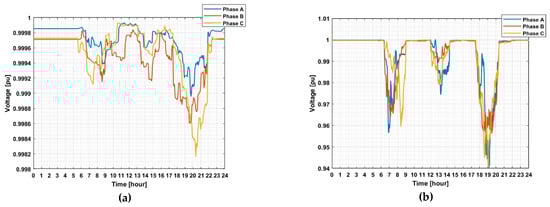
Figure 9.
(a) The three-phase voltage profile at busbar_1 before adding 100% eCook; (b) The three-phase voltage profile at busbar_1 after adding 100% eCook.
In Figure 9 the mini-grid three-phase voltage is slightly unbalanced. To analyse the voltage level at the load busbars, the symmetrical voltage components are calculated by taking the unbalanced three-phase system values and converting them into three balanced, three-phase systems []. Once the solutions are determined, the maximum voltage drop at the positive sequence is recorded in Table 2 when connecting various penetration levels of eCook. From the simulation results for different eCook penetrations, the positive sequence voltage fluctuates within 5% for both 0%, 20% and 50% eCook, which is still within the allowed range. However, as the level of eCook increases, the voltage drop starts to exceed the 5% threshold and as expected this happens during peak time, although the voltage drop at the positive sequence voltage and each of the three-phase voltages (A, B and C) remains within 5% to 10% [,] nominal line-to-neutral voltage limit specified for low voltage networks. For a three-phase mini-grid, the 50 mm2 distribution and 16 mm2 service lines are enough to provide adequate power quality at the load level, yet, there could be an issue with future demand growth.
Table 2.
Maximum voltage drops for different eCook penetrations.
3.2.2. Voltage Unbalance Factor
Maintaining the power quality at a mini-grid level is a major concern due to the use of non-linear devices from residential users and the increase in eCook penetration. In this paper, voltage unbalance is quantified and analysed, since, it is one of the main power quality issues at the distribution level. For a three-phase system, the VUF is calculated using:
where Vn and Vp are the negative and positive sequences, respectively []. The maximum VUF the network experiences for the different eCook penetrations are shown in Table 3. The findings reveal that adding eCook load causes the VUF to dramatically increase compared to the 0% eCook level, though, remaining within the allowed limit of 1% to 2% [,].
Table 3.
Maximum voltage unbalance factor [%] for different eCook scenarios.
3.2.3. System Losses
Power losses in the mini-grid are directly proportional to the mini-grid demand profile. At low eCook levels, most of the feeder lines are not susceptible to large line losses. However, as demand increases, this results in a rise in power losses which directly contributes to a voltage decrease for the consumer. As shown in Figure 10, there are no significant effects of power losses for the feeder system in off-peak hours.
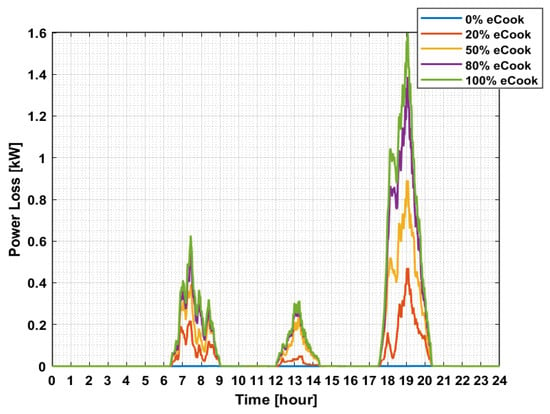
Figure 10.
System power loss for different eCook penetrations.
4. Mini-Grid Techno-Economic Analysis
In this section, the mini-grid component ratings and cable sizes required to upgrade the systems to accommodate different levels of eCook scenarios were calculated, as a means of demonstrating the future mini-grid design requirements; as well as the conducting of a techno-economic analysis to analyse the impact of eCook load penetrations on the Cost of Energy (COE) and the Net Present Cost (NPC).
4.1. System Sizing and Cost of Energy
For future mini-grid planning and design, a techno-economic analysis was conducted using HOMER-Pro to determine the optimal mini-grid sizes to accommodate each of the eCook penetration scenarios under consideration, with Tanzania taken as the mini-grid location. It should be recognized that the diesel fuel price fluctuation was not considered in the analysis as there is insufficient data presented in the literature, since it is difficult to accurately forecast the events in world fuel prices. Additionally, it is hard to predict, how individual countries will react to fuel prices, in the future, by either imposing duties or granting subsidies on diesel for their domestic market.
The input data used comprises of the initial capital cost and replacement cost of each of the mini-grid components (see Table 4); the fuel price of USD 0.8/L, which represents the price of diesel for the year 2016 in Tanzania [] and the lifetime of the project is taken as 20 years. To calculate the PV output power, HOMER uses the mini-grid location to import the solar resources data from the NASA surface metrology and Solar Energy. To evaluate the NPC and the COE, the inflation rate and the nominal discount rate used are 6% and 10% respectively which are considered standard figures for business planning []. The annual fixed operation and maintenance (O and M) cost accounted for 2% of distribution capital expenditures (CAPEX) [].
Table 4.
Mini-grid component cost data [].
The proposed optimal mini-grid sizes for the eCook penetration scenarios are presented in Table 5, where the PV array is sized based on the energy consumption profile, location, as well as ensuring there is sufficient energy to fully charge the battery during the day, under all conditions, and to meet the evening demand, as the mini-grid operates with the LF energy dispatch strategy. This means, that the battery will be charged with the surplus generated from the PV, and when required the diesel generator is activated to provide enough power to meet the load.
Table 5.
Component sizes for eCook mini-grid deployment scenarios (without considering 1.2 DC/AC ratio).
Another point to consider is that, when sizing a mini-grid, it is important to have a high renewable contribution to supply the demand as the diesel generator is more cost-effective when operating as a backup, rather than using it as a base-load generator []. Even though the initial capital cost of the diesel generator is low, the diesel generator requires an ongoing operating fuel cost. In addition, fuel availability cannot be assured as most of the mini-grids in developing countries are located in rural areas where the supply chain of diesel can be temperamental and fuel prices volatile. When more renewable energy is available the COE and NPC are reduced since the marginal cost of generation is zero, and with smaller amounts of diesel used, this also leads to less CO2 emissions.
The results in Table 5 present the solution with the lowest cost to serve the load under the model’s conditions. It is evident that the PV array does not require an inverter of approximately the same capacity, although, this leads to a larger PV size which requires a larger installation area. To reduce the PV size, the HOMER models were simulated again to calculate the optimal mini-grid sizes when fixing the ratio of DC capacity (solar panel DC power rating) to the inverter’s AC power rating (DC/AC ratio) to 1.2 []. The results are shown in Table 6.
Table 6.
Component sizes for eCook mini-grid deployment scenarios (when considering 1.2 DC/AC ratio).
4.2. Conductor Sizing
To calculate the optimal cable sizes needed for the distribution and service cables, it was important to establish the expected load and peak time of the mini-grid, as well as understanding its characteristics []. For a single-phase line, the CSA can be calculated using:
where is the CSA in (mm2), is the resistivity of the material in ohm-m (Ω-m) at ambient temperature, , is the total current flowing in the cable with a maximum length of in m, , is the system phase to neutral voltage in Volts and , is the acceptable voltage drop in %.
The resistivity of a material is dependent on temperature and this is calculated using []:
where is the resistivity of the material in ohm-m (Ω-m) at ambient temperature, is the resistivity at the reference temperature , is the temperature coefficient of resistance for conductor material, is the ambient temperature. The values used in (3) are shown in Table 7.
Table 7.
Parameter for conductor sizing.
In any typical mini-grid, consumers are located at irregular intervals along the distribution line rather than being uniformly distributed. To calculate the CSA of both the distribution and service lines, the product of power demand and the distance from the supply for each consumer must first be calculated, and then the product for all “N” consumers can be summed. Furthermore, the mini-grid distribution circuit model can be simplified to a three-phase “wye” connection configuration, while the service lines are single-phase two-wire, illustrated in (4) and (5):
For distribution lines (wye connection)
For service lines (single-phase, two-wire line)
The optimal CSA for both the distribution and service conductors required for a typical mini-grid characterized by each of the eCook penetration scenarios and taking 5% as the voltage drop threshold was determined from (4) and (5). The results are recorded in Table 8.
Table 8.
Distribution/Service CSA cables for eCook mini-grid penetration scenarios.
4.3. Cost of Energy
In [], simulation studies were conducted in HOMER to assess the techno-economic feasibility of different levels of eCook penetration and deployment in mini-grids. The results reveal that in the case of accommodating a certain percentage of eCook load there is a need for a larger mini-grid capacity size to meet the demand although shows a continuous decrease in the COE due to the increase in the annual total electric load served (Eserved). This demonstrates that as more energy (kWh) is used, the upfront cost is divided amongst the many users. However, the system’s costs were calculated assuming that the distribution network is strong enough to support extra loads without the need to upgrade it in terms of cables. Hence, no additional upfront cost was included. When planning the construction of an eCook mini-grid there is a necessity to study the impact of additional cable costs. In this section an economic analysis is conducted in HOMER to investigate the mini-grid cost for the eCook scenarios when:
- Use Case-a: Reinforcing the mini-grid only in terms of the generation and storage capacity while the distribution upfront cost is fixed throughout the analysis, using the component sizes obtained from Table 5.
- Use Case-b: The same as specified in Use Case-a however, the cost analysis is carried out when taking the component sizes in Table 6.
The results for each Use Case are provided in Table 9. Comparing Use Case-a with Use Case-b; installing a large-sized PV-inverter reduces the PV array size, so less area is needed to install the system. This, however, leads to a slight increase in the COE and the NPC due to the extra cost imposed when replacing the PV-inverter.
Table 9.
Comparison of the economics of the different cases.
The results of Use Case-c validate that the extra cable cost causes an increase in the COE and the NPC. Directing our analysis to the 100% scenario, the COE and the NPC increase by approximately 16% compared to those of Use Case-a. Another point worth mentioning is that the simulation results of the COE in all three cases are significantly higher than the COE tariff for the domestic customers connected to the national grid in Tanzania, which is approximately USD 0.1/kWh []. Therefore, there is a need for additional investment and innovative policies to be put into effect to speed up the process, as well as giving a crucial workable timescale. Sustainable Energy For All issued a report providing a comprehensive analysis of commitments of energy access for electrification and clean cooking []. The report also highlights the impact of COVID-19 on public budgets and private investments and points out that most of the investments are not being awarded to the countries with the greatest needs and that there is a necessity for greater investment to achieve universal access by 2030.
5. Discussion and Recommendation
The results of Use Case 2 show that mini-grids characterized with 50 mm2 and 16 mm2 CSA distribution and service cables, respectively, adequately support high levels of eCook penetrations without causing any serious network constraint issues that would require network reinforcement. This will be the case for mini-grid developers such as PowerGen where their systems are characterized with an ABC cable of 50 mm2 and single-phase 16 mm2 ABC, which are the same as the ones specified for the LV network [] as they are provided with a connection subsidy. However, some mini-grid developers who do not benefit from this grant are restricted to use small CSA cables, which are enough to support the base-load and reduce the system’s cost, these types of mini-grid will restrict the connection of high appliances such as eCooks.
Extrapolating this further to the future, it should be observed that the network study findings do not consider two important scenarios; the base-load demand growth (new customer and appliance connection) and the diversity of eCook due to the lack of information in the literature, this could be a constrain to the system, so, it is important to determine the tipping point for this transition to be possible.
Therefore, it is necessary to compare different mini-grid categories in terms of capacity and cable sizes to investigate network constraints and the maximum eCook penetration a system can accommodate without any further reinforcement. Additionally, it is unrealistic to assume that a large percentage of HHs would convert to eCook at the same time or cook all the food only with electricity—fuel-stacking where HHs use a combination of different clean fuels (such as LPG with eCook) for different forms and stages of cooking, maybe a more viable transitional scenario that future work will consider (following the methodology presented in this paper). Access to electric cooking at this level in mini-grids remains a daunting task for many low-to medium-income households in developing countries due to the energy resources available for cooking and cooking preferences, economic development, lifestyles, cultural behavior and traditions, housing structures, but also, limitations on existing infrastructure, and crucially, still to be developed infrastructure such as rural mini-grids.
It will therefore be vital to evaluate the eCook ownership rate at a mini-grid level along the time horizon which will be relevant to mini-grid developers and utilities, providing them with valuable statistics to enable more accurate decision making affecting mini-grid design, reinforcement, business models and long-term planning to accommodate eCook demand as it grows.
Furthermore, another line of research would be to solve the barriers concerning the uptake of eCook such as the affordability of electricity, lack of supply and social acceptability, as well as capital costs of network infrastructure.
To this end, this paper addresses the new design requirements of the next generation of mini-grids, capable of providing consumers in rural areas of the global South with modern electrical cooking services.
5.1. Energy Cost Barrier
Mini-grid deployment in developing countries remains significantly expensive in rural communities due to the limited ability or inability to pay, as the up-front capital costs are an important factor in the cost of the system. As illustrated in Table 9 (Use Case-a), a mini-grid for a 165 kWp PV, 110 kW diesel generator and 193.2 kWh battery, supplying a 100% eCook demand, the COE is 0.461 USD/kWh. Therefore, for a HH with a cooking energy consumption of between 1.75–2.2 kWh per day, customers would be required to pay approximately USD 24–30/month, which would account for almost all the household income, for low income HHs on a monthly salary of USD 25–30, and so is clearly uneconomical and impracticable. It should be observed that the simulations conducted in HOMER do not consider any subsidy which may have a further impact on reducing the COE and lowering tariffs. To encourage the deployment of more mini-grids, the Tanzania Rural Energy Agency is providing grants of USD 300–600 per connection under its results-based financing scheme, this adds up to a subsidy of USD 30,000–60,000 for a 100 HH connection mini-grid []. However, this scale of subsidy is not enough to reduce the COE to a value close to the existing tariff provided by the national grid, and so further subsidies and grant support are needed to make it more attractive to the developer as well as to the customer. Furthermore, in [] it is stated that the COE will continue to fall when:
- More efficient appliances are used.
- Integrating smart monitoring, management, and control devices into the system to smooth out the daily peak and offers support for investment in system operation to reduce daily blackouts and restrictions on electricity consumption due to grid constraints.
- Building standardized and integrated mini-grids capable of interconnection to the main grid when it arrives.
- Adopting a sophisticated payment system for both electricity and cooking device purchases and services.
- The cost of PVs, inverters and battery storage continue to fall sharply—Bloomberg New Energy Finance forecasts the COE of PV will decrease 66% by 2040 and according to “The International Renewable Energy Agency” (IRENA), predicts the cost of lithium-ion batteries could decrease between 54–61% by 2030, reducing the total installed cost for lithium-ion batteries to as low as $145/kWh [].
- Additional customers making productive use of energy connect to the mini-grid. Reference [] points out that the COE for mini-grids with daytime loads is less expensive than for mini-grids with only residential customers who consume electricity mostly in the evening. This is due to productive-use customers (such as agriculture and factories) with daytime demand aligning with the solar peak.
A methodology could be developed for eCook-ready mini-grids integrating demand-side management (DSM) techniques to promote the uptake of daily productive usage seeking to reduce the COE and to boost the utilization rate of eCook mini-grids. Another benefit is that, on days when there is low production of PV power, the diesel generator is used more efficiently, at almost maximum power, due to a more stable load profile.
5.2. Demand Side Management
Smoothing out the daily aggregated load profile increases the utilization rate of mini-grids which correlates highly with the load factor ratio. The load factor [] reflects how well the energy is used based on daily, monthly, and yearly profiles. It is defined as the ratio of the average load divided by the maximum (or peak) load in a given time period. It can therefore also represent the ratio of total energy (kWh) used over a specific period of time to the total energy available over that period. The load factor can be used to measure the utilization rate, or the efficiency of electricity usage, where a low load factor indicates the energy usage is low compared to the that available, and so much of the generation capacity remains spare; resulting in a high COE. Conversely, a high load factor indicates energy usage is more “efficient” in this respect and subsequently results in lower COE.
Improving or increasing the load factor, therefore, requires the average load and peak load to be as close as possible. This can be achieved either by peak shaving to effectively reduce the peak demand or by increasing the average electricity consumption to maximize the use of the power available. In the context of eCook demand, it may be possible to shift some of the demand during peak hours to off-peak hours to achieve an improved load factor and hence lower COE. While there are non-technical and socio-cultural factors to consider when considering this, from a technical perspective there is merit in simulating the use of DSM techniques to enable this, which may involve a move towards using battery supported eCook to offer a more flexible eCook demand (this will be the subject of future research).
6. Conclusions
The paper presents a methodology for simulating the connection of graduated levels of eCook penetration to evaluate the design readiness and future design requirements of mini-grids needed to accommodate a transition towards universal uptake of eCook, in line with SDG 7 targets.
The simulations and analysis focus on determining daily capacity shortage, voltage drop, voltage unbalance and power losses for various eCook penetrations. The results from Use Case 1 show that a mini-grid with 30 kWp PV, 9 kW diesel generator, 41.4 kWh lithium-ion battery, 8 kW battery converter and 10 kW PV-inverter can accommodate around 20% eCook, and as the eCook penetration increases, demand cannot be met, leading to an energy shortage which equates to approximately 42% for 100% eCook penetration. However, the findings from Use Case 2 signify that mini-grids designed with oversized distribution and service cables such as in the case of this research (using 50 mm2 and 16 mm2 CSA distribution and service cables, respectively), both the voltage drop and the VUF remain within the thresholds. Hence, the main barriers constitute the limited generation capacity required to supply the additional eCook load, and the high COE.
It is therefore evident that the eCook mini-grid design should be characterized with a high renewable contribution towards eCook demand, as it is preferable over non-renewable solutions due to the advantage of saving fuel and the reduction in greenhouse gases, NPC and COE. The sizes of such mini-grids for different eCook penetrations are reported in Table 5 and Table 6 although, there is still a need to further reduce the energy cost to make it more attractive to the consumer. As illustrated in this research, for a 100% eCook penetration with a system size of 165 kWp PV, 110 kW diesel generator and 193.2 kWh battery, the consumer would be required to pay approximately USD 24–30/month which is not feasible due to low income. However, different methods could be incorporated such as fuel stacking, boosting the utilization rate and integrating smart DSM techniques making it more cost attractive. DSM strategies and technologies are already being used in mini-grids to manage the operation of the system, although, there remains a need for more innovative and sophisticated techniques to accommodate large power appliances such as eCooks, while minimizing capacity upgrades and network reinforcements. For example, eCook supported batteries with an innovative charging management concept would maximize the utilization of electricity from the daily PV power and offset peak demand to a different time, by charging the batteries during off-peak hours to provide flexibility of demand. The prospect of a more rigorous and systematic payment scheme is also necessary as well as the need for Governmental support, tailored policies, and regulatory frameworks to be put in place.
Author Contributions
Conceptualization, S.K. and S.S.; methodology, S.K. and S.S.; software, S.K.; formal analysis, S.K. and S.S.; investigation, S.K.; writing—original draft preparation, S.K.; writing-review and editing, S.K., S.S., B.S. and S.G. All authors have read and agreed to the published version of the manuscript.
Funding
This work was supported through the Engineering and Physical Sciences Research Council (EPSRC) Centre for Doctoral Training in Future Power Networks and Smart Grids (EP/L015471/1).
Informed Consent Statement
Not applicable.
Acknowledgments
The authors thank the Modern Energy Cooking Services (MECS) consortium for their support and for providing access to their low-income household electricity demand, which was modeled throughout the MECS program.
Conflicts of Interest
The authors declare no conflict of interest.
References
- International Energy Agency; International Renewable Energy Agency; United Nations Statistics Division; The World Bank; World Health Organization. The Energy Progress Report Tracking SDG7: The Energy Progress Report (2019); International Renewable Energy Agency: Abu Dhabi, United Arab Emirates, 2019. [Google Scholar]
- Africa Energy Outlook 2019–Analysis-IEA. World Energy Outlook. 2019. Available online: https://www.iea.org/reports/africa-energy-outlook-2019 (accessed on 10 July 2020).
- Fasina, E.T.; Oliyide, R.O.; Cipcigan, L.M. Localised Energy Systems in Nigerian Power Network. Doctoral Thesis, Cardiff University, Wales, UK, 2019. [Google Scholar]
- Energy Sector Management Assistance Program. Mini Grids for Half a Billion People: Market Outlook and Handbook for Decision Makers; World Bank: Washington, DC, USA, 2019. [Google Scholar]
- Access to Energy-Our World in Data. Available online: https://ourworldindata.org/energy-access (accessed on 14 October 2020).
- Sustainable Energy for All. State of the Global Mini-Grids Market Report 2020; Sustainable Energy for All: Vienna, Austria, 2020. [Google Scholar]
- Pedersen, M.B. Deconstructing the concept of renewable energy-based mini-grids for rural electrification in East Africa. Wiley Interdiscip. Rev. Energy Environ. 2016, 5, 570–582. [Google Scholar] [CrossRef] [Green Version]
- Solórzano, J.; Egido, M.Á. Simulation of AC, DC and AC-DC Coupled Hybrid Mini-Grids In Search of the Most Efficient System; Universdad Politecnica de Madrid: Madrid, Spain, 2011. [Google Scholar]
- Svarc, J. Solar Battery System Types-AC vs. DC Coupled. 2019. Available online: https://www.cleanenergyreviews.info/blog/ac-coupling-vs-dc-coupling-solar-battery-storage (accessed on 1 July 2020).
- OpenDSS. OpenDSS-Software. Available online: https://www.epri.com/pages/sa/opendss (accessed on 24 May 2021).
- HOMER Pro. HOMER Pro-Microgrid Software for Designing Optimized Hybrid Microgrids. Available online: https://www.homerenergy.com/products/pro/index.html (accessed on 24 May 2021).
- Leach, M.; Mullen, C.; Lee, J.; Soltowski, B.; Wade, N.; Galloway, S.; Coley, W.; Keddar, S.; Scott1, N.; Batchelor, S. Modelling the Costs and Benefits of Moving to Modern Energy Cooking Services–Methods & Application to Three Case Studies; MECS: Hong Kong, China, 2021. [Google Scholar]
- McKenna, E.; Thomson, M. High-resolution stochastic integrated thermal-electrical domestic demand model. Appl. Energy 2016, 165, 445–450. [Google Scholar] [CrossRef] [Green Version]
- Batchelor, S.; Brown, E.; Scott, N.; Leary, J. Two birds, one stone-reframing cooking energy policies in Africa and Asia. Energies 2019, 12, 1591. [Google Scholar] [CrossRef] [Green Version]
- Mullen, C.; Wade, N. Developing the CREST Model for Demand Modelling in MECS Appliance Data and Multi-Tier Framework for Household Electrical Load Modelling; MECS: Newcastle, UK, 2020. [Google Scholar]
- Leary, J.; Scott, N.; Sago, S.; Minja, A.; Batchelor, S.; Chepkurui, K.; Sawe, E. eCook Tanzania Cooking Diaries Working Paper. 2019. Available online: https://www.mecs.org.uk/wp-content/uploads/2020/12/eCook-Tanzania-Cooking-Diaries-Working-Paper-13-10-19-JL-COMPRESSED.pdf (accessed on 2 November 2019).
- Reber, T.; Booth, S.; Cutler, D.; Li, X.; Salasovich, J. Tariff Considerations for Micro-Grids in Sub-Saharan Africa; National Renewable Energy Laboratory: Golden, CO, USA, 2018; pp. 10–20. [Google Scholar]
- Kostopoulos, E.D.; Spyropoulos, G.C.; Kaldellis, J.K. Real-world study for the optimal charging of electric vehicles. Energy Rep. 2020, 6, 418–426. [Google Scholar] [CrossRef]
- BYD. BYD Battery-Box Pro User Manual. Available online: https://www.originenergy.com.au/content/dam/origin/residential/solar/BYD_User_Manual__Battery-Box_Pro_13.8.pdf (accessed on 6 May 2020).
- HelioClim-3 Real Time and Forecast. Available online: http://www.soda-pro.com/web-services/radiation/helioclim-3-real-time-and-forecast (accessed on 23 June 2020).
- HOMER Pro. Load Following Strategy. Available online: https://www.homerenergy.com/products/pro/docs/latest/load_following_strategy.html (accessed on 11 March 2020).
- Louie, H. Off-Grid Electrical Systems in Developing Countries; Springer: Cham, Switzerland, 2018. [Google Scholar]
- Marx, S.E. Symmetrical Components 1 & 2. In Proceedings of the 28th Annual Hands Relay School, Washington, DC, USA, 14–18 March 2011; pp. 1–14. [Google Scholar]
- Rwanda Utilities Regulatory Authority. Minimum Technical Requirements for Minigrids in Rwanda; Rwanda Utilities Regulatory Authority: Kigali, Rwanda, 2019. [Google Scholar]
- Ul-Haq, A.; Cecati, C.; Strunz, K.; Abbasi, E. Impact of Electric Vehicle Charging on Voltage Unbalance in an Urban Distribution Network. Intell. Ind. Syst. 2015, 1, 51–60. [Google Scholar] [CrossRef] [Green Version]
- MERA. Regulating Energy for Sustainable Development Malawi Grid Code 1; MERA: Lilongwe, Malawi, 2016. [Google Scholar]
- The World Bank. United Republic of Tanzania-Pump Price for Diesel Fuel. Available online: https://knoema.com/atlas/United-Republic-of-Tanzania/Diesel-price (accessed on 19 October 2020).
- Keddar, S.; Strachan, S.; Eales, A.; Galloway, S. Assessing the Techno-economic Feasibility of eCook Deployment on a Hybrid Solar-Diesel Mini-grid in Rural Malawi. In Proceedings of the 2020 IEEE PES/IAS PowerAfrica, Nairobi, Kenya, 25–28 August 2020; pp. 6–10. [Google Scholar]
- Moner-Girona, M.; Ghanadan, R.; Solano-Peralta, M.; Kougias, I.; Bódis, K.; Huld, T.; Szabó, S. Adaptation of Feed-in Tariff for remote mini-grids: Tanzania as an illustrative case. Renew. Sustain. Energy Rev. 2016, 53, 310. [Google Scholar] [CrossRef]
- D’arlon, R. Hybrid Mini-Grids For Rural Electrification: Lessons Learned; Alliance for Rural Electrification: Brussels, Belgium, 2014. [Google Scholar]
- HOMER Pro 3.14, Photovoltaic Panels (PV). Available online: https://www.homerenergy.com/products/pro/docs/latest/photovoltaic_panels_pv.html (accessed on 21 May 2021).
- World Bank; Energy Sector Management Assistance Programme (ESMAP). Mini-Grid Design Manual; World Bank: Washington, DC, USA, 2000. [Google Scholar]
- Temperature Coefficient of Resistance|Physics of Conductors and Insulators|Electronics Textbook. Available online: https://www.allaboutcircuits.com/textbook/direct-current/chpt-12/temperature-coefficient-resistance/ (accessed on 18 May 2020).
- Global Petrol Prices. Algeria Electricity Prices. 2020. Available online: https://www.globalpetrolprices.com/Algeria/electricity_prices/#hl100 (accessed on 17 December 2020).
- Finance, E. Understanding the Landscape; Sustainable Energy for All: Vienna, Austria, 2020. [Google Scholar]
- International Renewable Energy Agency. Innovation landscape Brief: Renewable Mini-Grids; International Renewable Energy Agency: Abu Dhabi, United Arab Emirates, 2019. [Google Scholar]
- Energy Sentry, Load Factor Calculation. Available online: http://energysentry.com/newsletters/load-factor-calculations.php (accessed on 10 December 2020).
Publisher’s Note: MDPI stays neutral with regard to jurisdictional claims in published maps and institutional affiliations. |
© 2021 by the authors. Licensee MDPI, Basel, Switzerland. This article is an open access article distributed under the terms and conditions of the Creative Commons Attribution (CC BY) license (https://creativecommons.org/licenses/by/4.0/).