
Potential Impact of Renewable Energy on the Sustainable Development of Russian Arctic Territories


Abstract
:1. Introduction
2. Literature Review
3. Materials and Methods
- -
- I—the amount of CO2 emissions in China (ten thousand tons);
- -
- P—total population (ten thousand people);
- -
- A—China’s GDP (ten thousand yuan);
- -
- T—carbon intensity (CO2 emissions per GDP: tons/ten thousand yuan);
- -
- UL—the share of the urban population in the total population (%);
- -
- ECS—the structure of energy consumption (the share of coal consumption in energy consumption, %);
- -
- ES—the structure of the economy (the share of the output value of the second industry in GDP, %).
- Regression on pooled data. The model parameters (m + 1) are estimated using OLS for all nt observations. The use of the method is justified if the existence of heterogeneous characteristics of the objects of observation or time points is not assumed. Otherwise, the OLS assumptions about balances are violated.
- Fixed effects models. This model assumes the presence of individual unobservable effects for each of the studied spatial objects. Using this model, it becomes possible to control the bias of estimates caused by individual effects of objects.
- Random effects models. Unlike fixed-effect models, it is assumed that differences between spatial features exist, but are random in nature.
4. Results
5. Discussion
6. Conclusions
Author Contributions
Funding
Institutional Review Board Statement
Informed Consent Statement
Conflicts of Interest
References
- Erickson, L.E. Reducing greenhouse gas emissions and improving air quality: Two global challenges. Environ. Prog. Sustain. Energy 2017, 36, 982–988. [Google Scholar] [CrossRef] [Green Version]
- Guarino, M.-V.; Sime, L.C.; Schröeder, D.; Malmierca-Vallet, I.; Rosenblum, E.; Ringer, M.; Ridley, J.; Feltham, D.; Bitz, C.; Steig, E.J.; et al. Sea-ice-free Arctic during the Last Interglacial supports fast future loss. Nat. Clim. Chang. 2020, 10, 928–932. [Google Scholar] [CrossRef]
- Kattsov, V.M.; Porfiriev, B.N. Climate change and its impact on the environment and economy of the Russian Arctic. Arct. Ecol. Econ. 2012, 2, 7–26. [Google Scholar]
- Konovalov, A.M. Transport infrastructure of the Russian Arctic: Problems and ways to solve them. Arctic: A Zone of Peace and Cooperation; Institute of World Economy and International Relations of the Russian Academy of Sciences: Moscow, Russia, 2011; pp. 120–141. [Google Scholar]
- Tzimas, E.; Georgakaki, A.; Peteves, S. Reducing CO2 emissions from the European power generation sector—Scenarios to 2050. Energy Procedia 2009, 1, 4007–4013. [Google Scholar] [CrossRef]
- Sokolov, Y.I. The Arctic: On the Problem of Accumulated Environmental Damage. The Barents Sea. Available online: http://barenzevo.arktikfish.com/index.php/ekologiya-barentseva-morya/703-arktika-k-probleme-nakop (accessed on 27 October 2020).
- Inozemtsev, V. Time to Collect Barrels. Available online: http://russiancouncil.ru/inner/?id_4=795#top-content (accessed on 27 October 2020).
- Gabderakhmanova, T.S.; Kiseleva, S.V.; Popel, O.S.; Tarasenko, A.B. Some aspects of the development of renewable energy in the Arctic zone of the Russian Federation. Altern. Energy Ecol. 2016, 41–53. [Google Scholar] [CrossRef]
- Morgunova, M.O.; Solovyov, D.A. Energy Supply of the Russian Arctic: Hydrocarbons or RES? System Consulting LLC: Moscow, Russia, 2016; p. 14. [Google Scholar]
- Smolentsev, D.O. Arctic energy Development: Challenges and opportunities for small-scale generation. Arct. Ecol. Econ. 2012, 3, 22–29. [Google Scholar]
- Strategy for the development of the Arctic zone of the Russian Federation and ensuring national security for the period up to 2020. The Edict of the President of the Russian Federation of 18 September 2008. Moscow. 2008. Available online: https://www.garant.ru/products/ipo/prime/doc/74710556/ (accessed on 27 October 2020).
- Popel, O.S. The use of renewable energy sources for energy supply to consumers in the Arctic zone. Arct. Ecol. Econ. 2015, 1, 64–69. [Google Scholar]
- Adhikari, G.C.; Vargas, P.A.; Zhu, H.; Grigoriev, A.; Zhu, P. Tetradic phos-phor white light with variable CCT and superlative CRI through organolead halide perovskite nanocrystals. Nanoscale Adv. 2019, 1, 1791–1798. [Google Scholar] [CrossRef] [Green Version]
- Adhikari, G.C.; Thapa, S.; Zhu, H.; Zhu, P. Mg2+-Alloyed All-Inorganic Halide Perovskites for White Light-Emitting Diodes by 3D-Printing Method. Adv. Opt. Mater. 2019, 7, 1900916. [Google Scholar] [CrossRef]
- Adhikari, G.C.; Thapa, S.; Zhu, H.; Grigoriev, A.; Zhu, P. Synthesis of CsPbBr3 and transformation into Cs4PbBr6 crystals for white light emission with high CRI and tunable CCT. J. Phys. Chem. C 2019, 123, 12023–12028. [Google Scholar] [CrossRef]
- Bushuev, V.V.; Zaichenko, V.M.; Morgunova, M.O.; Chernyavsky, A.A.; Solovyov, D.A. The potential of RES in the Arctic: New challenges. Materials of the International Conference “Revived Energy: Problems and Prospects” and the X School of Young Scientists “Actual problems of the development of revived energy resources” named after corresponding members of the RAS E. E. Shpilraina. 2017, Volume 1, pp. 94–99. Available online: https://istina.msu.ru/conferences/86891779/ (accessed on 28 October 2020).
- Kireeva, A. Three Remote Villages of the Murmansk Region Will Be Powered by “Green” Energy—Bellona.ru. Available online: http://bellona.ru/2014/10/08/triudalennyh-poselka-murmanskoj-obl/ (accessed on 27 October 2020).
- Sharovarova, E.P.; Alyokhin, V.N. Potential of RES development in the territories of Russia with decentralized energy supply. SUC 2020, 5, 54–55. [Google Scholar]
- Ignatieva, V.; Gadal, S. Alternative energy sources as a component of sustainable development of the Arctic regions. In Arctic Regions of Russia: The Role of National Projects in Shaping Sustainable Development; National School of Public and Business Administration: Moscow, Russia, 2020; pp. 732–743. [Google Scholar]
- Bezrukikh, P.P. (Ed.) Wind Energy: Reference and Methodological Manual; Publishing house «Energy»: Moscow, Russia, 2010; 313p. [Google Scholar]
- Aliukov, S.A.; Shishkov, A.A.; Ma, J.B.; Li, M.B.; Wang, S. Economic Cluster Analisis and Fuzzy Modelling of Operation of Wind Power Plants in the Arctic. IOP Conf. Ser. Earth Environ. Sci. 2020, 459, 062064. [Google Scholar] [CrossRef]
- Guliyev, I.A.; Ruzakova, V.I. Prospects for the Development of Renewable Energy in the Arctic Zone of the Russian Federation, Taking into Account International Experience. Ecological Bulletin of Russia. Available online: http://ecovestnik.ru/index.php/2013-07-07-02-13-50/nashi-publikacii/2904-perspektivy-razvitiya-vie-v-arkticheskoj-zone-rossijskoj-federatsii-s-uchetom-mezhdunarodnogo-opyta (accessed on 27 October 2020).
- Nazarova, Y.A.; Syrovetsky, V.A. The Possibilities of Using Renewable Energy Sources for the Energy Supply of the Arctic. Available online: http://vestnik-ku.ru/ru/arkhiv/2018-rus/vestnik-4-2018-rus/43-2018-rus/349-vozmozhnosti-ispolzovaniya-vozobnovlyaemykh-istochnikov-energii-dlya-energoobespecheniya-arktiki (accessed on 27 October 2020).
- Potravny, I.M.; Yashalova, N.N.; Boroukhin, D.S.; Tolstoukhova, M.P. The use of renewable energy sources in the Arctic: The role of public-private partnership. Econ. Soc. Chang. Facts Trends 2020, 13, 144–159. [Google Scholar]
- Quitoras, M.R.; Campana, P.E.; Crawford, C. Exploring electricity generation alternatives for Canadian Arctic communities using a multi-objective genetic algorithm approach. Energy Convers. Manag. 2020, 210, 112471. [Google Scholar] [CrossRef]
- Giordano, N.; Raymond, J. Alternative and sustainable heat production for drinking water needs in a subarctic climate (Nunavik, Canada): Borehole thermal energy storage to reduce fossil fuel dependency in off-grid communities. Appl. Energy 2019, 252, 113463. [Google Scholar] [CrossRef]
- Das, I.; Cañizares, C.A. Renewable energy integration in diesel-based microgrids at the Canadian arctic. Proc. IEEE 2019, 107, 1838–1856. [Google Scholar] [CrossRef]
- Christakos, K.; Varlas, G.; Cheliotis, I.; Spyrou, C.; Aarnes, O.J.; Furevik, B.R. Characterization of wind-sea-and swell-induced wave energy along the Norwegian Coast. Atmosphere 2020, 11, 166. [Google Scholar] [CrossRef] [Green Version]
- Chesnokova, S.V. China remains a leader in the development of renewable energy. East. Anal. 2012, 3, 161–164. [Google Scholar]
- Batova, T.; Lazareva, E.; Pavlova, E. Sustainable use of natural resources in the Arctic region (the example of China’s cooperation with Western countries). E3S Web Conf. 2019, 110, 02064. [Google Scholar] [CrossRef]
- Jung, W.; Jeong, J.; Chang, D. Design of renewables-battery combined energy system for energy isolated island. In Proceedings of the 29th International Ocean and Polar Engineering Conference, Honolulu, HI, USA, 16–21 June 2019. [Google Scholar]
- Sirviö, K.; Niemi, S.; Help, R.; Heikkilä, S.; Hiltunen, E. Behavior of B20 fuels in arctic conditions. Agron. Res. 2019, 17, 1207–1215. [Google Scholar]
- Mathanlal, T.; Martin-Torres, J.; Bhardwaj, A.; Mier, M.-P.Z. Self-sustainable monitoring station for extreme environments (s3me2): Design and validation. In Proceedings of the 2nd International Conference on Green Computing and Internet of Things (ICGCIoT), Bangalore, India, 16–18 August 2018; pp. 240–245. [Google Scholar]
- Dunichkin, I. Transport Interchange Hubs under the Conditions of the Far North. Advances in Intelligent Systems and Computing. In Energy Management of Municipal Transportation Facilities and Transport; Springer: Cham, Switzerland, 2017; pp. 446–452. [Google Scholar]
- Zhakisheva, A.A. Ways to prevent the harmful impact of oil and gas production on the environment. Bull. Chelyabinsk State Univ. 2011, 32, 142–149. [Google Scholar]
- Framework Convention on Climate Change. Available online: https://unfccc.int/resource/docs/2015/cop21/rus/l09r.pdf (accessed on 17 November 2020).
- General Characteristics of Anthropogenic Impacts on the Natural Environment. Ecology: Work and Life. Available online: https://ekdel.ru/problemy/antropogennoe-eto.html (accessed on 20 December 2020).
- Le Quéré, C.; Korsbakken, J.I.; Wilson, C.; Tosun, J.; Andrew, R.; Andres, R.J.; Canadell, J.G.; Jordan, A.; Peters, G.P.; van Vuuren, D.P. Drivers of declining CO2 emissions in 18 developed economies. Nat. Clim. Chang. 2019, 9, 213. [Google Scholar] [CrossRef] [Green Version]
- Tishkov, S.; Shcherbak, A.; Karginova-Gubinova, V.; Volkov, A.; Tleppayev, A.; Pakhomova, A. Assessment the role of renewable energy in socio-economic development of rural and Arctic regions. Entrep. Sustain. Issues 2020, 7, 3354–3368. [Google Scholar] [CrossRef]
- Marin, G.; Mazzanti, M. The evolution of environmental and labor productivity dynamics. J. Evol. Econ. 2013, 23, 357–399. [Google Scholar] [CrossRef]
- Kudryavtseva, O.; Ivanov, E.; Kolesnik, D.; Matveev, E.; Pechenkin, S. Assessment of the impact of the level of environmental pollution on economic growth. Sci. Res. Fac. Econ. Electron. J. 2017, 9, 68–80. [Google Scholar]
- Zaytsev, A.; Konnikov, E.; Asaturova, Y.; Didenko, S. Modelling the cyclic influence of climate change on the world economic system. In Proceedings of the 1st International Symposium of Earth, Energy, Environmental Science and Sustainable Development, JESSD, Jakarta, Indonesia, 28–30 September 2020; Volume 211. [Google Scholar] [CrossRef]
- Poumanyvon, P.; Kaneko, S. Does Urbanization Lead to Less Energy Use and Lower CO2 Emissions? A Cross-Country Analysis. Ecol. Econ. 2010, 70, 434–444. [Google Scholar] [CrossRef]
- Halkos, G.E.; Paizanos, E.A. The effect of government expenditure on the environment: An empirical investigation. Ecol. Econ. 2013, 91, 48–56. [Google Scholar] [CrossRef]
- Li, L.; Lei, Y.; He, C.; Wu, S.; Chen, J. Prediction on the Peak of the CO2 Emissions in China Using the STIRPAT Model. Adv. Meteorol. 2016, 2016, 5213623. [Google Scholar] [CrossRef] [Green Version]
- Leksin, V.N.; Porfiriev, B.N. Socio-economic priorities of sustainable development of the Arctic macroregion of Russia. Econ. Reg. 2017, 13, 985–1004. [Google Scholar]
- Kirsanova, N.; Lenkovets, O.; Nikulina, A. Renewable energy sources (RES) as a factor determining the social and economic development of the arctic zone of the Russian Federation. Int. Multidiscip. Sci. GeoConf. SGEM 2018, 18, 679–686. [Google Scholar]
- Jebli, M.B.; Farhani, S.; Guesmi, K. Renewable energy, CO2 emissions and value added: Empirical evidence from countries with different income levels. Struct. Chang. Econ. Dyn. 2020, 53, 402–410. [Google Scholar] [CrossRef]
- Dong, K.; Dong, X.; Jiang, Q. How renewable energy consumption lower global CO2 emissions? Evidence from countries with different income levels. World Econ. 2020, 3, 1665–1698. [Google Scholar] [CrossRef]
- Khattak, S.I.; Ahmad, M.; Khan, Z.U.; Khan, A. Exploring the impact of innovation, renewable energy consumption, and income on CO2 emissions: New evidence from the BRICS economies. Environ. Sci. Pollut. Res. 2020, 27, 13866–13881. [Google Scholar] [CrossRef] [PubMed]
- de Souza Mendonça, A.K.; Barni, G.D.A.C.; Moro, M.F.; Bornia, A.C.; Kupek, E.; Fernandes, L. Hierarchical modeling of the 50 largest economies to verify the impact of GDP, population and renewable energy generation in CO2 emissions. Sustain. Prod. Consum. 2020, 22, 58–67. [Google Scholar] [CrossRef]
- Yao, C.; Feng, K.; Hubacek, K. Driving forces of CO2 emissions in the G20 countries: An index decomposition analysis from 1971 to 2010. Ecol. Inform. 2015, 26, 93–100. [Google Scholar] [CrossRef]
- Deutch, J. Decoupling economic growth and carbon emissions. Joule 2017, 1, 3–5. [Google Scholar] [CrossRef] [Green Version]
- Ratner, S.; Gomonov, K.; Revinova, S.; Lazanyk, I. Eco-Design of Energy Production Systems: The Problem of Renewable Energy Capacity Recycling. Appl. Sci. 2020, 10, 4339. [Google Scholar] [CrossRef]


| Type of Human Anthropogenic Impact | Ways to Reduce Harmful Impact | Related Sustainable Development Goals |
|---|---|---|
| Emissions and discharges | Limitation of maximum permissible emissions and discharges, disposal of production and consumption waste | SDG 6, 7, 11, 12, 13, 14, 15 |
| Depletion of natural resources | Establishment of permissible limits for the use of natural resources of the territory | SDG 6, 7, 9, 11, 12, 13, 14, 15, 16, 17 |
| Rapid development of mining and industrial production enterprises | Justification of the maximum level of development of enterprises, introduction of an environmentally safe structure of enterprises, territorial restrictions of economic activity, up to a complete ban | SDG 6, 9, 11, 12, 13, 14, 15, 17 |
| NO | Indicator | Designation in the Model | Unit of Measurement | Relevant Sustainable Development Subgoals |
|---|---|---|---|---|
| 1. | Amount (level) of CO2 emissions | CO2 | megatons | 3.9 By 2030, significantly reduce the number of deaths and diseases from hazardous chemicals, air, water and soil pollution. 7.3 By 2030, double the global rate of energy efficiency improvement. 9.4.1 Reduce total CO2 emissions per unit of value added. 11.6 By 2030, reduce the negative impact of cities on the environment per capita, including by focusing on air quality and the disposal of municipal and other waste 13.2.2 Reduce total gas emissions per year. |
| 2. | The amount of electricity consumed per year | EL | TW/year | 7.1.1 Proportion of the population with access to electricity |
| 3. | Annual coal consumption | COAL | megatons | 7.1.2 Proportion of the population that primarily relies on clean fuels and technologies 12.2 By 2030, achieve sustainable management and efficient use of natural resources. |
| 4. | GDP per capita | VVP | million US dollars | 8.1 Maintaining per capita economic growth in line with national circumstances and, in particular, gross domestic product growth of at least 7 per cent per year in the least developed countries. 17.1 Strengthening domestic resource mobilization, including through international support to developing countries, to improve domestic capacity to collect taxes and other revenue |
| 5. | The share of renewable energy in the total energy balance of the country | RE | % | 7.2.1 Share of renewable energy sources in total final energy consumption 12.a.1 Installed renewable energy capacity in developing countries (in watts per capita) 17.7 Promote the development, transfer, dissemination and dissemination of environmentally sound technologies. |
| 6. | The share of the urban population in the total population | URB | % | 9.1 Develop quality, reliable, sustainable and sustainable infrastructure, including regional and cross-border infrastructure, to support economic development and human well-being, with a focus on affordable and equitable access for all. 11.1 By 2030, ensure access for all to adequate, safe and affordable housing and basic services |
| 7. | Export of technological innovations | TEC2 | million US dollars | 2.a Increase investment, including through enhanced international cooperation, in rural infrastructure, agricultural research and extension services, technology development, and plant and animal genetic banks. 7.a By 2030, expand international cooperation to facilitate access to clean energy research and technology. 17.7.1 Total funding for developing countries to promote the development, transfer, dissemination and dissemination of environmentally sound technologies. |
| 8. | Per capita income of the population | ERN | US dollars/year | 1.2 By 2030, reduce by at least half the proportion of men, women and children of all ages living in poverty in all its dimensions. 2.1 By 2030, ensure access to safe, nutritious and sufficient food for all people all year round. 4.3 By 2030, ensure equal access for all women and men to affordable and high-quality technical, vocational and higher education, including university education. 8.8 Protect labour rights and promote safe and secure working conditions for all workers 10.1.1 Growth rate of household expenditure or per capita income among the poorest 40 per cent of the population and the entire population. 16.10 Ensure public access to information and protect fundamental freedoms in accordance with national legislation and international agreements. |
| 9. | The share of the service sector in the total GDP | SI | % | 2.c Take measures to ensure the proper functioning of markets for food products and their derivatives and promote timely access to market information, including on food reserves, to help limit extreme food price volatility. 9.3.1 Increase the share of small enterprises in the total value added of the industry |
| 10. | Population density | POP | people/km2 | 2.a Increase investment, including through increased international cooperation, in rural infrastructure, agricultural research and extension services, technology development, and plant and animal genetic banks to enhance agricultural productive capacity 11.3 By 2030, strengthen inclusive and sustainable urbanization and capacity for collaborative, integrated and sustainable human settlements planning and management in all countries. |
| 11. | Carbon intensity (CO2 emissions per GDP) | INT | tons/ten thousand US dollars | 6.3 By 2030, improve water quality by reducing pollution, eliminating discharges and minimizing emissions of hazardous chemicals and materials, halving the proportion of untreated wastewater, and significantly increasing recycling and safe reuse worldwide. 7.3 By 2030, double the global rate of energy efficiency improvement 8.4 Progressively improve global resource efficiency in production and consumption by 2030, and strive to separate economic growth from environmental degradation. 14.1 By 2025, prevent and significantly reduce marine pollution of all types, in particular from land-based activities, including pollution of marine debris and nutrients |
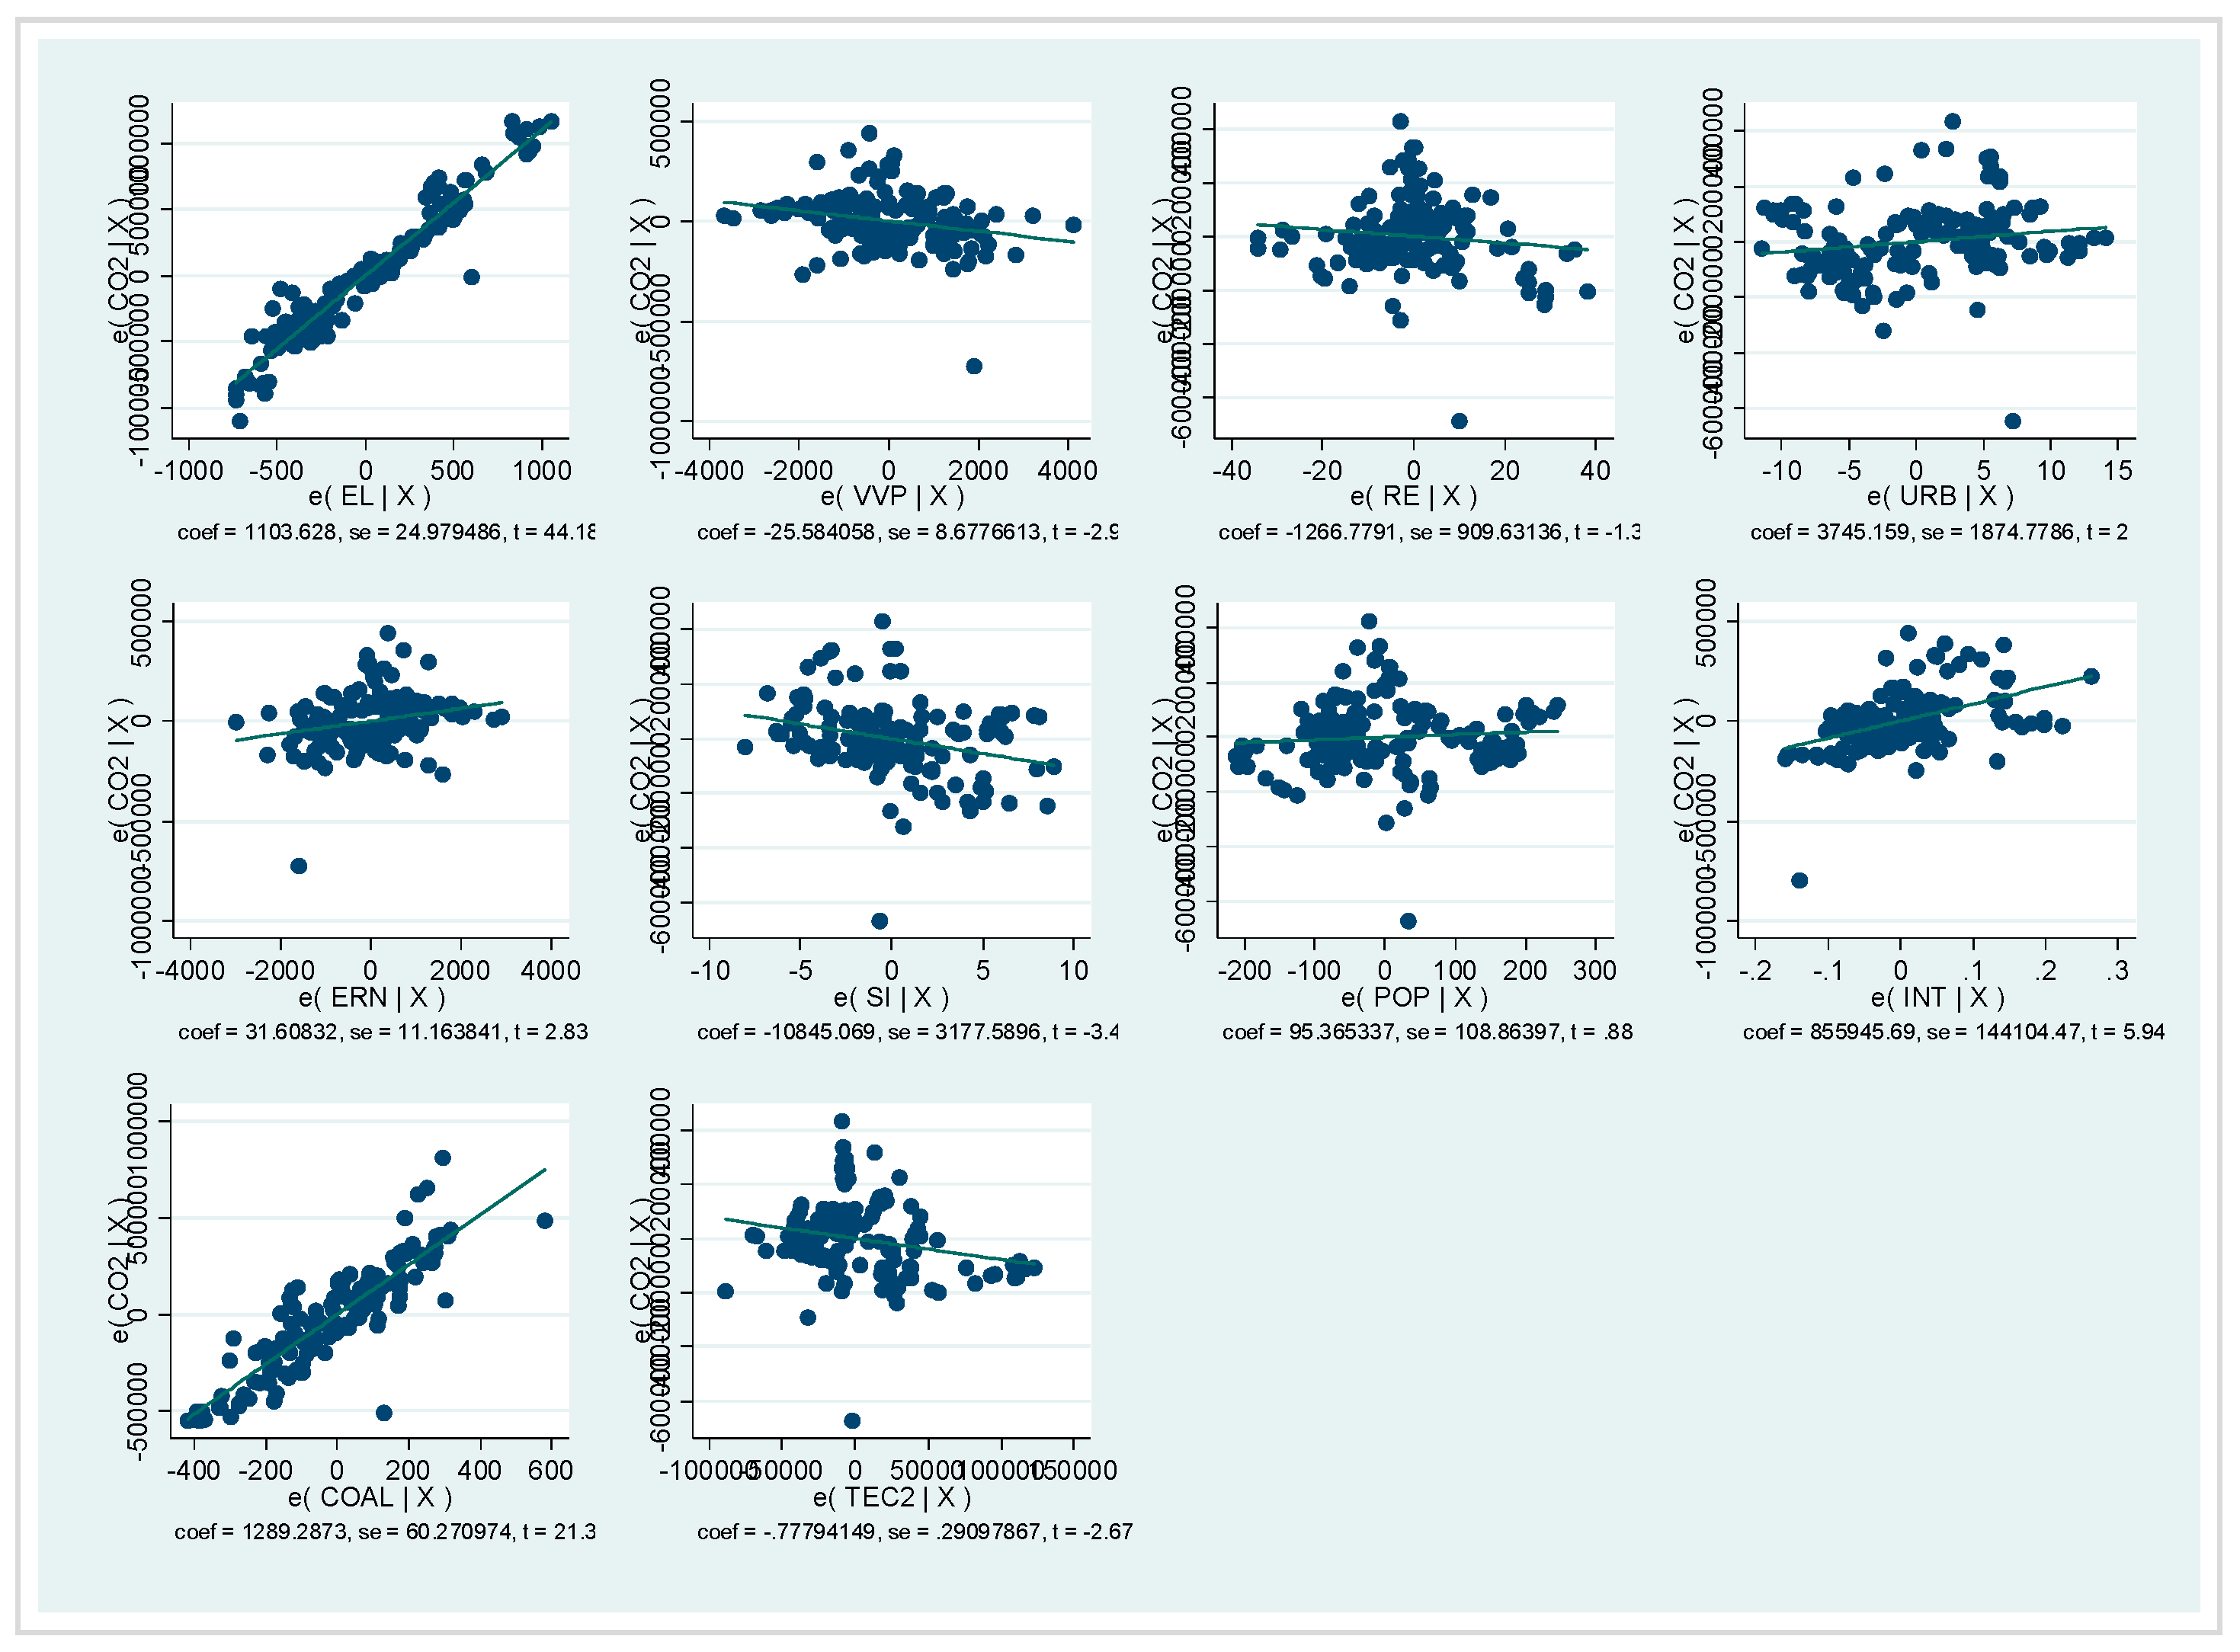
| The Resulting Indicator | Variables/Model Parameters | p > |t| (p-Value)/Parameter Value |
|---|---|---|
| CO2 | EL | 0.000 |
| VVP | 0.004 | |
| RE | 0.166 | |
| URB | 0.048 | |
| ERN | 0.005 | |
| SI | 0.001 | |
| POP | 0.383 | |
| INT | 0.000 | |
| COAL | 0.000 | |
| TEC2 | 0.008 | |
| Constanta | 0.228 | |
| Model Parameters | Parameter value | |
| 146 | ||
| 0.9971 | ||
| 0.9969 | ||
| RMSE | 1.4 × 10⁵ |
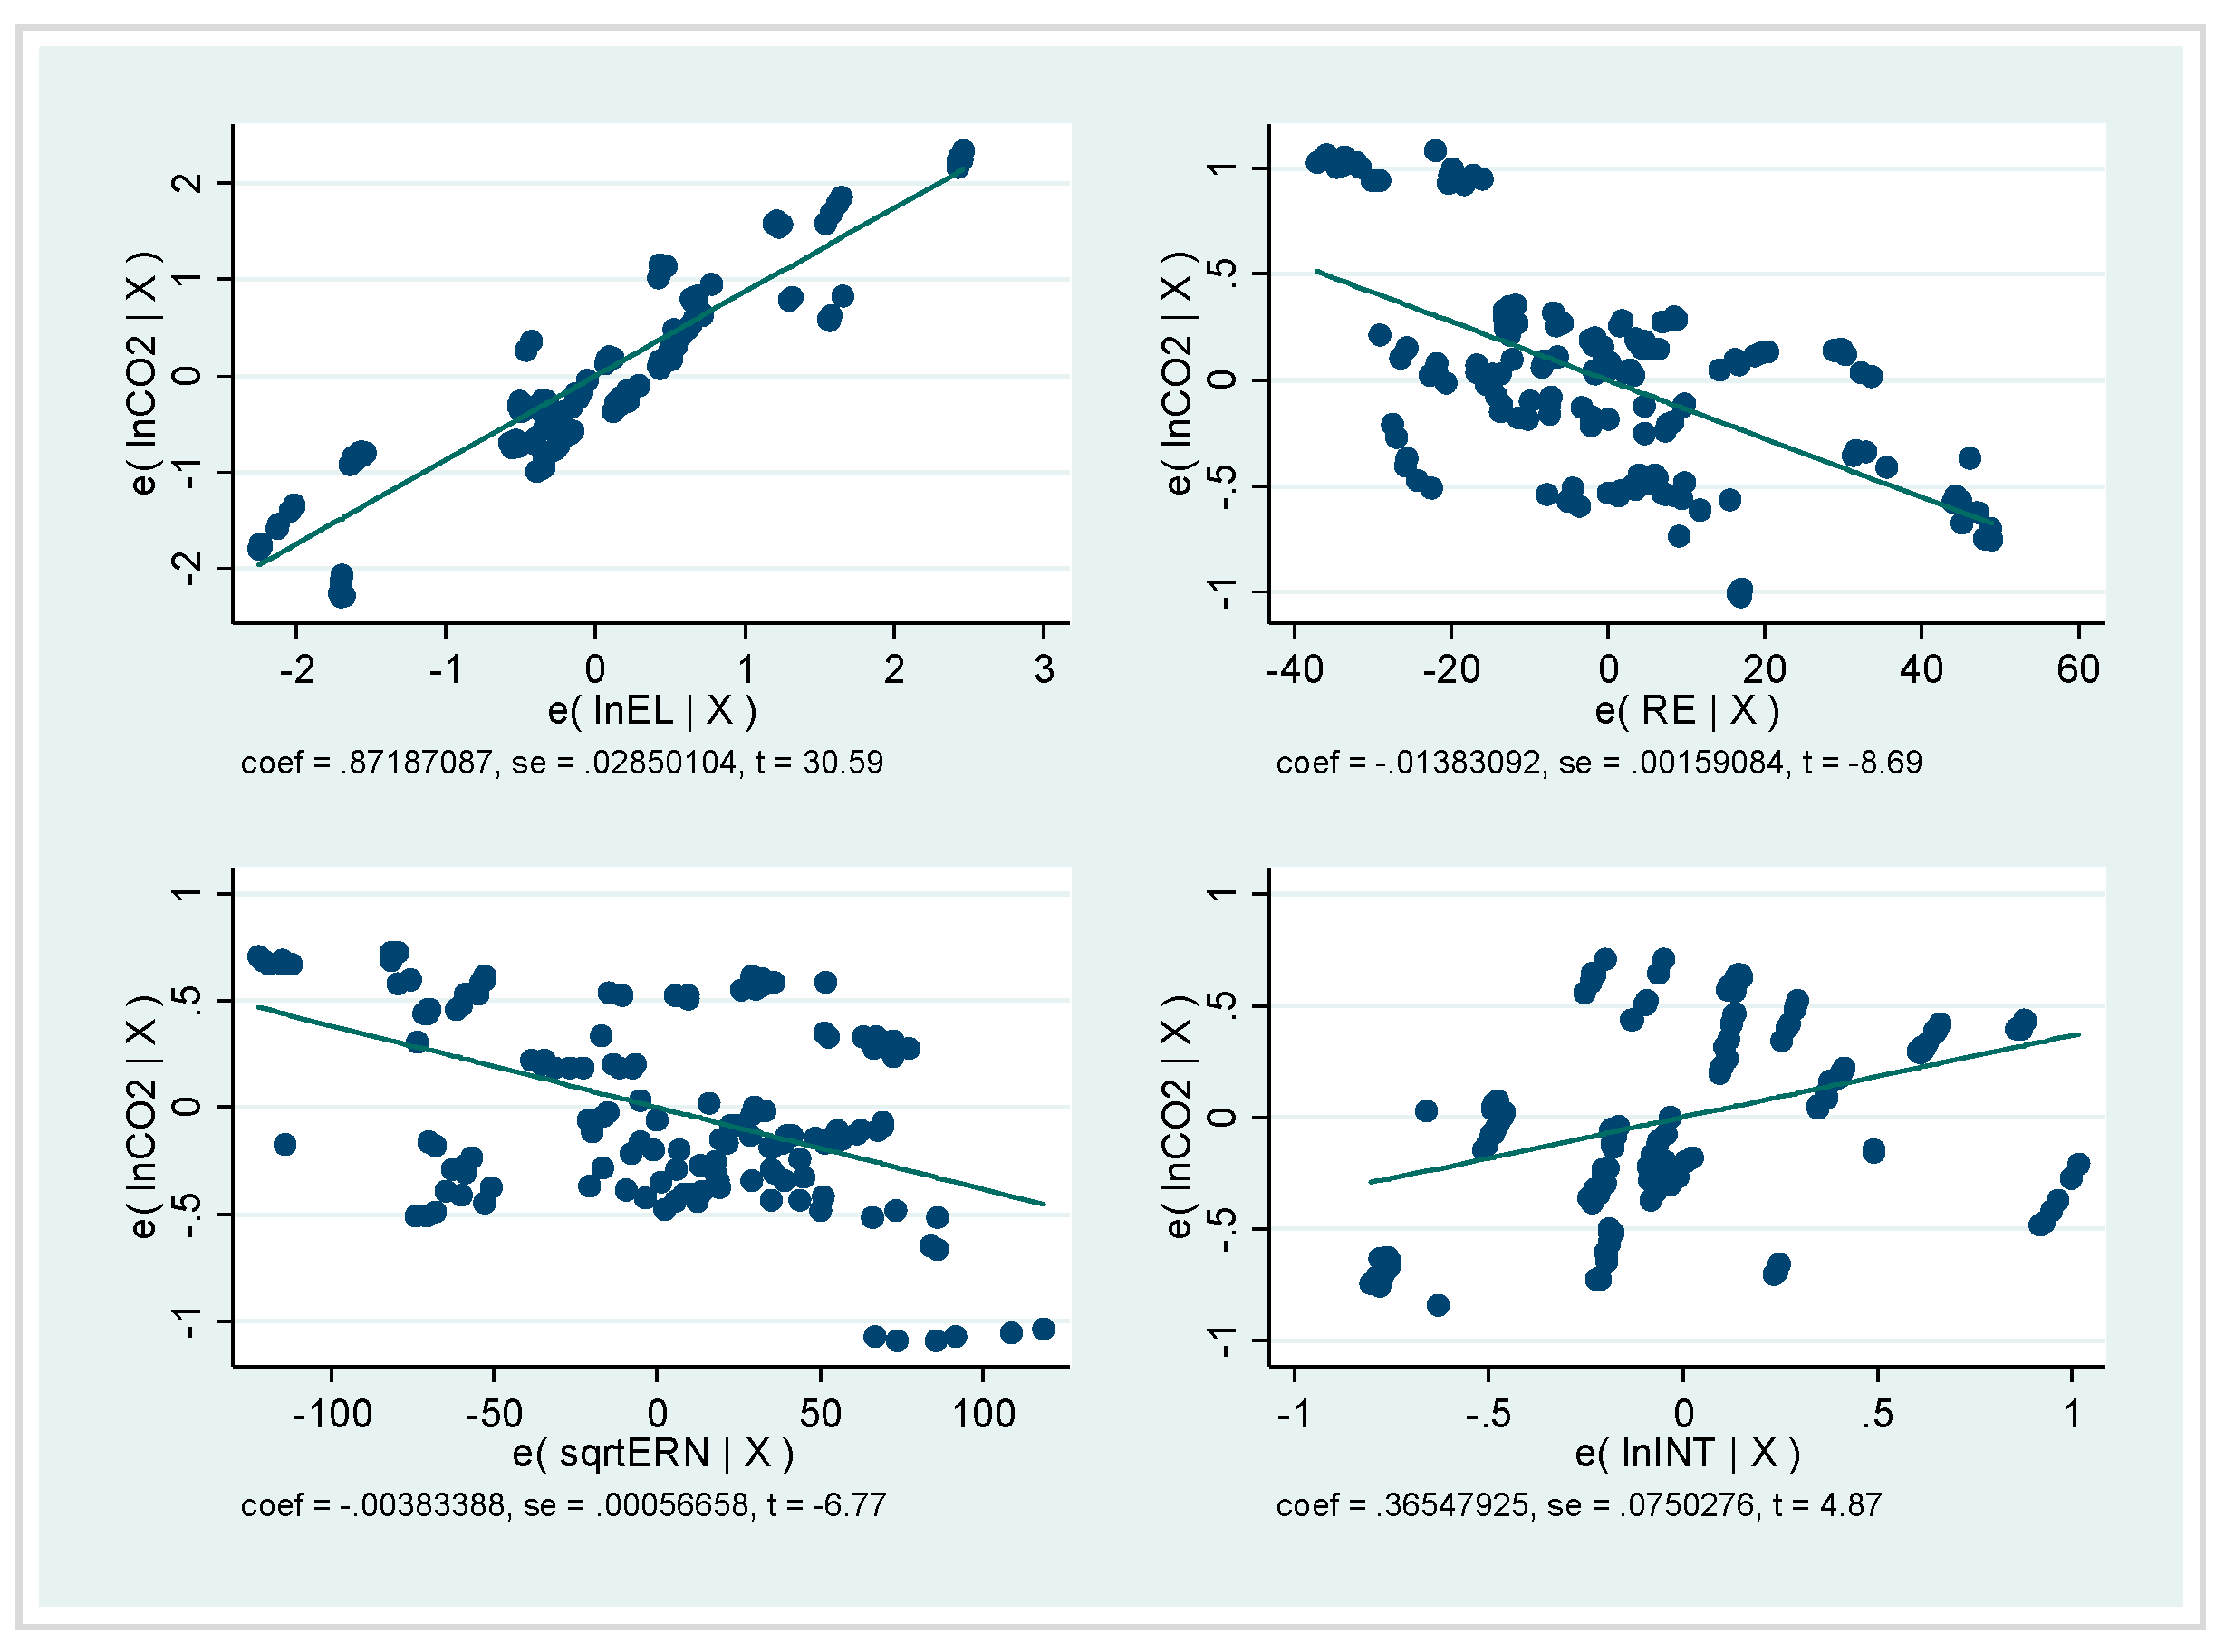
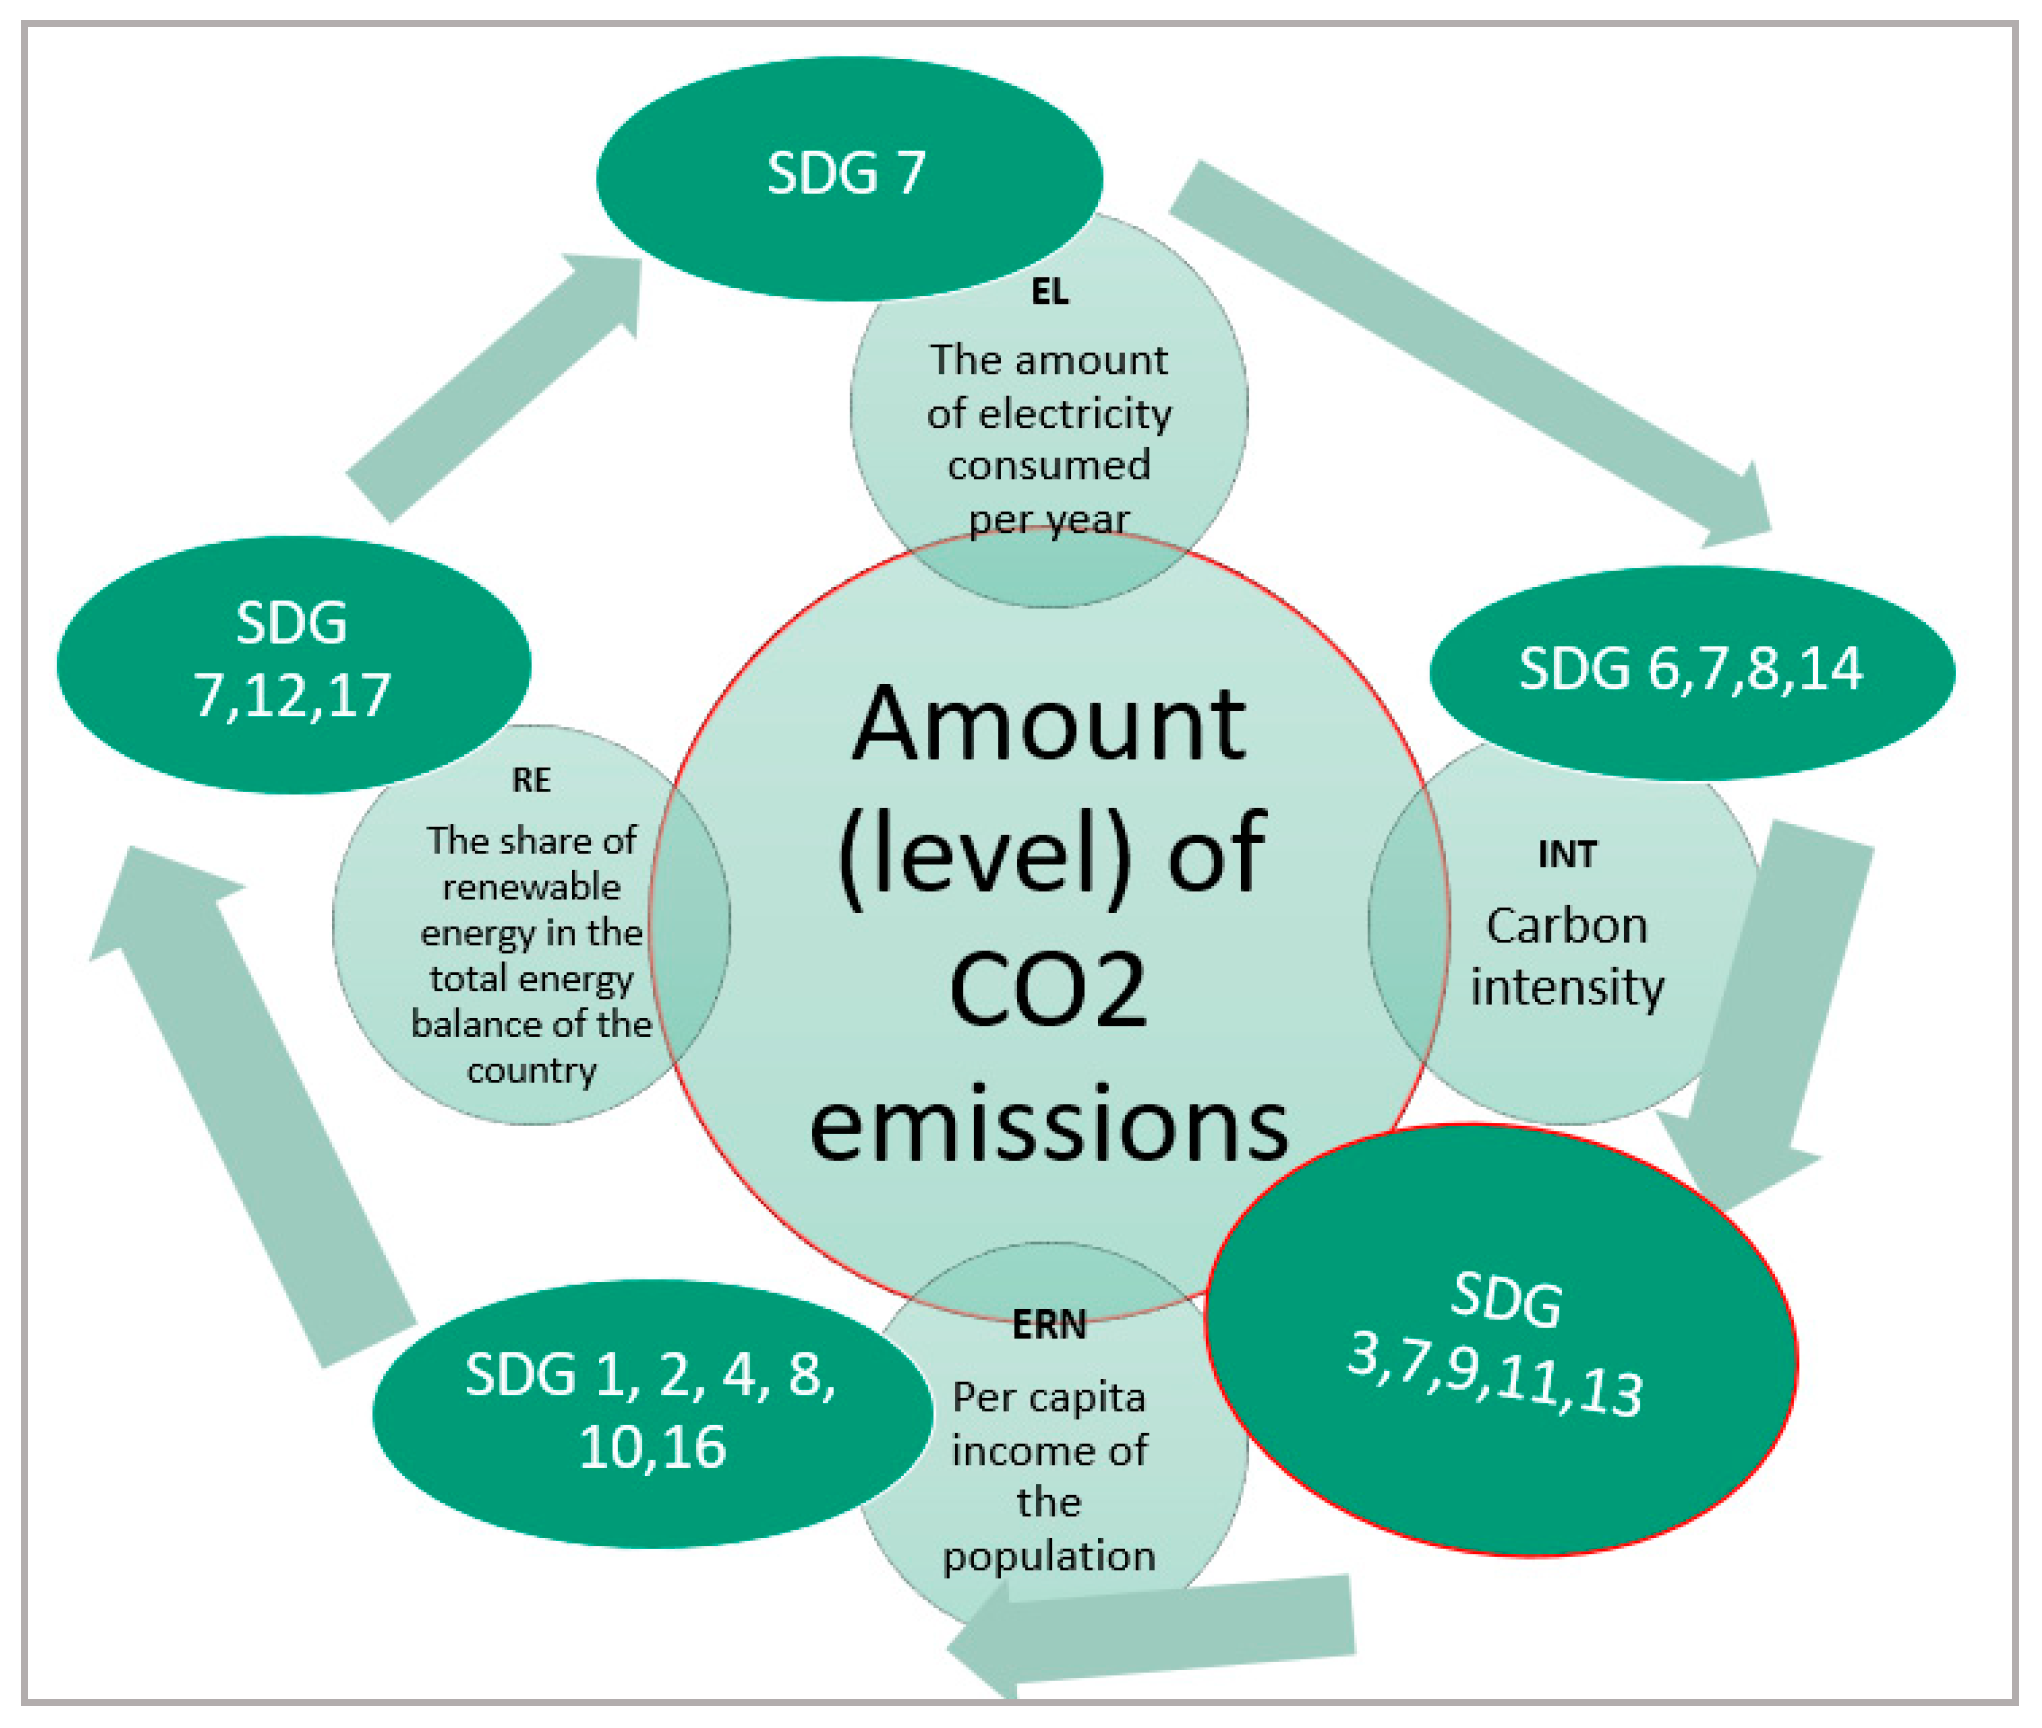
| The Resulting Indicator | Variables and Model Parameters | p > |t| (p-Value) | Coef. |
|---|---|---|---|
| CO2 | lnEL | 0.000 | 0.8718709 |
| RE | 0.000 | −0.0138309 | |
| sqrtERN | 0.000 | −0.0038339 | |
| lnINT | 0.000 | 0.3654792 | |
| Constanta | 0.000 | 9.255415 | |
| Model parameters | Parameter value | ||
| 148 | |||
| 0.9414 | |||
| 0.9397 | |||
| RMSE | 0.39495 |
| Variable | VIF |
|---|---|
| lnINT | 1.44 |
| lnEL | 1.43 |
| RE | 1.39 |
| sqrtERN | 1.31 |
| Mean VIF | 1.39 |
Publisher’s Note: MDPI stays neutral with regard to jurisdictional claims in published maps and institutional affiliations. |
© 2021 by the authors. Licensee MDPI, Basel, Switzerland. This article is an open access article distributed under the terms and conditions of the Creative Commons Attribution (CC BY) license (https://creativecommons.org/licenses/by/4.0/).
Share and Cite
Brazovskaia, V.; Gutman, S.; Zaytsev, A. Potential Impact of Renewable Energy on the Sustainable Development of Russian Arctic Territories. Energies 2021, 14, 3691. https://doi.org/10.3390/en14123691
Brazovskaia V, Gutman S, Zaytsev A. Potential Impact of Renewable Energy on the Sustainable Development of Russian Arctic Territories. Energies. 2021; 14(12):3691. https://doi.org/10.3390/en14123691
Chicago/Turabian StyleBrazovskaia, Viktoriia, Svetlana Gutman, and Andrey Zaytsev. 2021. "Potential Impact of Renewable Energy on the Sustainable Development of Russian Arctic Territories" Energies 14, no. 12: 3691. https://doi.org/10.3390/en14123691
APA StyleBrazovskaia, V., Gutman, S., & Zaytsev, A. (2021). Potential Impact of Renewable Energy on the Sustainable Development of Russian Arctic Territories. Energies, 14(12), 3691. https://doi.org/10.3390/en14123691