Article

Combining Baffles and Secondary Porous Layers for Performance Enhancement of Proton Exchange Membrane Fuel Cells

1
Croatian Defense Academy, Naval Studies, University of Split, 21000 Split, Croatia
2
Faculty of Electrical Engineering, Mechanical Engineering and Naval Architecture, University of Split, 21000 Split, Croatia
3
Center for Excellence for Science and Technology—Integration of Mediterranean Region, University of Split, 21000 Split, Croatia
4
Department of Engineering Science, University of Oxford, Oxford OX1 3PJ, UK
5
Institute of Green Chemistry and Chemical Technology, Jiangsu University, Zhenjiang 212013, China
6
Institute of Chemical Engineering and Environmental Technology, Graz University of Technology, 8010 Graz, Austria
*
Authors to whom correspondence should be addressed.
Energies 2021, 14(12), 3675; https://doi.org/10.3390/en14123675
Submission received: 25 May 2021 / Revised: 15 June 2021 / Accepted: 18 June 2021 / Published: 20 June 2021
(This article belongs to the Section A5: Hydrogen Energy)

Abstract

:
A numerical study is conducted to compare the current most popular flow field configurations, porous, biporous, porous with baffles, Toyota 3D fine-mesh, and traditional rectangular flow field. Operation at high current densities is considered to elucidate the effect of the flow field designs on the overall heat transfer and liquid water removal. A comprehensive 3D, multiphase, nonisothermal computational fluid dynamics model is developed based on up-to-date heat and mass transfer sub-models, incorporating the complete formulation of the Forchheimer inertial effect and the permeability ratio of the biporous layers. The porous and baffled flow field improves the cell performance by minimizing mass transport losses, enhancing the water removal from the diffusion layers. The baffled flow field is chosen for optimization owing to the simple design and low manufacturing cost. A total of 49 configurations were mutually compared in the design of experiments to show the quantitative effect of each parameter on the performance of the baffled flow field. The results elucidate the significant influence of small geometry modifications on the overall heat and mass transfer. The results of different cases have shown that water saturation can be decreased by up to 33.59% and maximal temperature by 7.91 °C when compared to the reference case which is already characterized by very high performance. The most influencing geometry parameters of the baffles on the cell performance are revealed. The best case of the 49 studied cases is further optimized by introducing a linear scaling factor. Additional geometry modifications demonstrate that the gain in performance can be increased, but at a cost of higher pressure drop and increased design complexity. The conclusions of this work aids in the development of compact and high-performance proton exchange membrane fuel cell stacks.

1. Introduction

Proton exchange membrane (PEM) fuel cells are gaining momentum as the most favorable power supply for stationary, portable, and automotive applications [1,2]. Owing to the requirement for costly platinum catalysts, it is necessary to maximize the performance and achieve high power density per active area of the cell [3]. Operation at high power densities is a limiting factor for PEM fuel cells due to the accumulation of significant quantities of liquid water inside the catalyst layers (CLs), gas diffusion layers (GDLs), and reactant channels, resulting in poor performance due to uneven spatial distribution of current density and the accompanying heat and mass transfer [4]. Operation with a significant amount of liquid water inside the cell during transient operating conditions, e.g., at starting and stopping or load cycling, results in higher degradation rates owing to the highly non-uniform heat and mass transfer over the active area [5]. Hence, mitigation strategies have been developed to reinforce oxygen transport to the CLs by minimizing the water blockage between the flow field and GDLs [6]. Employing such mitigation strategies improves the operational stability by decreasing the amount of liquid water accumulated in the main flow fields, which is the main cause of pressure and voltage fluctuations [7]. The currently popular mitigation strategies can be roughly categorized into: (i) slightly increasing the flow field complexity by adding baffles or obstacles inside the channels; and (ii) introducing secondary porous layers or microstructures for water removal from the GDLs and consequently the CLs during operation. However, it is still not clear which approach results in higher performance due to the absence of direct comparison to date and the two research directions seem to diverge. Thus, the flow field complexity and price increase iteratively. Furthermore, since a number of works only focused on the influence of limited parameters, e.g., different shape (triangular, rectangular, circular, etc.), of baffle geometries on the cell performance, the synergistic influence of multi-variables on the operating parameters of interest during operation, such as (i) mass fraction of oxygen in the cathode CLs; (ii) liquid saturation inside the CLs and the channel; (iii) temperature inside the cathode CLs at high current densities, have not been revealed yet. Moreover, the up-to-date multiphase models and the influence of the Forchheimer inertial effect have not been considered in most of the numerical models, which is a significant deficiency when novel flow fields are numerically studied. As a result, many novel flow field structures were explored without considering the probability that similar effects and performance can be achieved using simple geometry after optimization.
It was found that the novel flow fields resulted in a significant improvement of cell performance by minimizing the mass transport losses and increasing the oxygen transport to the active sites. Therefore, it is reasonable to believe that it is possible to enhance the performance of the cell with a relatively simple flow field design by manipulating heat and mass transfer without the necessity of using complex and costly flow fields, e.g., Toyota 3D fine-mesh structure. For example, Xing et al. [8] modified the parallel flow field by enabling adjacent channels to operate at different pressures. This novel flow field reinforced the reactant mass transport and reduced the water accumulation under the rib. In a recent study [9], higher cell performance with lower Pt utilization was achieved through a synergistic approach that integrated the inhomogeneous Pt distribution with the temperature-graded parallel flow field [10]. The inhomogeneous distribution of Pt loading and operating temperature minimized mass transport losses owing to the occurrence of water in critical zones of the cell in comparison with conventional designs. Nevertheless, manipulating pressure and temperature gradients with parallel rectangular channels limited the practical application. Thus, it is required to develop more complex flow fields, which could utilize the pressure and temperature gradients and enhance the transport of the reactants into the GDLs, to improve the cell performance. One of the most complex flow field designs, named 3D fine-mesh flow field, was applied on the 1st generation Toyota Mirai™ (2014–2019), where repeating 3D micro-lattices were employed as baffles, as described by Konno et al. [11]. This design enhanced the interfacial flux between the GDL and flow field channels, improved the oxygen transport towards the CLs, and removed liquid water from the porous electrode more efficiently, thus significantly increasing the limiting current density compared with other less-complex flow fields, e.g., serpentines [12]. Nevertheless, the 3D fine-mesh flow fields are very complex and costly to produce due to the requirement for advanced milling and coating techniques, as well as the contact resistance due to the requirement for developing such flow fields from more parts and assembling them together. The widespread application of 3D fine-mesh flow fields in fuel cell stacks is also debatable. As a result, the recently developed 2nd generation of Toyota Mirai fuel cell vehicles used dramatically simplified parallel zigzag-shaped flow field channels, a design very similar to the vastly used plate heat exchangers. It was found that the new stack with the parallel zigzag flow field is more compact (5.4 kW l−1 vs. 3.0 kW l−1 of the previous model) and more powerful (128 kW vs. previous 113 kW), leading to a conclusion that complex flow field structures may not be necessary. Therefore, the design and optimization of relatively simple flow fields, e.g., equipped with baffles/biporous layers, are considered as a promising solution. The implementation of baffled flow fields was investigated experimentally by Heidary et al. [13], who compared the cell performance of regular channels without baffles to those with in-line and staggered baffles. It was found that the presence of obstacles in the reactant flow path led to an increase in the flow of reactant gases into the GDLs, thus increasing the oxygen concentration within the CLs and improving the cell performance up to 28%. The mid-baffled and conventional interdigitated flow fields were experimentally investigated by Thitakamo et al. [14], in which the mid-baffled flow field showed superior performance, leading to an increase in the limiting current density by a factor of 1.1–1.4. Wave-like baffles were introduced into the cathode flow fields by Han et al. [15], and the cell performance was improved by 5.76% and 5.17% for 25 cm2 and 84 cm2 cells, respectively. Nevertheless, the application of baffles in the abovementioned cases [13,14,15] resulted in a significantly higher pressure drop along the channel. To mitigate the pressure drop, a novel 3D serpentine waved flow field was proposed by Li et al. [16], in which the straight channels and waved channels with angles varying from 15° to 45° were tested. A 17.8% increase in the peak power density was observed compared with that of conventional serpentine design owing to the improved water management resulting from the forced convection of reactant gas in the through-plane direction of the novel flow field. Moreover, the wave-like baffled flow field resulted in a decreased pressure drop in comparison with the conventional flow field without baffles.
Even though baffles show promising mass and heat transfer inside the cell, the mechanisms have not been investigated in detail in the available literature. Most numerical models were established based on mist flow assumption, two-dimensional geometry, and isothermal approach, which typically led to poor representation of the delicate heat and mass transfer inside the cell. Regardless of the numerous benefits of the baffles [17], another approach is oriented towards the development of porous flow fields using metal foams, biporous layers, and micro-grooved channels. In comparison with baffles, this approach achieved more uniform heat and mass transfer over the active area by avoiding hot spots inside the cell. Additionally, this approach makes it possible to design a flow field to exploit the capillary effect to extract liquid water away from the GDLs and CLs. Although promising, this approach is too complicated to realize in comparison with baffles due to the necessity for more expensive manufacturing techniques, such as inserting pieces of porous layers inside the narrow channels. One example of exploiting the capillary effect to trigger liquid water redistribution is the micro-grooved flow fields developed by Utaka et al. [18,19,20], in which tilted micro-channels were arranged inside the channel walls to remove liquid water from the GDLs through capillary force and air flow shearing. It was experimentally determined that the maximum current density was improved by 16% when the air velocity was 8.0 m s−1, while the voltage fluctuations were significantly minimized [19]. In a recent study [20], the pattern and arrangement of the GDL wettability distribution were investigated in a combined hybrid GDL and micro-grooved channel system. An optimal hybrid angle of 20° was suggested for the critical current density and maximum power. Another approach was to use a porous flow field to replace conventional flow fields, as demonstrated by Kozakai et al. [21]. The experimental analysis showed that under 100% inlet relative humidity, the uniform porosity and nonuniform porosity flow fields improved the maximal current density to 2.2 and 2.4 A cm−2, respectively, superior to 1.8 A cm−2 obtained with serpentine channels. The increase in cell performance was attributed to the separation of liquid water and gas in an organized manner as a consequence of different pore sizes and structures. Another method of exploiting the capillary effect is, once again, the 3D fine-mesh flow field of the Toyota Mirai™ [11,22,23], in which the generated liquid water can be rapidly drained from the flow field through small holes, drilled in the bipolar plate, via capillary force. As a result, a significant amount of liquid water appears on the top portion of the bipolar plate rather than at the interface of the main flow field and the GDLs. The influence of the secondary porous layer was numerically investigated by Kim et al. [24] using an isothermal model and assuming a uniform current density distribution at the GDL/CL interface. It was concluded that it is possible to achieve selective water retention inside the biporous layer, instead of GDL, for a certain range of porosity ratios. However, the influence of condensation/evaporation and the Forchheimer effect were neglected. Every mentioned deficiency has been resolved in the numerical model shown in this work, using equations from works [25,26,27,28,29,30,31,32,33,34,35,36,37,38,39,40,41,42], to avoid overcrowding the manuscript with equations, please refer to the numerical model in the Supplementary Materials.
Besides the mentioned deficiencies, recently, the CFD analysis of PEM fuel cells has improved and different numerical model approaches are seen for the first time. From the steady-state models, the numerical works are oriented towards the entire fuel cell flow fields and experimental validation, as seen in Carcadea et al. [43]. Another interesting approach related to steady-state models is seen in Sabzpoushan et al. [44] where the authors have conducted a numerical study, using a two-dimensional steady-state model, to investigate the influence of non-uniform catalyst loading using a constant slope along the channel, where the performance of the cell is increased by 1.6% in power density and 5% in voltage. The transient approach is also gaining traction and oriented towards studying temporally resolved mass concentrations of the gas constituents with and without purge strategies in Peng et al. [45]. Transient models are also developed to study the influence of the inlet velocity fluctuations on the performance of the cell, Kulikovsky [46], as well as performance of the cell with the existence of catalyst layer cracks under relative humidity cycling conditions, Qin et al. [47]. Some of the mentioned approaches [43,44,45,46,47] will be the focus of the following works due to increasing the computational complexity, which is not feasible at the moment due to the prolonged time required since optimization must be conducted in a reasonable amount of time.
Based on the literature, it is easy to see that baffles and biporous layers can both significantly enhance cell performance. Due to the practical difficulties of manufacturing the highly complex 3D fine-mesh flow fields and the problematic implementation of the biporous layers inside the channels, a comprehensive study is carried out in this work to determine the optimal approach under identical operating conditions, which is for the first time presented. Since liquid water removal and heat transfer are of prime importance at high current densities, very high current density is chosen as a reference case. By developing the numerical model we eliminated the shortcomings of some of the other referenced numerical models, which are: (i) mist-flow assumption, which neglects the dominant process of water phase change at high current densities and results in poor capability for predicting water pooling and its influence on the reactant flow; (ii) two-dimensional approach, which is unable to predict spatial distribution of liquid water under the lands and the influence of reactant depletion on the increased pooling of water under the lands, as well as increased heat transfer in regions where the lands are in contact with the GDL; (iii) isothermal assumption, in which water phase change was not coupled with temperature profiles and the effect of inhomogeneous distribution of temperature on several key parameters was not considered; (iv) the absence of inertial effects at high flow rates, which is critical to water removal at high pressure drop in comparison with Darcy’s approach (only valid at low Reynolds number); (v) the failure of quantitative distinguishing the impact of baffles and secondary porous layers; (vi) limited number of flow field configurations and design parameters, which are not sufficient to outline the synergistic effects of different combination of the parameters on the overall performance of the cell. Although some of the aforementioned deficiencies are addressed in [17], such as the 3D model and multi-phase approach, others are not, especially related to heat and mass transfer for different baffle geometries and the influence of the fully resolved Forchheimer’s effect.
In this study, we have taken into account all of the mentioned deficiencies and developed an upgraded numerical model to gain an improved understanding of the influence of baffles and secondary porous layers on the cell performance of PEM fuel cells, with emphasis on operation at very high current densities for the development of compact fuel cell stacks. The model developed in this work has several benefits when compared to other available computational fluid dynamics (CFD) models. The main benefit is the advanced approach for water management based on modeling the water phase change between liquid water, water vapor, and dissolved water in the membrane/ionomer, which is associated with the heat transfer during the electrochemical reaction and water phase change, as well as enhanced modeling of the influence of the capillary effect and liquid water transport inside the reactant channels. In addition, the inertial effect of the fully resolved Forchheimer equation and the influence of the porosity ratio of the biporous layer were taken into account, using up-to-date references. A comprehensive 3D nonisothermal CFD model was for the first time conducted on a novel flow field equipped with both baffles and secondary porous layers inside the channels.
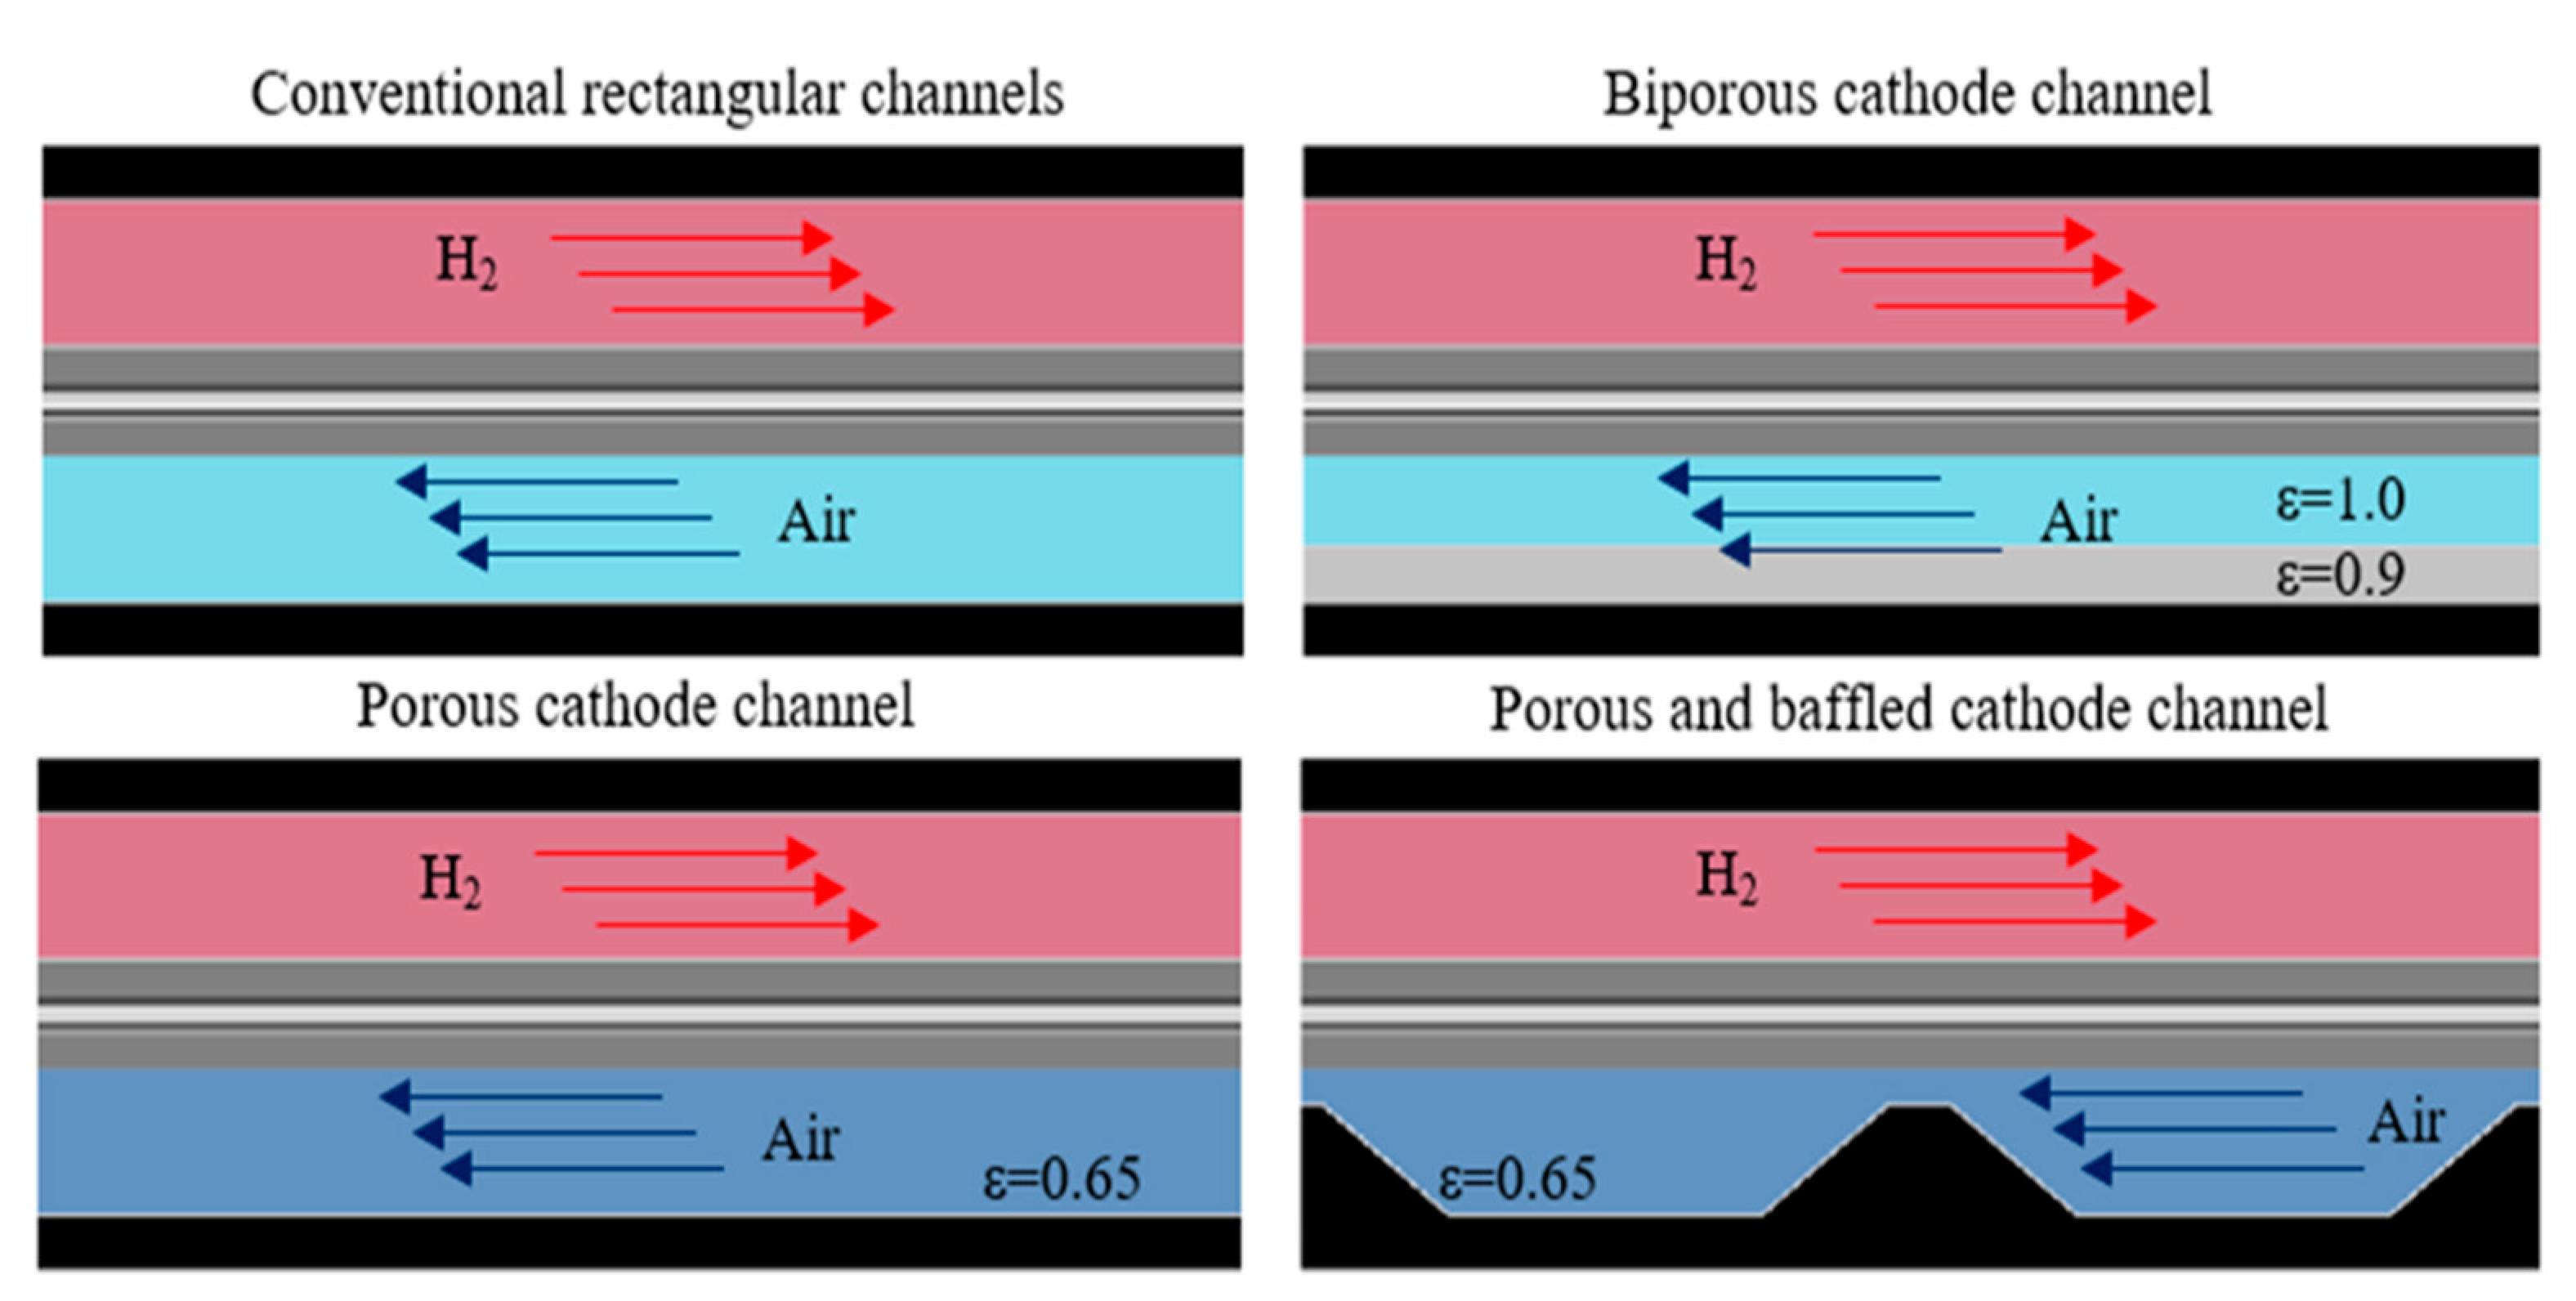
In the first part of this paper, three different types of novel channel configurations (porous, biporous, and porous with baffles) were compared with conventional rectangular channels, focusing on the coupled water and heat transfer processes and the resulting cell performance. The pros and cons of each approach were outlined, resulting in conclusions that the most feasible approach would be to use the baffles and optimize them to achieve the highest cell performance. In the second part, the baffled flow field geometry was parameterized, and a custom design of experiments was created for 49 different cases to determine the influence of the geometry parameters of the baffles on the efficiency, pressure drop, liquid saturation, oxygen mass fraction, and temperature. The best case was chosen for further optimization by introducing the scaling factors along the length of each baffle and additional seven configurations were tested numerically, with the aim of outlining the potential performance gain or loss which can be attributed to designing the flow field with uneven baffles, keeping in mind that the flow field simplicity is a very important factor for production.
Based on the numerical results, even though a combination of porous layers and baffles showed the highest performance, it is concluded that the baffles attribute to the largest portion of benefits, which are the most feasible solution for further development of high-performance PEM fuel cells. Besides the improved efficiency and water removal, the optimization of baffle shape is possible to significantly decrease the temperature in the CL and improve the oxygen concentration, and even achieve a higher performance than the porous and baffled flow field. The disadvantage of the porous and baffled flow field is the increased pressure drop, which is ca. 3× higher than that equipped with baffles only. The optimization results revealed that the pressure drop could be very high if the distance from the baffles to the substrate is lower than a threshold value. In some extreme cases, the pressure drop increases exponentially, as a consequence of the newly introduced Forchheimer inertial coefficient, which results in the enhanced water removal at a cost of required high pumping power. The findings in our model provide practical guidance on the manufacture of novel flow fields for maximum cell performance with minimum complexity.

2. Numerical Model

2.1. Governing Equations and Boundary Conditions

To avoid repetition, the governing equations are shown in the Supplementary Materials—Section S1. Model development. The equations for the electrochemistry, mass, charge, and heat transport are adopted from references [27,28,29,30,31,32,33,34,35]. Besides, the mass transport at high flow velocities under inertial force is emphasized in the following sections.

2.2. Inertial Force and Biporous Layer

2.2.1. Forchheimer Inertial Effect

According to Darcy’s law, the flow velocity is directly proportional to the pressure gradient. However, this is only valid when the flow velocity is low (Re < 1). Darcy’s law considers viscous forces as dominant over inertial forces inside porous media. Therefore, the inertial forces can be neglected. For higher flow velocities (especially when the Re number exceeds 100, while for the gaseous phase it is as important as a viscous pressure loss in Re range between 10 and 500 [17]), the Forchheimer equation describes the fluid flow behavior more accurately than Darcy’s law. In the work of Kim et al. [17], the Forchheimer effect was introduced only in a form of permeability related coefficient, which multiplies the filtration velocity to the first power, see the right-hand side factor k f h of Equation (5), while the term multiplying the velocity to the second power was neglected. The introduced inertial resistance coefficient β , see the right-hand side of Equation (5), multiplies the filtration velocity to the second power and results in a significantly higher pressure drop at elevated filtration velocities, which is beneficial for liquid water removal at very high current densities. The newly derived inertial coefficient, adopted from several experimental works, is substituted into the numerical model which was previously developed and rigorously experimentally validated against neutron radiography data for a 100 cm2 single cell under various operating conditions [25]. Thus, the model presented in this work is an upgraded version.
The flow regime in porous media is characterized by the dimensionless Reynolds number (Re), expressed as:
R e = ρ v l μ
where ρ represents density, v velocity, l characteristic length, and μ absolute viscosity.
The pressure drop of single-direction stationary incompressible Newtonian fluid is defined as:
p x = μ k v
where p represents pressure, x spatial coordinate, μ absolute viscosity, k permeability.
When the Re number increases, the inertial forces become predominant and the correlation between the pressure gradient and velocity becomes non-linear. In the weak inertia regime (area 2 in Figure S1 in Supplementary Materials), the inertial forces become as influential as the viscous forces. Therefore, Darcy’s expression is corrected by the cubic filtration velocity as follow:
p x = μ k v + γ μ ρ 2 v 3
where γ represents weak inertia coefficient and ρ density of the fluid. Weak inertia regime is confirmed numerically in the works of Rasoloarijaona and Auriault [37] and Skjetne [38], and experimentally by Skjetne and Auriault [39].
By further increasing the velocity, the weak inertia regime transits to the Forchheimer regime, i.e., intense inertia, where the pressure drop is proportional to the square of filtration velocity:
p x = a v + b v 2
where a and b represent fitting constants, which are correlated to the properties of fluids [37,38,39], thereby re-writing the Forchheimer equation as:
p x = μ k f h v + β ρ v 2
where k f h represents Forchheimer permeability, β inertial resistance coefficient, i.e., Forchheimer coefficient. Due to the transition between weak and intense inertia, k f h k . It is assumed that the transition lies in transforming the kinetic energy into internal energy due to work exerted by the viscous stress. At low Re numbers, the viscous dissipation is a consequence of the viscous force, which remains constant. At higher Re numbers, the viscous dissipation increases due to the occurrence of intense inertial forces, thereby resulting in the alteration of the superficial permeability of the media [36]. In this work only the influence of gas phase Forchheimer inertial effect is considered, while the liquid water phase is neglected due to several reasons: (i) the mass flow rate of liquid water is only ca. 10% of total mass flow rate, therefore the flow velocity of the liquid phase is low, and since the inertial term is multiplied by velocity squared it results in very small influence for Re numbers below 50; (ii) the liquid water has ca. 30× higher dynamic viscosity at the same operating temperature;(iii) in regions below the baffles, where the flow velocities are highest there are only minute amounts of liquid water present. Considering the range of Re numbers in the studied cases, for the reference case with 0.1 distance baffle substrate, Re number is ca. 150, since the flow velocity in the close gap is ca. 17.5 ms−1, while for the maximal distance of 0.15 mm Re is around 100. Other cases have distance baffle substrate below 0.1 mm so the majority of the cases are heavily influenced by Forchheimer’s inertial term since the velocities are higher due to lower cross-section area vs. the reference case.

2.2.2. Biporous Layer

Biporous layers represent the secondary layers of lower permeability mounted on the bottom of the cathode channels of the bipolar plate. Implementation of biporous layers results in improved water removal, leading to the selective accumulation of liquid water in the biporous layer instead of the GDL. As a result, the oxygen mass fraction inside the CL increases along the downstream direction owing to the reduced liquid water obstruction. The permeability of the biporous layer is carefully controlled to achieve the proper redistribution of liquid water inside the flow channels, as insufficient permeability can lead to flooding of the biporous layer and eventually excessive water accumulation within the GDL. Therefore, the most important parameters of the biporous layer are porosity and permeability. The biporous layer must be highly porous (ε > 0.8) to guarantee high permeability, while its volume is roughly equivalent to the volume of the remaining unobstructed channel. The most important parameter for determining the required porosity of the biporous layer is the permeability ratio, R K , defined as:
R K = K 1 / K 2
where K 1 represents the permeability of the channel and K 2 permeability of the biporous layer. As the R K value increases, the amount of liquid water stored in the biporous layer increases. However, there is a threshold, above which the biporous layer is saturated and excessive flooding occurs. The threshold values, according to Kim et al. [24], are studied for a range of values, i.e., R K = 200 ÷ 500 . Thus, the equation for determining the threshold value of R K is expressed as follow:
R K t h = 0.8 [ S O 2 v g A 2 ( 1 + α ) M O 2 v l i q A 1 ]
where S O 2 represents stoichiometry of oxygen, v q velocity of the reactant gas, A 2 cross-section of the biporous layer, α transfer coefficient, i.e., net water transfer due to back-diffusion and electro-osmotic drag, M O 2 molar mass of oxygen, v l i q velocity of liquid water, A 1 cross-section of the reactant channel. The threshold permeability ratio for this work is set to R K t h = 200 . At this threshold value, the saturation of the biporous layer starts to occur. If the value of R K = 200 is exceeded, a portion of the biporous layer is completely saturated with liquid water, preventing the absorption of liquid water from the channel, and hindering the performance of the cell.

3. Geometry

Four configurations are considered and investigated under high current density operation, as shown in Figure 1. The conventional rectangular channels are 100 mm long with cross-sections of 0.55 mm in height and 1 mm in width. Inside the sections are fluid channels with a height of 0.4 mm and width of 0.8 mm, while the thickness of the walls on the sides and top are 0.1 and 0.15 mm, respectively. The membrane thickness is 10 µm, CL thickness is 15 µm, MPL thickness is 30 µm, and GDL substrate is 100 µm. The dimensions are the same for the anode and the cathode side. The biporous layer thickness is 0.15 mm, while its porosity is set to ε = 0.9, according to Kim et al. [24]. The porosity is set to ε = 0.65 for the porous cathode channel and the porous and baffled cathode channel configurations. The geometry of the baffles is adopted from Kim et al. [17] for comparison with the published reference. The base of the baffle is 1 mm, while the top width is 0.2 mm, and the height of the baffle is 0.3 mm. The polarization curves from Toyota Mirai™ and work [17] are used as references to calibrate the exchange current density and cathode charge transfer coefficient, and these parameters are used in the subsequent simulations and comparisons. Unlike the titanium materials used in Kim et al. [17], the material of the bipolar plate in this study is molded graphite.

4. Mesh

Owing to the very strict requirements for mesh quality, a fully structured hexahedral mesh was generated by decomposing the geometry into a large number of smaller blocks. Grid dependency tests were conducted in previous studies [25,31,32], and the parameters of the grid-independent mesh setup were applied in this study for convenience. The details of the mesh for different configurations are shown in Figure S2 in the Supplementary Materials. The number of elements and average orthogonal quality are summarised in Table 1.

4.1. Model Properties and Boundary Conditions

4.1.1. Material Properties

A complete list of component properties used in the model is shown in Table 2.

4.1.2. Porous/Biporous Layers Permeability and Porosity

Porosity and permeability for the conventional and porous channels are shown in Table 3. The permeability ratio is set to 200, as previously mentioned, to ensure maximal water retention with minimized occurrence of liquid water inside the channel and the GDL substrate.

4.1.3. Forchheimer Effect Parameters

The Forchheimer effect is more significant in the sections with smaller cross-sectional area, e.g., under the baffles. The Forchheimer inertial effect, the novelty of this work, is adopted as inertial loss term C i j in momentum sink term, expressed as follow:
S i = ( j = 1 3 D i j μ v j + j = 1 3 C i j 1 2 ρ | v | v j )
where S i represents momentum sink term, j represents Cartesian coordinate, D i j viscous loss term, C i j inertial loss term, ρ density, v velocity. Viscous loss term D i j   is calculated as:
D i j = 1 K
where K represents permeability. The Forchheimer effect is added as inertial loss term C i j modification, according to [33], and calculated as follows:
C i j = 0.01 K 0.5 ε 5.5
The values of the modified inertial term including the Forchheimer effect are shown in Table 4.

4.1.4. Boundary Conditions

The boundary conditions are shown in Table 5. The governing equations, along with the boundary conditions, are resolved in commercial software ANSYS Fluent® v17.2 with the up-to-date PEMFC add-on module [24].

5. Results and Discussion

The polarization curves of Toyota Mirai™ stack (divided by the number of cells to get the single-cell voltage) adopted from [40], and for the baffled flow field in Kim et al. [17] were used as a reference for the calibration of key parameters, e.g., the reference exchange current density and charge transfer coefficient at the cathode. It can be noted that the Mirai™ results are only available for single cell voltages higher than ca. 0.65 V, while the testing was not performed for total stack voltages lower than 220 V. Since liquid water is more pronounced at higher current densities, the results are compared with Kim et al. [
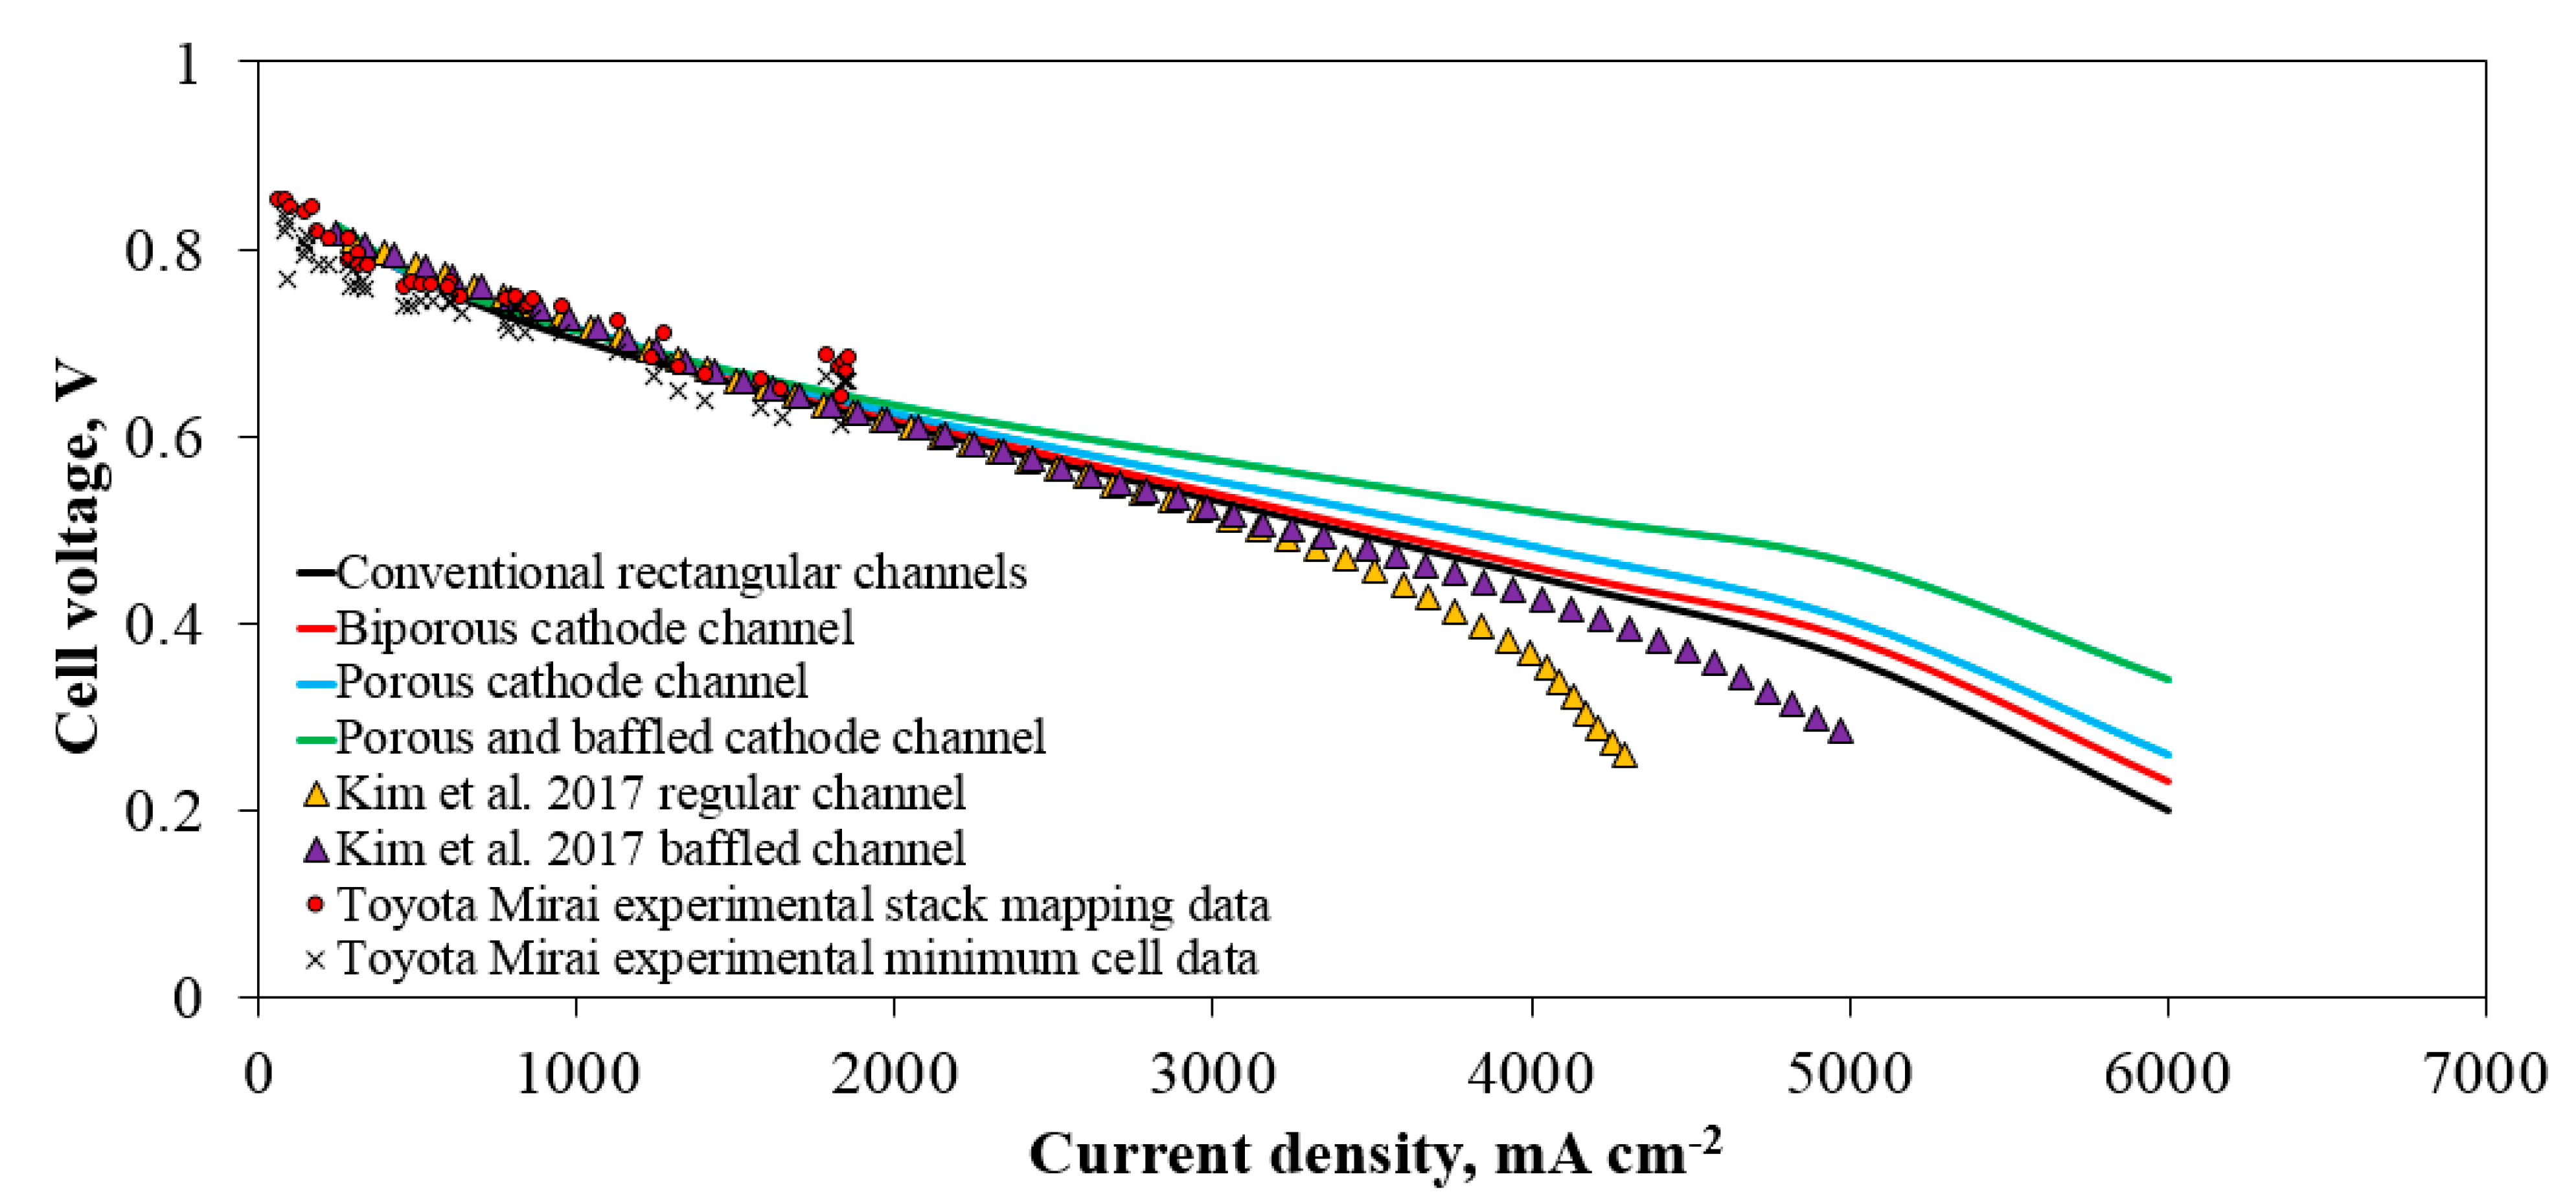
17] to better evaluate the performance of each flow field under more extreme operating conditions. The baffled cathode channel (without the porous layer) with identical geometric parameters (i.e., a length of 200 mm) and material parameters (i.e., a titanium bipolar plate) were used for the calibration phase (results not shown here). The calibrated parameters were used in the subsequent analysis. As shown in Figure 2, the polarisation curves in the low current density range overlap, indicating that the electrochemical parameters in the model are identical for all studied cases. Thus, it is easy to investigate the effect of the flow field design when the electrochemical parameters are kept constant in all studied cases. The cell performance of two reference cases in Kim et al. [17] are shown in Figure 2, while the other four curves represent the cases with different bipolar plate materials (molded graphite instead of titanium), channel dimensions (100 mm vs. 200 mm), and significantly different model setups.
Comparing the polarization curve of the conventional channel (black solid line) with the reference cases indicates an improved cell performance at high current densities, which can be explained by the different materials of the bipolar plates and the introduction of the inertial Forchheimer effect term, proportional to the filtration velocity squared. In the reference cases, a titanium material with a thermal conductivity of 117 Wm−1K−1 was used, while the molded graphite used in the conventional channel has a much lower thermal conductivity of 20 Wm−1K−1. The lower thermal conductivity leads to a higher temperature at the GDL-channel interface, consequently resulting in less liquid water inside the GDL, and thus decreasing the mass transport losses.
The remaining cases using biporous and porous cathode channels showed slightly higher performance than the conventional channel, while the highest performance was achieved using the porous and baffled cathode channel. In Kim et al. [17], a current density of 4.0 A·cm−2 was used as a reference for comparison of the performance gain, which is also used in this study. Such high current density is chosen because the Forchheimer inertial effect is prominent at higher flow rates due to dependency on the filtration velocity squared, therefore at low flow rates its influence is not so notable. At 4.0 A·cm−2, the cell voltage of the porous and baffled channel is 0.520 V compared with 0.353 V for the conventional channel and 0.4257 V for the baffled channel, indicating that the cell performance of the porous and baffled channel is 47.3% and 22.1% higher than that of the conventional and baffled channels, respectively. The performance gain is more prominent at higher current densities, but the data for comparison is not available for such high currents.
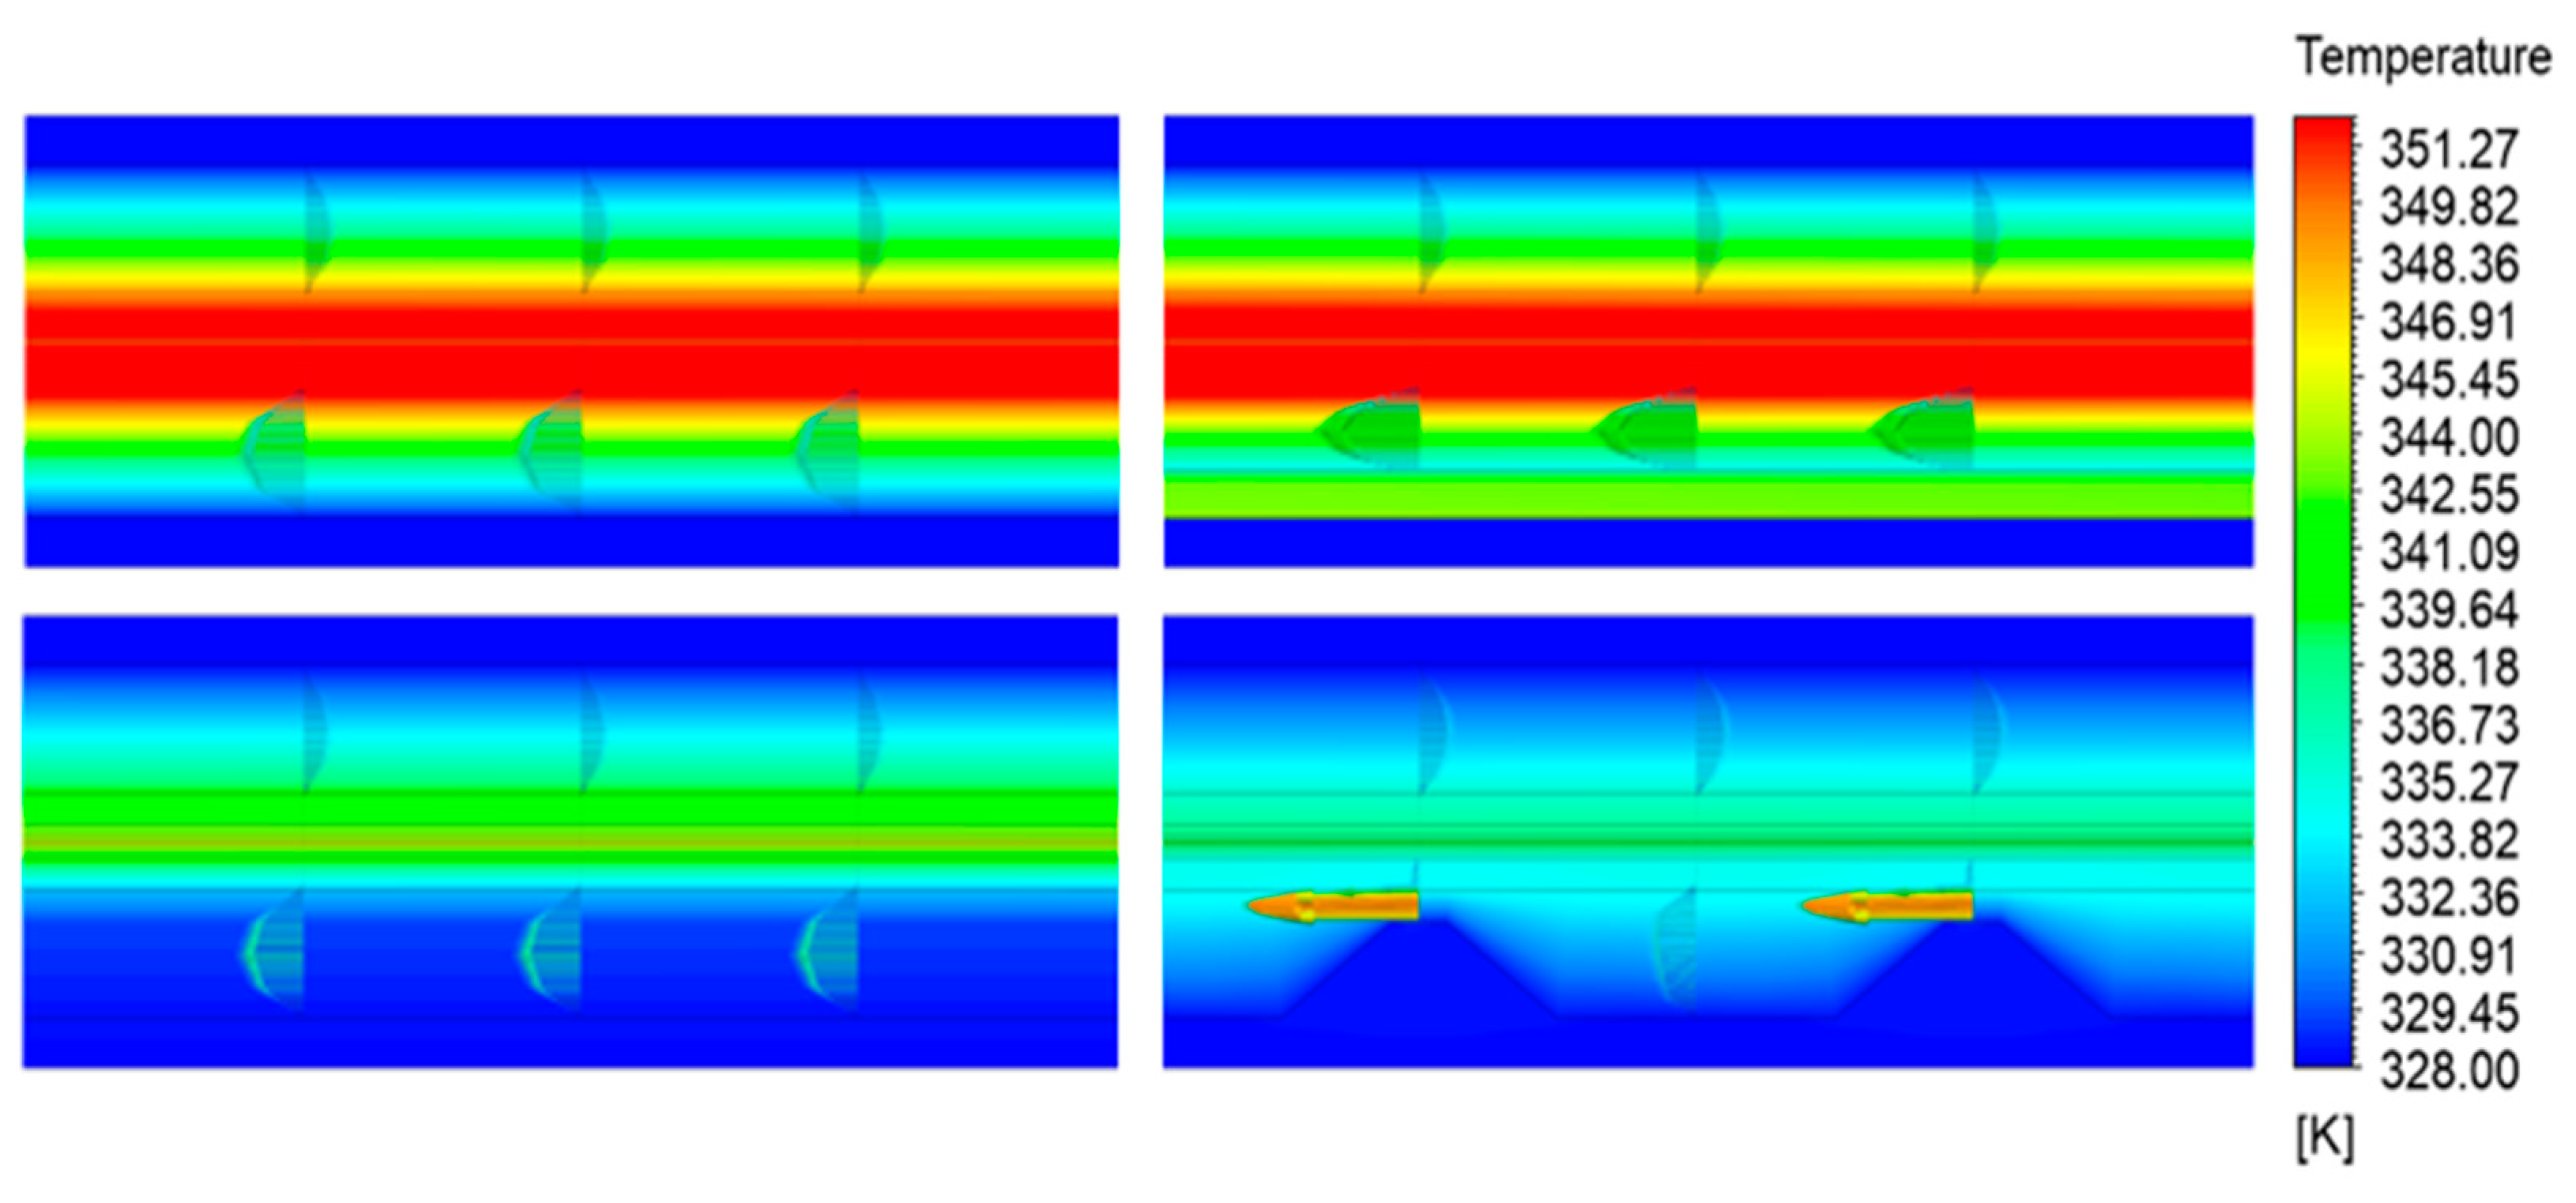
Figure 3 shows the temperature profiles of the four studied cases at 4.0 A·cm−2. It can be seen that the average temperature of the conventional and biporous channels is approximately 355 K (in the figure the results are capped at 351.27 K to show higher contrast for all cases), while those of the porous channel and porous and baffled channel are approximately 342 and 338 K, respectively. It is clear from Figure 3 that the temperature distributions are inhomogeneous, with an average temperature difference of 27 °C for the conventional and biporous channels and 14 and 10 °C for the porous channel and porous and baffled channel, respectively (as shown in Figure S3 in the Supplementary Materials). In addition, velocity vectors are used to annotate the flow direction and velocity magnitudes. It can easily be observed that the fluid velocity at the anode side is much lower than that at the cathode side. For conventional and biporous channels, it is noted that the temperature distribution along the cell height is highly inhomogeneous, while relatively homogeneous temperature profiles are achieved along the axial direction. The maximum temperatures are observed in the cathode CLs, and the temperature contours are monotonically distributed along the flow directions, indicating that convective mixing is absent in the CLs. The porous channel shows significantly lower temperatures owing to the enhanced heat transfer from the GDL to the current collector plate. The porous and baffled channel shows a more uniform temperature distribution along the cell height, especially on the cathode side, owing to the enhanced mixing of the fluid in the downstream direction initiated by the Forchheimer inertial effect. It is also observed in this case that the velocity vectors inside the cathode GDL are most prominent, indicating that the water removal should also be higher.
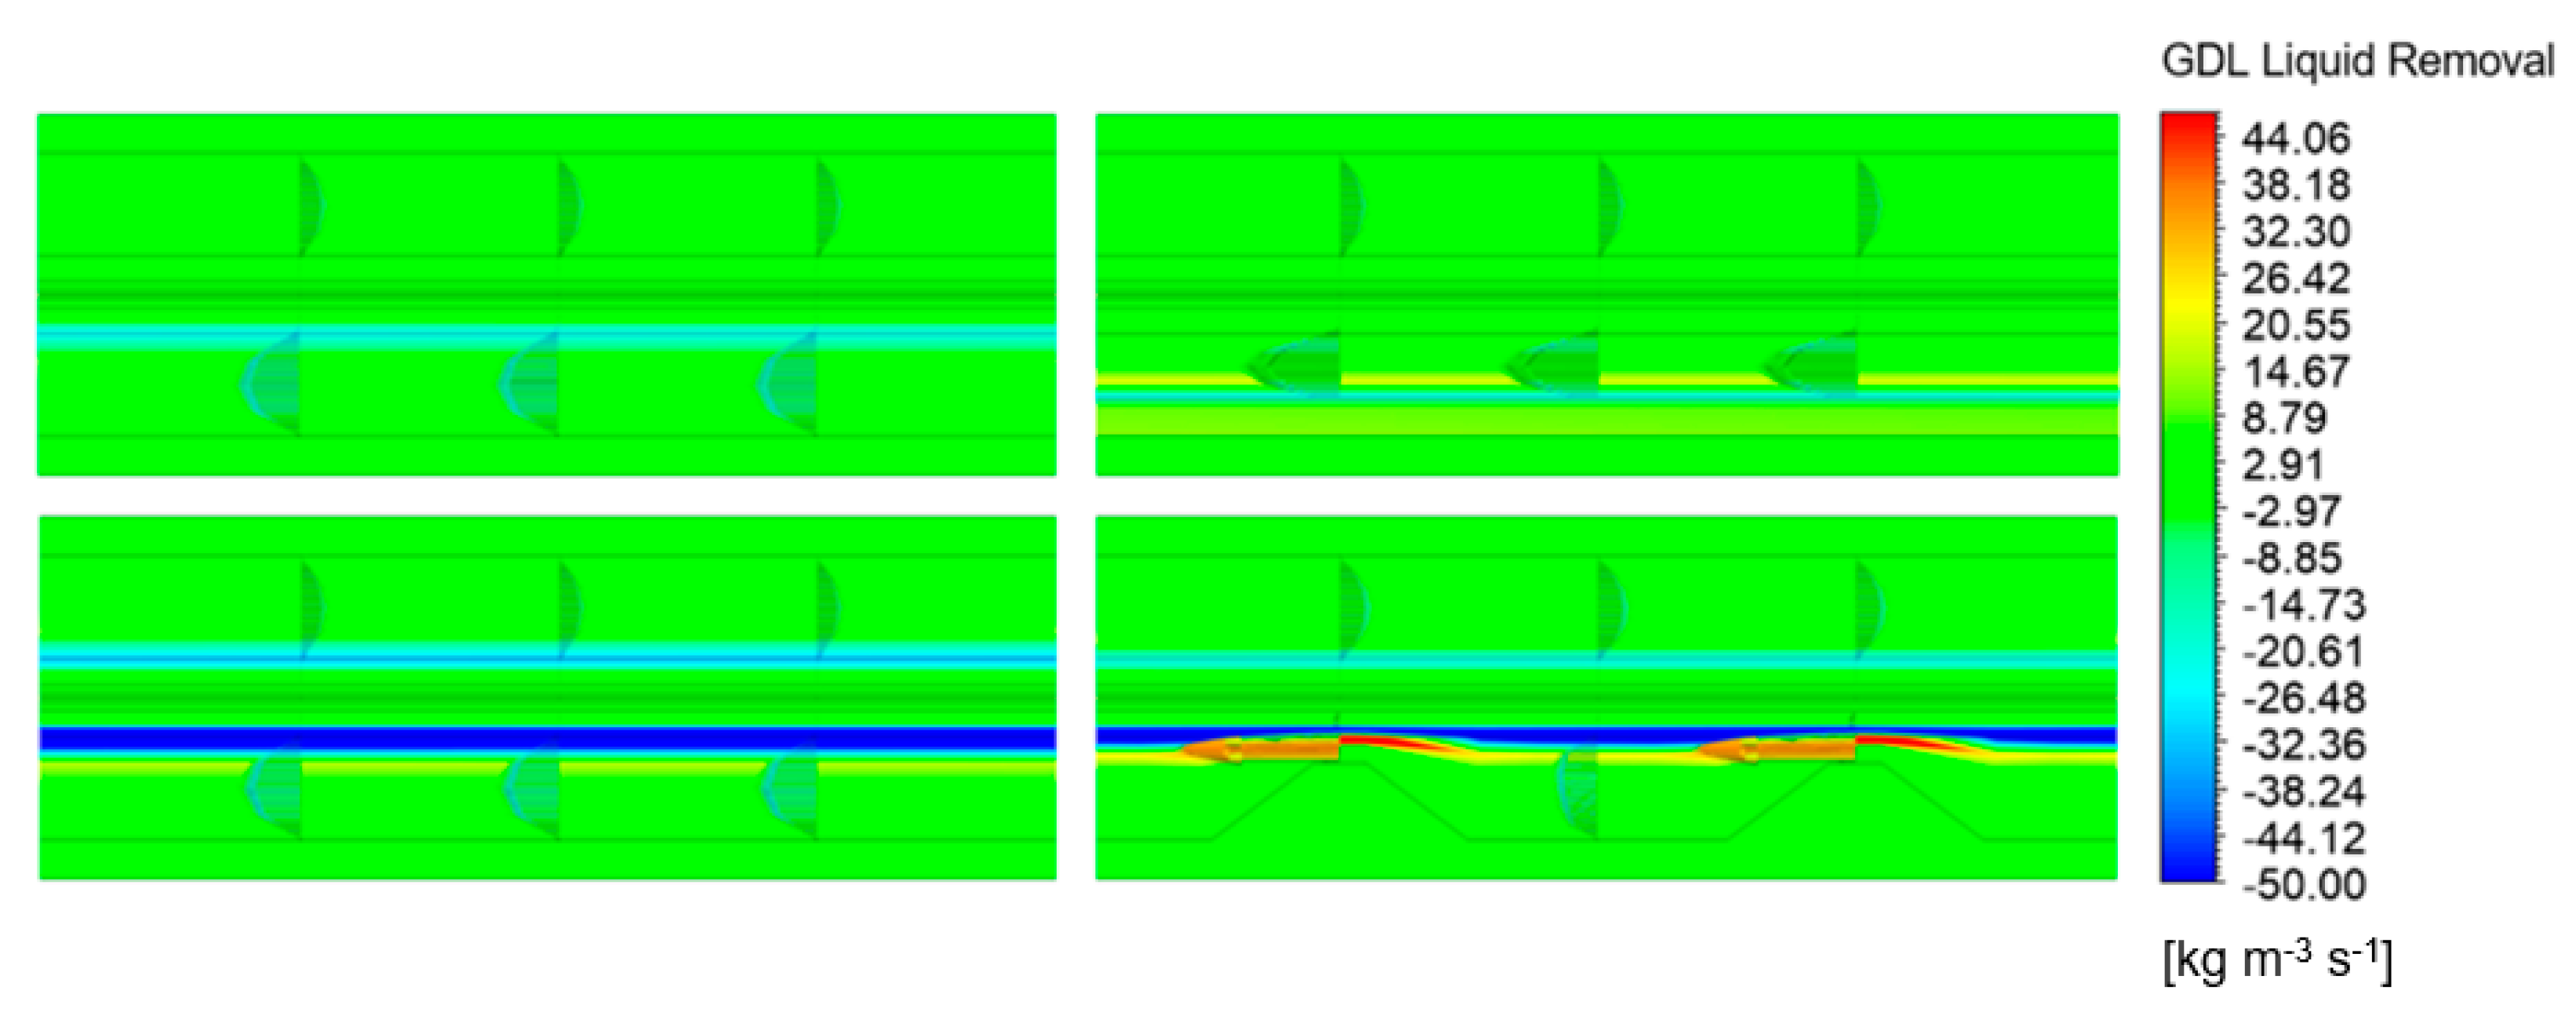
The contours of the GDL liquid water removal rates are shown in Figure 4, in which the blue and red colors indicate the liquid water accumulation and removal rates, respectively. It can be seen that a very small amount of water condenses on the GDL–channel interface in the conventional channel, and liquid water accumulates inside the secondary porous layer of the biporous channel design. Moreover, the water phase change occurs at the interface between the biporous layer and the channel. For the porous channel, significant amounts of liquid water accumulate inside the GDL substrate, forming a homogeneous pool of water inside the substrate, which minimizes the oxygen concentration in the GDL. For the porous and baffled channel, the situation is somewhat similar to that of the porous channel, with the main difference observed under the baffles, where regions of intensive liquid water removal are observed. It is important to note that large quantities of liquid water are present in the GDL substrate of the porous channel and porous and baffled channel due to the lower temperature inside the cell, as seen previously in Figure 3. As the water vapor saturation pressure is heavily temperature-dependent, a large amount of liquid water exists in the gaseous phase at high temperatures, which increases the water carrying capacity (WCC) of the gas mixture [41,42].
The temperature profiles in Figure 3 and the liquid water removal contours in Figure 4 indicate that the low thermal conductivity of the graphite bipolar plates leads to a relatively high temperature inside the cell. Higher temperatures increase the catalyst activity and reduce the amount of liquid water owing to the increase in the WCC of the gas mixture at higher temperatures, which should yield better performance of the cell operated with conventional and biporous channels. However, the cell performance of the conventional and biporous channels is not the maximum, as shown in 
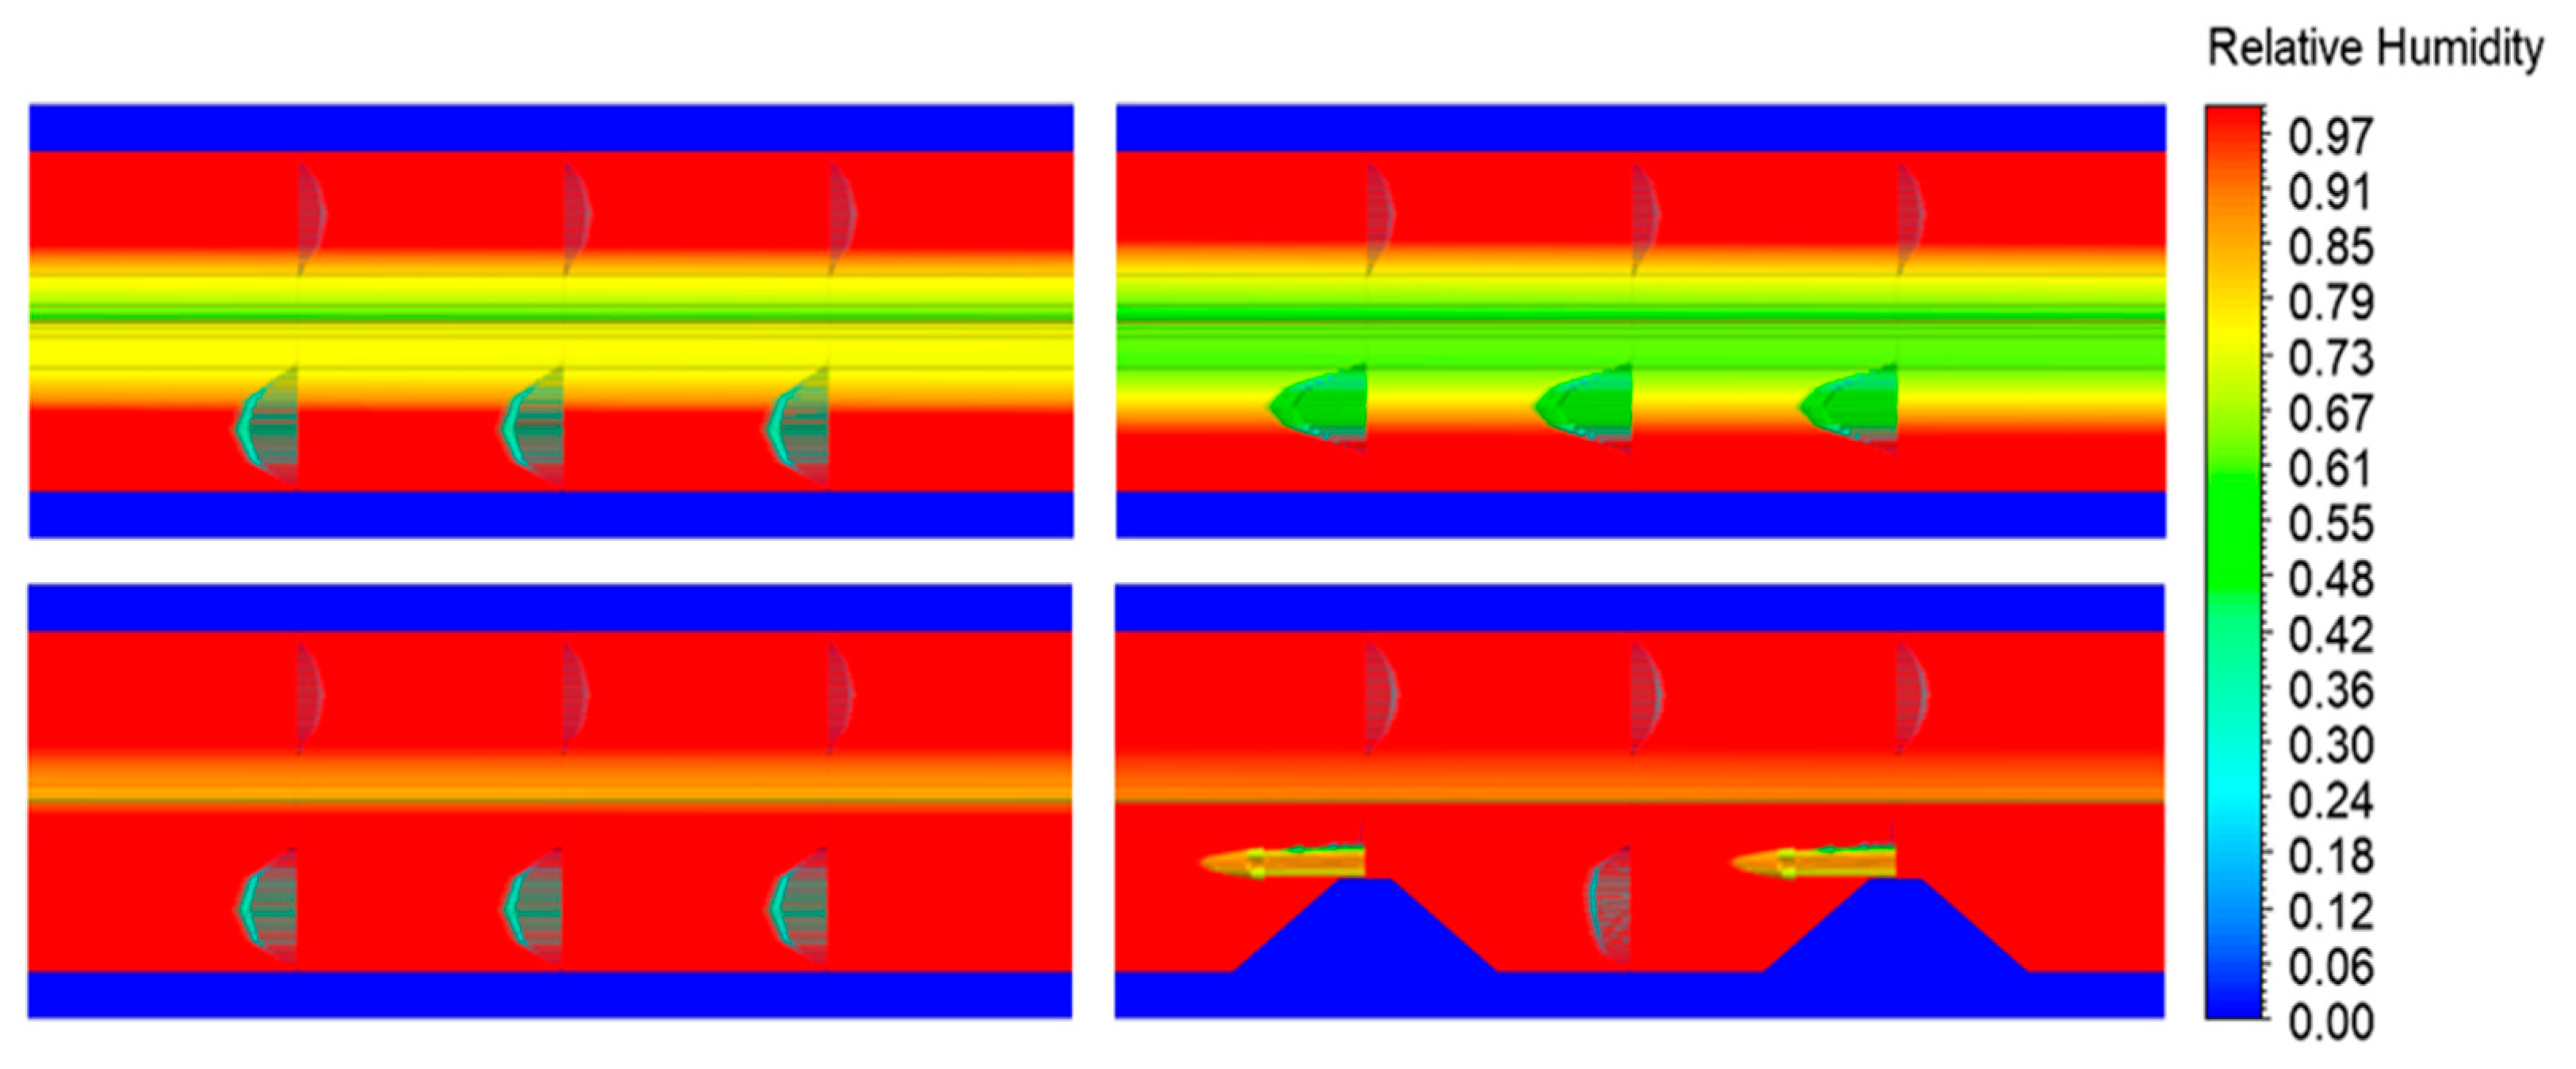
Figure 2. Thus, the relative humidity of the gas and liquid saturation in the porous electrodes and channels of different channel designs are investigated. The relative humidity contours for all cases are shown in Figure 5. It is clear that even though the reactants are fully saturated at the inlets (100% relative humidity at 55 °C), the relative humidity is significantly lower in the GDLs and CLs owing to the increase in temperature (as seen previously in Figure 3). Although considerable water is generated via the oxygen reduction reaction at high current densities, e.g., 4.0 A·cm−2, the high temperatures lead to a significant increase in the vapor saturation pressure, potentially leaving the membrane dehydrated (see Figure S4 in the Supplementary Materials) and diluting the oxygen mole fraction.
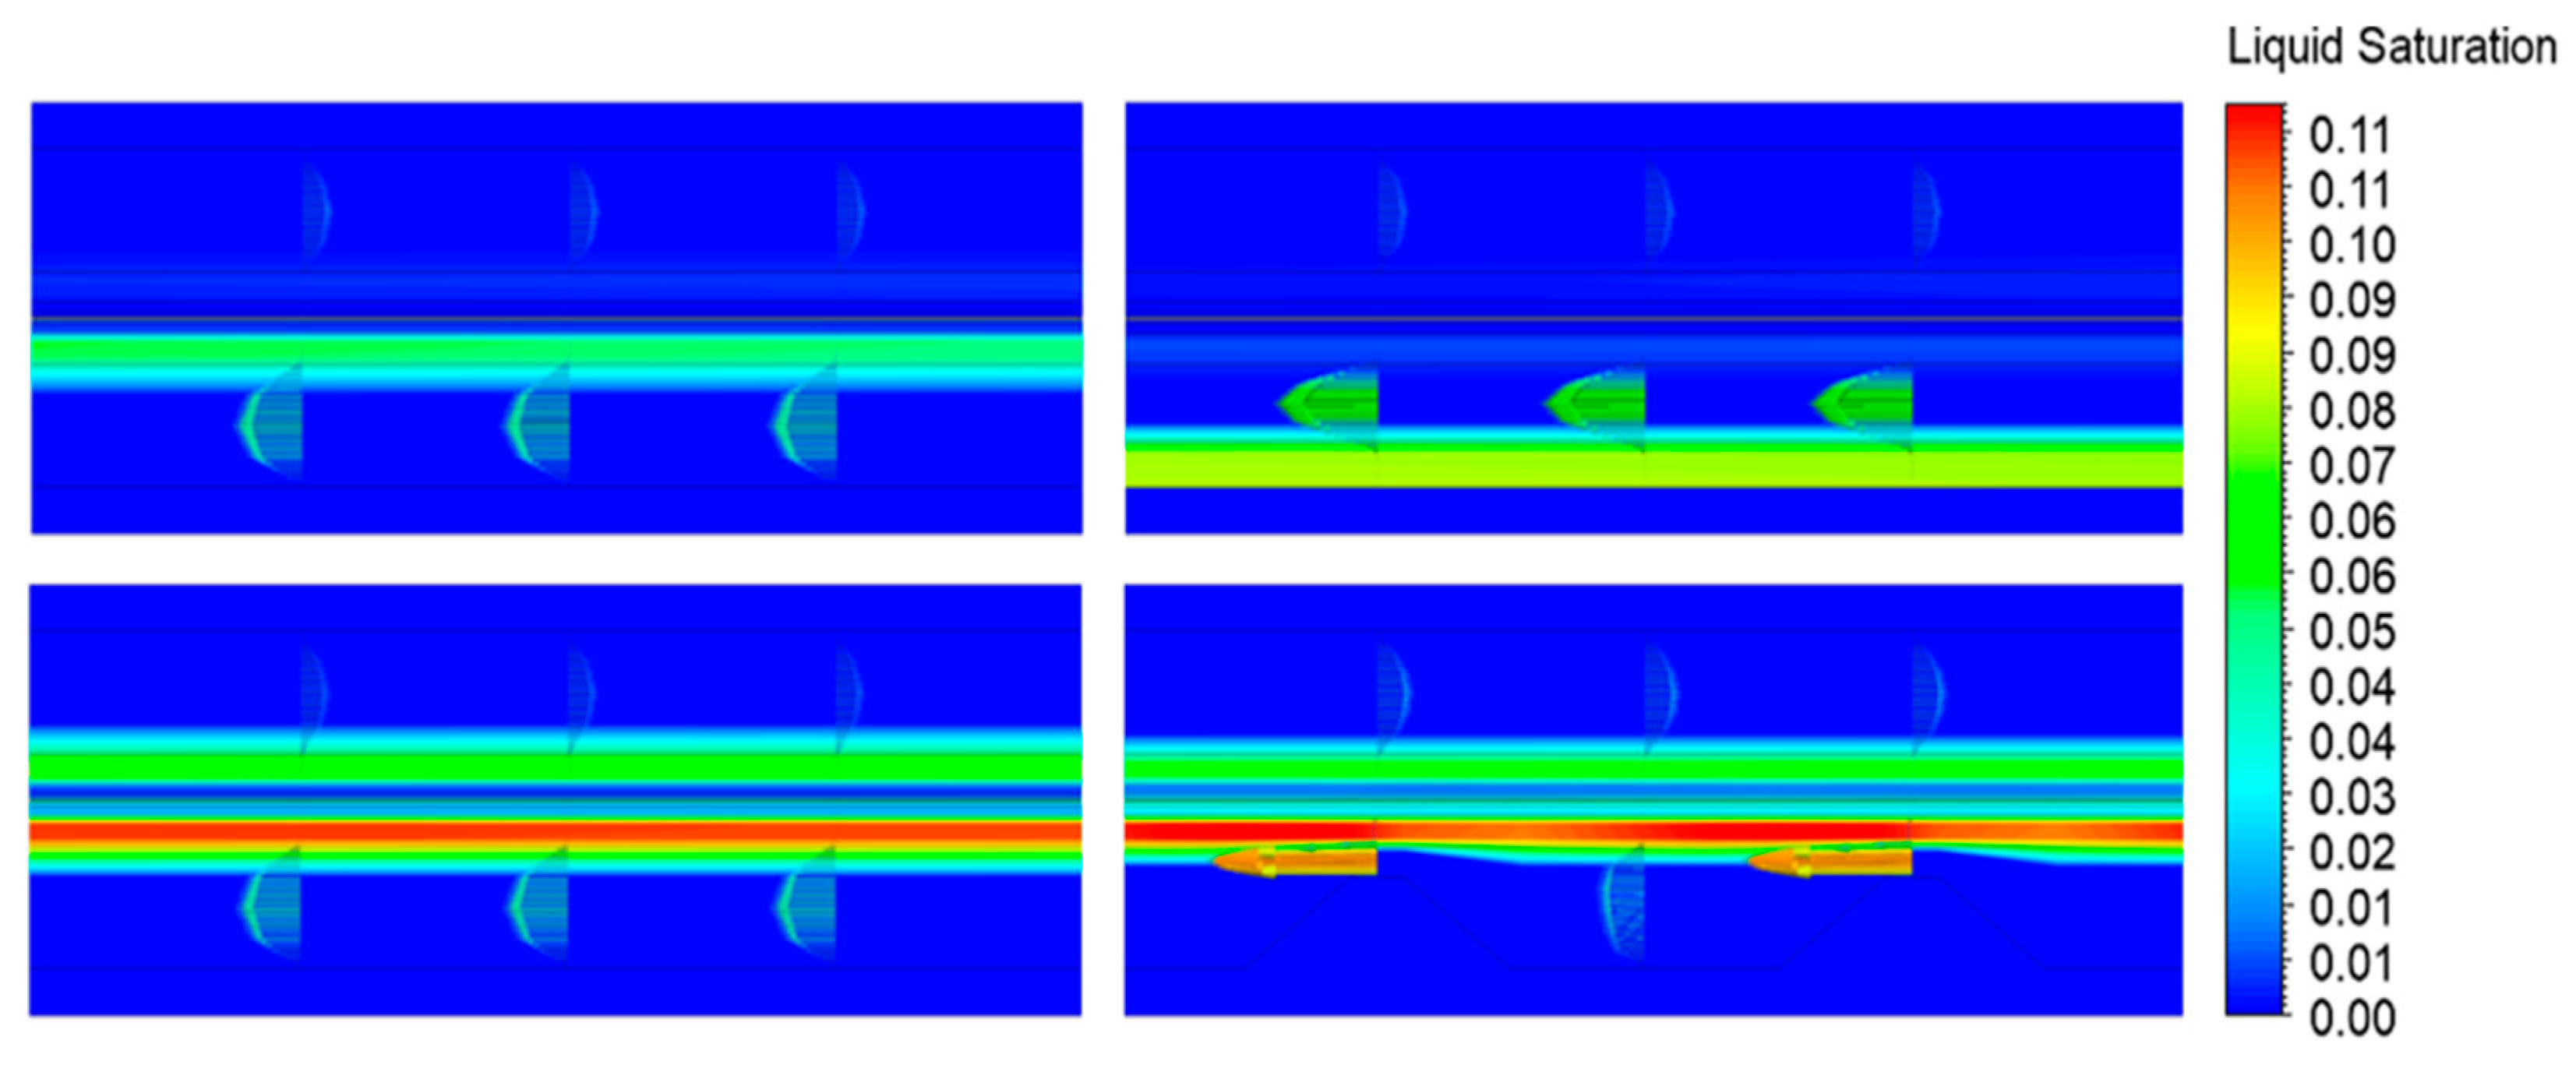
The liquid water saturation profiles for all the studied cases are shown in Figure 6. It can be observed that for the conventional and biporous layer channels, the water saturation inside the cathode GDLs and CLs is low. Simultaneously, the water saturation at the anode side is also low, indicating a relatively dry membrane and ionomer, as shown in Figure S4 in the Supplementary Materials. For the porous channel and porous and baffled channel, the water saturation contours show higher amounts of liquid water present in the cell owing to the lower overall temperatures. However, the amount of liquid water inside the CLs is relatively low, indicating that the generated water tends to accumulate inside the substrate and be expelled to the channel through evaporation and convection under the drag force induced by the reactant flow along the downstream direction.
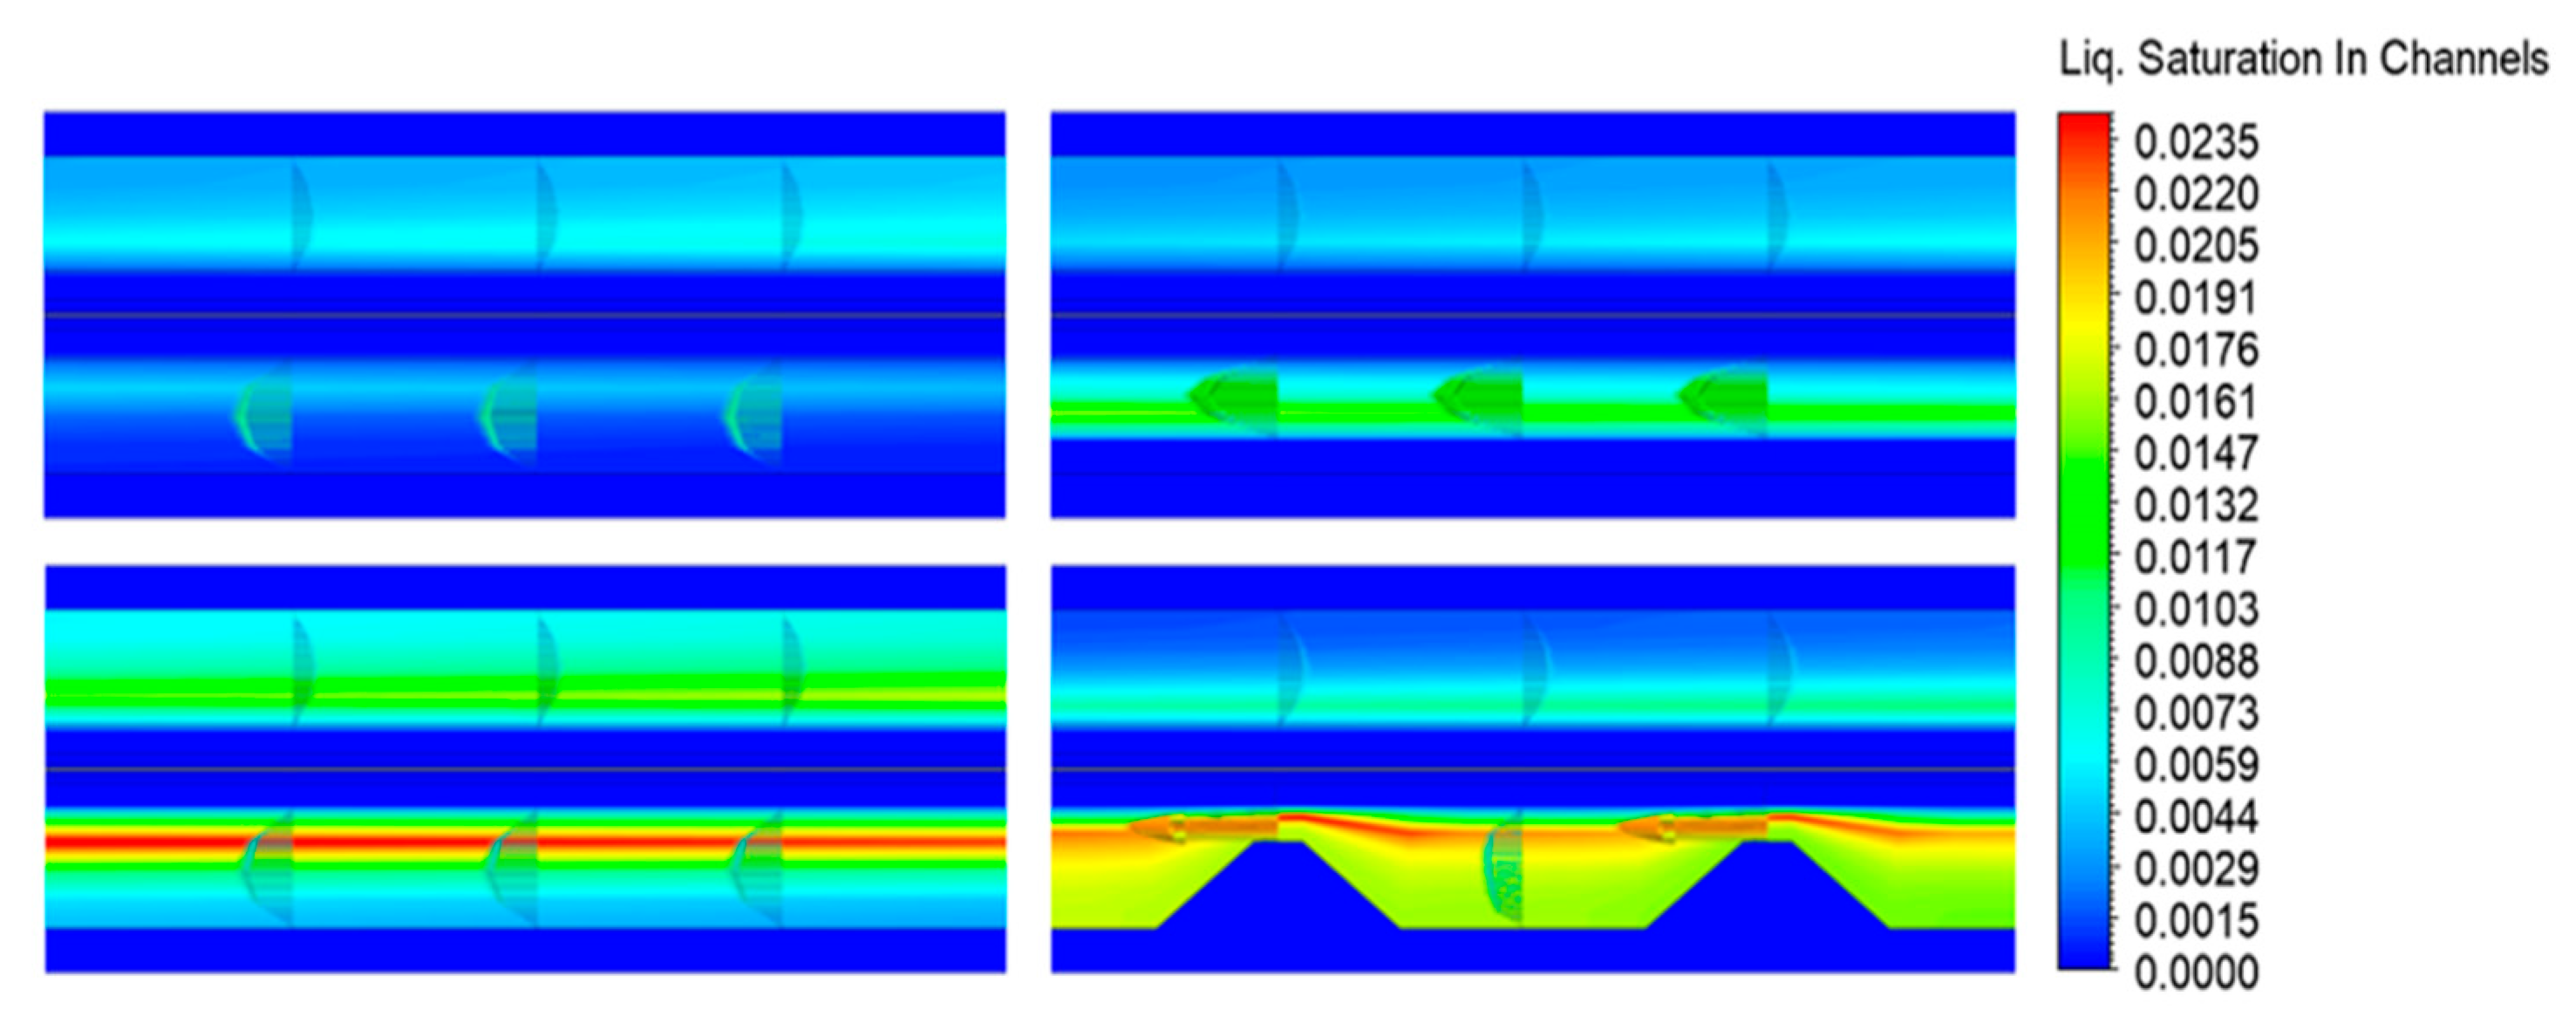
The liquid saturation profiles inside the channels are shown in Figure 7. It can be seen that liquid water is transported outside the substrate via the reactant channels, while the worst case appears to be the conventional channel, as indicated by its worst performance in Figure 2. For the cell operated with a porous and baffled channel, owing to the reduced cross-sectional area under the baffles, the highest liquid saturation is evident in the regions between the baffles and the GDL substrate, while the remaining cathode channel presents a homogeneous liquid saturation distribution. The porous channel also shows a pronounced region where the liquid saturation is predominant in close proximity to the substrate surface. However, the reason for this pronounced zone is not the highest flow velocity but rather the relatively high temperature gradient, as seen previously in Figure 3. Because of the absence of obstacles, mixing along the cell height direction is not prominent, potentially leading to the accumulation of large quantities of liquid water in this region of the porous domain and hindering the performance of the cell.
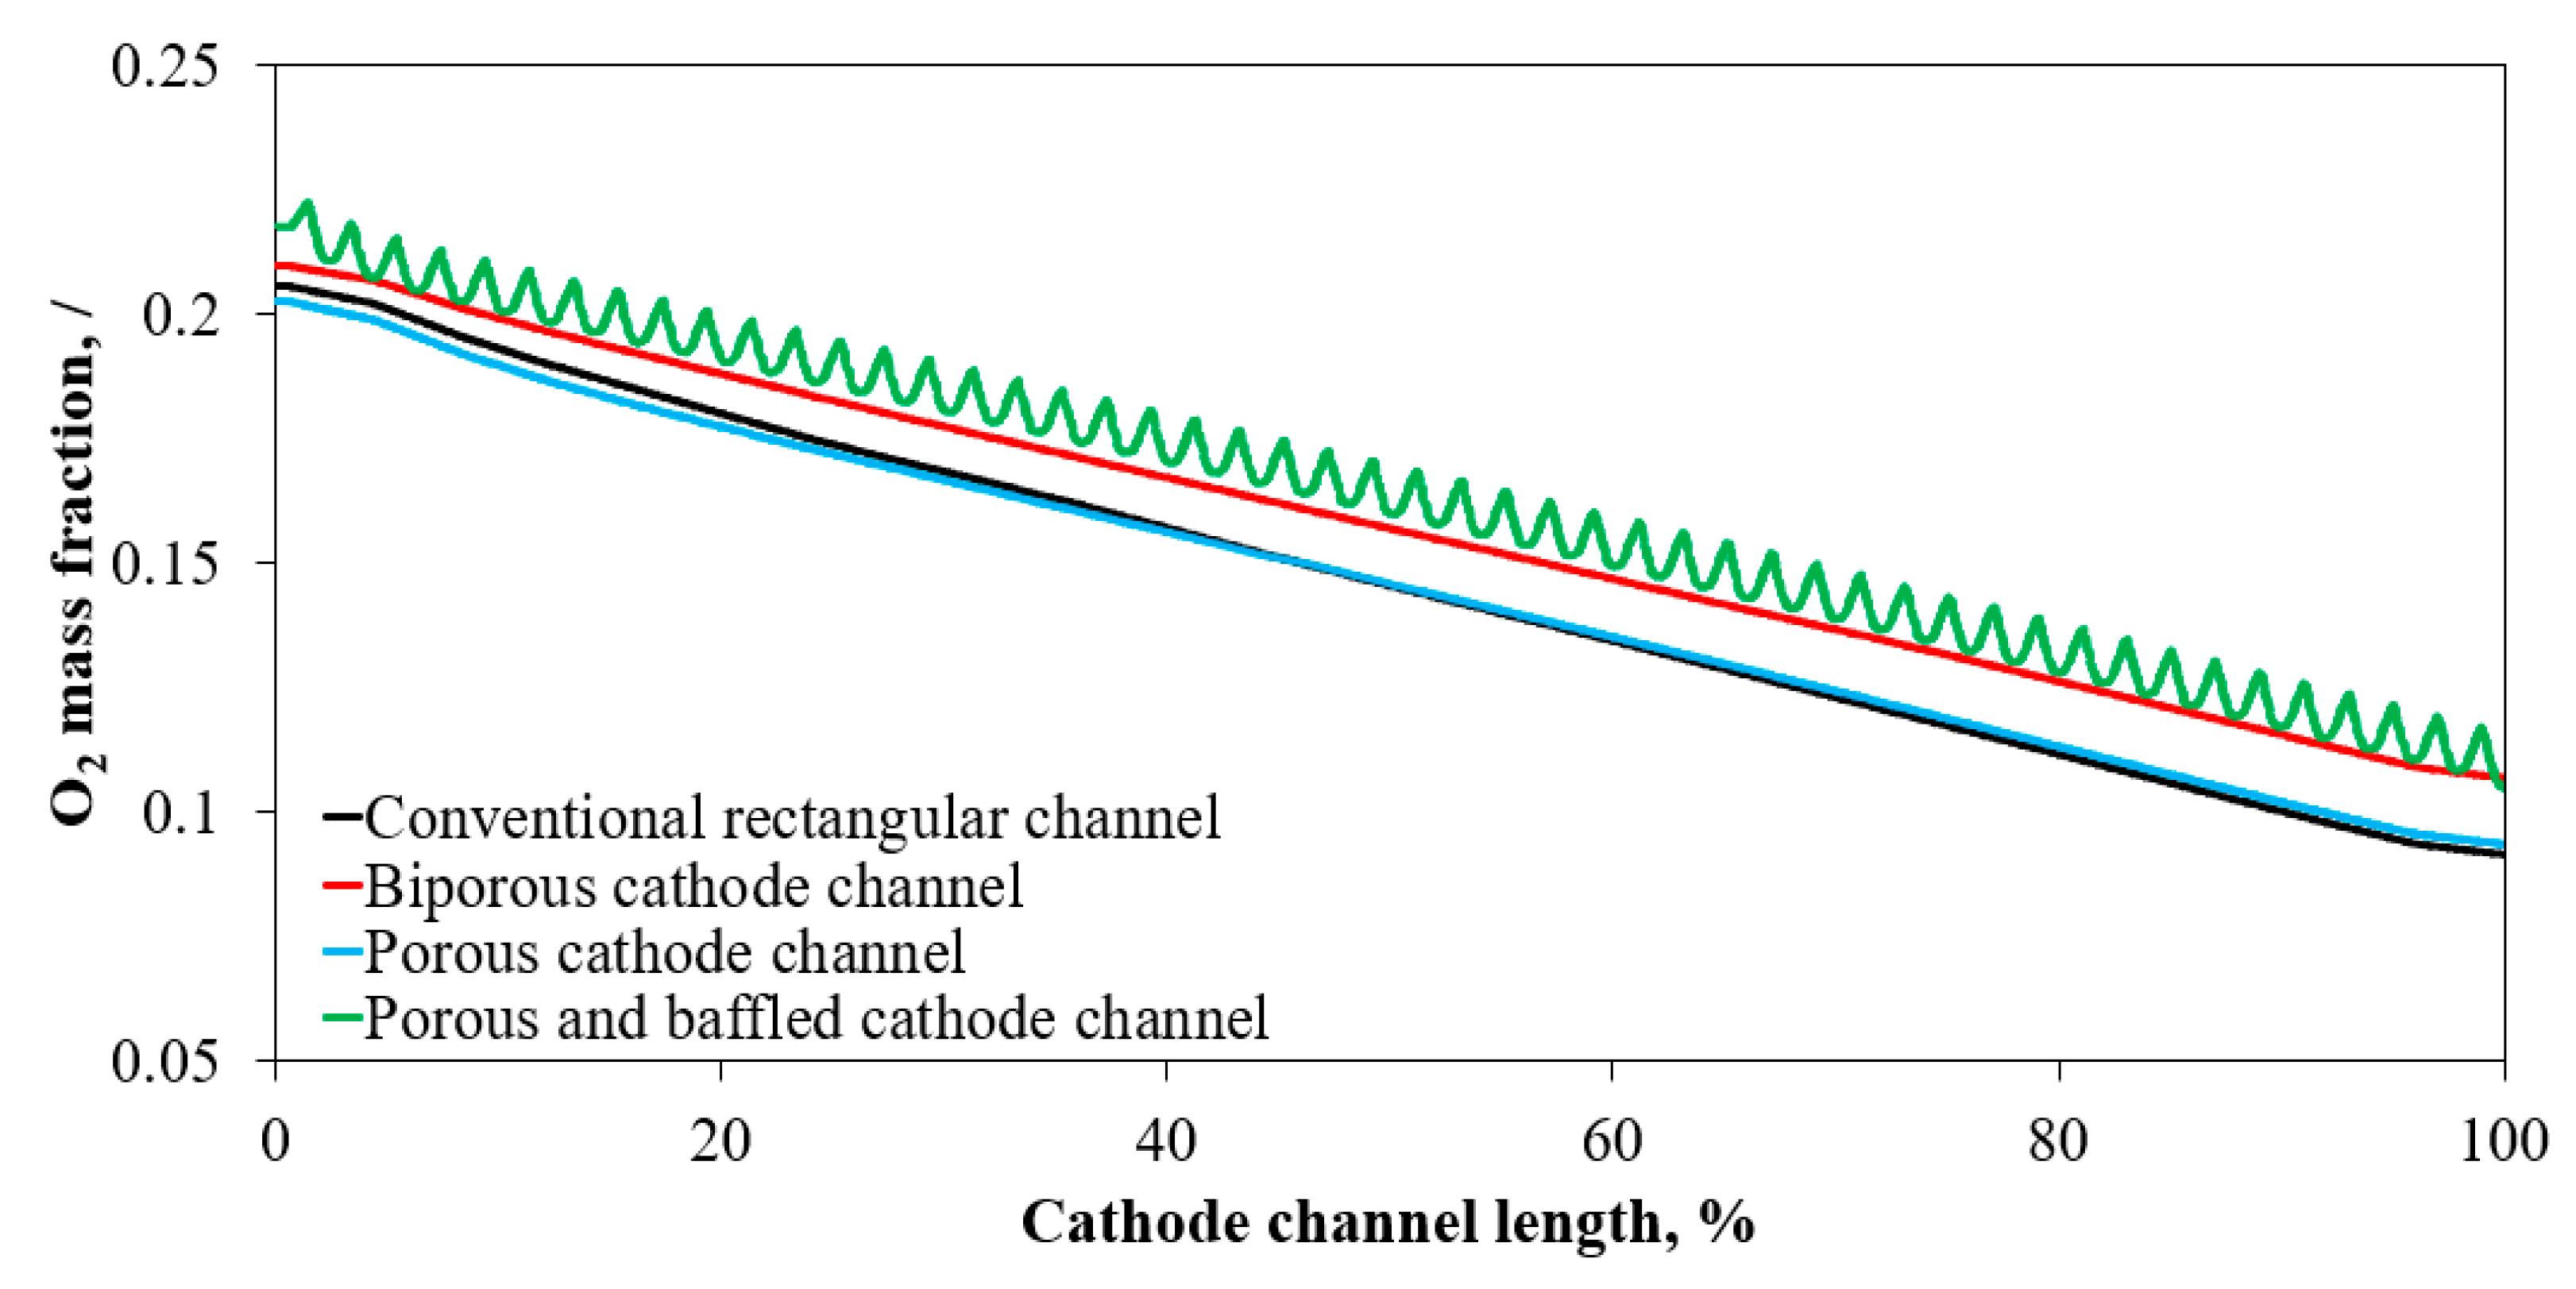
The influence of water and heat management on the mass transport losses can be investigated by comparing the oxygen mass fractions inside the cathode substrate layer. In Figure 8, it is observed that the oxygen mass fraction is highest in the cases of the porous and baffled cathode channel and biporous channel. The results shown in Figure 8 are in partial agreement with the polarisation curves in Figure 2, where the highest performance is evident for the porous and baffled cathode channel. However, the biporous cathode channel in Figure 2 shows slightly lower performance compared with the porous cathode channel. In addition, it is worth investigating the oxygen mass fraction contours along the cell height mid-plane to determine why better cell performance is achieved in the porous channel rather than the biporous channel.
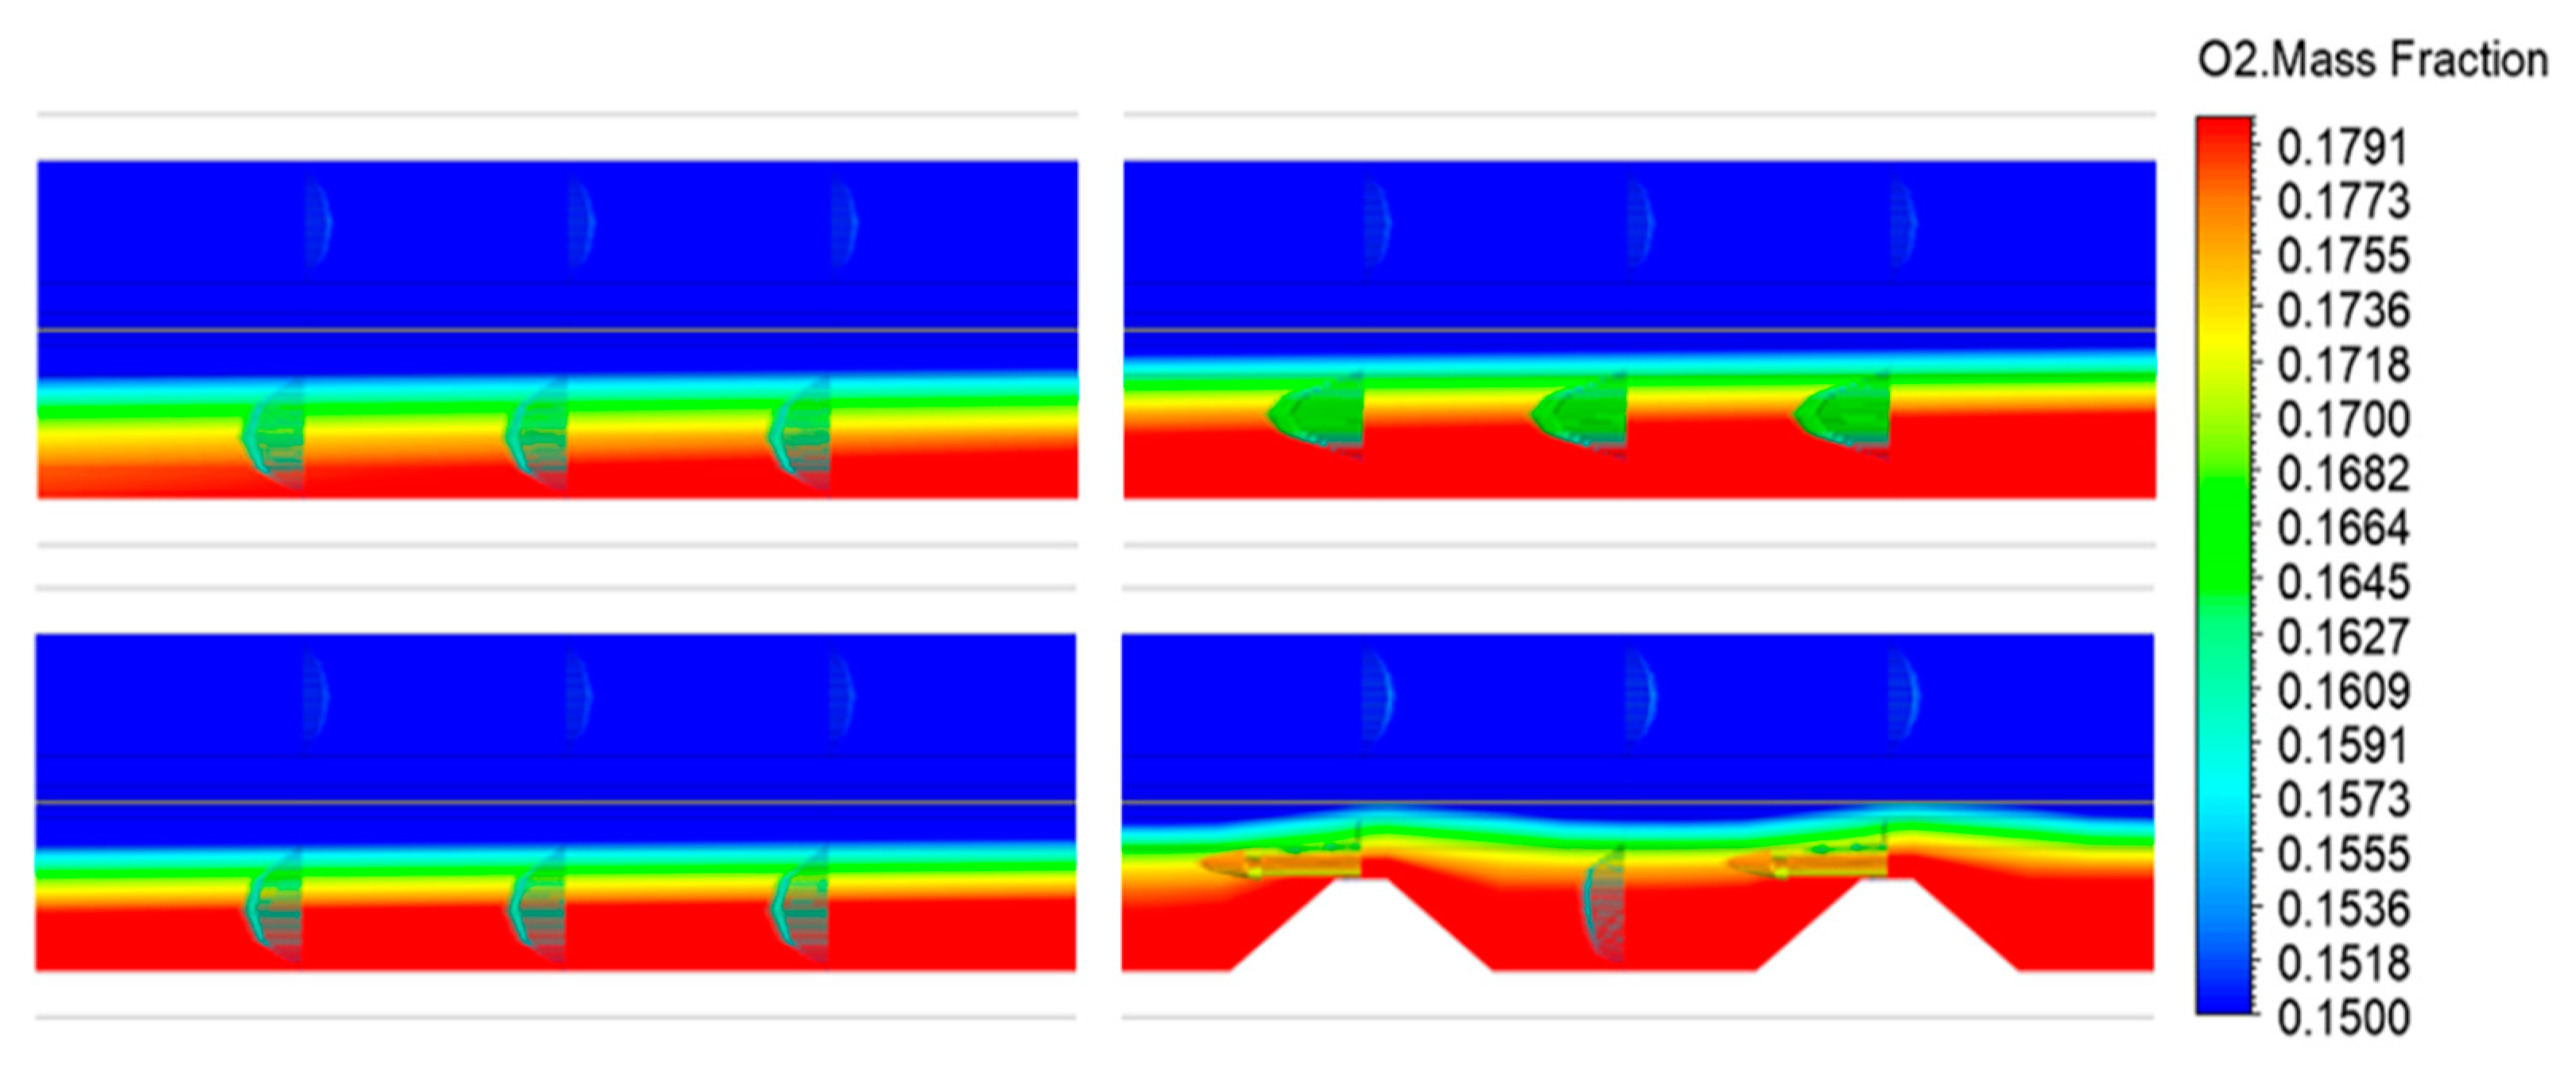
As shown in Figure 9, the porous and baffled cathode channel and biporous channel deliver the highest oxygen mass fractions inside the cathode CL, which is a consequence of their high velocity magnitudes resulting from the restricted cross-sectional area and increased viscous resistance. In other words, this is due to the sharp reduction of the cross-section and the flow redistribution along the cell height, which are attributed to the baffles and porous layers, respectively. Because the permeability of the biporous layer is approximately 200× lower than that of the channel, the flow resistance in the biporous layer is higher, causing uneven flow distribution and an overall higher average velocity inside the remaining portion of the channel and cathode substrate layer. In Figure 9, the oxygen mass fraction contours are not shown across the current collectors and the membrane. This is because the current collectors and membrane are defined as solid bodies (which is a requirement during the setup of the model), while the remaining domains are defined as fluid bodies. For this reason, mass fraction values are unavailable for the solid components. Even though the porous layer case in Figure 2 shows slightly higher performance, for a complex flow field with more channels, the porous channel case would be prone to flooding owing to the non-existence of mixing in the channel height direction. For this reason, the biporous layer case is better because it drives the reactant gases in the GDL, which promotes liquid water removal even at lower mass flow rates.
Finally, the total pressure drop due to the introduction of porous layers and baffles is summarised in Table 6. As expected, the pressure drops of the biporous channel and porous and baffled channel are much higher than those of the other two cases. Interestingly, the use of the porous channel results in a very similar pressure drop to that of the conventional channel, indicating that the baffles have a major influence on the total pressure drop of the cell.
Although the cases with baffles and porous layers show significantly improved performance, the high pressure drop results in a higher energy requirement of the air compressor. Based on the above discussion, there is a significant potential for optimization of the baffle geometry to achieve even higher performance. In addition, it may be possible to remove the porous layers to decrease the complexity required in manufacturing such a flow field, which is investigated in the following section.

6. Influence of Baffle Geometry on PEM Fuel Cell Performance

Optimization of the baffle geometry is based on the geometry used in the previous section; however, the porous layer is excluded, and the total length is reduced from 100 to 16 mm to save computational time.
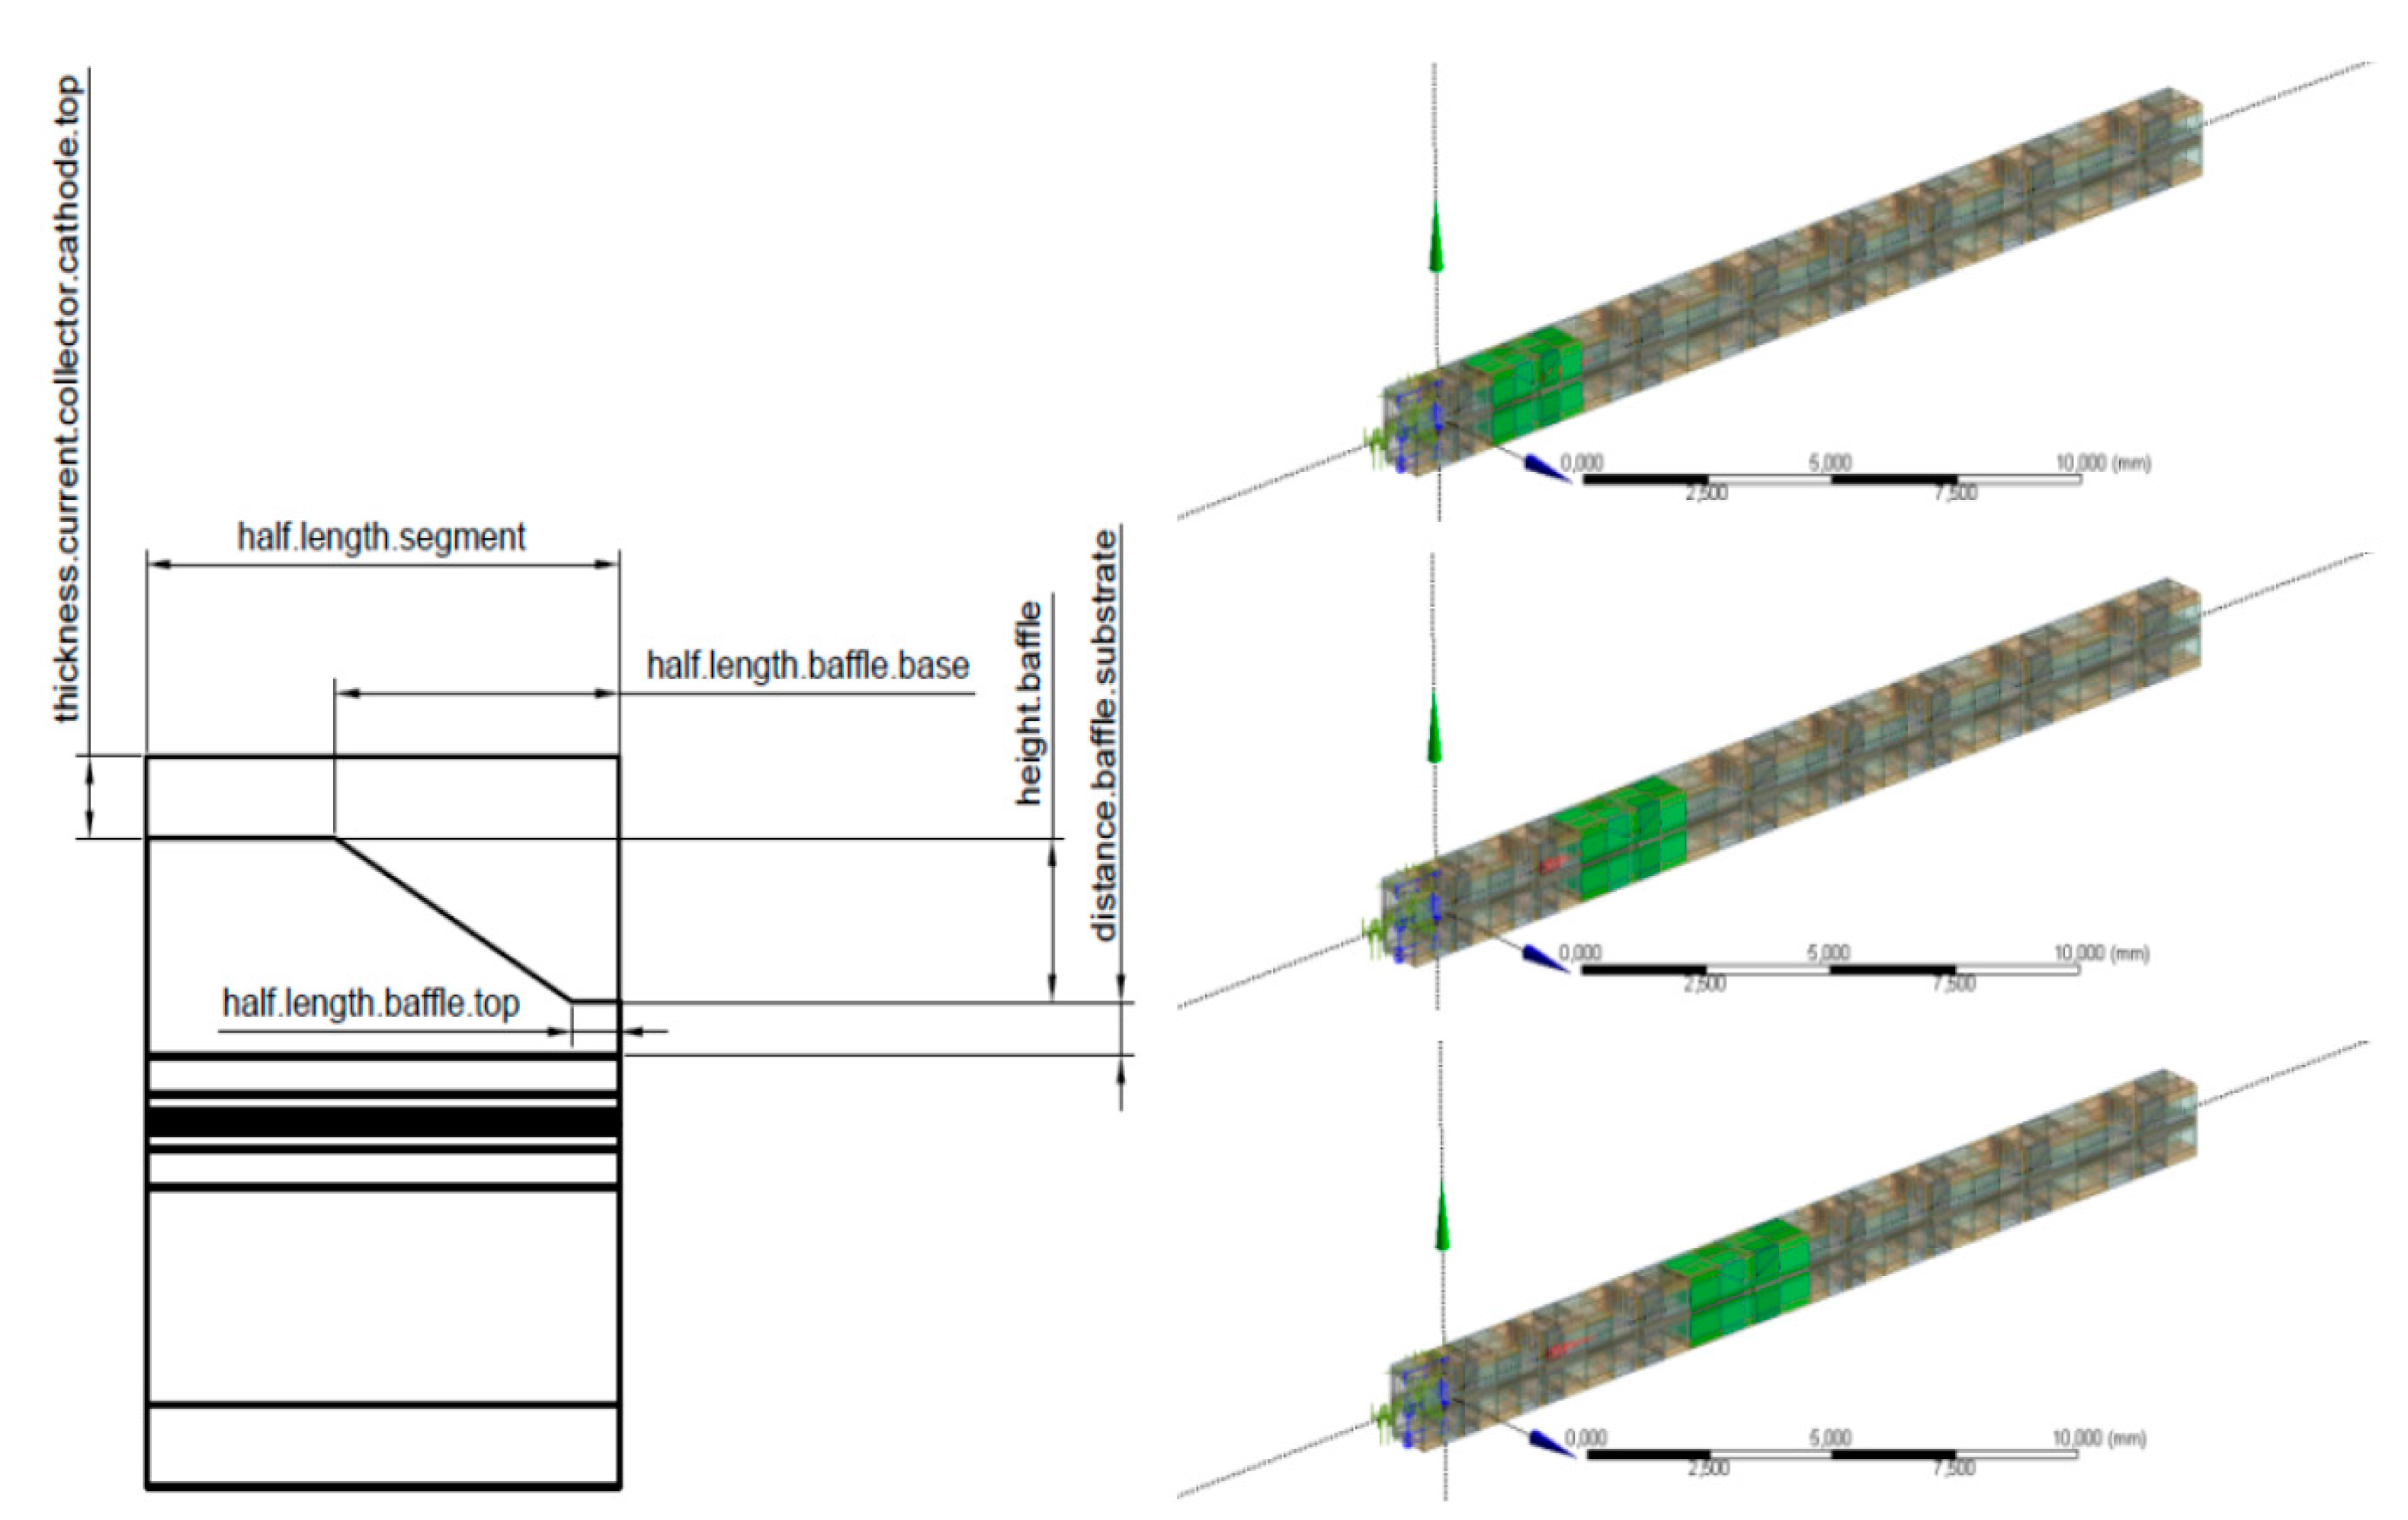
Six characteristic parameters of the geometry are shown in Figure 10 (left), and a total of 49 different scenarios (as listed in Tables S1–S5 in the Supplementary Materials) are considered. Additionally, for the best of the 49 cases, i.e., the case with the highest cell voltage for the specified current density at 4.0 A·cm−2, segments 1, 2, and 3 (as shown in Figure 10 (right)) are also parameterized with a scaling factor in the axial (i.e., downstream) direction, and seven cases are considered to determine if the scaling factors have a significant influence on the results. The scaling factor represents the parameter by which the length of a segment is altered. If the initial length is 10 mm and the scaling factor is 1.2, the final length will then be 12 mm. During the investigation of the influence of the scaling factors on the cell performance, the channel length of the first segment is fixed; segments 2, 3, and 4 vary; and segments 5–8 are generated as a mirror of the first four segments with the mirror plane set at the end of segment 4.
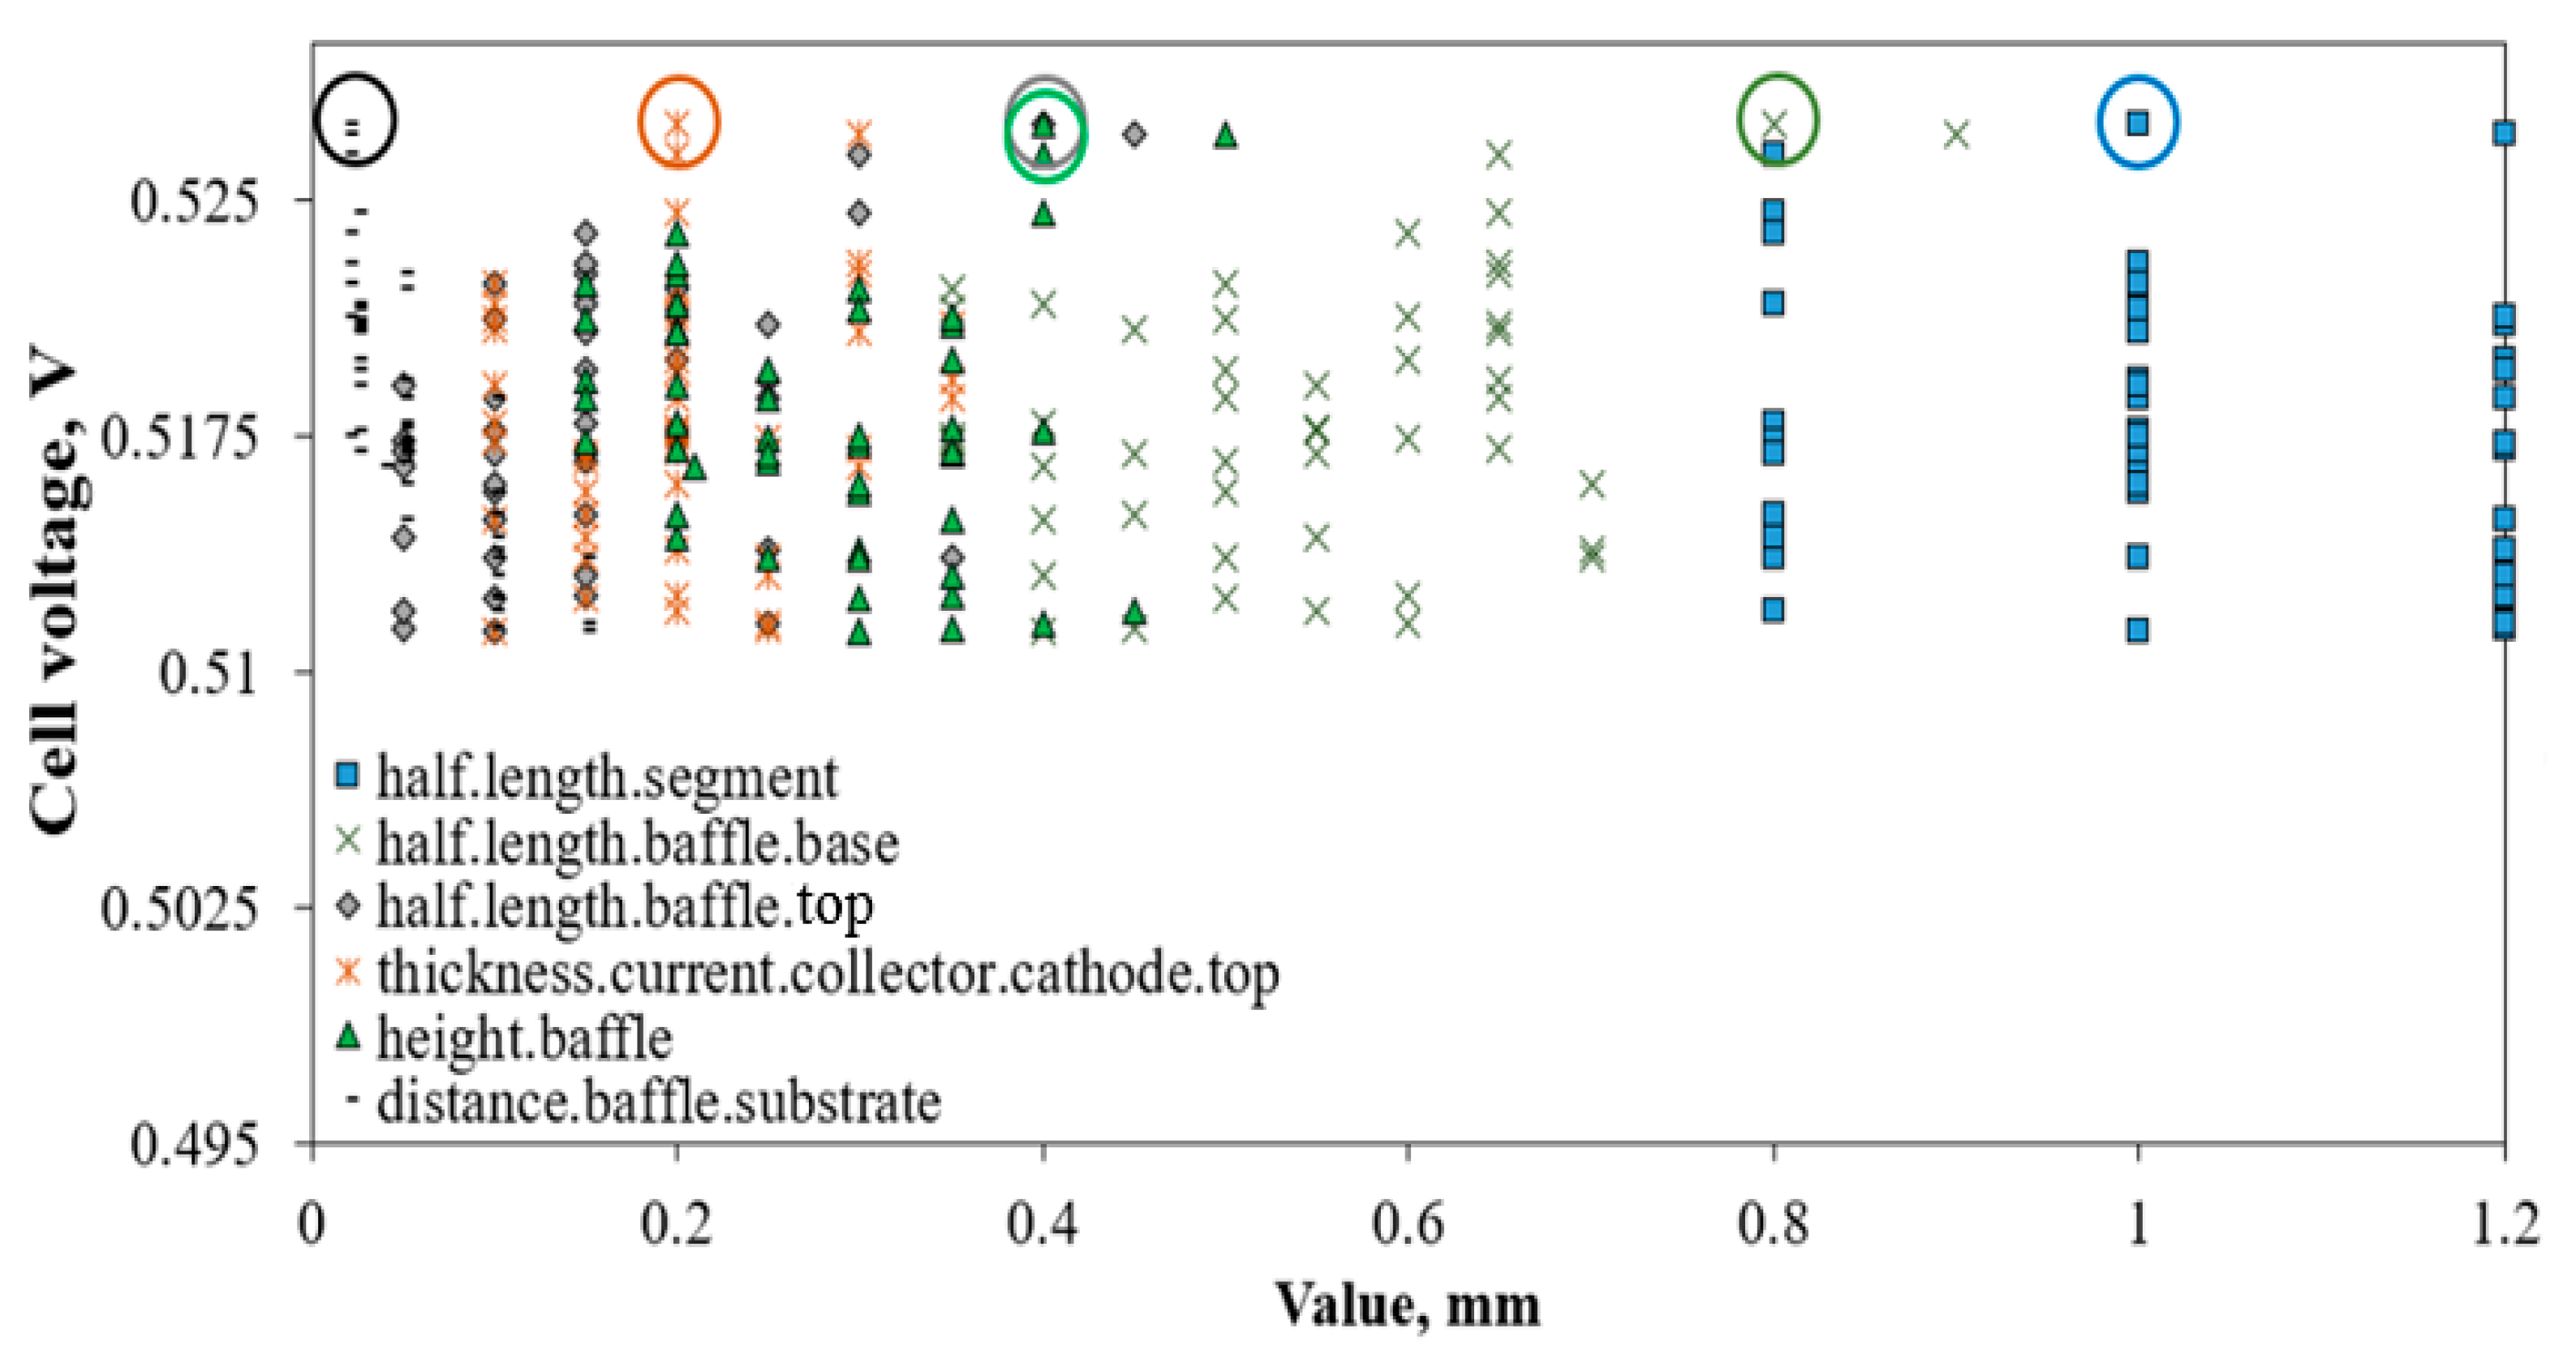
The results of the simulations with six geometric parameters are shown graphically in Figure 11, plotted in terms of the cell voltage at 4.0 A·cm−2 and the geometric parameters. Detailed information about each setup is provided in Tables S1–S5 in the Supplementary Materials. The values of the studied parameters resulting in the highest performance among all cases are outlined by colored circles. The optimal values of the half length of a segment (P1), half-length of the baffle base (P2), half-length of the baffle top (P3), thickness of the current collector cathode top (P4), baffle height (P5), and distance between the baffle and substrate (P6) are 1.0, 0.8, 0.4, 0.2, 0.4, and 0.02 mm, respectively. These optimal values lead to an improvement in the cell voltage from 0.516 (reference case) to 0.527 V (case #45, as indicated in Table S5 of the Supplementary Materials) at 4.0 A·cm2.
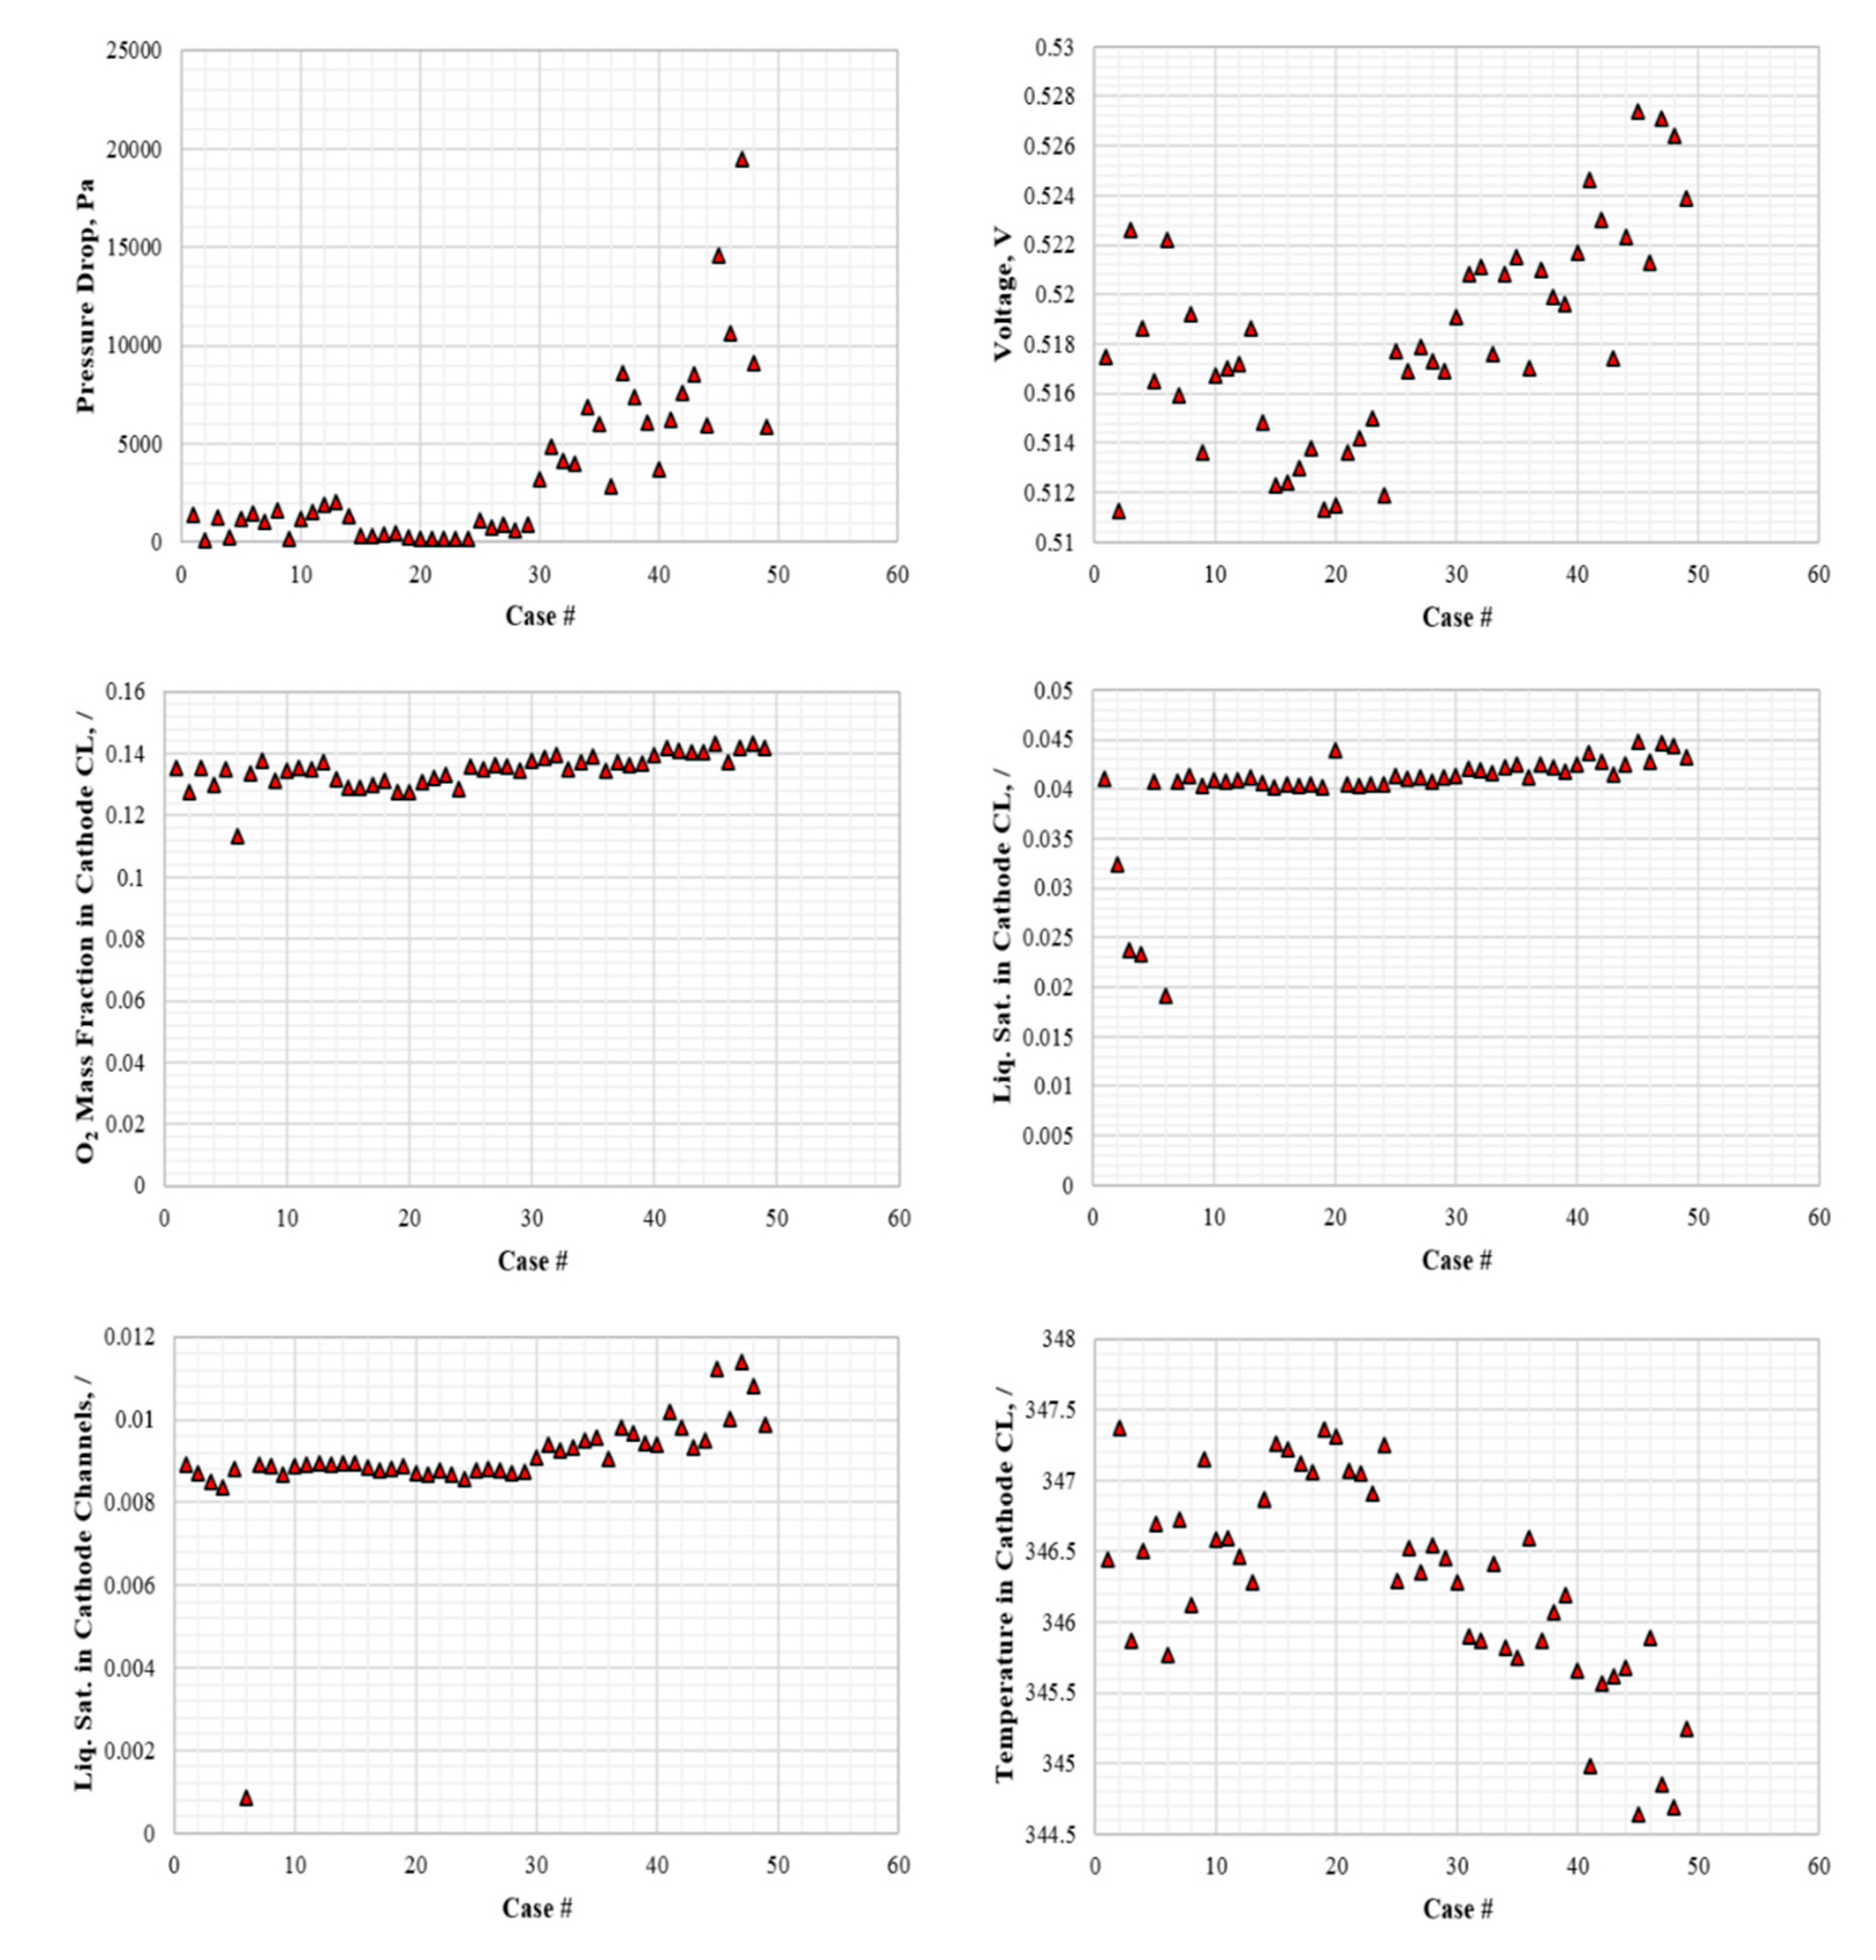
The parameters, which are of interest for PEM fuel cell performance, are shown graphically in Figure 12 and Figure 13, namely: pressure drop along the cathode channel and the operating voltage, the volume averaged values of oxygen mass fraction, liquid saturation, and temperature inside the cathode catalyst layer; as well as the liquid saturation inside the cathode channel. The geometric parameters are shown below for a clear comparison of the influence of each parameter on the results. The results indicate that increasing the (i) baffle top and (ii) baffle base size, (iii) baffle height as well as decreasing the (iv) distance between the baffle bottom and the substrate, resulting in the highest performance of the cell. The combined influence of these parameters leads to conclusions that (a) operating voltage; (b) oxygen mass fraction inside the cathode CL and (c) pressure drop increase, while (d) the temperature inside the cathode CL decreases, by increasing the mentioned geometry parameters. Since the increase in (c) pressure drop is counter-productive, more pumping power is required and there are constraints related to the gaskets, the threshold value for the pressure drop must be set to obtain the optimal results. The remaining geometry parameters (v) half-length segment and (vi) current collector thickness, seem to have less influence on the results since the scattered values have negligible influence on the overall results. It is noteworthy that the pressure drop rises almost exponentially for the cases where the substrate to baffle height is the smallest, indicating the dominant Forchheimer inertial effect, resulting in improved water removal from the diffusion layers and expelling the water to the channel (as indicated by the increase in liquid saturation in channels in Figure 12).
Among all 49 cases, the cases with minimal and maximal values of the parameters of interest and their comparisons vs. the original reference case of Kim et al. [17] are outlined in Table 7. It can be seen from the results that the case with the best overall performance is Case #45 because it results in the lowest liquid saturation and temperature in the cathode CL and gives the highest voltage. It can also be seen that Case #47 has a very high pressure drop, which results in the highest liquid saturation in the cathode channel. It is found that Case #2 has the lowest pressure drop and the lowest voltage, thus making it the least efficient case among the 49 studied cases. Thus, Case #45 is chosen for further optimization using scaling factors.
Case #45 is then used to investigate the influence of scaling factors on the performance of the cell. The results are shown graphically in Figure 14, with a detailed list in Table 8. The results indicate that the cell performance is the highest for the case where the segment length is shortened in the cathode downstream direction to the middle of the channel and then gradually increases.
Although most of the operating parameters, as shown in Table 9, show quite similar values, the pressure drops are very different. From the results, the most favorable values for PEM fuel cell operation are shown bolded in the table. It is seen that Case #45d shows higher operating voltage and lower temperature in cathode CL vs. the reference case #45a. However, since the pressure drop of #45d is almost doubled in contrast with #45a, it is therefore required to compare the cases with the referenced case of Kim et al. [17] to gain insights into the influence of the baffles and scaling factor on the cell performance.
The GDL liquid removal contours for the three cases with different scaling factors are shown in Figure 15. It is clear that the two optimized cases exhibit more pronounced liquid water removal rates under the baffles, and low water saturation zones are repeatedly observed between the baffles owing to the lower mutual distance between each segment.
Case #45d shows interesting zones of more pronounced pooling/GDL liquid removal, which seem to increase along the cathode downstream direction corresponding to the distance between neighboring segments.
As the distance between the baffles and substrate is significantly reduced in the optimized cases, the local flow velocities are significantly increased, leading to an altered heat transfer. In Figure 16, the temperature contours show significant differences between the three cases. The temperature distribution is most uniformly distributed in Case #45, while it is most non-uniform in the reference case, which indicates that optimization of the geometry results in more favorable heat transfer during the PEM fuel cell operation.
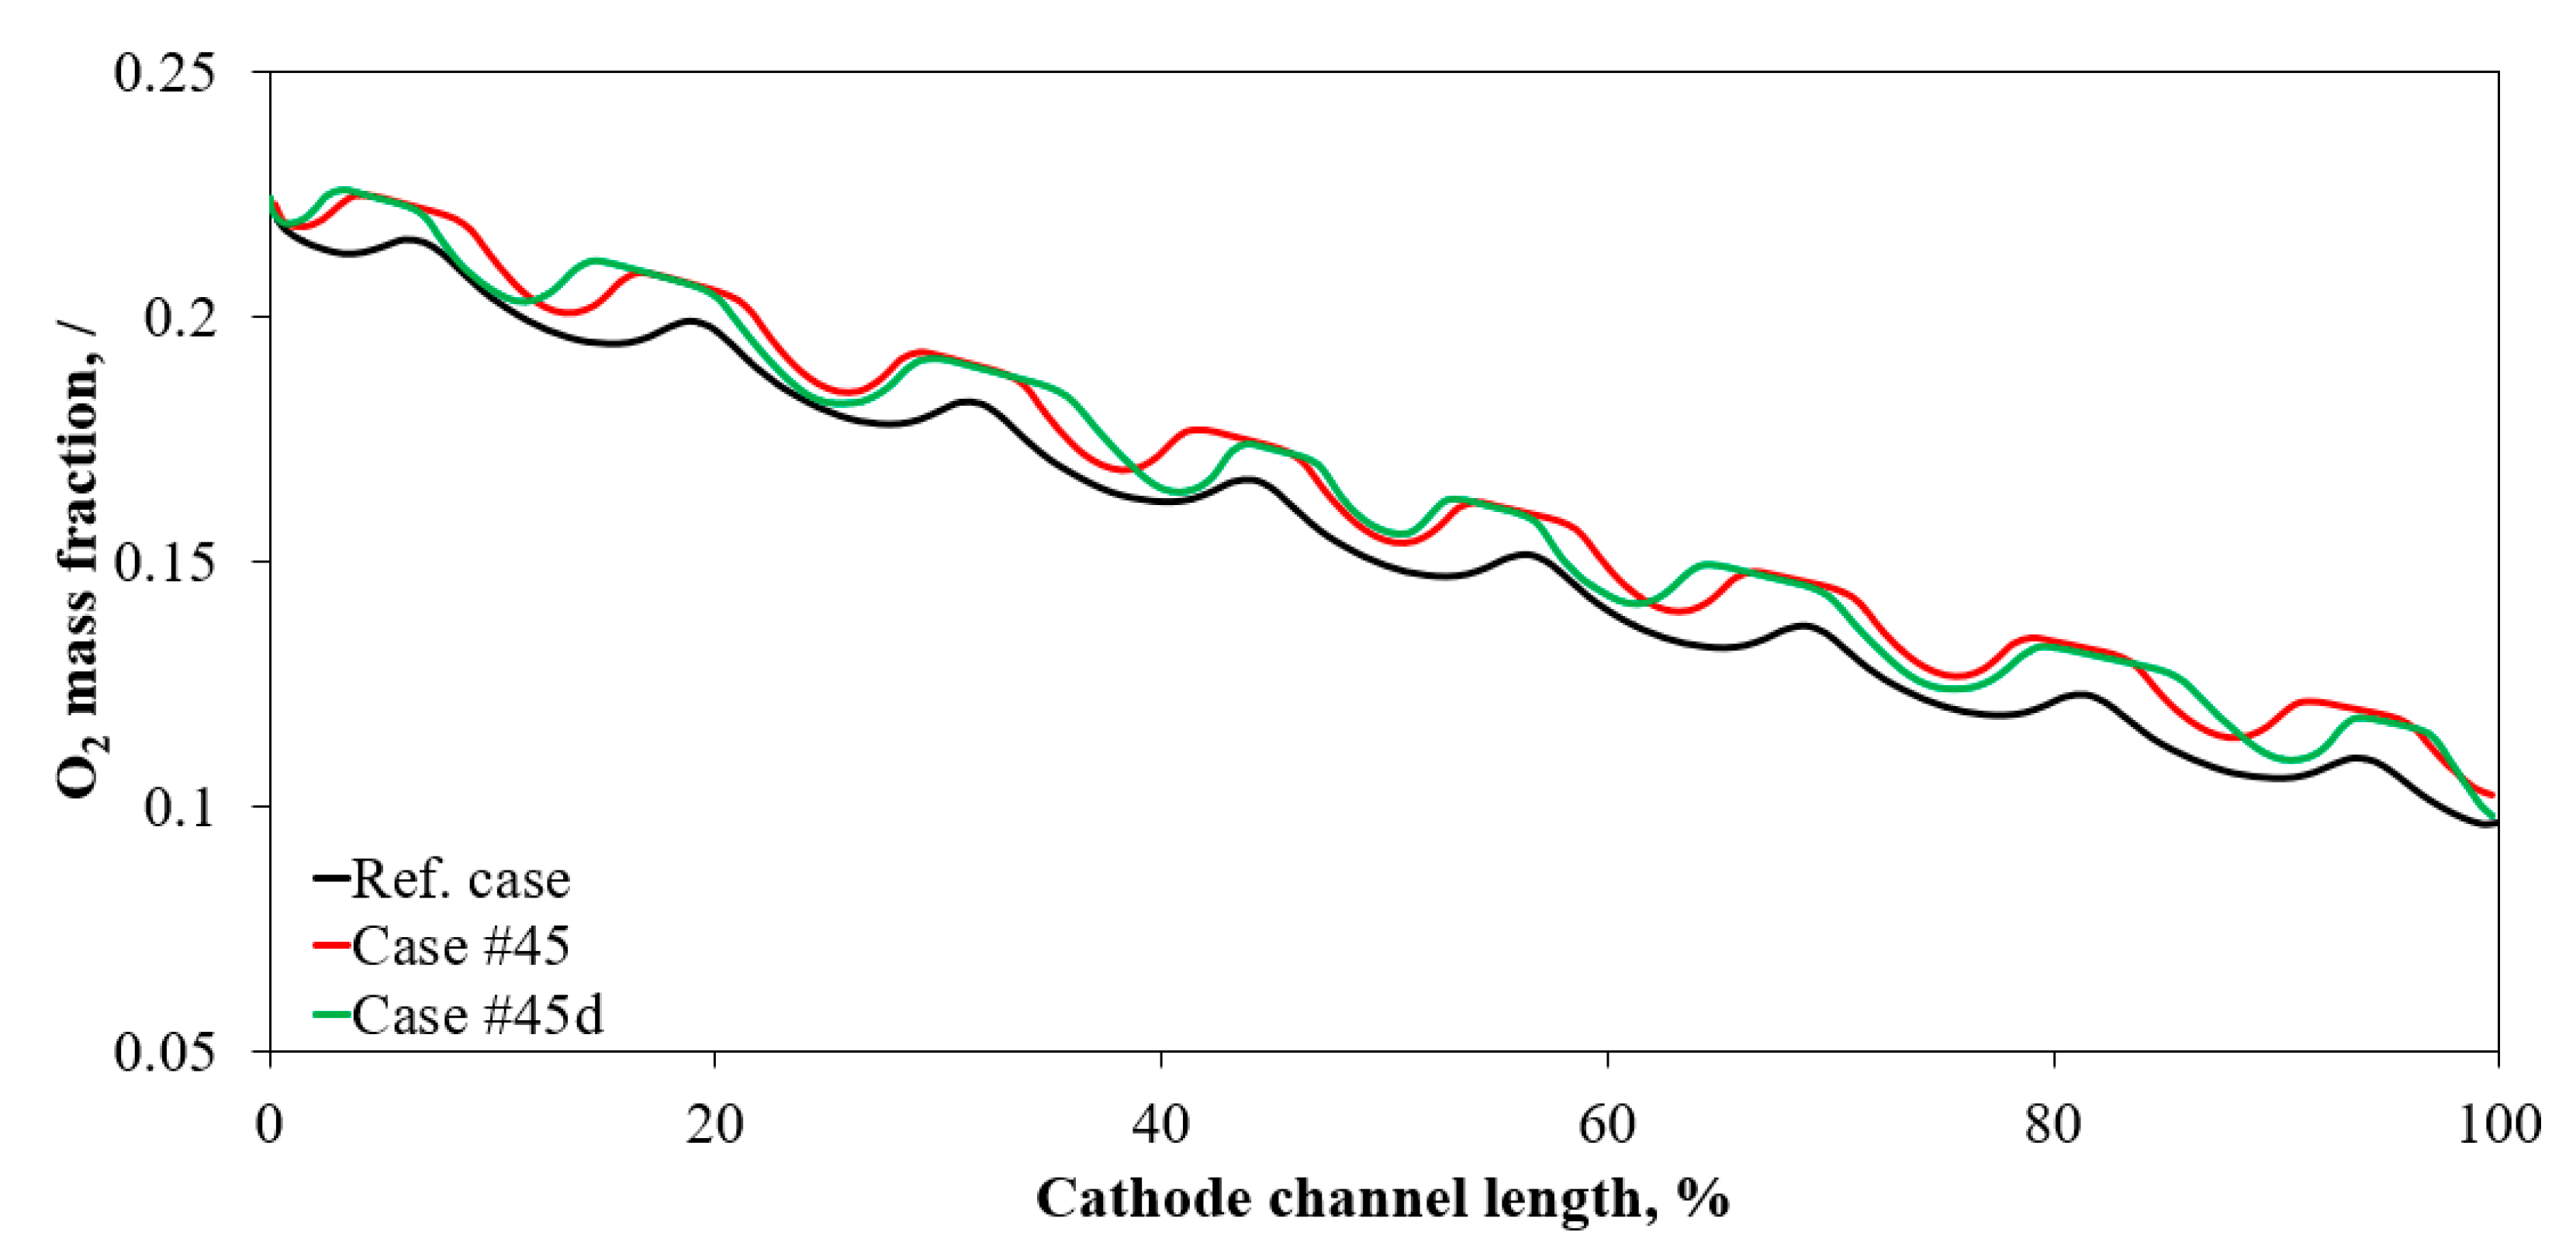
Minimizing the mass transport losses at high current densities is the main objective of this study, and thus the oxygen mass fraction is plotted along the substrate mid-line in Figure 17. It is observed that both optimized cases show significantly higher oxygen mass fractions along the entire length of the cell owing to the more intense mixing induced by the Forchheimer inertial effect in the presence of baffles.
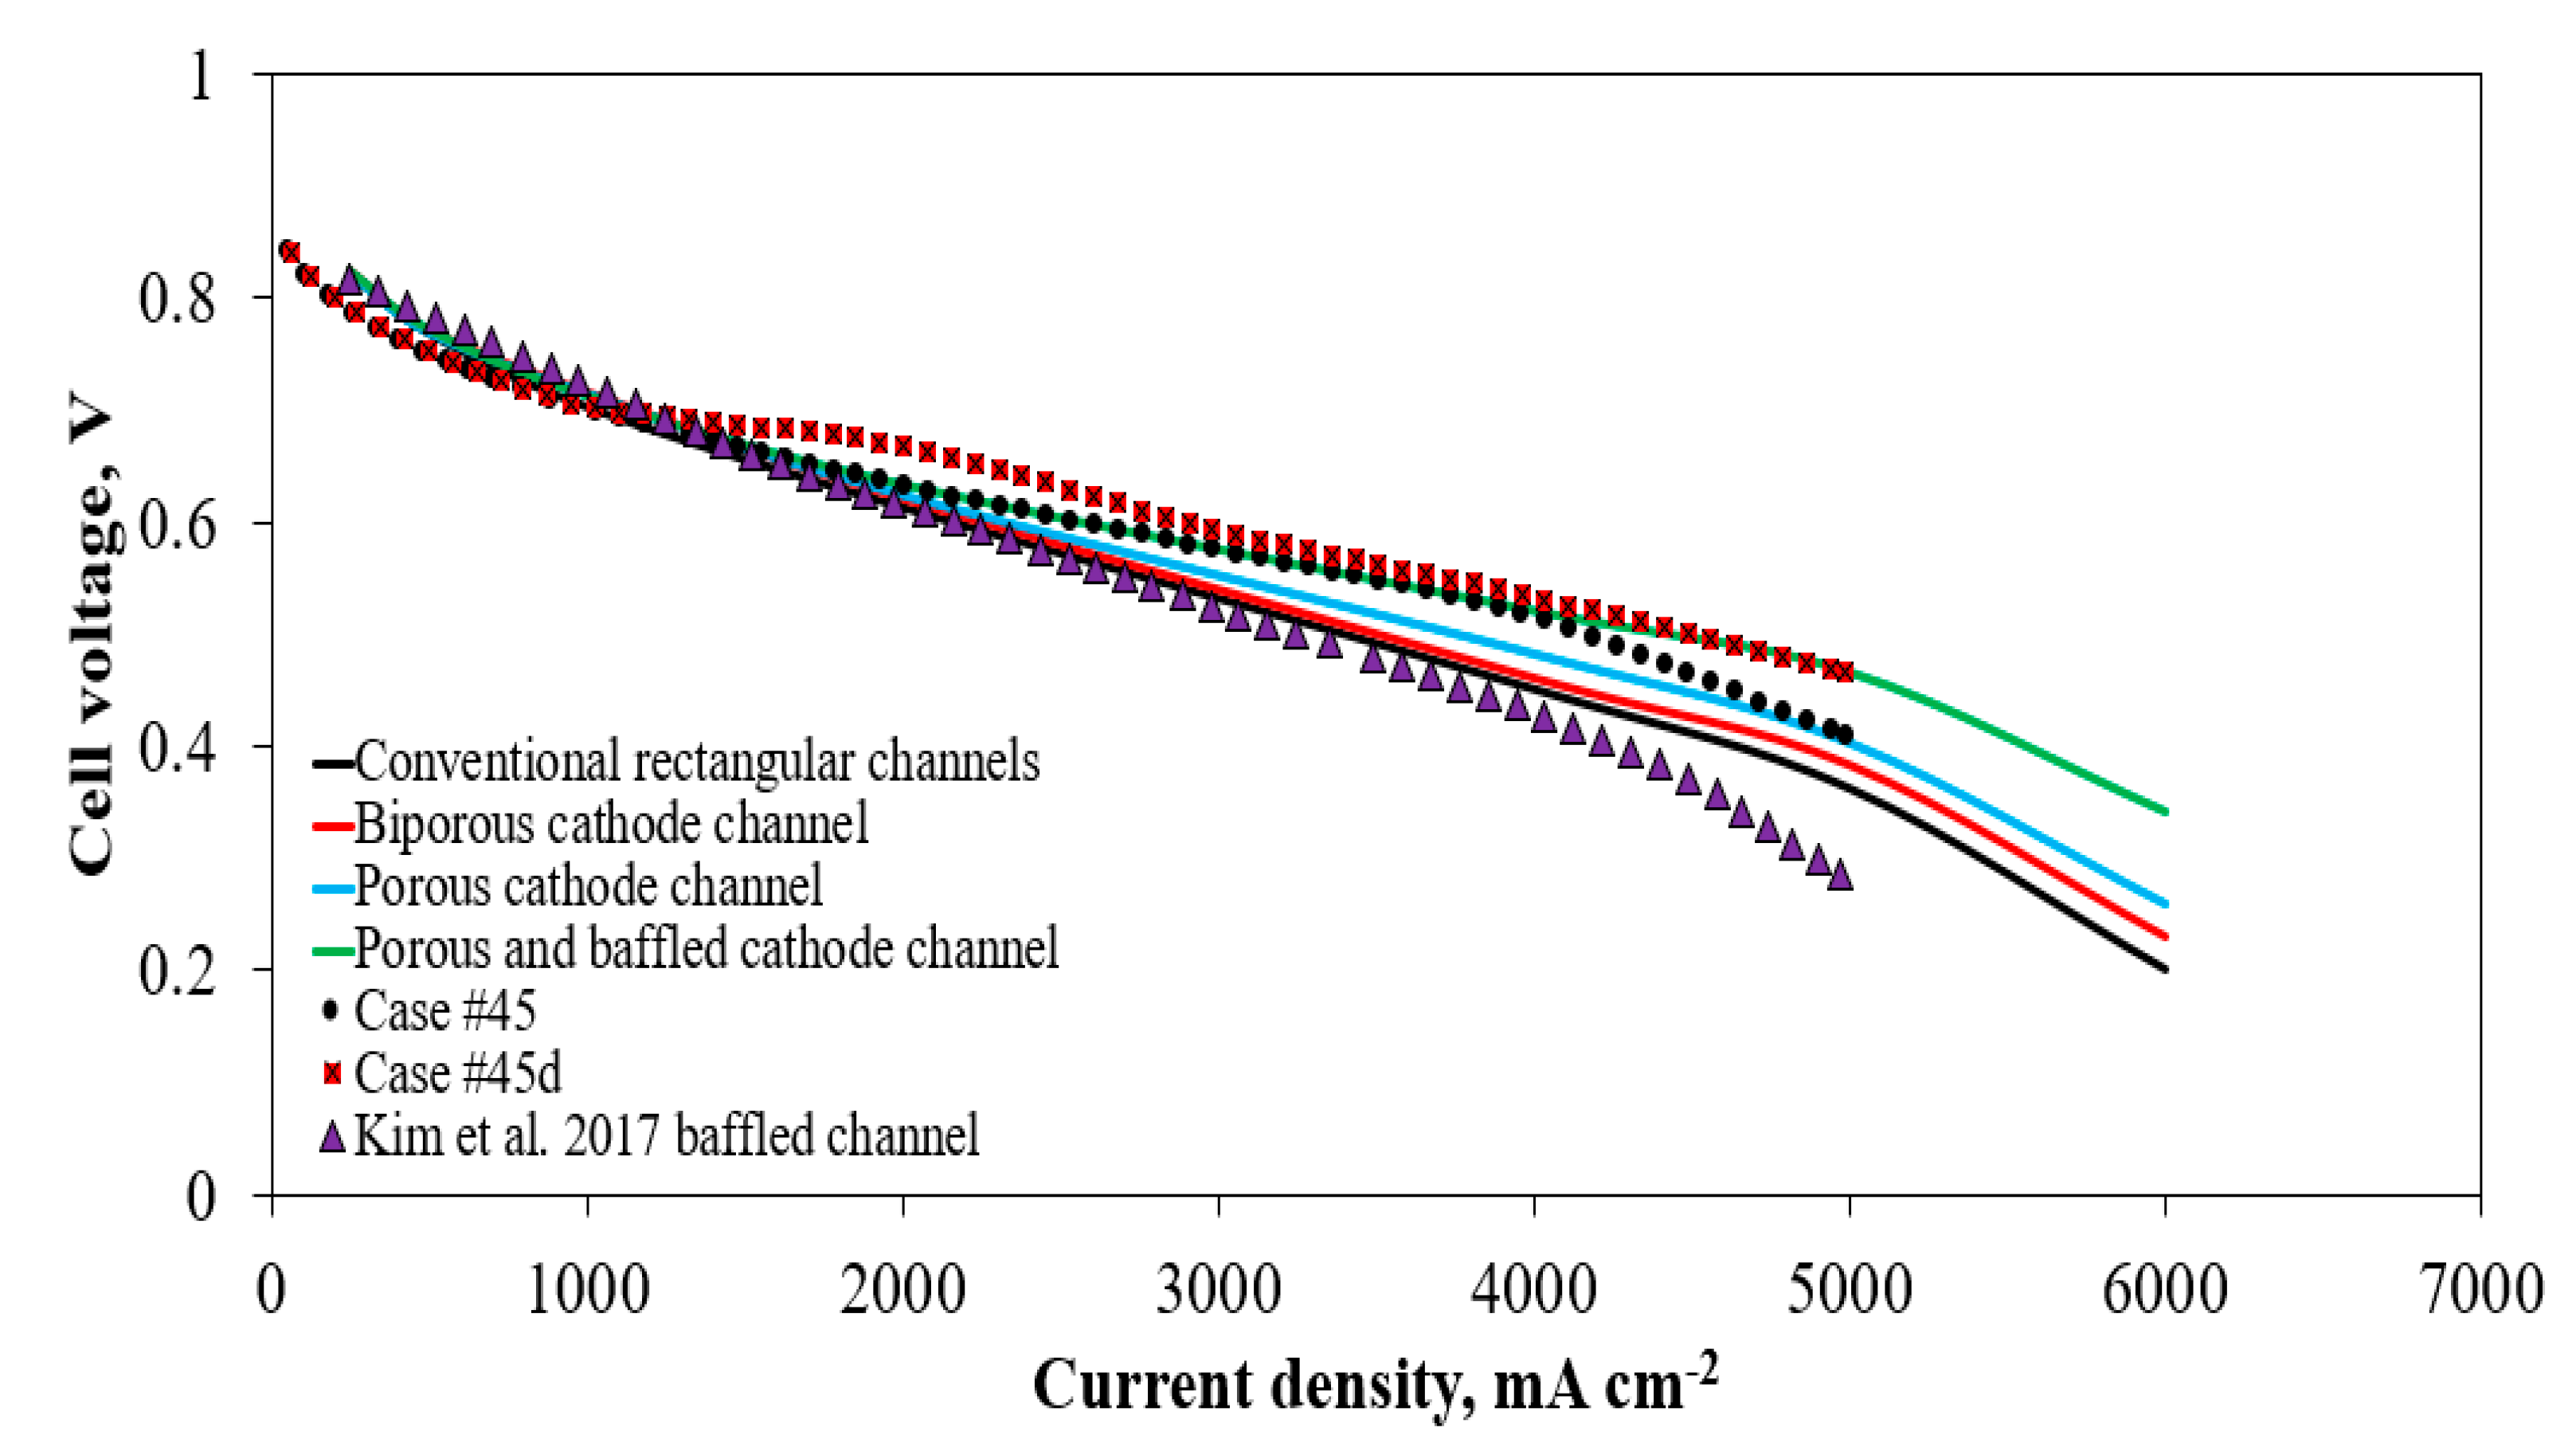
The polarization curves, as plotted in Figure 18, indicate that Case #45d shows superior performance in comparison with the reference case (Case #45), especially in the high current density range. For comparison purposes, the cases from the previous section are also plotted. It is found that the performance of the optimized flow field is slightly higher compared with the case of the porous and baffled channel, indicating that a porous layer is not necessary to achieve similar cell performance. The porous channel suffers from high cost and difficulty achieving precise water and heat management. The performances of the baffled channels with and without porous layers are almost identical up to a current density of 4.0 A·cm−2; beyond this point, the porous and baffled channel shows slightly higher performance. This means that in the high current density region, the mass transport losses are dominant and the heat transfer from the substrate to the bipolar plate plays a critical role in determining the cell performance. By minimizing the distance between the bipolar plate and the substrate, as seen in Case #45d, it is possible to enhance the heat transfer rates inside the cell significantly and prevent the occurrence of high temperature gradients in the cell without using complex and expensive biporous or porous layers.

7. Conclusions

This work screened the most popular flow field designs, including porous, biporous, porous with baffles, 3D fine-mesh, and traditional rectangular flow field, to determine the most promising flow field design for the improved cell performance with the highest feasibility for future development as a novel flow field (the first part of the work), and then to optimize the most promising type of flow field to further improve the cell performance (the second part of the work). As one of the novelties, the inertial term of the Forchheimer effect is introduced in the 3D multiphase nonisothermal computational fluid dynamic model, which is very important, as demonstrated in this work, for improved water removal at high current densities. The criteria for determining the best solution were as follows: (i) maximal voltage; (ii) maximal oxygen concentration in the cathode catalyst layer; (iii) minimal liquid saturation in the cathode catalyst layer and channels; (iv) minimal temperature in the cathode catalyst layer; (v) reasonably low pressure drop. The following conclusions are:
(1)
By comparing the polarization curves of all studied cases, the best performance is achieved using porous and baffled flow field due to the combined effects of improved heat and mass transfer, resulting in significantly improved water removal and elevated oxygen mass fraction inside the cathode catalyst layer along with the highest pressure drop. The porous and baffled flow field is very challenging for manufacturing because it is very difficult to insert porous layers in channels with small dimensions.
(2)
The gain in cell performance of the biporous flow field is attributed to the increase in reactant velocity in the channel since part of the cross-section is obstructed by the biporous layer, but the overall conclusion is that this approach is of limited practicality.
(3)
The porous cathode channel shows the second-best performance due to the improved heat transfer between the gas diffusion layer and the current collector. However, the liquid saturation contours along the gas diffusion layer height are quite homogeneous and the oxygen mass fraction inside the cathode catalyst layer is quite low, due to the decreased flow velocity initiated by the increased pressure drop when fluid passing through the porous medium.
Based on the above results, the most promising flow field for optimization is the baffled flow field without biporous layers, because the performance gain is mostly attributed to the forced convective mass transport inside the gas diffusion layer, which effectively increases the oxygen concentration and removes liquid water, while this advantage is absent in other approaches. Design of experiments is generated, in which 49 cases are studied and compared with the reference case based on geometry adopted from Ref. [17]. The following conclusions are drawn:
(1)
Increasing baffle top and baffle bottom size, as well as baffle height, and decreasing the distance between the baffle bottom and the substrate, resulting in better performance of the cell to a certain extent. The limiting factor is the pressure drop, which tends to increase exponentially in some extreme cases. The pressure drop must be set as a constraint in designing novel flow fields.
(2)
Case #45 shows the best cell performance vs. the reference case in Ref. [17] by decreasing 33.59% of water saturation and 7.91 °C of temperature in the cathode catalyst layer and increasing 2.26% of voltage at current density of 4.0 A·cm−2. Keep in mind that this performance gain is significant because the reference case in Ref. [17] has already been optimized to a certain extent.
(3)
The optimized case (Case #45) shows performance almost as good as the porous and baffled flow field up to current density of 5.0 A·cm−2 without the requirement for using the biporous layers, thus significantly less complex.
(4)
Further optimization of Case #45 by introducing the scaling factors shows a slightly improved voltage (0.5299 V vs. 0.5274 V) and a limited decrease in the temperature in the cathode CL (0.43 °C). However, the pressure drop is significantly increased (26,537 Pa vs. 14,598 Pa) in comparison with Case #45. Case #45d shows somewhat higher performance superior to the porous and baffled flow field at lower currents and it is the best flow field design in this work. Nevertheless, the scaling factors are considered to have a negative effect on the performance since the scaling modifications increase the complexity of the flow field and the pumping power.
(5)
The analyses, especially the scaling factors, show that the cell performance is significantly affected by the changes in the geometry of the baffles, therefore it is advisable to conduct the design of experiments and optimization for different operating conditions to determine the most appropriate geometry parameters for achieving the possible highest performance.

Supplementary Materials

The following are available online at https://www.mdpi.com/article/10.3390/en14123675/s1, Figure S1: Flow regimes in porous media, Takhanov; Figure S2: Mesh detail of conventional cathode channel and porous cathode channel geometry (above left); bi-porous cathode channel (above right); porous and baffled cathode channel (below); Figure S3: Temperature plots along the membrane mid-line at operating current density of 4.0 A cm−2. The operating temperature is set to 328 K (i.e., 55 °C) at the current collector terminals; Figure S4: Membrane water content along the membrane mid-line at operating current density of 4.0 A cm−2; Table S1: Parameters and resulting electric potential at current density of 4.0 A cm−2 part 1/5; Table S2: Parameters and resulting electric potential at current density of 4.0 A cm−2 part 2/5; Table S3: Parameters and resulting electric potential at current density of 4.0 A cm−2 part 3/5; Table S4: Parameters and resulting electric potential at current density of 4.0 A cm−2 part 4/5; Table S5: Parameters and resulting electric potential at current density of 4.0 A cm−2 part 5/5.

Author Contributions

Conceptualization, L.M. and Ž.P.; Methodology, L.M., Ž.P., and L.X.; Software: L.M., Ž.P., and L.X.; Validation: Ž.P. and L.X.; Formal analysis: L.X. and V.H.; Investigation: L.M., Ž.P.; Resources: L.M., Ž.P., L.X.; Data curation: Ž.P. and L.X.; Writing—original draft: L.M. and Ž.P.; Writing—review and editing: L.X. and V.H.; Visualization: Ž.P.; Supervision: L.X. and V.H.; Project administration: Ž.P. and L.X.; Funding acquisition: L.M., Ž.P. and L.X. All authors have read and agreed to the published version of the manuscript.

Funding

This research was supported under the project STIM–REI (contract number: KK.01.1.1.01.0003), funded by the European Union through the European Regional Development Fund—the Operational Programme Competitiveness and Cohesion 2014-2020 (KK.01.1.1.01.) and Croatian Science Foundation project IP-2020-02-6249 “Efficiency Improvement, Emission Reductions and Hybridization of the Marine Power Systems”. The authors also acknowledge the support of the National Natural Science Foundation of China (project number 21978118). The authors also appreciate the English polishing provided by Prof. Keith Scott at Newcastle University, UK.

Data Availability Statement

Not applicable.

Conflicts of Interest

The authors declare that they have no known competing financial interests or personal relationships that could have appeared to influence the work reported in this paper.

Nomenclature

A anode
a water activity
C cathode
CFDcomputational fluid dynamics
c w specific heat of water, J (kgK)−1
D g l diffusion coefficient between gas and liquid phase
D l i q liquid water diffusion coefficient, kg m−2 s−1
D i j gas species mass diffusivity, m2 s−1
D e f f i j effective gas species mass diffusivity, m2 s−1
D i 0 mass diffusivity of species i and reference pressure p 0 and temperature T 0 , m2 s−1
D w i diffusion coefficient of water content, kmol m−3
e Eule’s number/constant
E a n / E c a t user-specified activation energy anode/cathode, respectively, J mol−1
E i activation energy for the temperature correction term
E a n 0 / E c a t 0 reversible potentials anode/cathode, respectively, V
E W equivalent weight, kg kmol−1
F Faraday constant, (9.6485∙107) C kmol−1
g ( λ ) function for correlation of electro osmotic drag to membrane water content
I l leakage current, A m−2
i m the ionic current density, A m−1
i s ,   i m magnitude of solid/membrane phase current density, respectively, A m−1
j a n / j c a t reference exchange current density, respectively, A m−2
j a n r e f / j c a t r e f reference exchange current density at specified reference temperature anode/cathode, respectively, A m−2
j O 2 i d e a l ideal oxygen molar flux, mol m−2s−1
K absolute permeability
K r relative permeability
K w D w product of oxygen solubility and diffusivity in liquid water, respectively, m2 s−1
L latent heat of evaporation, J kg−1
MPLmicro porous layer
M w , H 2 ,   M w , O 2 ,   M w , H 2 O ,   M w molecular mass of hydrogen, oxygen, water vapor, ionomer, respectively, kg kmol−1
n d osmotic drag coefficient
n o s m user-specified generality coefficient for electro osmotic drag coefficient
p pressure, Pa
p c capillary pressure, Pa
p l liquid pressure gradient, kg m2 s−2
p w v partial pressure of water vapor, Pa
p H 2 , p O 2 , p H 2 O   partial pressures of hydrogen, oxygen and water vapor, respectively, Pa
p s a t water vapor saturation pressure, Pa
p 0 user-specified standard state absolute pressure, Pa
p 0 reference pressure, Pa
PEMproton exchange membrane
PEMFCproton exchange membrane fuel cell
R universal gas constant, (8.3144) J mol−1 K−1
R a n / R c a t exchange current density anode/cathode, respectively, A m−3
R j transfer current modification due to occurrence of liquid water, A m−3
r p particle diameter, m
r s exponent of pore blockage
R c a t 0 ideal transfer current, A m−2s−1
R s o l / R m e m volumetric transfer current, respectively, A m−3
i o n / l i q resistance due to ionomer film/liquid water film surrounding particles, respectively, s m−1
s liquid saturation
S G D L + M P L ,   S A C L ,   S S C C L ,   S M E M ,   S C C volumetric heat source for the gas diffusion layer and micro porous layer, anode catalyst layer, membrane and current collector, respectively, J m−3s−1
S H 2 ,   S O 2 , S λ , S g d , S l d ,   S g l sink/source terms for hydrogen, oxygen, membrane water content, between gas and dissolved phases, liquid and dissolved phases and gas and liquid phases, respectively, kg m−3s−1
Δ S a n / Δ S c a t 1reaction entropies anode/cathode, respectively, J K−1
T temperature, K
T a n r e f / T c a t r e f user-specified reference temperature anode/cathode, respectively
T 0 user-specified standard state temperature, K
T 0 reference temperature, K
U a n 0 / U c a t 0 half cell potential anode/cathode, respectively, V
V volume, m3
v g gas velocity vector, m s−1
v l liquid water velocity vector, m s−1
V o l a n / V o l c a t volume of the anode/cathode catalyst layer, m3
[   ] ,   [   ] r e f local species concentration, kmol m−3
Greek alphabet
α a n a n / α c a t a n anode and cathode transfer coefficients of the anode electrode, respectively
α a n c a t / α c a t c a t anode and cathode transfer coefficients of the cathode electrode, respectively
β m e m , β a n ,   β c a t electrolyte phase conductivity model generality constant in membrane, anode catalyst and cathode catalyst, respectively
Γ i electrolyte phase conductivity term
γ a n / γ c a t concentration dependence coefficient anode/cathode, respectively
γ e / γ c evaporation/condensation coefficient, respectively
γ j user-specified constant for modification of transfer current due to occurrence of liquid water
γ g d , γ l d user-specified parameters for mass exchange rate between gas and dissolved/liquid and dissolved phases
γ t / γ p user-defined exponents in gas species diffusivity equation for temperature/pressure, respectively
ε porosity
ε i porosity of porous media
ζ a n / ζ c a t specific active area anode/cathode (cathode catalyst), respectively, m−1
η a n / η c a t surface over potential anode/cathode, V
Θ coefficient of liquid water removal
θ user-specified parameter
θ c contact angle, °
λ membrane water content, dissolved water content
λ e q equilibrium water content
λ a = 1 , λ s = 1 water activity at water activity equal to 1, saturation equal to 1, i.e., user-specified parameters
μ l liquid dynamic (absolute) viscosity, kg (ms)−1
ρ i dry ionomer, i.e., membrane, density, kg m−3
ρ l liquid water density, kg m−3
σ surface tension coefficient, N m−1
σ s o l / σ m e m electrical conductivity of the solid/membrane phase, respectively, Ω−1 m−1
ς a / ς c ionomer volume fraction anode/cathode, respectively
τ a / τ c ionomer tortuosity anode/cathode
ϕ s o l / ϕ m e m electric potential of the solid/membrane phase, respectively, V
χ liquid to gas velocity ratio
ω i electrolyte phase conductivity model generality constant
Mathematical operator
nabla operator

References

  1. Wang, Y.; Chen, K.S.; Mishler, J.; Cho, S.C.; Adroher, X.C. A review of polymer electrolyte membrane fuel cells: Technology, applications, and needs on fundamental research. Appl. Energy 2011, 88, 981–1007. [Google Scholar] [CrossRef] [Green Version]
  2. Wang, Y.; Diaz, D.F.R.; Chen, K.S.; Wang, Z.; Adroher, X.C. Materials, technological status, and fundamentals of PEM fuel cells—A review. Mater. Today 2020, 32, 178–203. [Google Scholar] [CrossRef]
  3. Tabuchi, Y.; Shiomi, T.; Aoki, O.; Kubo, N.; Shinohara, K. Effects of heat and water transport on the performance of polymer electrolyte membrane fuel cell under high current density operation. Electrochim. Acta 2010, 56, 352–360. [Google Scholar] [CrossRef]
  4. Zhang, F.Y.; Yang, X.G.; Wang, C.Y. Liquid water removal from a polymer electrolyte fuel cell. J. Electrochem. Soc. 2006, 153, A225–A232. [Google Scholar] [CrossRef]
  5. Li, Y.; Wang, C. Modeling of transient platinum degradation in a low PT-loading PEFC under current cycling. J. Electrochem. Soc. 2017, 164, F171–F179. [Google Scholar] [CrossRef] [Green Version]
  6. Kotaka, T.; Tabuchi, Y.; Pasaogullari, U.; Wang, C.-Y. Impact of interfacial water transport in PEMFCs on cell performance. Electrochim. Acta 2014, 146, 618–629. [Google Scholar] [CrossRef]
  7. Wang, Y.; Basu, S.; Wang, C.-Y. Modeling two-phase flow in PEM fuel cell channels. J. Power Sources 2008, 179, 603–617. [Google Scholar] [CrossRef]
  8. Xing, L.; Xu, Y.; Penga, Ž.; Xu, Q.; Su, H.; Shi, W.; Barbir, F. A novel flow field with controllable pressure gradient to enhance mass transport and water removal of PEM fuel cells. AIChE J. 2020, 66, e16957. [Google Scholar] [CrossRef]
  9. Xing, L.; Xu, Y.; Penga, Ž.; Xu, Q.; Su, H.; Barbir, F.; Xuan, J. A segmented fuel cell unit with functionally graded distributions of platinum loading and operating temperature. Chem. Eng. J. 2021, 406, 126889. [Google Scholar] [CrossRef]
  10. Penga, I.Ž.; Pivac, F. Barbir, Experimental validation of variable temperature flow field concept for proton exchange membrane fuel cells. J. Hydrogen Energy 2017, 42, 26084–26093. [Google Scholar] [CrossRef]
  11. Konno, N.; Mizuno, S.; Nakaji, H.; Ishikawa, Y. Development of Compact and High-Performance Fuel Cell Stack. SAE Int. J. Altern. Powertrains 2015, 4, 123–129. [Google Scholar] [CrossRef]
  12. Yoshida, T.; Kojima, K. Toyota MIRAI fuel cell vehicle and progress toward a future hydrogen society. Electrochem. Soc. Interface 2015, 24, 45–49. [Google Scholar] [CrossRef]
  13. Heidary, H.; Kermani, M.J.; Advani, S.G.; Prasad, A.K. Experimental investigation of in-line and staggered blockages in parallel flowfield channels of PEM fuel cells. Int. J. Hydrogen Energy 2016, 41, 6885–6893. [Google Scholar] [CrossRef]
  14. Thitakamol, V.; Therdthianwong, A.; Therdthianwong, S. Mid-baffle interdigitated flow fields for proton exchange membrane fuel cells. Int. J. Hydrogen Energy 2011, 36, 3614–3622. [Google Scholar] [CrossRef]
  15. Han, S.H.; Choi, N.H.; Choi, Y.D. Simulation and experimental analysis on the performance of PEM fuel cell by the wave-like surface design at the cathode channel. Int. J. Hydrogen Energy 2014, 39, 2628–2638. [Google Scholar] [CrossRef]
  16. Li, W.; Zhang, Q.; Wang, C.; Yan, X.; Shen, S.; Xia, G.; Zhu, F.; Zhang, J. Experimental and numerical analysis of a three-dimensional flow field for PEMFCs. Appl. Energy 2017, 195, 278–288. [Google Scholar] [CrossRef]
  17. Kim, J.; Luo, G.; Wang, C.Y. Modeling two-phase flow in three-dimensional complex flow fields of proton exchange membrane fuel cells. J. Power Sources 2017, 365, 419–429. [Google Scholar] [CrossRef]
  18. Utaka, Y.; Okabe, A.; Omori, Y. Proposal and examination of method of water removal from gas diffusion layer by applying slanted microgrooves inside gas channel in separator to improve polymer electrolyte fuel cell performance. J. Power Sources 2015, 279, 533–539. [Google Scholar] [CrossRef] [Green Version]
  19. Koresawa, R.; Utaka, Y. Water control by employing microgrooves inside gas channel for performance improvement in polymer electrolyte fuel cells. Int. J. Hydrogen Energy 2015, 40, 8172–8181. [Google Scholar] [CrossRef] [Green Version]
  20. Utaka, Y.; Koresawa, R. Effect of wettability-distribution pattern of the gas diffusion layer with a microgrooved separator on polymer electrolyte fuel cell performance. J. Power Sources 2017, 363, 227–233. [Google Scholar] [CrossRef]
  21. Kozakai, M.; Date, K.; Tabe, Y.; Chikahisa, T. Improving gas diffusivity with bi-porous flow-field in polymer electrolyte membrane fuel cells. Int. J. Hydrogen Energy 2016, 41, 13180–13189. [Google Scholar] [CrossRef]
  22. Nonobe, Y. Development of the fuel cell vehicle Mirai. IEEJ Trans. Electr. Electron. Eng. 2017, 12, 5–9. [Google Scholar] [CrossRef] [Green Version]
  23. Yoshida, T. Development of MEA for Polymer Electrolyte Fuel Cell. TOYOTA Tech. Rev. 2011, 57, 46. [Google Scholar]
  24. Kim, J.; Luo, G.; Wang, C.Y. Modeling liquid water re-distribution in biporous layer flow-fields of proton exchange membrane fuel cells. J. Power Sources 2018, 400, 284–295. [Google Scholar] [CrossRef]
  25. Penga, Ž.; Bergbreiter, C.; Barbir, F.; Scholta, J. Numerical and experimental analysis of liquid water distribution in PEM fuel cells. Energy Convers. Manag. 2019, 189, 167–183. [Google Scholar] [CrossRef]
  26. ANSYS Fluent Advanced Add-On Modules; ANSYS Inc.: Canonsburg, PA, USA, 2016.
  27. Scholz, H. Modellierung und Untersuchung des Wärme- und Stofftransports und von Flutungsphänomenen in Niedertemperatur-PEM-Brennstoffzellen. Ph.D. Thesis, RWTH Aachen University, Aachen, Germany, 2015. [Google Scholar]
  28. Wu, H.; Li, X.; Berg, P. On the modeling of water transport in polymer electrolyte membrane fuel cells. Electrochim. Acta 2009, 54, 6913–6927. [Google Scholar] [CrossRef]
  29. Zawodzinski, T.A.; DeRouin, C.; Radzinski, S.; Sherman, R.J.; Smith, V.T.; Springer, T.E.; Gottesfeld, S. Water uptake by and transport through Nafion® 117 membranes. J. Electrochem. Soc. 1993, 140, 1041–1047. [Google Scholar] [CrossRef]
  30. Hinatsu, J.T.; Mizuhata, M.; Takenaka, H. Water Uptake of perfluorosulfonic acid membranes from liquid water and water vapor. J. Electrochem. Soc. 1994, 141, 1493–1498. [Google Scholar] [CrossRef]
  31. Penga, Ž.; Tolj, I.; Barbir, F. Computational fluid dynamics study of PEM fuel cell performance for isothermal and non-uniform temperature boundary conditions. Int. J. Hydrogen Energy 2016, 41, 17585–17594. [Google Scholar] [CrossRef]
  32. Penga, Ž.; Radica, G.; Barbir, F.; Nižetić, S. Coolant induced variable temperature flow field for improved performance of proton exchange membrane fuel cells. Int. J. Hydrogen Energy 2019, 44, 10102–10119. [Google Scholar] [CrossRef]
  33. Wang, Y.; Wang, C.Y. Transient analysis of polymer electrolyte fuel cells. Electrochim. Acta 2005, 50, 1307–1315. [Google Scholar] [CrossRef]
  34. Motupally, S.; Becker, A.J.; Weidner, J.W. Diffusion of water through Nafion 115 membranes. J. Electrochem. Soc. 2000, 147, 3171–3177. [Google Scholar] [CrossRef]
  35. Springer, T.E.; Zawodzinski, T.A.; Gottesfeld, S. Polymer Electrolyte Fuel Cell Model. J. Electrochem. Soc. 1991, 138, 2334–2342. [Google Scholar] [CrossRef]
  36. Takhanov, D. Forchheimer Model for Non-Darcy Flow in Porous Media and Fractures; Imperial College London: London, UK, 2011. [Google Scholar]
  37. Rasoloarijaona, M.; Auriault, J.L.M. Nonlinear seepage flow through a rigid porous medium. Eur. J. Mech. B/Fluids 1994, 13, 177–195. [Google Scholar]
  38. Skjetne, E. High-Velocity Flow in Porous Media. Ph.D. Thesis, Norwegian University of Science and Technology, Trondheim, Norway, 1995. [Google Scholar]
  39. Skjetne, E.; Auriault, J.L. New insights on steady, non-linear flow in porous media. Eur. J. Mech. B/Fluids 1999, 18, 131–145. [Google Scholar] [CrossRef]
  40. Lohse-Busch, H.; Stutenberg, K.; Duoba, M.; Iliev, S. Technology Assessment of a Fuel Cell Vehicle: 2017 Toyota Mirai Energy Systems Division; Argonne National Lab.: Argonne, IL, USA, 2018.
  41. Xing, L.; Liu, X.; Alaje, T.; Kumar, R.; Mamlouk, M.; Scott, K. A two-phase flow and non-isothermal agglomerate model for a proton exchange membrane (PEM) fuel cell. Energy 2014, 73, 618–634. [Google Scholar] [CrossRef]
  42. Xing, L.; Cai, Q.; Liu, X.; Liu, C.; Scott, K.; Yan, Y. Anode partial flooding modelling of proton exchange membrane fuel cells: Optimisation of electrode properties and channel geometries. Chem. Eng. Sci. 2016, 146, 88–103. [Google Scholar] [CrossRef] [Green Version]
  43. Carcadea, E.; Ismail, M.S.; Bin Ingham, D.; Patularu, L.; Schitea, D.; Marinoiu, A.; Ion-Ebrasu, D.; Mocanu, D.; Varlam, M. Effects of geometrical dimensions of flow channels of a large-active-area PEM fuel cell: A CFD study. Int. J. Hydrogen Energy 2020, 46, 13572–13582. [Google Scholar] [CrossRef]
  44. Sabzpoushan, S.; Mosleh, H.J.; Kavian, S.; Pour, M.S.; Mohammadi, O.; Aghanajafi, C.; Ahmadi, M.H. Nonisothermal two-phase modeling of the effect of linear nonuniform catalyst layer on polymer electrolyte membrane fuel cell performance. Energy Sci. Eng. 2020, 8, 3575–3587. [Google Scholar] [CrossRef]
  45. Peng, Y.; Mahyari, H.M.; Moshfegh, A.; Javadzadegan, A.; Toghraie, D.; Shams, M.; Rostami, S. A transient heat and mass transfer CFD simulation for proton exchange membrane fuel cells (PEMFC) with a dead-ended anode channel. Int. Commun. Heat Mass Transf. 2020, 115, 104638. [Google Scholar] [CrossRef]
  46. Kulikovsky, A. Performance of a PEM fuel cell with oscillating air flow velocity: A modeling study based on cell impedance. eTransportation 2021, 7, 00104. [Google Scholar] [CrossRef]
  47. Qin, Y.; Ma, S.; Chang, Y.; Liu, Y.; Yin, Y.; Zhang, J.; Liu, Z.; Jiao, K.; Du, Q. Modeling the membrane/CL delamination with the existence of CL crack under RH cycling conditions of PEM fuel cell. Int. J. Hydrogen Energy 2021, 46, 8722–8735. [Google Scholar] [CrossRef]
Figure 1. Flow field configurations.
Energies 14 03675 g001
Figure 2. Polarization curve comparison for different configurations.
Energies 14 03675 g002
Figure 3. Temperature contours: conventional rectangular channels (above left); biporous cathode channel (above right); porous cathode channel (below left); porous and baffled cathode channel (below right) at operating current density of 4.0 A·cm−2.
Energies 14 03675 g003
Figure 4. GDL liquid removal rate contours: conventional rectangular channels (above left); biporous cathode channel (above right); porous cathode channel (below left); porous and baffled cathode channel (below right) at operating current density of 4.0 A·cm−2.
Energies 14 03675 g004
Figure 5. Relative humidity contours: conventional rectangular channels (above left); biporous cathode channel (above right); porous cathode channel (below left); porous and baffled cathode channel (below right) at operating current density of 4.0 A·cm−2.
Energies 14 03675 g005
Figure 6. Liquid saturation contours: conventional rectangular channels (above left); biporous cathode channel (above right); porous cathode channel (below left); porous and baffled cathode channel (below right) at operating current density of 4.0 A·cm−2.
Energies 14 03675 g006
Figure 7. Liquid saturation in channels contours: conventional rectangular channels (above left); biporous cathode channel (above right); porous cathode channel (below left); porous and baffled cathode channel (below right) at operating current density of 4.0 A·cm−2.
Energies 14 03675 g007
Figure 8. Oxygen mass fraction plot along the cathode substrate mid-line at operating current density of 4.0 A·cm−2.
Energies 14 03675 g008
Figure 9. O2 mass fraction contours: conventional rectangular channels (above left); biporous cathode channel (above right); porous cathode channel (below left); porous and baffled cathode channel (below right) at operating current density of 4.0 A·cm−2.
Energies 14 03675 g009
Figure 10. Parameters (left) and scalable segments 2, 3, and 4 (right from top to bottom).
Energies 14 03675 g010
Figure 11. Influence of every parameter on the electric potential of the cell at a current density of 4.0 A·cm−2.
Energies 14 03675 g011
Figure 12. Operating parameters of interest at current density of 4.0 A·cm−2 for each case.
Energies 14 03675 g012
Figure 13. Operating parameters of interest at current density of 4.0 A·cm−2 for each case.
Energies 14 03675 g013
Figure 14. Influence of scaling factors on the electric potential of the cell at current density of 4.0 A·cm−2.
Energies 14 03675 g014
Figure 15. GDL liquid removal contours for reference case [17] (above left), Case #45 (above right) and Case #45d (below) at current density of 4.0 A cm−2.
Energies 14 03675 g015
Figure 16. Temperature contours for Ref. case (above left), Case #45 (above right) and Case #45d (below) at current density of 4.0 A·cm−2.
Energies 14 03675 g016
Figure 17. O2 mass fraction along the substrate mid-line at operating current density of 4.0 A·cm−2 for Ref. case and optimized geometries.
Energies 14 03675 g017
Figure 18. Comparison of polarization curves for different configurations.
Energies 14 03675 g018
Table 1. Grid independent meshes number of elements and orthogonal quality for each setup.
CaseNumber of ElementsAverage Orthogonal Quality
Conventional rectangular channels17,6001
Biporous cathode channel19,2001
Porous cathode channel17,6001
Porous and baffled cathode channel298,9000.97691
Table 2. Properties of PEM fuel cell components.
Component Density   ρ (kg m−3) Heat   Capacity   C p (J kg−1 K−1) Thermal   Conductivity   λ (W m−1 K−1) Electrical   Conductivity   σ e l (S m−1) Porosity     ε   ( / ) Permeability   K (m2) Contact   Angle   φ (°)
Current collector1900740208000//70
GDL substrate27198710.550000.658 × 10−12110
GDL micro-porous layer27198710.550000.65 × 10−13120
Catalyst layer2719871150000.53 × 10−14100
Membrane180020000.41 × 10−16/1 × 10−18/
Table 3. Porosity and permeability of channel and biporous layer.
Case Porosity     ε   ( / ) Permeability   K (m2)
ChannelBiporous LayerChannelBiporous Layer
Conventional rectangular channels1/9.76 × 10−9/
Biporous cathode channel10.99.76 × 10−94.88 × 10⁻¹¹
Porous cathode channel0.65/9.76 × 10−9/
Porous and baffled cathode channel0.65/9.76 × 10−9/
Table 4. Values of inertial resistance term including the Forchheimer effect for PEM fuel cell components.
Component K (m2) ε ( / ) C i j (m−1)
GDL substrate8 × 10−120.6537,795
GDL micro-porous layer5 × 10−130.6234,792
Catalyst layer3 × 10−140.52,612,789
Channel9.76 × 10−91102
Biporous/porous layer1.81 × 10−90.651083
Table 5. Boundary conditions.
Boundary ConditionsValue
Mass flow inlet anode (kg s−1)Const. value of 1.0447 × 10⁻⁸ until 0.5 A cm−2, then stoichiometric S = 2 for higher currents
Mass flow inlet cathode (kg s−1)Const. value of 3.6049 × 10⁻⁷ until 0.5 A cm−2, then stoichiometric S = 2 for higher currents
Pressure outlet anode (Pa)202,650
Pressure outlet cathode (Pa)202,650
Temperature anode (K)328.15
Temperature cathode (K)328.15
Relative humidity inlet anode (%)100
Relative humidity inlet cathode (%)100
Table 6. Porosity and permeability of channel and biporous layer.
CasePressure Drop, Pa
Conventional rectangular channels1491
Biporous cathode channel3038
Porous cathode channel1403
Porous and baffled cathode channel49,877
Table 7. Comparison of cases with min and max values of parameters of interest at current density of 4.0 A·cm−2 vs. the ref. case.
Parameter (Unit)Min Delta Pressure Cathode Channel (Pa)Max Delta Pressure Cathode Channel (Pa)Min Liq. Sat. in Cathode CL (/)Max Liq. Sat. in Cathode CL (/)Min Oxygen Mass Frac. in Cathode CL (/)Max Oxygen Mass Frac. in Cathode CL (/)Min Temp. in Cathode CL (°C)Max Temp. in Cathode CL (°C)Min Liq. Sat. in Cathode Channel (/)Max. Liq. Sat. in Cathode Channel (/)Min Voltage (V)Max Voltage (V)
Value10819,4440.019150.044730.113270.1434071.49179.4110.000850.011410.511270.52740
Percentage (+/−)vs. initial case−45.45%+9820%−33.59%+55.09%−12.44%+10.84%−9.970%−83.96%+115.28%−0.86%+2.26%
Case #Case #2Case #47Case #45Case #6Case #6Case #48Case #45Ref. CaseCase #6Case #47Case #2Case #45
Table 8. Scaling factors and resulting electric potential at current density of 4.0 A·cm−2.
Parameter (mm)Case #45aCase #45bCase #45cCase #45dCase #45eCase #45fCase #45g
Scale 21111.81.51.61.5
Scale 311.21.51.611.41.8
Scale 411.41.31.11.2521.2
Electric potential (V):0.5274330.5278920.5280130.5298660.5280620.5294630.528719
Table 9. Comparison of parameters of interest for cases using scaling factors (#45b-g) vs. reference Case #45 (annotated in table as #45a) at current density of 4.0 A·cm−2.
Parameter (mm)Delta Pressure Cathode Channel (Pa)Vol Averaged Liq. Sat. in Cathode CL (/)Vol Averaged Oxygen Mass Fraction in Cathode CL (/)Vol Averaged Temperature in Cathode CL (K)Vol Averaged Liq. Sat. in Cathode Channel (/)Voltage (V)
Case #45a14,5980.04470.143371.490.01120.5274
Case #45b18,9890.04480.143171.530.01150.5279
Case #45c20,5690.04500.14371.550.01170.5280
Case #45d26,5370.04580.142771.060.01210.5299
Case #45e20,1740.04480.14371.530.01160.5281
Case #45f31,1510.04500.142871.580.01240.5295
Case #45g26,5230.04490.142871.580.01210.5287
Publisher’s Note: MDPI stays neutral with regard to jurisdictional claims in published maps and institutional affiliations.

