Article

Chemical Degradation of the La0.6Sr0.4Co0.2Fe0.8O3−δ/Ce0.8Sm0.2O2−δ Interface during Sintering and Cell Operation

by
Mélanie François
1,*,
Maria Paola Carpanese
2,3,
Olivier Heintz
1,
Victoire Lescure
1,
Davide Clematis
2,3,
Lionel Combemale
1,
Frédéric Demoisson
1 and
Gilles Caboche
1
1
Laboratoire Interdisciplinaire Carnot de Bourgogne, FCLAB, ICB-UMR6303, CNRS—Université de Bourgogne Franche-Comté, 9 Avenue Savary, BP47870, CEDEX, 21078 DIJON, France
2
Department of Civil, Chemical and Environmental Engineering (DICCA)—Università Degli Studi di Genova, Via Montallegro 1, 16145 Genova, Italy
3
Institute of Condensed Matter Chemistry and Technologies for Energy (CNR-ICMATE), Via Operia Pia 15, 16145 Genova, Italy
*
Author to whom correspondence should be addressed.
Energies 2021, 14(12), 3674; https://doi.org/10.3390/en14123674
Submission received: 11 May 2021 / Revised: 7 June 2021 / Accepted: 16 June 2021 / Published: 20 June 2021

Abstract

:
A complete cell consisting of NiO-Ce0.8Sm0.2O3−δ//Ce0.8Sm0.2O3−δ//(La0.6Sr0.4)0.95Co0.2Fe0.8O3−δ elaborated by a co-tape casting and co-sintering process and tested in operating fuel cell conditions exhibited a strong degradation in performance over time. Study of the cathode–electrolyte interface after cell testing showed, on one hand, the diffusion of lanthanum from (La0.6Sr0.4)0.95Co0.2Fe0.8O3−δ into Sm-doped ceria leading to a La- and Sm-doped ceria phase. On the other hand, Ce and Sm diffused into the perovskite phase of the cathode. The grain boundaries appear to be the preferred pathways of the cation diffusion. Furthermore, a strontium enrichment was clearly observed both in the (La0.6Sr0.4)0.95Co0.2Fe0.8O3−δ layer and at the interface with electrolyte. X-ray photoelectron spectroscopy (XPS) indicates that this Sr-rich phase corresponded to SrCO3. These different phenomena led to a chemical degradation of materials and interfaces, explaining the decrease in electrochemical performance.

Graphical Abstract

1. Introduction

One of the current global challenges is to find novel, clean and efficient techniques for energy production. The use of hydrogen into fuel cells, particularly into Solid Oxide Fuel Cells (SOFC) which offer one of the best yields and volumetric power densities, is one of the solutions [1]. However, classical SOFC systems based on yttria-stabilized zirconia (YSZ) as electrolyte operate at high temperatures, typically more than 800 °C, leading to low durability. Notably, when associated with lanthanum strontium manganite (LSM), YSZ tends to form SrZrO3 or La2Zr2O7 interfacial insulating phases during the sintering process [2,3]. Furthermore, such high temperatures imply the use of expensive interconnect materials such as LaCrO3 [4]. Thus, to allow greater durability of cells and promote their insertion into the energy market, it is necessary to decrease the working temperature.
To achieve this objective, many researchers have focused on the use of ceria-based compounds as the electrolyte material. In rare-earth-doped ceria, oxygen vacancies are introduced by the substitution of Cerium with a trivalent element resulting in high mobility of oxygen ions and, thus, high ionic conductivity, even at 600 °C [5,6]. This ionic conductivity is strongly affected by dopant concentration, oxygen vacancies and local structure defects [7]. Among the different doped ceria, Ce0.8Gd0.2O2−δ (GDC) and Ce0.8Sm0.2O2−δ (SDC) have attracted much attention [8,9,10]. However, Sm3+, which has an ionic radius very close to Ce4+, promotes less structural distortion, and thus more phase stability [4]. Furthermore, Sm-doped ceria (Ce0.8Sm0.2O2−δ noted SDC) exhibit an ionic conductivity higher than 10−2 S·cm−1 at 600 °C [11,12]. Due to this high value, SDC is one of the most promising electrolytes for intermediate temperature solid oxide fuel cell (IT-SOFC) [13,14,15].
The anode part of the cell is the side of the Hydrogen Oxidation Reaction (HOR). NiO, reduced in situ into Ni and combined with electrolyte, is currently the most used anode material [16]. Other metals such as Co, Fe, Ru and Cu have been investigated in the past decades; however, Ni is still the most suitable metal due to its excellent catalytic activity regarding the HOR [17]. In addition, Ni exhibits good electrical conductivity, a thermal expansion coefficient similar to SDC and a price significantly lower than the other candidates [18].
On the cathode side, reducing the operating temperature leads to an inevitable drop in cell performance, particularly due to the less efficient Oxygen Reduction Reaction (ORR) [19,20]. One of the strategies to improve ORR at intermediate temperatures is the use of Mixed Ionic Electronic Conductors (MIEC) such as Sm0.5Sr0.5CoO3−δ (SSC) and La0.6Sr0.4Co0.2Fe0.8O3−δ (LSCF) [21,22]. However, SSC cannot be used as the cathode with SDC electrolyte due to a strong thermal expansion coefficient mismatch (~12 × 10−6 K−1 for SDC and ~24 × 10−6 K−1 for SSC) [23]. By comparison, LSCF exhibits an acceptable thermal expansion coefficient of 15.4 × 10⁻⁶ K−1 for utilization with SDC electrolyte [24]. The main drawback of LSCF is the strontium segregation occurring during sintering or under cell operation conditions [25,26,27,28,29].
In addition to lowering the operating temperature, a second important objective to be pursued is the use of low-cost and easily scalable manufacturing methods. The tape casting technique is widely recognized as one of the most promising fabrication processes [30]. The most frequently used method is indeed tape casting for the fabrication of the anode-electrolyte half-cell, followed by co-sintering at approximately 1400 °C. Finally, the cathode layer is deposited on the top of the half-cell and sintered at 1000–1200 °C [31]. This double thermal treatment increases the possibility of generating cation diffusion across interfaces, resulting in variation of chemical structure, formation of new resisting phases [32,33] or even delamination of the layers [34].
In this work, a NiO-SDC//SDC//LSCF cell was fabricated by co-tape casting and co-sintering procedures. The evolution of the SDC–LSCF interface after cell manufacturing and 40 h of operation was investigated. The novel methodology presented in this study consists of a microstructural and bulk chemistry analysis prior to a selective dissolution of the cathode layer in order to study the cathode–electrolyte interface by surface chemistry characterization.

2. Materials and Methods

Cells were fabricated by a co-tape casting process followed by a single step sintering to enhance the adhesion between the different layers. All the starting powders were provided by fuel cell materials (FCM, Ohio, USA). Ce0.8Sm0.2O2−δ, referred to as SDC (Ref: SDC20-N, Lot #9C007, Item #111202, surf. area 201.3 m2·g−1), was used for the electrolyte material, mixed NiO-Ce0.8Sm0.2O2−δ, referred to as NiO-SDC (Ref: NISDC-P Lot #BD105, Item #121205, surf. area 5.8 m2·g−1), was chosen for the anode material, and LSCF corresponding to (La0.6Sr0.4)0.95Co0.2Fe0.8O3−δ (Ref: LSCF-P, Lot #BD105, Item #121205, surf. area 5.8 m2·g−1) was used for the cathode material. The commercial SDC powder was not suitable for tape casting due to its high specific surface; a thermal treatment at 800 °C was thus applied to reach a specific surface of 18 m2·g−1.
Complete cells were composed of five layers: NiO-SDC with pore former (graphite) as the anode, NiO-SDC without pore former as the anode functional layer (denoted AFL), SDC as the electrolyte, LSCF-SDC without pore former as the cathode functional layer (denoted CFL) and LSCF with pore former (graphite) as the cathode. Slurries were prepared by the following procedure: ceramic powder and eventually carbon graphite as pore-former were mixed with ethanol and methyl ethyl ketone (MEK) as solvents and triethanolamine (TEA) as the dispersant. This preparation was mixed in a Turbula-T2F device (Willy A. Bachofen AG Group, Muttenz, Switzerland) for 16 h. In the second step, polyvinyl butyral (PVB) as the binder and polyethylene glycol (PEG) and benzylbutyl phthalate (BBP) as plasticizers were added to the preparation and ball milled for 24 h. Quantities used for each slurry are given in Table 1.
The cathode slurry was firstly tape casted on a glass plate using an automatic tape caster Elcometer 4340 (Elcometer, Manchester, UK) at a casting rate of 1 cm·s−1. The blade gap thickness was fixed by taking into account the sintering shrinkage. The cathode layer was air-dried at room temperature for half an hour before the cathode functional layer was tape casted above. After a drying period of 1 h, the tape was punch-cut to the desired dimensions, 18 mm in diameter, before the electrolyte layer was directly tape casted onto. After a new period of drying, the anode functional layer was deposited, always by the same method. The last step consisted of the anode, which was tape casted after a final period of drying. The complete cell was co-sintered at 1380 °C for 5 h at a heating and cooling rate of 1 °C per minute; two hours isothermal at 300 °C was applied to eliminate binder and plasticizers. The final size of the cell was 22 mm in diameter with a cathode of 16 mm in diameter.
Electrochemical Impedance Spectroscopy (EIS) measurements were performed using an Autolab PGSTAT302N, the sample being placed in a Norecs ProboStat during the analysis. Obtained impedance spectra were fitted using Nova software (Version 2.1, Kanaalweg, Netherlands). After electrical measurements, a selective dissolution of the cathode was carried out, consisting of HCl 6M chemical etching for 20 min at room temperature.
The microstructure and chemical composition analysis were investigated by scanning electron microscopy (SEM) on a Hitachi SU1510 coupled with a Bruker XFlash6I10 energy-dispersive X-ray (EDX) analyzer. Low incidence X-ray diffraction was performed on a Bruker D8 Discover using a Cu Kα source and a Lynxeye XE detector; the incident angle was 2°. The obtained XRD pattern was refined by the Rietveld method using Fullprof software (Version 2.0, Saclay, France). X-ray photoelectron spectroscopy (XPS) was carried out on a XPS PHI 5000 VersaProbe with a monochromatized Al Kα1 source (1486.7 eV). All the binding energies were calibrated from the C 1s of the adventitious carbon peak at 284.8 eV. Casa XPS software (Version 2.3.23, Teignmouth, UK) was used for data processing.

3. Results

3.1. Impedance Measurements

The complete cell sintered at 1380 °C was tested by EIS from 105 Hz to 10−1 Hz with an amplitude of 50 mV at 550 °C. The cell was fed by air at a pressure of 1.6 bar (6 L·h−1) to the cathode side and by H2 at a pressure of 1.25 bar (6 L·h−1) at the anode side for the entire duration of testing (40 h). Figure 1a shows the evolution of the Nyquist plots at 550 °C over time. All spectra exhibited a similar shape, i.e., a short inductive tail, characteristic of electrical wires and cables, followed by two overlapped semi-circles at high and medium frequencies (hf and mf) and a partial semicircle at low frequencies (lf). Experimental data were fitted using the equivalent circuit presented in Figure 1a and the fitted elements are listed in Table 2. This circuit gave a reasonable fitting (less than 10% error) over the whole range of aging spectra. The time constants (denoted as τhf, τmf and τlf) were calculated using the frequency at the maximum value of the impedance’s imaginary part, and are highlighted in the Bode plot in Figure 1b. The intercept at high frequency with the real axis corresponds to the ohmic resistance (noted RΩ), mainly related to the electrolyte. The evolution of the resistances over the time are presented in Figure 1c.
The experimental conditions were not adjusted in order to separate the contributions related to anode and cathode, respectively, by the variation of different partial pressures of fed gases. However, as determined in previous investigations by the authors, it can be assumed that the wide resistance arc at low frequencies is related to the oxygen reduction reaction at the cathode side, while the process at intermediate frequencies (around 102 Hz) can be associated with the anode kinetics [35]. Starting from the parameters obtained by equivalent circuit analysis, as reported in Table 2, the capacitance from CPE values was calculated according to the relation proposed by Musiani et al. [36], and the results are given in Table 3. An order of magnitude of 10−2 F·cm−2 was obtained for the low frequency capacitance (three orders of magnitude higher than the calculated hf capacitance). Such a large value can be actually related to chemical capacitance, corresponding to the charge stored as oxygen vacancies in the cathode bulk [12,37,38]. Considering that the activity of LSCF is also hindered by its limited oxygen surface exchange [39], these findings give additional support for the low frequency arc to be attributed to the cathodic process.
The values of the resistances presented in Table 2 are relatively high in comparison with the results from Liu et al. at 550 °C [40]. An explanation of such high values will be given in the discussion section. CPE exponential values at low frequencies indicated a capacitive behavior, while values approaching 0.5 highlighted a diffusion-related behavior [41].
Looking at the trends of the complex plots (Figure 1a) and of the Bode plots (Figure 1c), it is apparent that all resistances increased over time. The greatest contribution to the global polarization resistance Rp derived from the low frequency process (Rlf, evident in Figure 1b), while the one that underwent the greatest increment (450%) was the resistance at high frequencies (Rhf), which is associated with charge transfer at the cathode/electrolyte interface.
According to these considerations, the microstructural investigation contributes to shed light on the degradation mechanism both at the cathode–electrolyte interface and in the bulk cathode itself, as detailed in the following paragraphs.

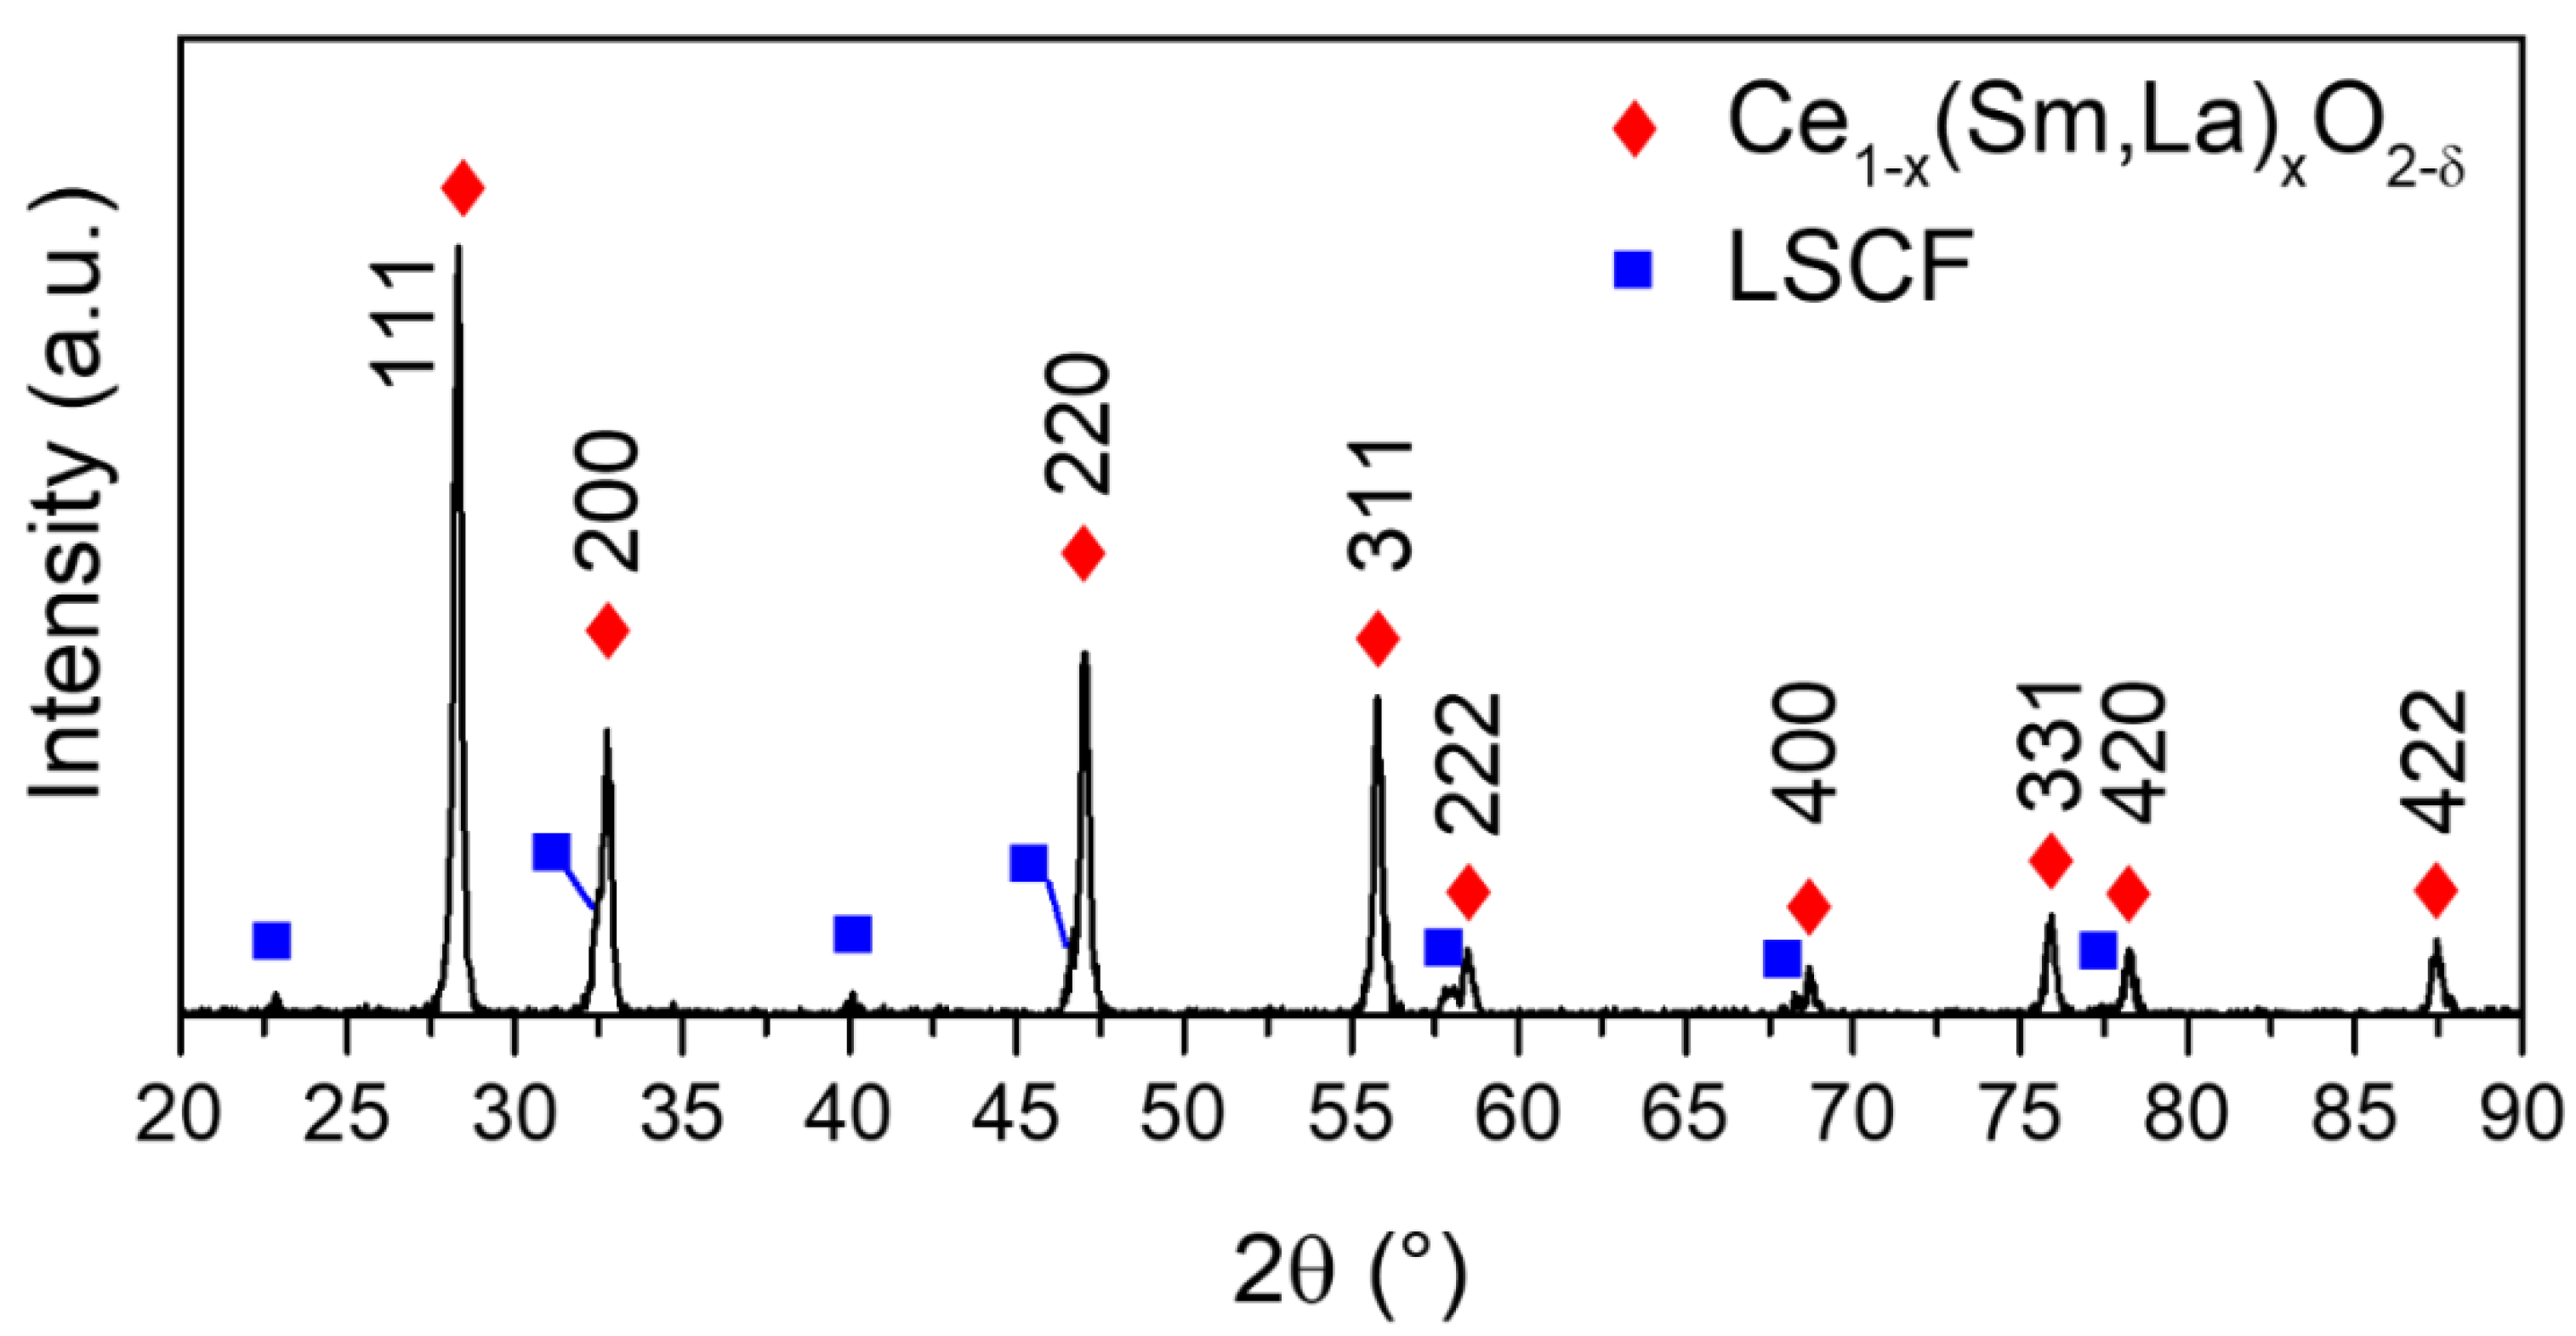
3.2. Microstructural Investigations and Bulk Chemistry Analysis

The interface between the cathode (dark grey) and the electrolyte (light grey) after co-sintering at 1380 °C (Figure 2a) and after co-sintering at 1380 °C and testing 40 h at 550 °C (Figure 2b) was examined by SEM micrograph in Back Scattered Electrons (BSE) mode. The EDX mappings are also reported in order to show the distribution of the elements The studied area is the cathode on which the electrolyte layer was deposited, viewed from above. The elemental content evolution on either side of the cathode–electrolyte interface is exhibited in Figure 3a for the tested sample and on Figure 3b for the non–tested sample. The surface of the tested cell appeared highly densified whereas the cell without electrical testing exhibited a porous microstructure. It is assumed that the tested cell underwent dramatic grain growth in this part of the sample. As shown in the micrograph at the top of Figure 3a, the rest of the tested sample was not as well densified. As presented on the EDX mappings, for both samples, Ce and Sm were uniformly distributed in the electrolyte layer. The cathode–electrolyte interface was very sharp for Ce whereas it was more diffused for Sm. La and Fe were also well dispersed within the cathode layer with a sharp cathode–electrolyte separation for Fe. Little Co appeared in the cathode layer. Additionally, some Sr-rich or Sr-depleted areas were observed in both samples.
The evolution of the content (at%) of the elements (La, Sr, Co, Fe, Ce and Sm) in the cathode and electrolyte layers depending on the distance from the interface after 40 h of cell testing is shown in Figure 3a. Only cation-related signals recorded are reported. EDX measurements were acquired at each cross on the SEM-BSE micrograph inserted at the top of the figures. Content variations of La, Sr and Fe were observed in the cathode layer. For the following interpretation, La and Sr are assumed to occupy to the A-site of the perovskite whereas Fe and Co to belong to the B-site. The A-site/B-site ratio ranged from 0.95 to 1.16, which is higher than the theoretical value of 0.95. The La/A-site ratio was also higher than the expected value of 0.60, varying from 0.67 to 0.78 with an average value of 0.72, while the Co/B-site ratio was much lower than the theoretical value of 0.20, ranging from 0.01 to 0.05. In the electrolyte layer, Ce and Sm contents were stable, reaching a Sm/(Ce + Sm) ratio of 0.19 ± 0.01, close to the 0.20 theoretical value. Lanthanum was also detected in the electrolyte layer up to a distance of 8 µm, while significant amounts of Sm and Ce were observed in the cathode layer up to a distance of 7 µm.
Considering the size of the cations, 0.97 Å for Ce4+ and 1.079 Å Sm3+ in cubic site, La3+ (ionic radius of 1.16 Å in cubic site) could not easily occupy the cationic site of the ceria structure [42]. However, the substitution of Ce4+ with Sm3+ creates oxygen vacancies and therefore enhances the reduction of Ce4+ into Ce3+, which has an ionic radius of 1.143 Å [43,44]. In that configuration, depending on the reduction of cerium, La3+ could substitute for Ce3+ in the structure. Several authors have studied the incorporation of La into SDC; for example, Giannici et al. highlighted a diffusion up to 30% at 1150 °C while Chang et al. noticed a diffusion of La into SDC up to 15% at 1000 °C [33,45].
The A-site of the perovskite (12-coordinate site), occupied by La3+ and Sr2+ with ionic radii of 1.36 Å and 1.44 Å, can also host Sm3+ and Ce4+ ions, which have ionic radii of 1.24 Å and 1.14 Å respectively in the 12-coordinate environment [42]. Moreover, Sm presents a good chemical affinity with Sr and Fe, as evidenced by the Sm0.5Sr0.5FeO3−δ compounds [46], and Ce can also be incorporated into the LSCF structure as highlighted in the La0.54Ce0.06Sr0.4Co0.2Fe0.8O3−δ compound [47].
In order to investigate the origin of the cationic diffusion, i.e., during co-sintering or during cell operation, another cell, elaborated by the same procedure and co-sintered at 1380 °C without any electrochemical testing, was studied by SEM-EDX. Figure 3b shows the elements’ content evolution as a function of the distance from the cathode–electrolyte interface. In the cathode layer, La, Fe and Co contents were more stable than in the tested sample, the Sr amount showed important variation, and Ce and Sm were detected up to a distance of 5 µm. The (La + Sr)/(Co + Fe) ratio was 1.04 ± 0.05; La/A-site ratio was 0.62 ± 0.03, not far from the theoretical value; and the Co/B-site was a little larger than the tested sample and is equal to 0.07 ± 0.02. In the electrolyte, Ce and Sm had the same profile as the tested sample, the Sm/(Ce + Sm) was 0.18 ± 0.01 and lanthanum was detected in a significant amount up to a distance of 7 µm.

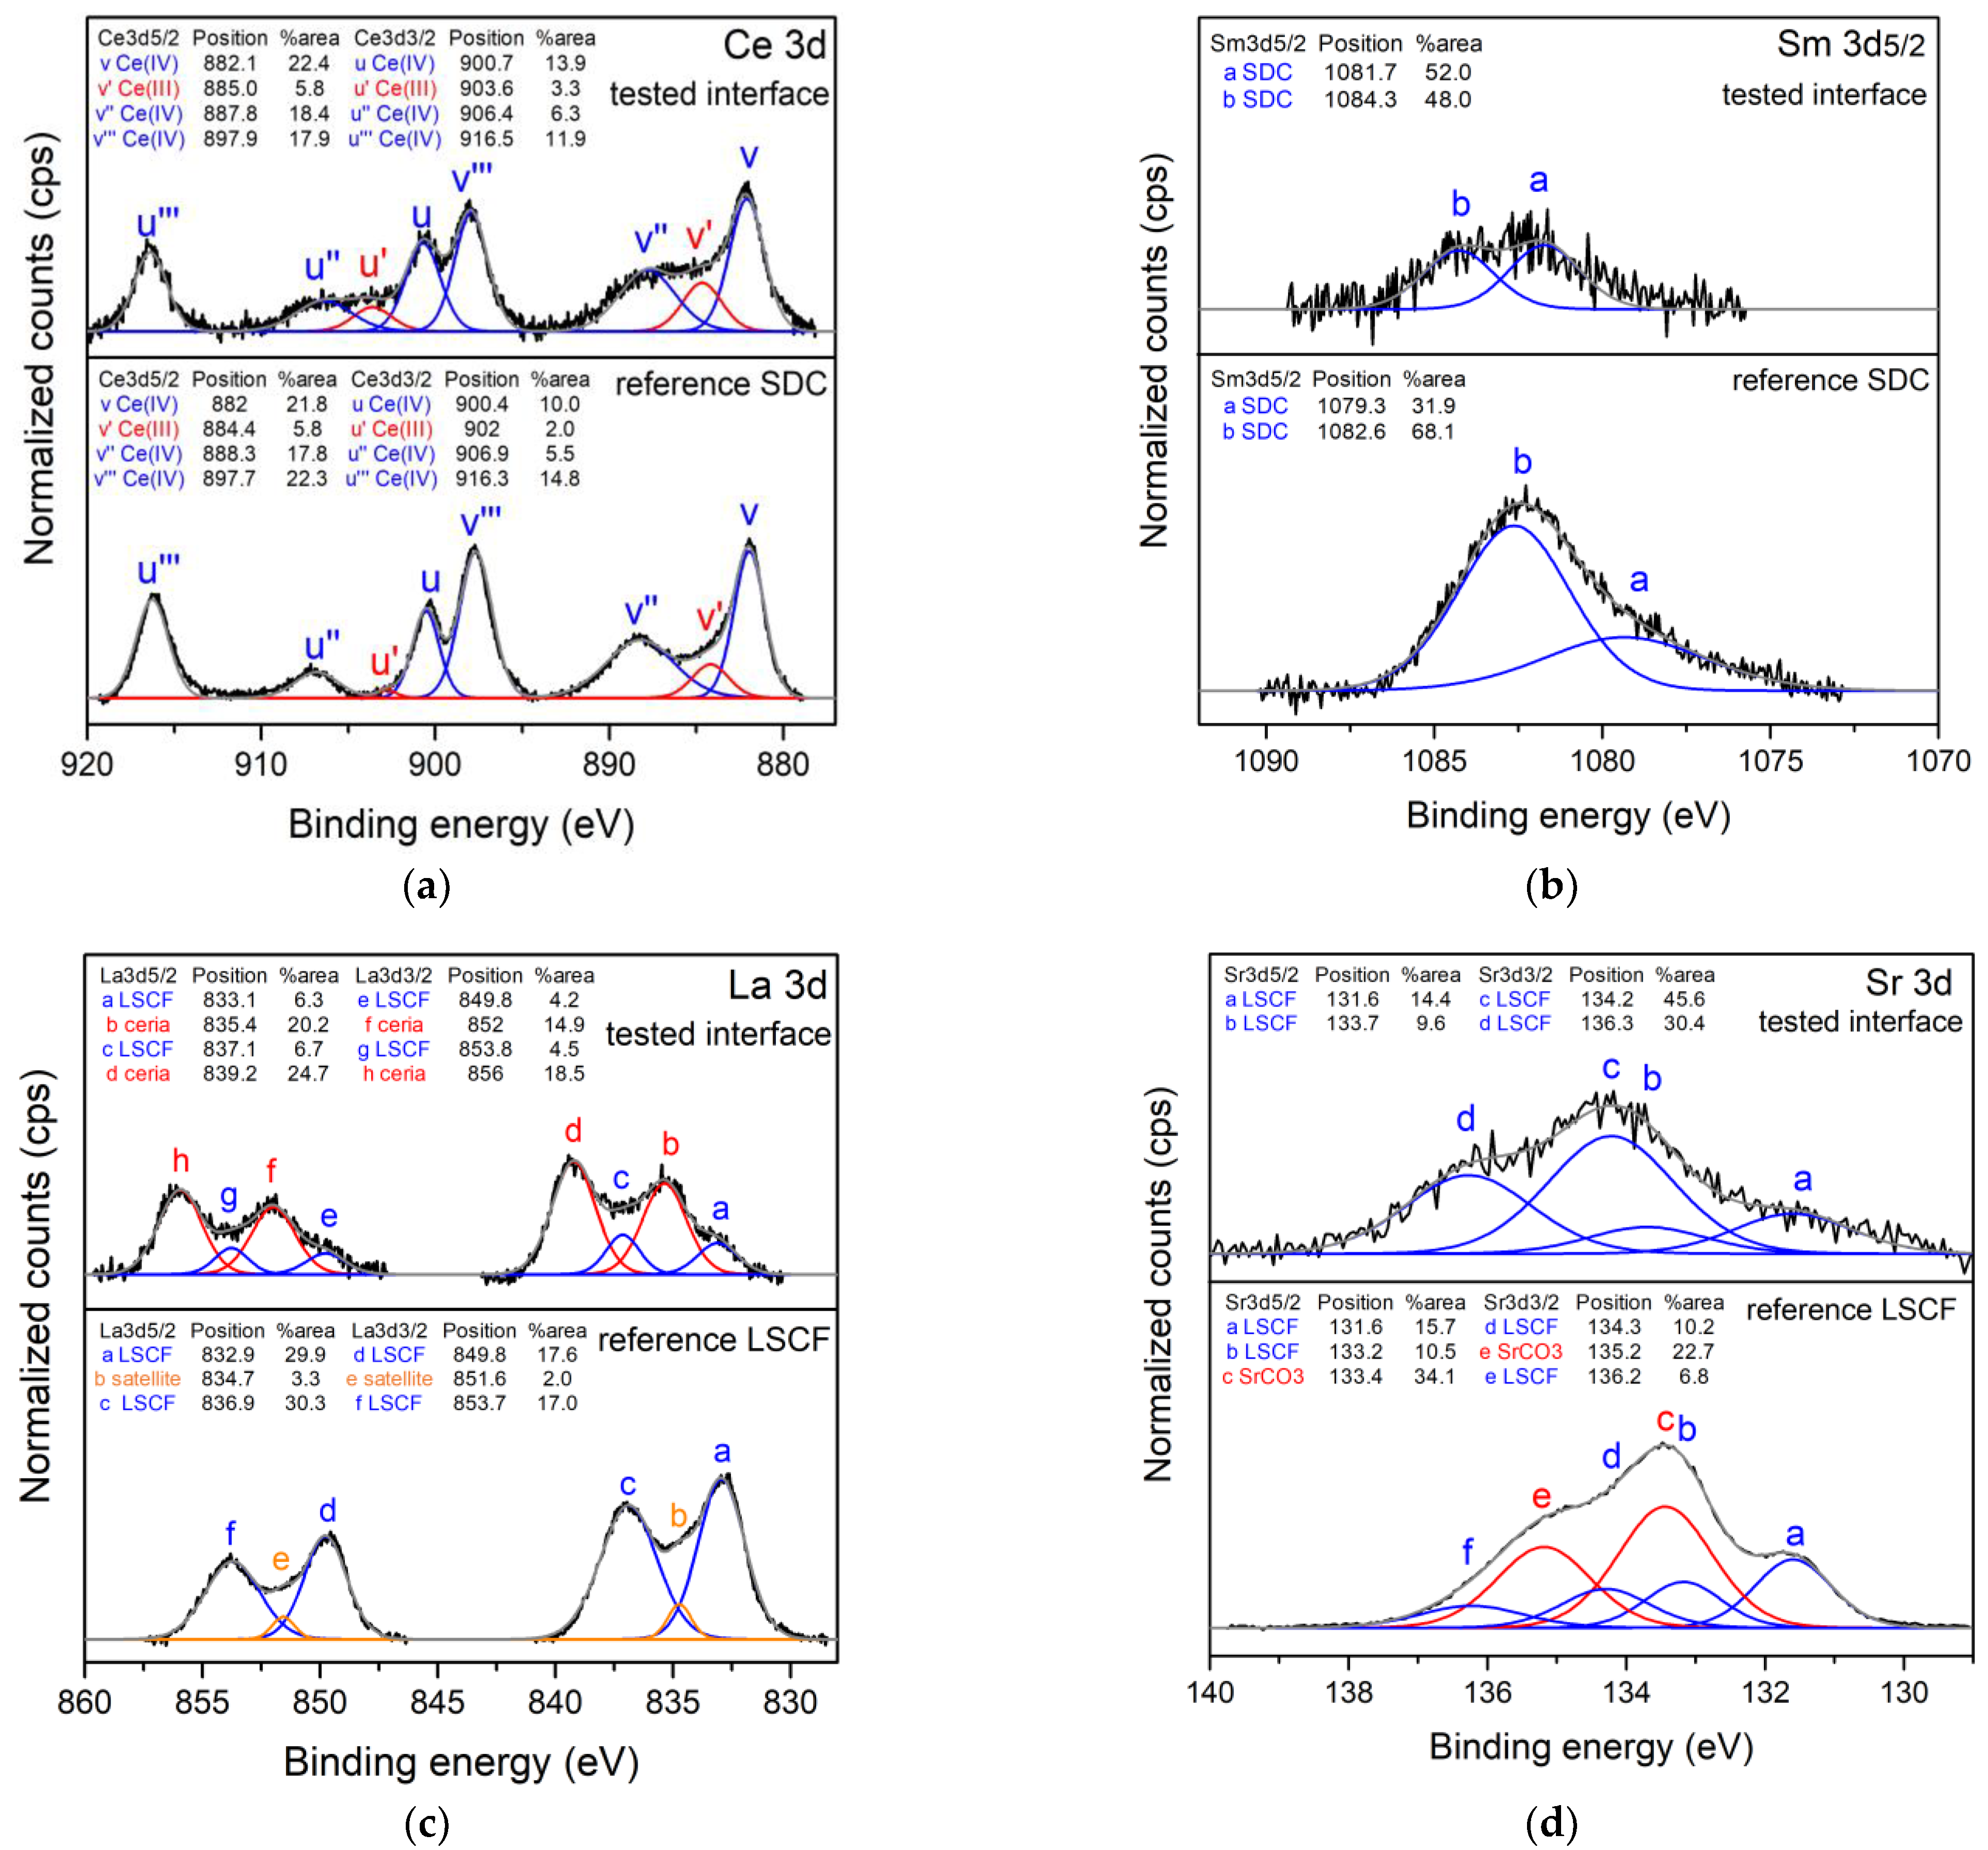
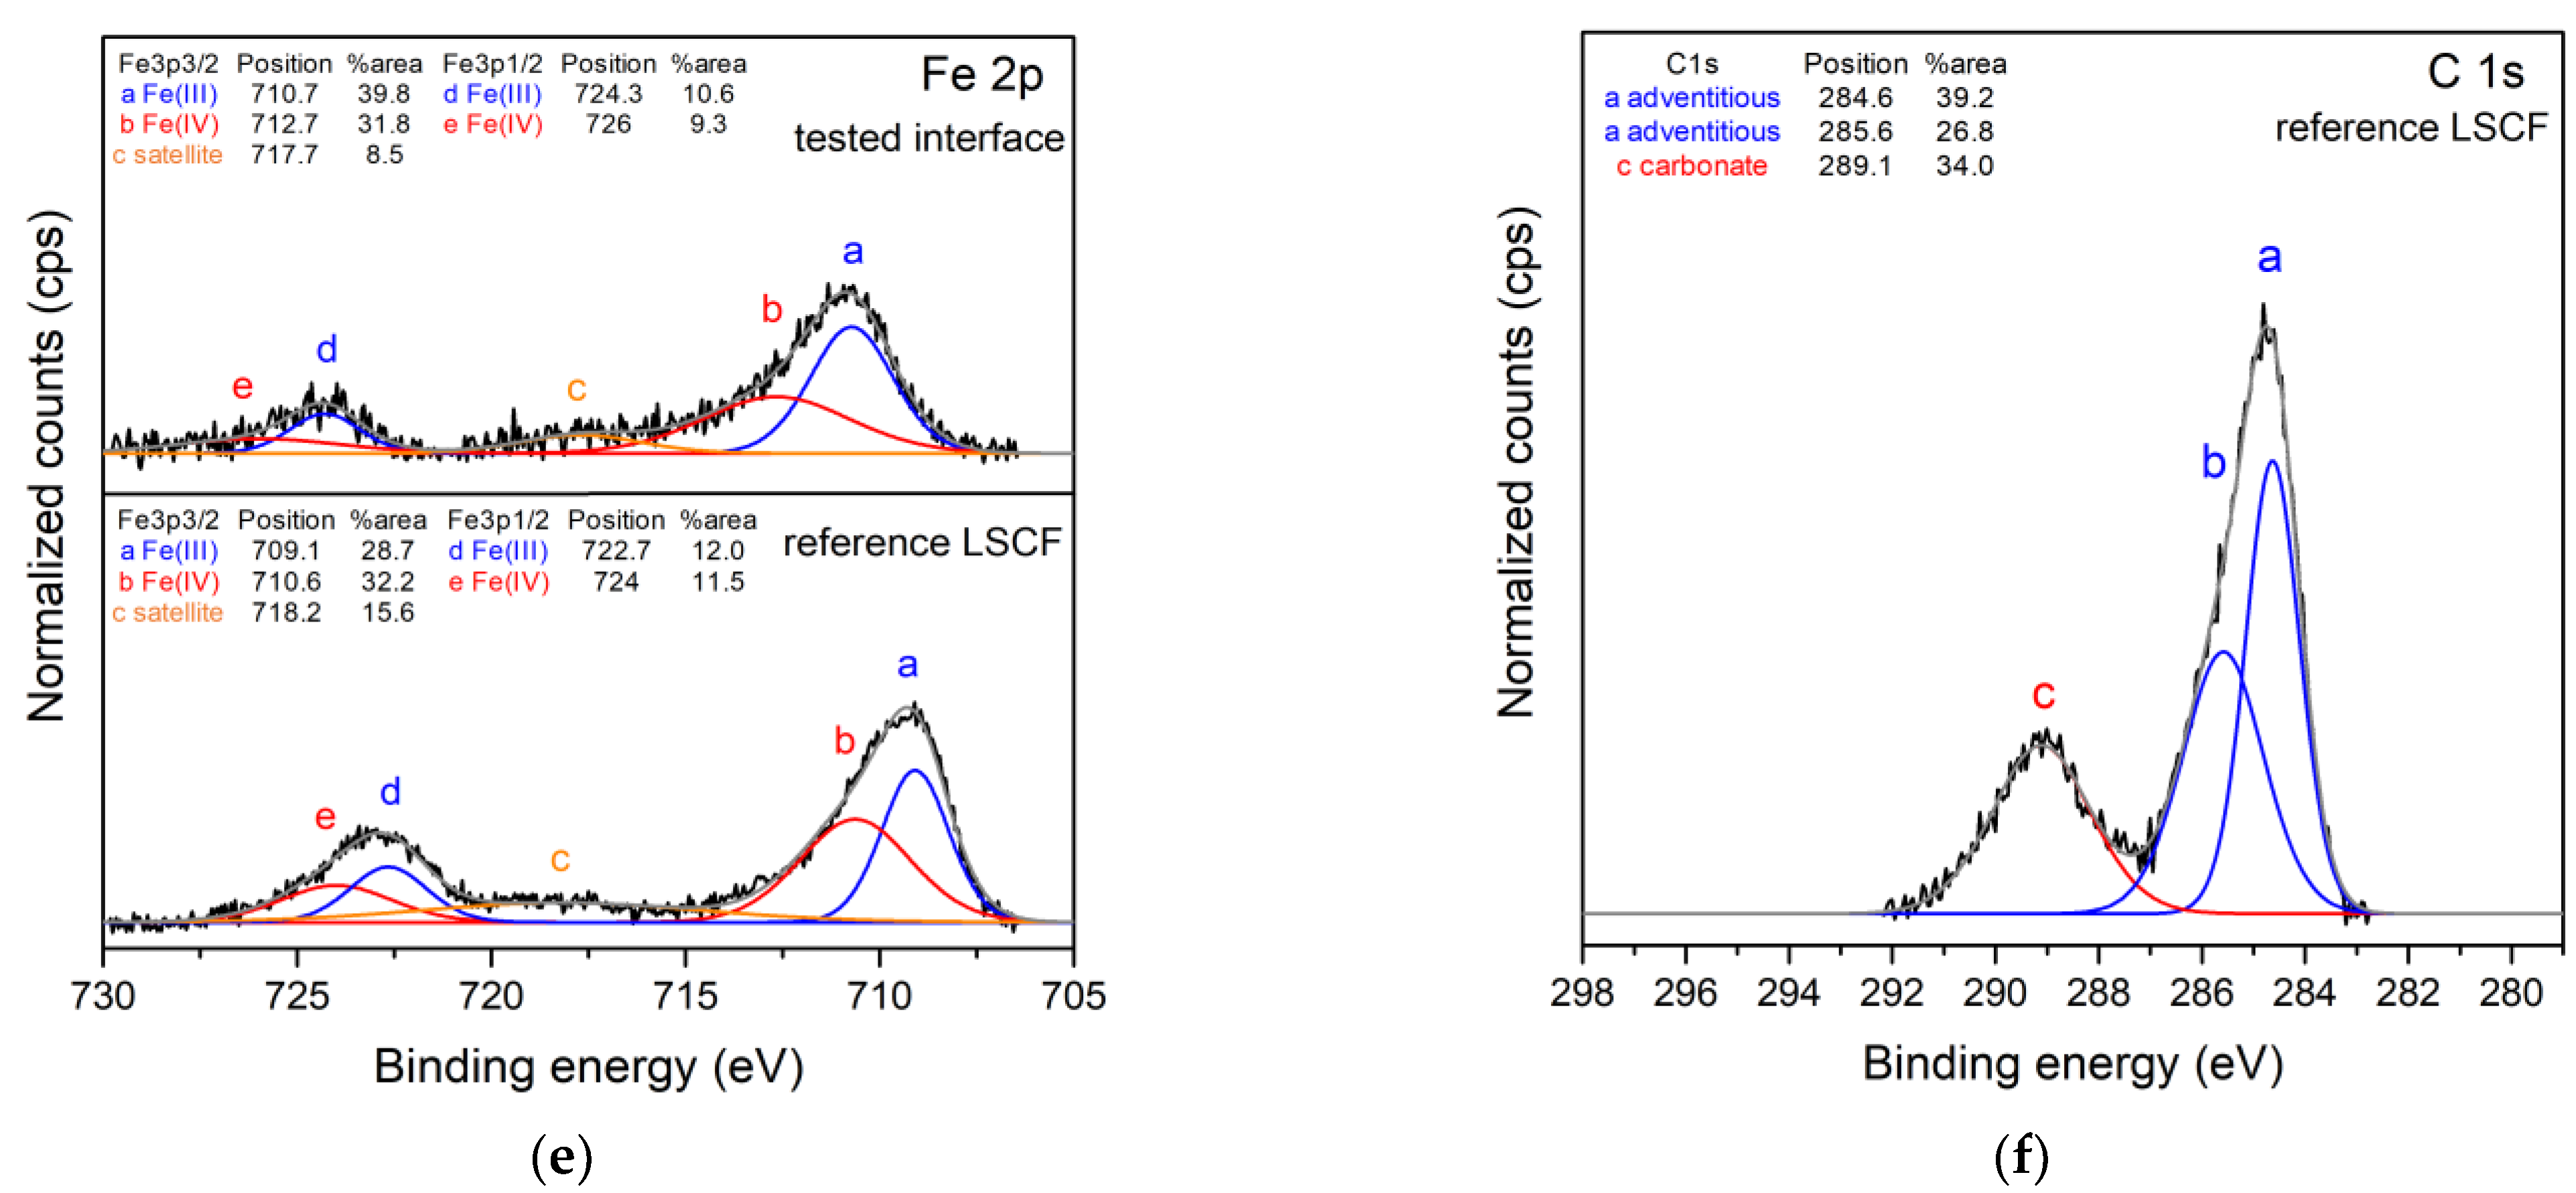
3.3. Structural and Surface Chemistry Analysis

In order to study the SDC–LSCF interface, the cathode layer was selectively dissolved in HCl after cell testing. Figure 4 exhibits the SEM-BSE micrograph of the cathode–electrolyte microstructure interface after the selective dissolution of the cathode. The light area represents SDC grains while the dark clusters correspond to LSCF grains that were not totally dissolved.
The low incidence angle X-ray diffractogram of the cathode–electrolyte interface after the selective dissolution of LSCF is reported in Figure 5. The major phase obtained was a cubic fluorite structure with a Fm-3m space group corresponding to the doped ceria phase; since LSCF was not totally dissolved, traces of perovskite were also detected. Rietveld refinement was performed on the diffractogram and is presented in supplementary Materials (Figure S1). The refined lattice parameter of the doped ceria phase was 5.465 Å. As a comparison, X-ray diffraction was also carried out on the same sample on the electrolyte area 2 mm far from the cathode layer. The refined lattice parameter was 5.426 Å, similar to the 5.432 Å obtained by Mandal et al. for Ce0.8Sm0.2O1.9 (ICDD 04-013-0036) [48]. The increase in the lattice parameter of the ceria structure at the cathode–electrolyte interface cannot be imputed to defects generated by the sintering step and evidences the co-doping of cerium by lanthanum and samarium doped Ce1-x(Sm,La)xO2−δ, denoted LSDC. The LSCF phase can either be cubic perovskite (space group Pm-3m) or rhombohedral perovskite (space group R-3c) [49,50]. As presented in supplementary saterials, where the XRD pattern of the raw LSCF powder is shown (Figure S2), the rhombohedral structure presented a separation of the peak, which is clearly visible at 68°. In the diffractogram presented in Figure 5, this separation is not clearly visible (zoom of 66–70° part of the diffractogram is presented in Supplementary Materials in Figure S3). Therefore, the LSCF after co-sintering and cell testing is assumed to be cubic perovskite. The refined lattice parameter of the cubic LSCF phase was 3.8896 Å; as a comparison, Hardy et al. obtained a cubic lattice parameter of 3.9250 Å [51]. The lower value of the lattice parameter obtained is consistent with the ex-solution of Sr and the diffusion of La. The low amount of Sm and Ce diffusion into the LSCF structure resulted in a decrease in the lattice parameter.
Two areas were selected for XPS surface chemistry analyses, one corresponding to the cathode–electrolyte interface (denoted tested interface) and one corresponding to the electrolyte area which is not in contact with LSCF material (denoted reference SDC). Furthermore, another cell sintered at 1380 °C without any electrochemical testing was analyzed to give a reference for the LSCF layer. The elemental content of each area obtained is presented in Table 4. Compared to the theoretical composition, oxygen was more present than expected, due to adventitious oxygen such as OH, C-O and O-C=O bonding. The obtained Sm/(Ce + Sm) ratios for the tested interface and for the reference SDC were both 0.18, not far from the theoretical value of 0.20. In the reference LSCF, the ratio La/A-site was 0.23, almost three times lower than the expected 0.6, suggesting a Sr-rich phase at the extreme surface of the cathode. Due to interference with iron characteristic peaks, cobalt was excluded from the analysis.
Figure 6 shows the Ce 3d (Figure 6a) and Sm 3d5/2 (Figure 6b) core-level spectra of the tested interface and reference SDC and the La 3d (Figure 6c), Sr 3d (Figure 6d) and Fe 2p (Figure 6e) core-level spectra of both the tested interface and reference LSCF. Furthermore, the C 1s spectrum (Figure 6f) of the reference LSCF is also presented in Figure 6. The Ce 3d spectra, typical of a ceria environment, can be decomposed into four spin–orbit components. The peaks labeled v and u refer to 3d5/2 and 3d3/2 spin–orbit components respectively. The peaks denoted v, v″, v‴, u, u″ and u‴ are characteristic of Ce ions in the +IV oxidation state, while the v′ and u′ peaks correspond to cerium ions in the +III oxidation state [52,53,54]. Both samples exhibited Ce4+ and Ce3+ characteristic peaks. The percentage of reduced cerium ion can be obtained by summing the relative area of the v′ and u′ peaks. The obtained %Ce3+ were 7.8% and 12.9% for the reference SDC and the tested area, respectively. Several studies showed that lanthanum incorporation into the ceria structure promotes the reduction of Ce4+ into Ce3+ [55,56]. Thus, the higher concentration of Ce3+ in the tested area can be attributed to lanthanum incorporation into the ceria structure. The Sm 3d5/2 core level spectra exhibited two peaks at 1079.3 eV and 1082.6 eV for the reference SDC and 1081.7 eV and 1084.3 eV for the tested interface. The contribution at high binding energy for the two samples corresponds to Sm in the +III oxidation state while the one at 1079.1 eV corresponds to charge transfer of the unpaired 4f electron [52,57,58]. The coordination number induces a chemical shift of the binding energy [59,60,61,62], however, the Sm 3d5/2 spectrum of the tested interface was too noisy to separate the contributions of Sm3+ from SDC and Sm3+ from LSCF. The La 3d spectra presented well separated spin–orbit components and each spin–orbit component was split into doublets. The degree of splitting and the position of the doublet allow the determination of the element’s chemical environment [63,64]. In the case of the reference LSCF, the doublet at 832.9 eV showed a split of 3.9 eV corresponding to LSCF [65,66]. A satellite component was added to fit the asymmetric shape of the doublet [67]. The tested interface presented two doublets, suggesting two different chemical environments. The doublet at the lower binding energy (833.1 eV) with a split of 4.0 eV is attributed to LSCF that was not totally dissolved. The second doublet at 835.4 eV had a split of 3.9 eV. By taking into account the previous deduction concerning La diffusion, the second doublet is assigned to lanthanum in the ceria environment. The classical figure of Sr 3d spectra in LSCF exhibits two contributions, the one at low binding energy corresponding to the bulk and the one at high binding energy corresponding to the surface [68,69,70]. Thus, for the tested interface, the doublet at 131.6 eV was attributed to the bulk component and the doublet at 134.2 eV to the surface component. However, the reference LSCF could not be fitted by only two spin–orbit components. A third contribution at 133.4 eV was added to fit the spectra. According to the literature, this contribution is assigned to strontium carbonate [71,72]. This assignment is supported by the C 1s core-level spectra of reference LSCF, which exhibited a peak at 289.1 eV, well corresponding to strontium carbonate. Thus, the strontium-rich areas highlighted by EDX mappings correspond to SrCO3. During the selective dissolution of the cathode, SrCO3 was also dissolved, resulting in only two contributions of Sr in LSCF in the Sr 3d window of the tested interface. The Fe 2p presented well separated spin–orbit components and a satellite. The two samples present the classical figure of iron from LSCF, where each spin–orbit component can be fitted by two contributions, the one at low binding energy corresponding to iron +III oxidation state while the one at higher binding energy belongs to iron +IV oxidation state [50,73,74].

4. Discussion

The two chemical behaviors, the strontium segregation and the lanthanum diffusion towards SDC, highlighted in this study are depicted in Figure 7. As investigated by several authors, Sr segregation generally occurs during cell operation and long-term testing. For example, Simner et al. pointed out a significant performance degradation at 750 °C/0.7 V after 500 h due to Sr segregation [27]. Wang et al. highlighted a tremendous increase in Sr-rich areas after cell testing at 800 °C/OCV for 800 h [75]. In this work, a massive increase in the cathodic polarization resistance was found after only 40 h of cell operation. As suggested by Kubicek et al. and Dai et al., this rapid degradation is caused by the high temperature sintering [76,77]. According to the XPS results, the strontium segregated into SrCO3, consisting of SrO formation at high temperature followed by carbonation after returning to room temperature. The degradation of the cathode surface by SrCO3 resulted in a decrease in the ORR sites. This led to mass transfer process deterioration, i.e., oxygen surface adsorption and desorption and surface diffusion of the species, thus inducing an increase in the cathodic polarization resistance (Rlf) [78,79].
The La 3d XPS spectrum of the tested interface clearly indicated that lanthanum was present both in LSCF and in ceria. The La/(Ce + Sm + La) ratio in the electrolyte layer at 2.5 µm from the interface with LSCF obtained by EDX quantification was 0.04 after cell testing. Lanthanum was also detected in significant quantities in the electrolyte layer near the interface in the non-tested sample, indicating that lanthanum diffusion occurs mainly during sintering. Moreover, this diffusion is assumed to be mainly surface diffusion. The grain boundaries have more crystallographic defects than the bulk, implementing a facilitated pathway for cation diffusion [80]. Thus, cations diffuse preferentially through the grain boundaries; however, bulk diffusion is also possible, creating a concentration gradient from the grain boundaries to the bulk of the grain [81,82].
The high sintering temperature led to an increase in the mobility of cations, causing the interdiffusion of Ce and Sm from the electrolyte and La from the cathode. The La diffusion into the electrolyte led to the high RΩ resistance value highlighted in Table 2 due to the decrease in oxygen vacancies mobility and/or defect clustering as well as lattice strains [83,84]. Moreover, the increase in RΩ during cell testing suggests that the cation interdiffusion continued under operating conditions. On the other side, diffusion of both Sm and Ce into the cathode layer caused the slight increase in Rhf.
As highlighted before, Sr-segregation is widely reported, which is not the case for the diffusion of lanthanum. In the classical YSZ-based SOFC, an SDC or GDC layer is added as a diffusion barrier layer between YSZ and LSCF [85,86]. The results presented in this work suggest that GDC is more effective than SDC to hinder lanthanum ion diffusion.

5. Conclusions

Impedance measurement of a Ni-SDC//SDC//LSCF cell fabricated by a cost-effective process consisting of co-tape casting and co-sintering showed a strong degradation in performance after the first 40 h of operation. EDX and XPS observations evidence:
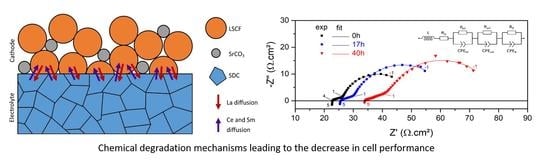
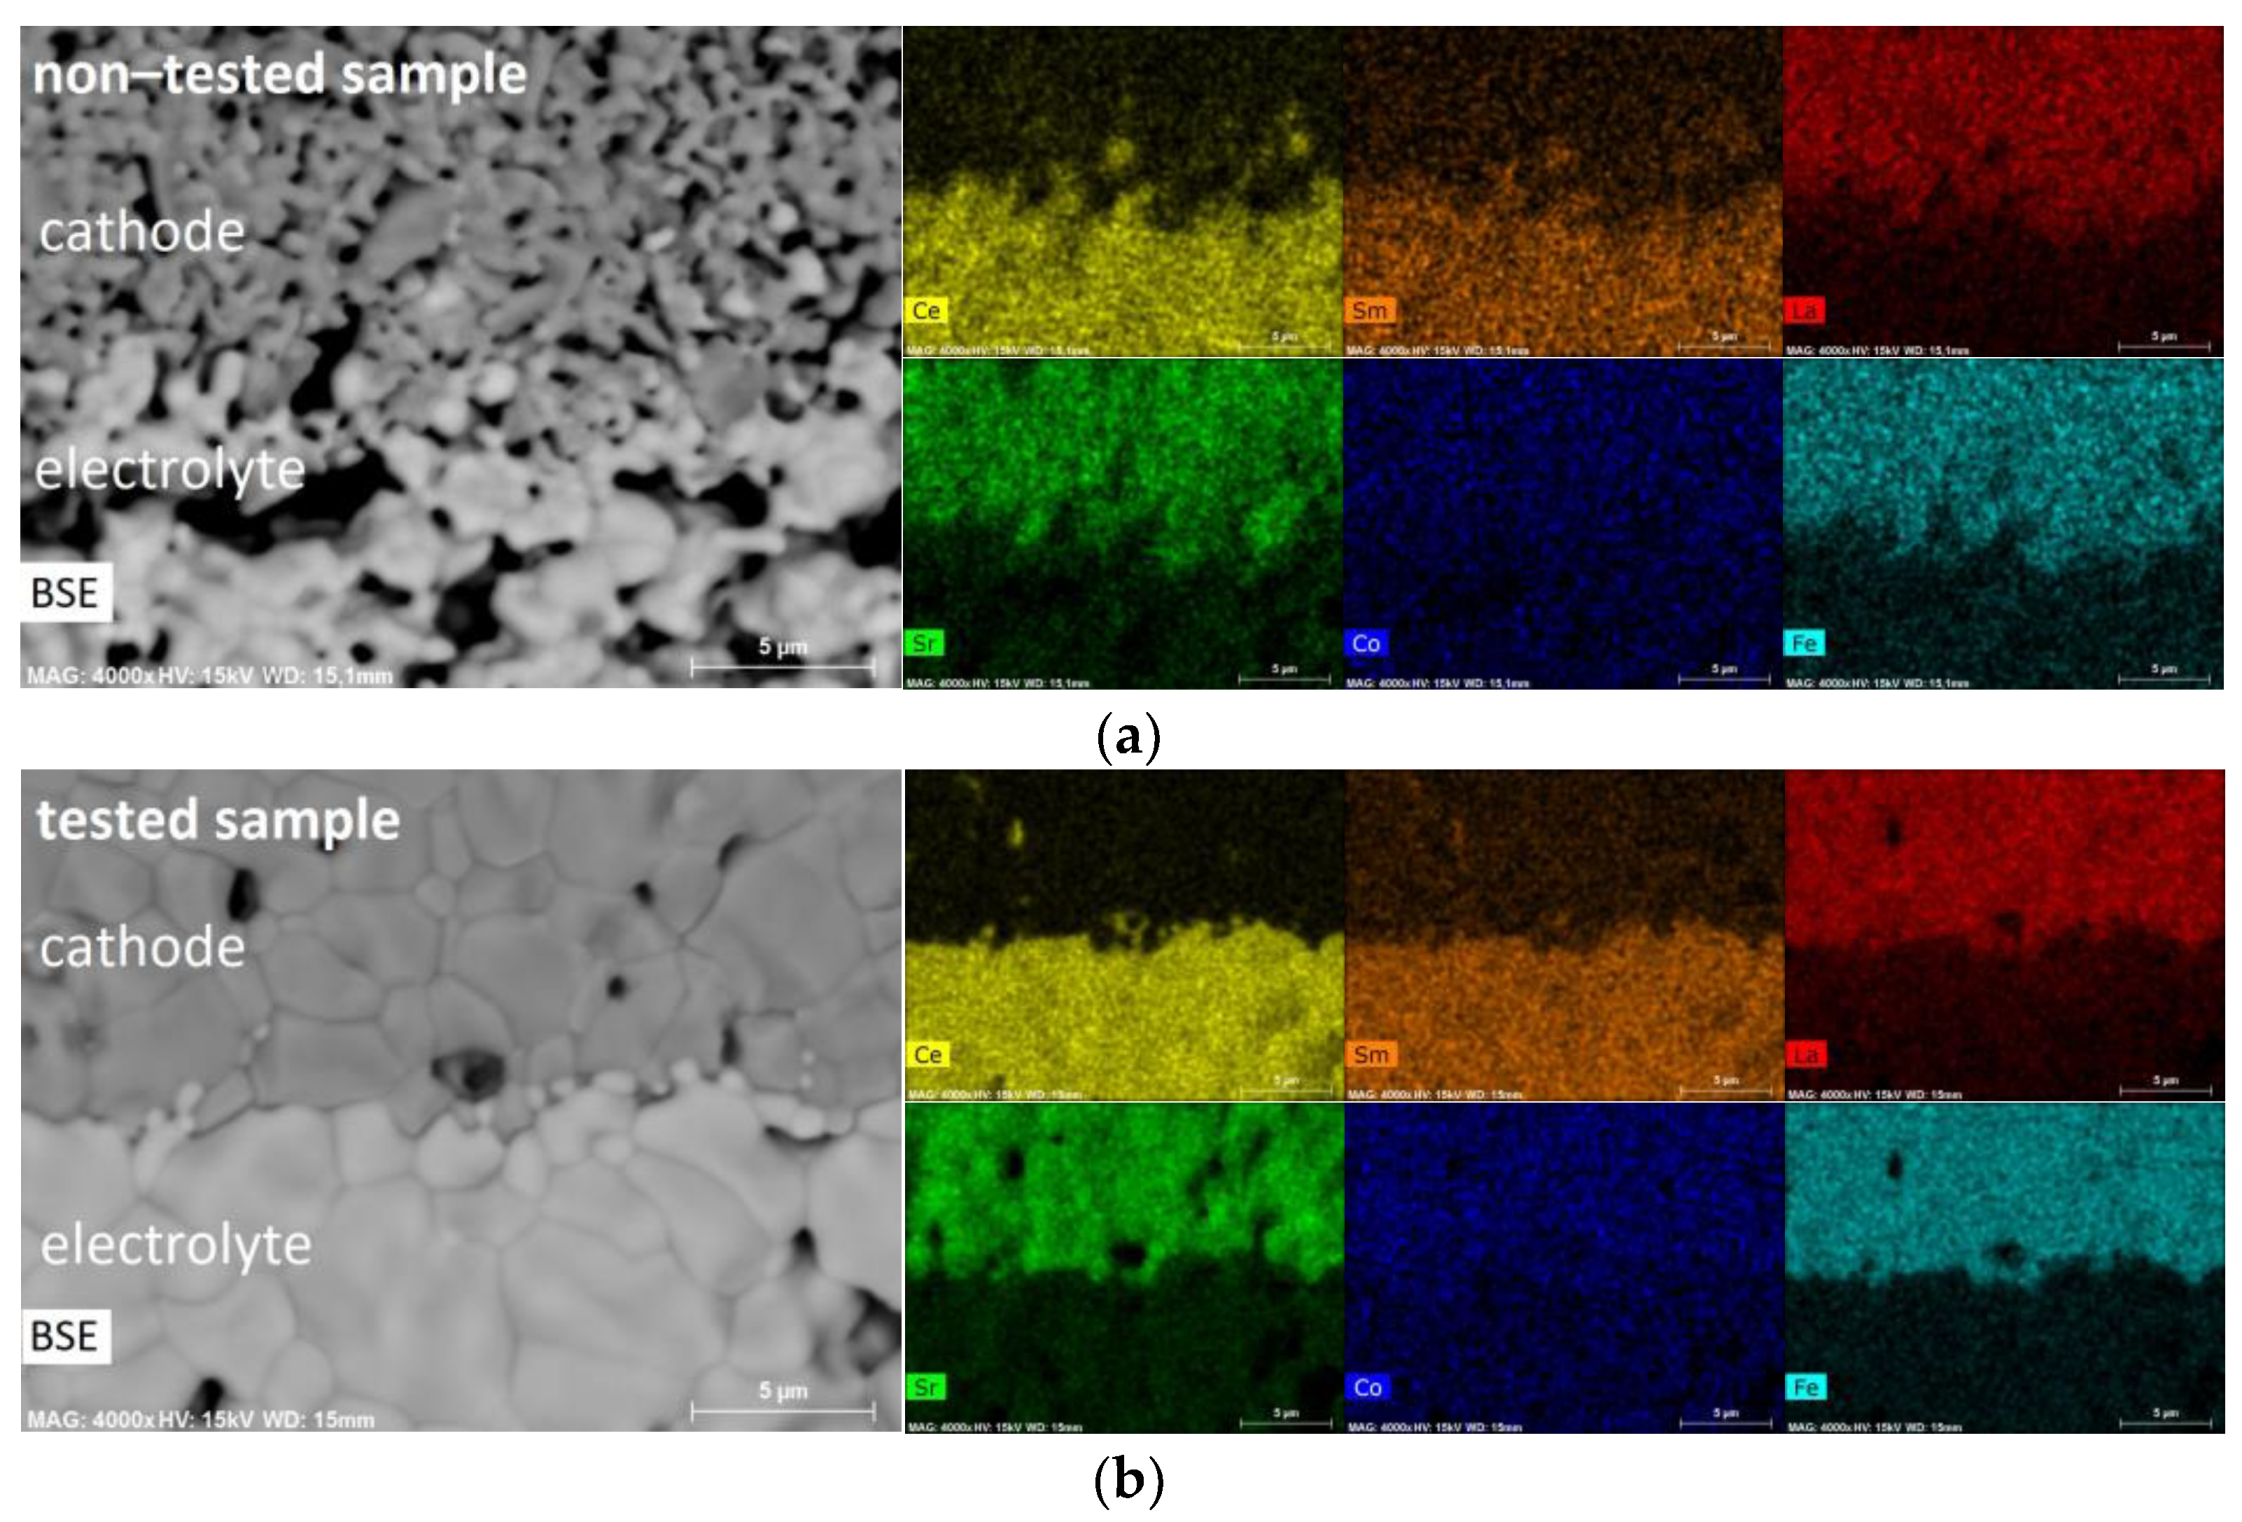
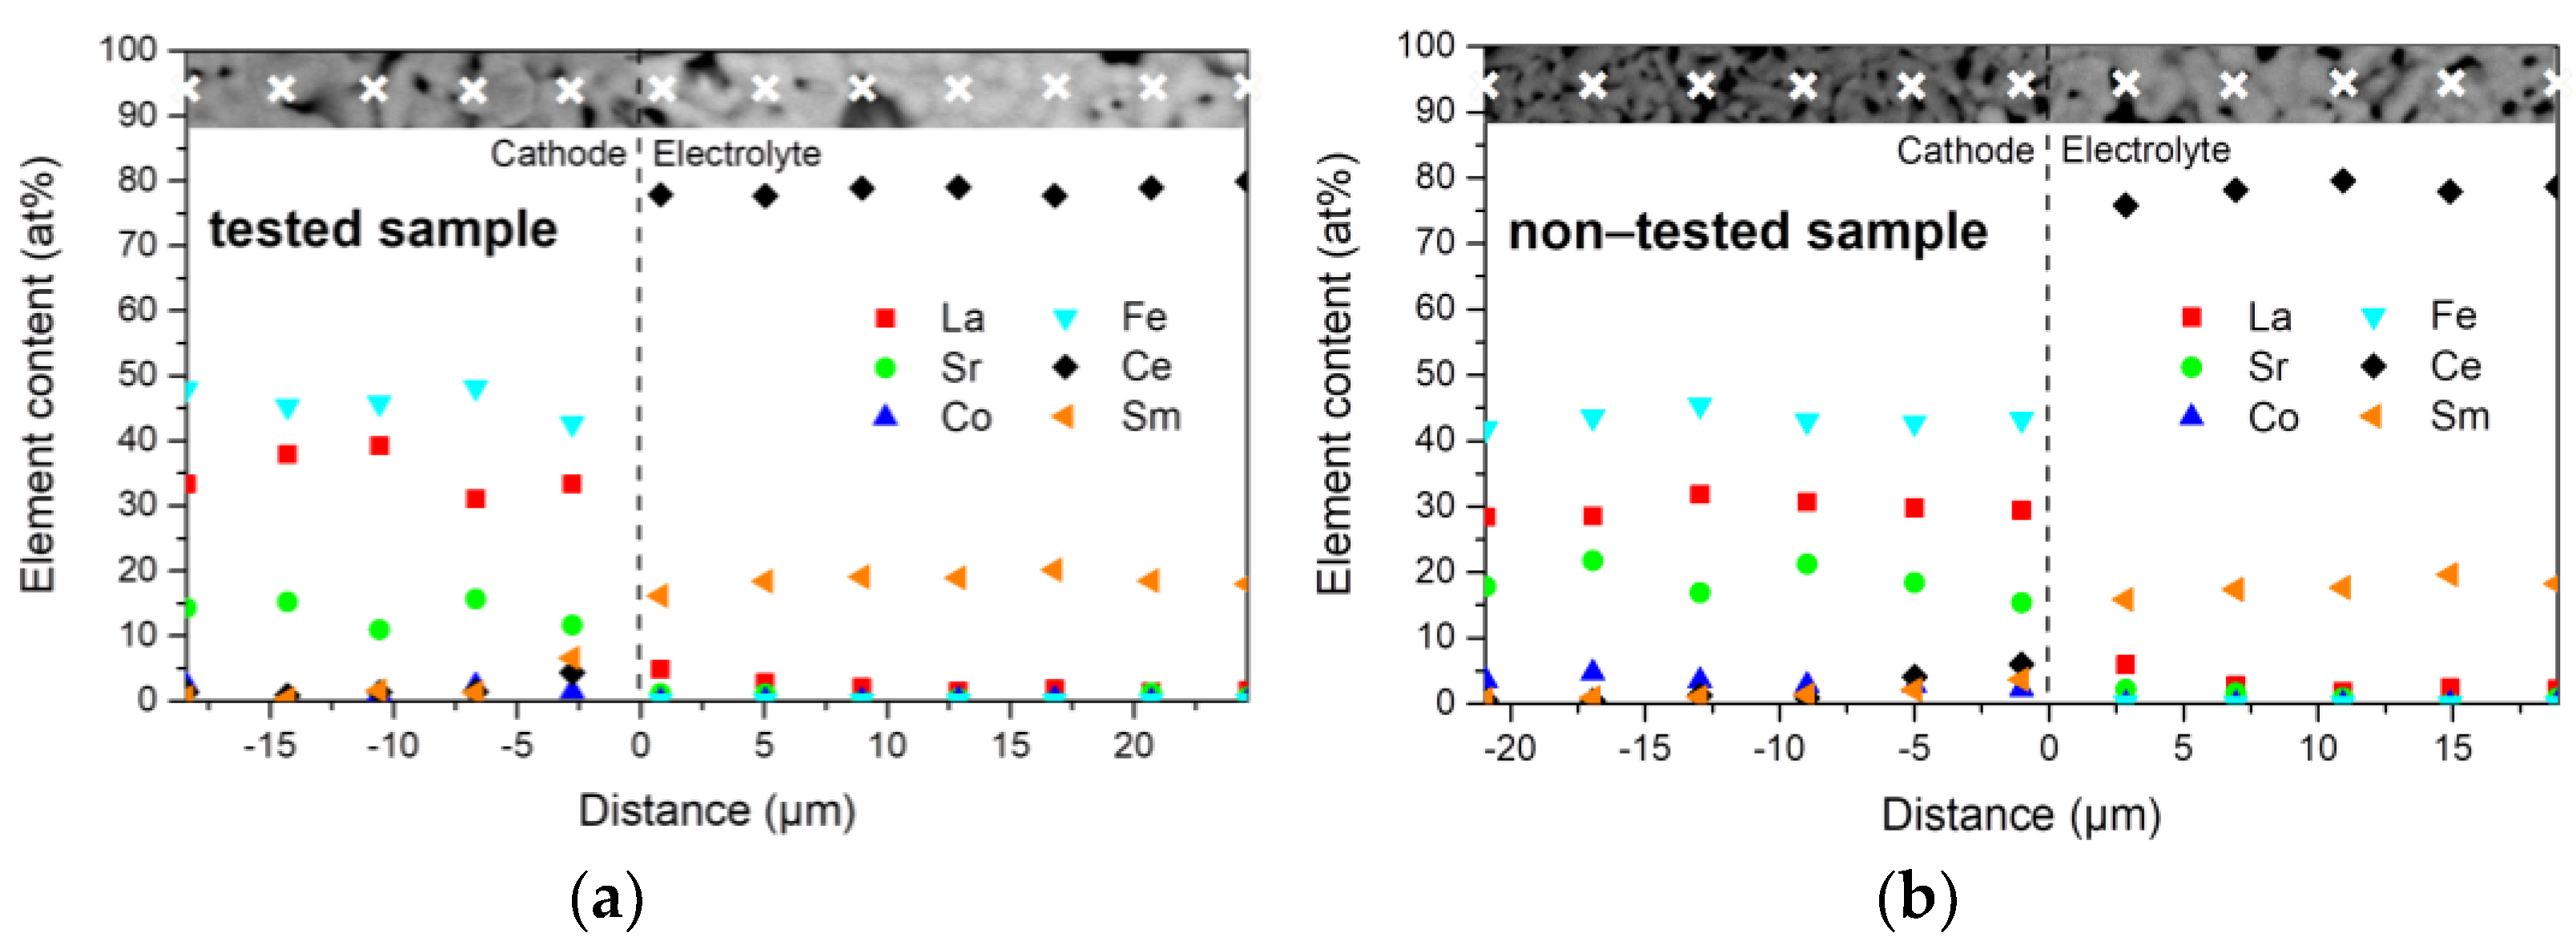
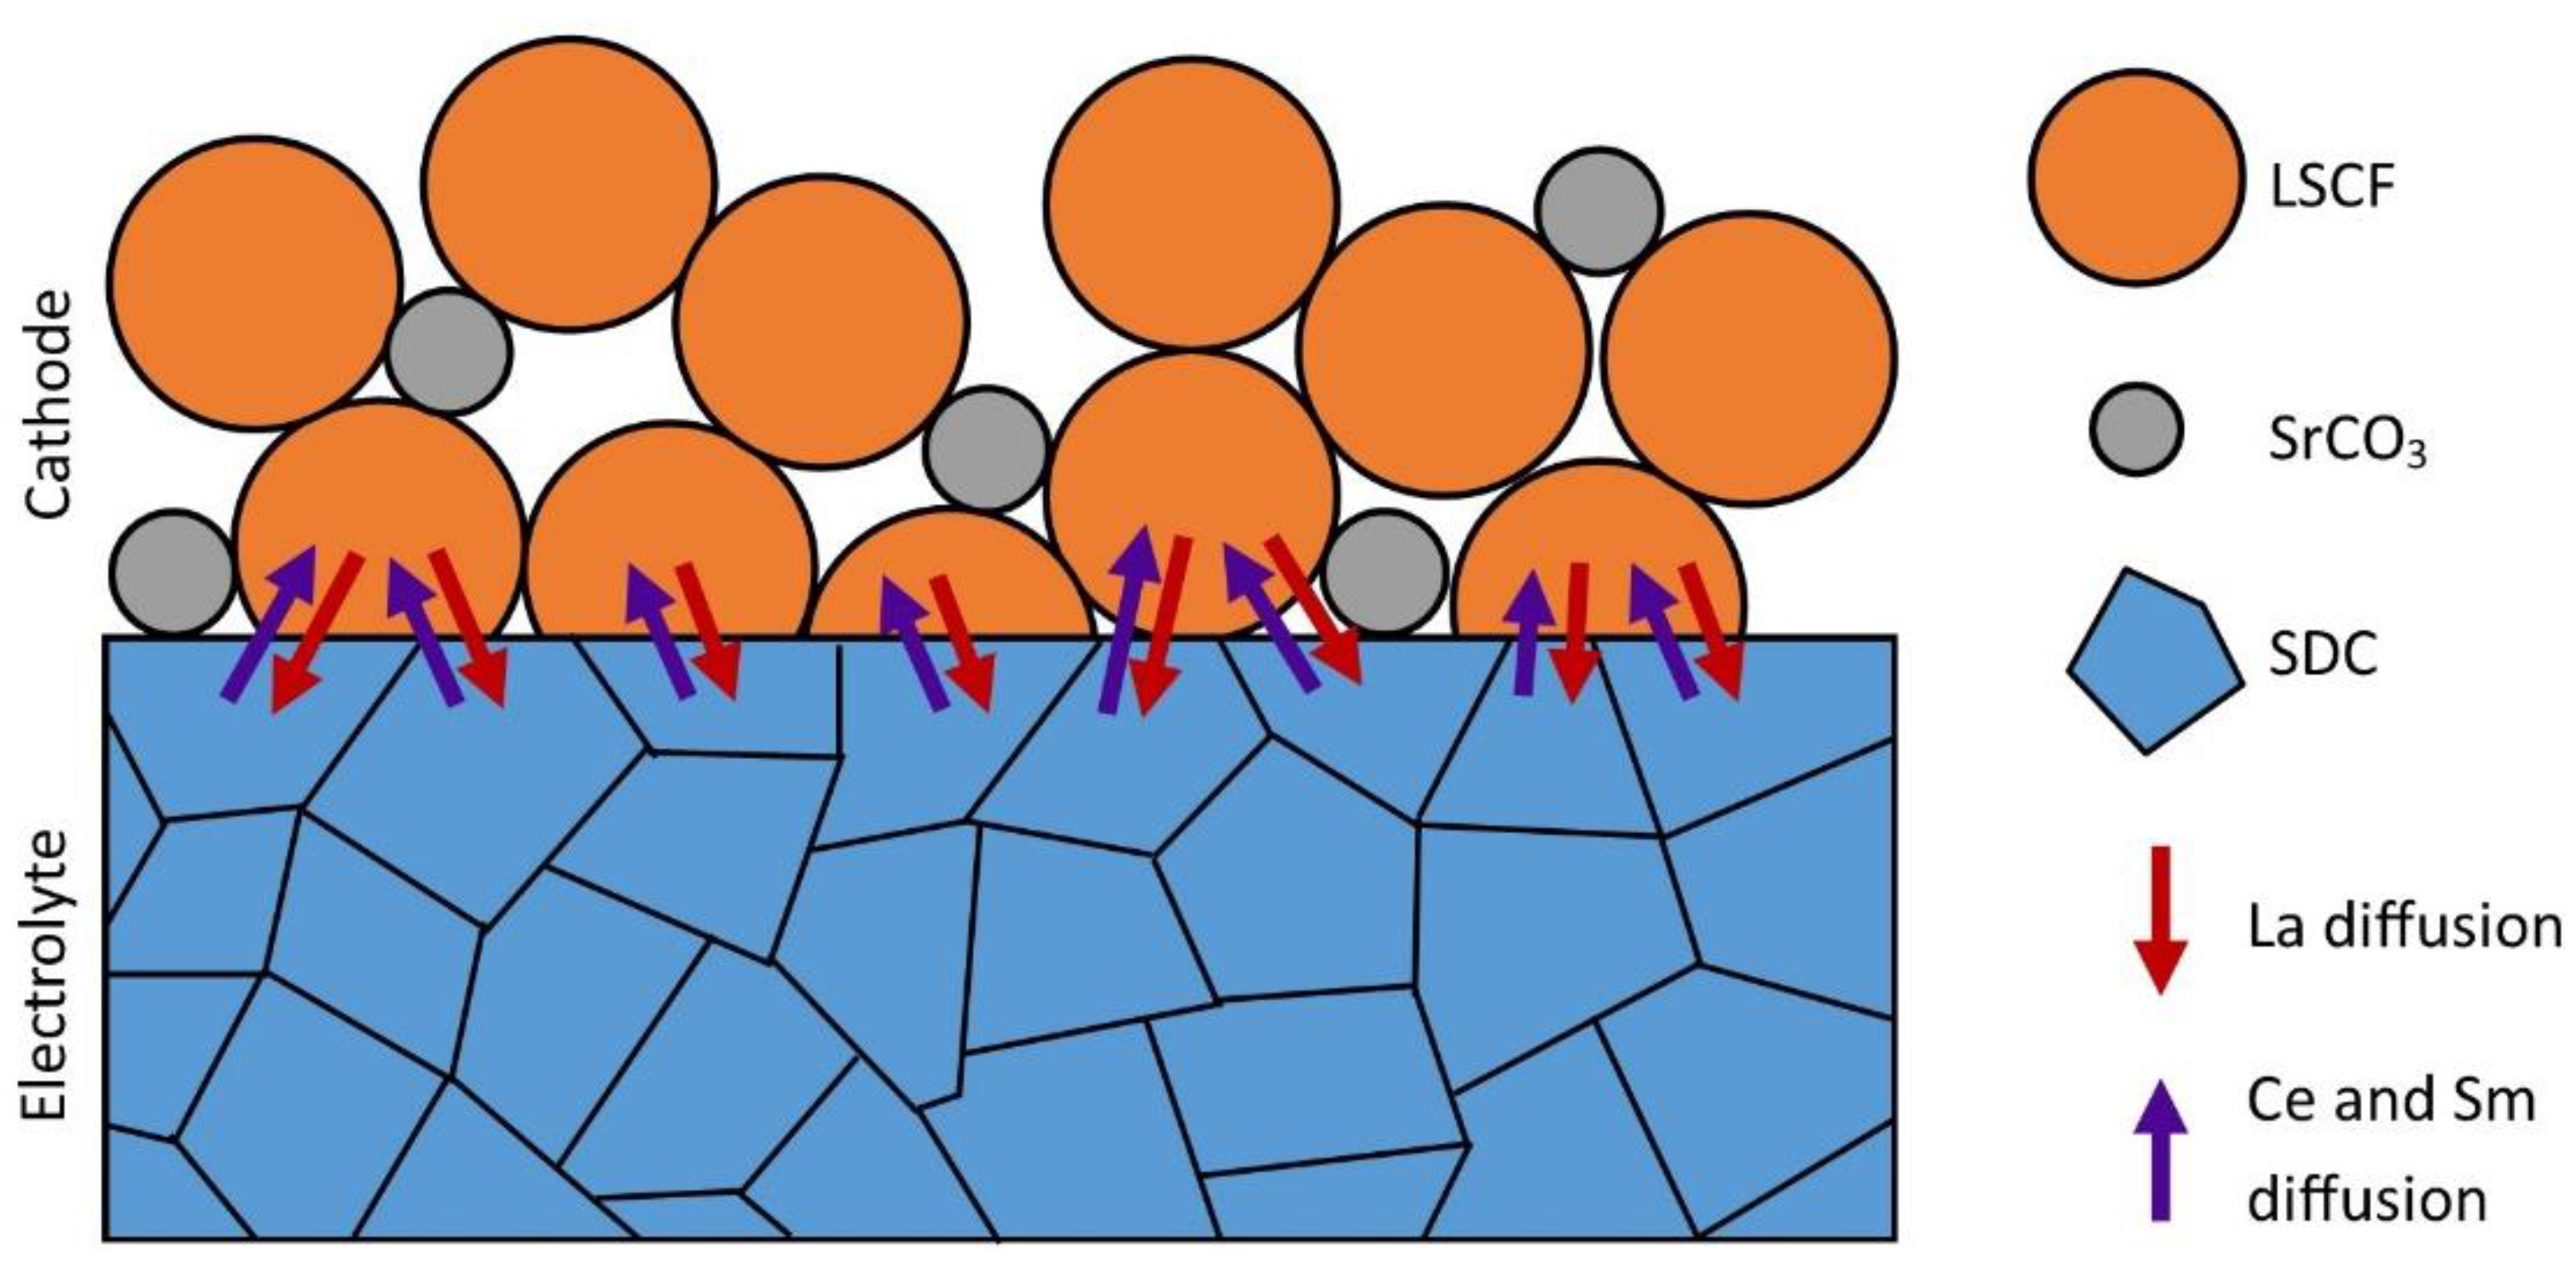
  • That lanthanum diffused into the SDC electrolyte layer while cerium and samarium diffused into the cathode layer, the preferred diffusion paths appearing along the grain boundaries. This occurred both during co-sintering at 1380 °C and cell operation, leading to the formation of La- and Sm-doped ceria and resulting in a slight increase in the ohmic resistance.
  • The incorporation of Sm and Ce into the LSCF structure involved an increase in the resistance related to the charge transfer at the cathode–electrolyte interface. On the other hand, strontium segregation into SrCO3 clusters at the interface and at the surface of LSCF grains was also highlighted.
  • This mechanism occurred during sintering and possibly persisted during cell operation, leading to a significant increase in the cathode polarization resistance. This chemical degradation was caused by the destabilization of the perovskite structure during thermal treatment due to the segregation of the strontium ions out of the LSCF phase.
  • Finally, strontium segregation was very detrimental for the cell performance, while lanthanum diffusion into Sm-doped ceria only resulted in a small increase in the reduction of cerium.

Supplementary Materials

The following are available online at https://www.mdpi.com/article/10.3390/en14123674/s1, Figure S1: Rietveld refinement of the cathode–electrolyte interface after the selective dissolution of LSCF using FullProf software (Red: experimental data, black: fitting curve, blue: difference between the experimental data and the fitting curve). Figure S2: X-ray diffractogram of the raw LSCF powder. Figure S3: Zoom of the X-ray diffractogram of (a) the cathode–electrolyte interface after the selective dissolution of LSCF and (b) the raw LSCF powder.

Author Contributions

Conceptualization, M.F., M.P.C. and G.C.; methodology, M.F., M.P.C. and G.C.; software, M.F. and O.H.; validation, M.F., M.P.C. and G.C.; formal analysis, M.F., M.P.C., O.H. and G.C.; investigation, M.F., M.P.C., O.H. and G.C.; resources, M.F., M.P.C., O.H. and G.C.; data curation, M.F. and O.H.; writing—original draft preparation, M.F., M.P.C., V.L. and G.C.; writing—review and editing, M.F., M.P.C., O.H., V.L., D.C., L.C., F.D. and G.C.; visualization, M.F. and M.P.C.; supervision, M.P.C. and G.C.; project administration, G.C.; funding acquisition, M.P.C. and G.C. All authors have read and agreed to the published version of the manuscript.

Funding

This research was funded in part by the Regional Council of Bourgogne Franche-Comté, by the FEDER (Fonds Européens pour le Developpement Régional), by the EIPHI Graduate School (Contract ANR-17-EURE-0002) and the French National Center for Scientific Research (CNRS) through a visiting researcher position granted to M.P.C.

Institutional Review Board Statement

Not applicable.

Informed Consent Statement

Not applicable.

Data Availability Statement

Data available in a publicly accessible repository. The data presented in this study are openly available in FigShare at [doi:10.6084/m9.figshare.14806701], reference number [DOI of the publi-cation].

Acknowledgments

The authors thank ESIREM Engineering College for the SEM-EDX experimentations.

Conflicts of Interest

The authors declare no conflict of interest.

References

  1. Wachsman, E.D.; Lee, K.T. Lowering the Temperature of Solid Oxide Fuel Cells. Science 2011, 334, 935–939. [Google Scholar] [CrossRef]
  2. Chen, M.; Liu, Y.-L.; Hagen, A.; Hendriksen, P.V.; Poulsen, F.W. LSM–YSZ Reactions in Different Atmospheres. Fuel Cells 2009, 9, 833–840. [Google Scholar] [CrossRef]
  3. Zhang, X.; Wu, W.; Zhao, Z.; Tu, B.; Ou, D.; Cui, D.; Cheng, M. Insight into the Oxygen Reduction Reaction on the LSM|GDC Interface of Solid Oxide Fuel Cells through Impedance Spectroscopy Analysis. Catal. Sci. Technol. 2016, 6, 4945–4952. [Google Scholar] [CrossRef]
  4. Zhu, W.Z.; Deevi, S.C. Development of Interconnect Materials for Solid Oxide Fuel Cells. Mater. Sci. Eng. A 2003, 348, 227–243. [Google Scholar] [CrossRef]
  5. Li, P.; Chen, X.; Li, Y.; Schwank, J.W. A Review on Oxygen Storage Capacity of CeO2-Based Materials: Influence Factors, Measurement Techniques, and Applications in Reactions Related to Catalytic Automotive Emissions Control. Catal. Today 2019, 327, 90–115. [Google Scholar] [CrossRef]
  6. Vasiliades, M.A.; Harris, D.; Stephenson, H.; Boghosian, S.; Efstathiou, A.M. A Novel Analysis of Transient Isothermal 18O Isotopic Exchange on Commercial CexZr1−xO2-Based OSC Materials. Top. Catal. 2019, 62, 219–226. [Google Scholar] [CrossRef]
  7. Anirban, S.; Dutta, A. Structural and Ionic Transport Mechanism of Rare Earth Doped Cerium Oxide Nanomaterials: Effect of Ionic Radius of Dopant Cations. Solid State Ion. 2017, 309, 137–145. [Google Scholar] [CrossRef]
  8. Eguchi, K.; Setoguchi, T.; Inoue, T.; Arai, H. Electrical Properties of Ceria-Based Oxides and Their Application to Solid Oxide Fuel Cells. Solid State Ion. 1992, 52, 165–172. [Google Scholar] [CrossRef]
  9. Anjaneya, K.C.; Nayaka, G.P.; Manjanna, J.; Govindaraj, G.; Ganesha, K.N. Preparation and Characterization of Ce1−xSmxO2−δ (x = 0.1–0.3) as Electrolyte Material for Intermediate Temperature SOFC. Solid State Sci. 2013, 26, 89–96. [Google Scholar] [CrossRef]
  10. Coduri, M.; Checchia, S.; Longhi, M.; Ceresoli, D.; Scavini, M. Rare Earth Doped Ceria: The Complex Connection Between Structure and Properties. Front. Chem. 2018, 6, 526. [Google Scholar] [CrossRef]
  11. Balazs, G. Ac Impedance Studies of Rare Earth Oxide Doped Ceria. Solid State Ion. 1995, 76, 155–162. [Google Scholar] [CrossRef]
  12. Giuliano, A.; Carpanese, M.P.; Clematis, D.; Boaro, M.; Pappacena, A.; Deganello, F.; Liotta, L.F.; Barbucci, A. Infiltration, Overpotential and Ageing Effects on Cathodes for Solid Oxide Fuel Cells: La0.6Sr0.4Co0.2Fe0.8O3-δ versus Ba0.5Sr0.5Co0.8Fe0.2O3-δ. J. Electrochem. Soc. 2017, 164, F3114–F3122. [Google Scholar] [CrossRef]
  13. Anjaneya, K.C.; Nayaka, G.P.; Manjanna, J.; Govindaraj, G.; Ganesha, K.N. Studies on Structural, Morphological and Electrical Properties of Ce0.8Ln0.2O2−δ (Ln=Y3+, Gd3+, Sm3+, Nd3+ and La3+) Solid Solutions Prepared by Citrate Complexation Method. J. Alloy. Compd. 2014, 585, 594–601. [Google Scholar] [CrossRef]
  14. Koettgen, J.; Grieshammer, S.; Hein, P.; Grope, B.O.H.; Nakayama, M.; Martin, M. Understanding the Ionic Conductivity Maximum in Doped Ceria: Trapping and Blocking. Phys. Chem. Chem. Phys. 2018, 20, 14291–14321. [Google Scholar] [CrossRef]
  15. Priya, N.S.C.; Sandhya, K.; Rajendran, D.N. Study on Electrical Conductivity and Activation Energy of Doped Ceria Nanostructures. Electrochem. Energy Technol. 2018, 3, 49–53. [Google Scholar] [CrossRef]
  16. Stambouli, A.B.; Traversa, E. Solid Oxide Fuel Cells (SOFCs): A Review of an Environmentally Clean and Efficient Source of Energy. Renew. Sustain. Energy Rev. 2002, 6, 433–455. [Google Scholar] [CrossRef]
  17. Da Silva, F.S.; de Souza, T.M. Novel Materials for Solid Oxide Fuel Cell Technologies: A Literature Review. Int. J. Hydrog. Energy 2017, 42, 26020–26036. [Google Scholar] [CrossRef] [Green Version]
  18. Liu, Y.; Shao, Z.; Mori, T.; Jiang, S.P. Development of Nickel Based Cermet Anode Materials in Solid Oxide Fuel Cells—Now and Future. Mater. Rep. Energy 2021, 1, 100003–100029. [Google Scholar]
  19. Fu, C.; Sun, K.; Zhang, N.; Chen, X.; Zhou, D. Electrochemical Characteristics of LSCF–SDC Composite Cathode for Intermediate Temperature SOFC. Electrochim. Acta 2007, 52, 4589–4594. [Google Scholar] [CrossRef]
  20. Parbey, J.; Wang, Q.; Lei, J.; Espinoza-Andaluz, M.; Hao, F.; Xiang, Y.; Li, T.; Andersson, M. High-Performance Solid Oxide Fuel Cells with Fiber-Based Cathodes for Low-Temperature Operation. Int. J. Hydrog. Energy 2020, 45, 6949–6957. [Google Scholar] [CrossRef]
  21. Zhou, W.; Ran, R.; Shao, Z. Progress in Understanding and Development of Ba0.5Sr0.5Co0.8Fe0.2O3-δ-Basedcathodes for Intermediate-Temperature Solid-Oxide Fuel Cells: A Review. J. Power Sour. 2009, 192, 231–246. [Google Scholar] [CrossRef]
  22. Abd Aziz, A.J.; Baharuddin, N.A.; Somalu, M.R.; Muchtar, A. Review of Composite Cathodes for Intermediate-Temperature Solid Oxide Fuel Cell Applications. Ceram. Int. 2020, 46, 23314–23325. [Google Scholar] [CrossRef]
  23. Wang, F.; Chen, D.; Shao, Z. Sm0.5Sr0.5CoO3−δ-Infiltrated Cathodes for Solid Oxide Fuel Cells with Improved Oxygen Reduction Activity and Stability. J. Power Sour. 2012, 216, 208–215. [Google Scholar] [CrossRef]
  24. Tai, L.-W.; Nasrallah, M.M.; Anderson, H.U.; Sparlin, D.M.; Sehlin, S.R. Structure and Electrical Properties of La1−xSrxCo1−yFeyO3. Part 2. The System La1−xSrxCo0.2Fe0.8O3. Solid State Ion. 1995, 76, 273–283. [Google Scholar] [CrossRef]
  25. Develos-Bagarinao, K.; De Vero, J.; Kishimoto, H.; Ishiyama, T.; Yamaji, K.; Horita, T.; Yokokawa, H. Oxygen Surface Exchange Properties and Surface Segregation Behavior of Nanostructured La0.6Sr0.4Co0.2Fe0.8O3-δ Thin Film Cathodes. Phys. Chem. Chem. Phys. 2019, 21, 7183–7195. [Google Scholar] [CrossRef]
  26. Wang, F.; Brito, M.E.; Yamaji, K.; Cho, D.-H.; Nishi, M.; Kishimoto, H.; Horita, T.; Yokokawa, H. Effect of Polarization on Sr and Zr Diffusion Behavior in LSCF/GDC/YSZ System. Solid State Ion. 2014, 262, 454–459. [Google Scholar] [CrossRef]
  27. Simner, S.P.; Anderson, M.D.; Engelhard, M.H.; Stevenson, J.W. Degradation Mechanisms of La–Sr–Co–Fe–O3 SOFC Cathodes. Electrochem. Solid-State Lett. 2006, 9, A478–A481. [Google Scholar] [CrossRef]
  28. Yu, Y.; Ludwig, K.F.; Woicik, J.C.; Gobalan, S.; Pal, U.B.; Kaspar, T.C.; Basu, S.N. Effect of Sr Content and Strain on Sr Surface Segregation of La1−xSrxCo0.2Fe0.8O3−δ as Cathode Material for Solid Oxide Fuel Cells. Appl. Mater. Interfaces 2016, 8, 26704–26711. [Google Scholar] [CrossRef] [PubMed]
  29. Yang, Z.; Guo, M.; Wang, N.; Ma, C.; Wang, J.; Han, M. A Short Review of Cathode Poisoning and Corrosion in Solid Oxide Fuel Cell. Int. J. Hydrog. Energy 2017, 42, 24948–24959. [Google Scholar] [CrossRef]
  30. Mercadelli, E.; Montaleone, D.; Gondolini, A.; Pinasco, P.; Sanson, A. Tape-Cast Asymmetric Membranes for Hydrogen Separation. Ceram. Int. 2017, 43, 8010–8017. [Google Scholar] [CrossRef]
  31. Wang, Z.; Qian, J.; Cao, J.; Wang, S.; Wen, T. A Study of Multilayer Tape Casting Method for Anode-Supported Planar Type Solid Oxide Fuel Cells (SOFCs). J. Alloy. Compd. 2007, 437, 264–268. [Google Scholar] [CrossRef]
  32. Hildenbrand, N.; Boukamp, B.A.; Nammensma, P.; Blank, D.H.A. Improved Cathode/Electrolyte Interface of SOFC. Solid State Ion. 2011, 192, 12–15. [Google Scholar] [CrossRef]
  33. Giannici, F.; Canu, G.; Chiara, A.; Gambino, M.; Aliotta, C.; Longo, A.; Buscaglia, V.; Martorana, A. Cation Diffusion and Segregation at the Interface between Samarium-Doped Ceria and LSCF or LSFCu Cathodes Investigated with X-Ray Microspectroscopy. ACS Appl. Mater. Interfaces 2017, 9, 44466–44477. [Google Scholar] [CrossRef] [PubMed]
  34. Sayan, Y.; Venkatesan, V.; Guk, E.; Wu, H.; Kim, J.-S. Single-Step Fabrication of an Anode Supported Planar Single-Chamber Solid Oxide Fuel Cell. Int. J. Appl. Ceram. Technol. 2018, 15, 1375–1387. [Google Scholar] [CrossRef] [Green Version]
  35. Carpanese, M.P.; Cerisola, G.; Viviani, M.; Piccardo, P.; Vladikova, D.; Stoynov, Z.; Barbucci, A. Study of the Rate Limiting Step of the Cathodic Process in Anode Supported Solid Oxide Fuel Cell. J. Fuel Cell Sci. Technol. 2008, 5, 011010. [Google Scholar] [CrossRef]
  36. Hirschorn, B.; Orazem, M.E.; Tribollet, B.; Vivier, V.; Frateur, I.; Musiani, M. Determination of Effective Capacitance and Film Thickness from Constant-Phase-Element Parameters. Electrochim. Acta 2010, 55, 6218–6227. [Google Scholar] [CrossRef]
  37. Jamnik, J.; Maier, J. Generalised Equivalent Circuits for Mass and Charge Transport: Chemical Capacitance and Its Implications. Phys. Chem. Chem. Phys. 2001, 3, 1668–1678. [Google Scholar] [CrossRef]
  38. Chen, D.; Bishop, S.R.; Tuller, H.L. Nonstoichiometry in Oxide Thin Films Operating under Anodic Conditions: A Chemical Capacitance Study of the Praseodymium−Cerium Oxide System. Chem. Mater. 2014, 26, 6622–6627. [Google Scholar] [CrossRef]
  39. Huang, Y.L.; Pellegrinelli, C.; Wachsman, E.D. Fundamental Impact of Humidity on SOFC Cathode ORR. J. Electrochem. Soc. 2016, 163, F171–F182. [Google Scholar] [CrossRef] [Green Version]
  40. Liu, M.; Ding, D.; Bai, Y.; He, T.; Liu, M. An Efficient SOFC Based on Samaria-Doped Ceria (SDC) Electrolyte. J. Electrochem. Soc. 2012, 159, B661–B665. [Google Scholar] [CrossRef]
  41. Tuttle, R. Alloy Steels. Metals 2018, 8, 116. [Google Scholar] [CrossRef] [Green Version]
  42. Shannon, R.D. Revised Effective Ionic Radii and Systematic Studies of Interatomie Distances in Halides and Chaleogenides. Acta Cryst. 1976, A32, 754–767. [Google Scholar]
  43. Dutta, P.; Pal, S.; Seehra, M.S.; Shi, Y.; Eyring, E.M.; Ernst, R.D. Concentration of Ce3+ and Oxygen Vacancies in Cerium Oxide Nanoparticles. Chem. Mater. 2006, 18, 5144–5146. [Google Scholar] [CrossRef]
  44. Lu, Y.; Chen, L.; Lu, C.; Ni, Y.; Xu, Z. Effects of Oxygen Defects on Structure and Properties of Sm0.5Sr0.5CoO3-δ Annealed in Different Atmospheres. J. Rare Earths 2013, 31, 1183–1190. [Google Scholar] [CrossRef]
  45. Chang, H.-C.; Tsai, D.-S.; Chung, W.-H.; Huang, Y.-S.; Le, M.-V. A Ceria Layer as Diffusion Barrier between LAMOX and Lanthanum Strontium Cobalt Ferrite along with the Impedance Analysis. Solid State Ion. 2009, 180, 412–417. [Google Scholar] [CrossRef]
  46. Volkova, N.E.; Khvostova, L.V.; Gavrilova, L.Y.; Cherepanov, V.A. Role of Sm Content to the Crystal Structure and Properties of Sr1-Sm FeO3-δ. J. Solid State Chem. 2018, 267, 113–118. [Google Scholar] [CrossRef]
  47. Zhou, F.; Liu, Y.; Zhao, X.; Tang, W.; Yang, S.; Zhong, S.; Wei, M. Effects of Cerium Doping on the Performance of LSCF Cathodes for Intermediate Temperature Solid Oxide Fuel Cells. Int. J. Hydrog. Energy 2018, 43, 18946–18954. [Google Scholar] [CrossRef]
  48. Mandal, B.P.; Grover, V.; Tyagi, A.K. Phase Relations, Lattice Thermal Expansion in Ce1−xEuxO2−x/2 and Ce1−xSmxO2−x/2 Systems and Stabilization of Cubic RE2O3 (RE: Eu, Sm). Mater. Sci. Eng. A 2006, 430, 120–124. [Google Scholar] [CrossRef]
  49. Zhang, W.; Wang, H.; Guan, K.; Wei, Z.; Zhang, X.; Meng, J.; Liu, X.; Meng, J. La0.6Sr0.4Co0.2Fe0.8O3−δ/CeO2Heterostructured Composite Nanofibersas a Highly Active and Robust Cathode Catalyst for Solid Oxide FuelCells. Appl. Mater. Interfaces 2019, 11, 26830–26841. [Google Scholar] [CrossRef] [PubMed]
  50. Wang, H.; Zhang, W.; Guan, K.; Wei, Z.; Meng, J.; Meng, J.; Liu, X. Enhancing Activity and Durability of A-Site-Deficient (La0.6 Sr0.4)0.95 Co0.2 Fe0.8 O3−δ Cathode by Surface Modification with PrO2−δ Nanoparticles. ACS Sustain. Chem. Eng. 2020, 8, 3367–3380. [Google Scholar] [CrossRef]
  51. Hardy, J.S.; Templeton, J.W.; Edwards, D.J.; Lu, Z.; Stevenson, J.W. Lattice Expansion of LSCF-6428 Cathodes Measured by in Situ XRD during SOFC Operation. J. Power Sources 2012, 198, 76–82. [Google Scholar] [CrossRef]
  52. Kuntaiah, K.; Sudarsanam, P.; Reddy, B.M.; Vinu, A. Nanocrystalline Ce12xSmxO2-d (x = 0.4) Solid Solutions: Structural Characterization versus CO Oxidation3. RSC Adv. 2013, 11, 7953–7962. [Google Scholar] [CrossRef] [Green Version]
  53. Acharya, S.A.; Gaikwad, V.M.; D’Souza, S.W.; Barman, S.R. Gd/Sm Dopant-Modified Oxidation State and Defect Generation in Nano-Ceria. Solid State Ion. 2014, 260, 21–29. [Google Scholar] [CrossRef]
  54. Kundu, S.; Sutradhar, N.; Thangamuthu, R.; Subramanian, B.; Panda, A.B.; Jayachandran, M. Fabrication of Catalytically Active Nanocrystalline Samarium (Sm)-Doped Cerium Oxide (CeO2) Thin FIlms Using Electron Beam Evaporation. J. Nanopart Res. 2012, 16. [Google Scholar] [CrossRef]
  55. Liang, S.; Broitman, E.; Wang, Y.; Cao, A.; Veser, G. Highly Stable, Mesoporous Mixed Lanthanum–Cerium Oxides with Tailored Structure and Reducibility. J. Mater. Sci. 2011, 46, 2928–2937. [Google Scholar] [CrossRef] [Green Version]
  56. Loche, D. Determining the Maximum Lanthanum Incorporation in the Fluorite Structure of La-Doped Ceria Nanocubes for Enhanced Redox Ability. RSC Adv. 2019, 7. [Google Scholar] [CrossRef] [Green Version]
  57. Nguyen, T.-D.; Mrabet, D.; Do, T.-O. Controlled Self-Assembly of Sm2 O3 Nanoparticles into Nanorods: Simple and Large Scale Synthesis Using Bulk Sm2 O3 Powders. J. Phys. Chem. C 2008, 112, 15226–15235. [Google Scholar] [CrossRef]
  58. Zhu, L.; Liu, X.; Han, F.; Sun, J.; Bi, H.; Wang, H.; Yu, S.; Pei, L. Ni1—XCux–SDC Anodes for Intermediate Temperature Solid Oxide Fuel Cell. Solid State Ion. 2016, 288, 115–119. [Google Scholar] [CrossRef]
  59. Dupin, J.-C.; Gonbeau, D.; Vinatier, P.; Levasseur, A. Systematic XPS Studies of Metal Oxides, Hydroxides and Peroxides. Phys. Chem. Chem. Phys. 2000, 2, 1319–1324. [Google Scholar] [CrossRef]
  60. Feltham, R.D.; Brant, P. XPS Studies of Core Binding Energies in Transition Metal Complexes. 2. Ligand Group Shifts. Am. Chem. Soc. 1982, 104, 641–645. [Google Scholar] [CrossRef]
  61. Drouet, C.; Laberty, C.; Fierro, J.L.G.; Alphonse, P.; Rousset, A. X-Ray Photoelectron Spectroscopic Study of Non-Stoichiometric Nickel and Nickel–Copper Spinel Manganites. Int. J. Inorg. Mater. 2000, 2, 419–426. [Google Scholar] [CrossRef] [Green Version]
  62. Allen, G.C.; Harris, S.J.; Jutson, L. A Study of a Number of Mixed Transition Metal Oxide Spinels Using X-Ray Photoelecton Spectroscopy. Appl. Surf. Sci. 1989, 37, 111–134. [Google Scholar] [CrossRef]
  63. Natile, M.M.; Galenda, A.; Glisenti, A. From La2O3 to LaCoO3: XPS Analysis. Surf. Sci. Spectra 2008, 15, 14. [Google Scholar] [CrossRef]
  64. Li, J.P.H.; Zhou, X.; Pang, Y.; Zhu, L.; Vovk, E.I.; Cong, L.; van Bavel, A.P.; Li, S.; Yang, Y. Understanding of Binding Energy Calibration in XPS of Lanthanum Oxide by in Situ Treatment. Phys. Chem. Chem. Phys. 2019, 21, 22351–22358. [Google Scholar] [CrossRef]
  65. Zhang, L. Integrating the Cationic Engineering and Hollow Structure Engineering into Perovskites Oxides for Efficient and Stable Electrocatalytic Oxygen Evolution. Electrochim. Acta 2019, 11. [Google Scholar] [CrossRef]
  66. Wang, L.; Wang, P.; Geng, C.; Cao, H.; Xu, C.; Cheng, J.; Hong, T. A Novel Core-Shell LSCF Perovskite Structured Electrocatalyst with Local Hetero-Interface for Solid Oxide Fuel Cells. Int. J. Hydrog. Energy 2020, 45, 11824–11833. [Google Scholar] [CrossRef]
  67. Sunding, M.F. XPS Characterisation of in Situ Treated Lanthanum Oxide and Hydroxide Using Tailored Charge Referencing and Peak Fitting Procedures. J. Electron. Spectrosc. Relat. Phenom. 2011, 184, 399–409. [Google Scholar] [CrossRef]
  68. Opitz, A.K.; Rameshan, C.; Kubicek, M.; Rupp, G.M.; Nenning, A.; Götsch, T.; Blume, R.; Hävecker, M.; Knop-Gericke, A.; Rupprechter, G.; et al. The Chemical Evolution of the La0.6Sr0.4CoO3−δ Surface under SOFC Operating Conditions and Its Implications for Electrochemical Oxygen Exchange Activity. Top. Catal 2018, 61, 2129–2141. [Google Scholar] [CrossRef] [Green Version]
  69. Newby, D.; Kuyyalil, J.; Laverock, J.; Ludwig, K.F.; Yu, Y.; Davis, J.; Gopalan, S.; Pal, U.B.; Basu, S.; Smith, K.E. Surface Evolution of Lanthanum Strontium Cobalt Ferrite Thin Films at Low Temperatures. Thin Solid Films 2015, 589, 655–661. [Google Scholar] [CrossRef] [Green Version]
  70. Oishi, J.; Otomo, J.; Oshima, Y.; Koyama, M. The Effects of Minor Components in LSCF Cathode on Oxygen Reduction Reaction. ECS Trans. 2013, 57, 1909–1916. [Google Scholar] [CrossRef]
  71. Young, V.; Otagawa, T. XPS Studies on Strontium Compounds. Appl. Surf. Sci. 1985, 20, 228–248. [Google Scholar] [CrossRef]
  72. Vasquez, R.P. SrCO3 by XPS. Surf. Sci. Spectra 1992, 1, 112–116. [Google Scholar] [CrossRef]
  73. Wei, W.-C.; Huang, D.-R.; Wang, D. (Bi,Sr) (Fe1−x,Mx)O3−δ (M = Co, Ni and Mn) Cathode Materials with Mixed Electro-Ionic Conductivity. Materials 2016, 9, 922. [Google Scholar] [CrossRef] [PubMed] [Green Version]
  74. Sowjanya, C.; Mandal, R.; Abhinay, S.; Mohanta, A.; Das, S.; Pratihar, S.K. Effect of B-Site Substitution on the Crystal Structure, Electrical Conductivity and Oxygen Transport Properties of La0.5Sr0.5M0.2Fe0.8O3-δ (M = Co, Al, and Zn) Perovskite. J. Solid State Chem. 2020, 285, 121237. [Google Scholar] [CrossRef]
  75. Wang, H.; Yakal-Kremski, K.J.; Yeh, T.; Rupp, G.M.; Limbeck, A.; Fleig, J.; Barnett, S.A. Mechanisms of Performance Degradation of (La,Sr)(Co,Fe)O 3-δ Solid Oxide Fuel Cell Cathodes. J. Electrochem. Soc. 2016, 163, F581–F585. [Google Scholar] [CrossRef] [Green Version]
  76. Kubicek, M.; Limbeck, A.; Fromling, T.; Hutter, H. Relationship between Cation Segregation and the Electrochemical Oxygen Reduction Kinetics of La0.6Sr0.4CoO32d Thin Film Electrodes. J. Electrochem. Soc. 2011, 8. [Google Scholar] [CrossRef]
  77. Dai, H.; Kou, H.; Tao, Z.; Liu, K.; Xue, M.; Zhang, Q.; Bi, L. Optimization of Sintering Temperature for SOFCs by a Co-Firing Method. Ceram. Int. 2020, 46, 6987–6990. [Google Scholar] [CrossRef]
  78. Li, M.; Sun, Z.; Yang, W.; Hong, T.; Zhu, Z.; Zhang, Y.; Wu, X.; Xia, C. Mechanism for the Enhanced Oxygen Reduction Reaction of La0.6 Sr0.4 Co0.2 Fe0.8 O3−δ by Strontium Carbonate. Phys. Chem. Chem. Phys. 2017, 19, 503–509. [Google Scholar] [CrossRef]
  79. Pan, Z.; Liu, Q.; Zhang, L.; Zhang, X.; Chan, S.H. Effect of Sr Surface Segregation of La0.6Sr0.4Co0.2Fe0.8O3−δElectrode on Its Electrochemical Performance in SOC. J. Electrochem. Soc. 2015, 162, F1316–F1323. [Google Scholar] [CrossRef]
  80. Feng, B.; Sugiyama, I.; Hojo, H.; Ohta, H.; Shibata, N.; Ikuhara, Y. Atomic Structures and Oxygen Dynamics of CeO2 Grain Boundaries. Sci. Rep. 2016, 6, 20288–20294. [Google Scholar] [CrossRef] [Green Version]
  81. Izuki, M.; Brito, M.E.; Yamaji, K.; Kishimoto, H.; Cho, D.-H.; Shimonosono, T.; Horita, T.; Yokokawa, H. Interfacial Stability and Cation Diffusion across the LSCF/GDC Interface. J. Power Sour. 2011, 196, 7232–7236. [Google Scholar] [CrossRef]
  82. Kwak, N.W.; Lim, D.; Jeong, S.J.; Byeon, P.; Chung, S.; Jung, W. Diffusion of Cation Impurities through Ceria Grain Boundaries. Adv. Mater. Interfaces 2020, 7, 2000688. [Google Scholar] [CrossRef]
  83. Jung, G.-B.; Huang, T.-J.; Chang, C.-L. Effect of Temperature and Dopant Concentration on the Conductivity of Samaria-Doped Ceria Electrolyte. J. Solid State Electrochem. 2002, 6, 225–230. [Google Scholar] [CrossRef]
  84. Mahapatra, M.K.; Singh, P. Fuel Cells. In Future Energy; Elsevier: Amsterdam, The Netherlands, 2014; pp. 511–547. ISBN 978-0-08-099424-6. [Google Scholar]
  85. Yun, J.W.; Yoon, S.P.; Park, S.; Han, J.; Nam, S.W.; Lim, T.-H.; Kim, J.-S. Modifying the Cathodes of Intermediate-Temperature Solid Oxide Fuel Cells with a Ce0.8Sm0.2O2 Sol–Gel Coating. Int. J. Hydrog. Energy 2009, 34, 9213–9219. [Google Scholar] [CrossRef]
  86. Morales, M.; Miguel-Pérez, V.; Tarancón, A.; Slodczyk, A.; Torrell, M.; Ballesteros, B.; Ouweltjes, J.P.; Bassat, J.M.; Montinaro, D.; Morata, A. Multi-Scale Analysis of the Diffusion Barrier Layer of Gadolinia-Doped Ceria in a Solid Oxide Fuel Cell Operated in a Stack for 3000 h. J. Power Sour. 2017, 344, 141–151. [Google Scholar] [CrossRef]
Figure 1. Electrochemical measurement at 550 °C of the cell sintered at 1380 °C at t = 0, 17 and 40 h (a) Nyquist plots, the numbers reported in the figure indicate the log of the frequency; (b) Bode plots; and (c) evolution of the electrolyte resistance RΩ and of the single contributions to polarization resistance Rp over time.
Energies 14 03674 g001
Figure 2. BSE-SEM surface micrograph and EDX mappings of the cathode–electrolyte interface (a) before and (b) after cell testing.
Energies 14 03674 g002
Figure 3. Elemental content evolution in the cathode and the electrolyte layers as a function of the distance from the interface, represented as a dashed line, for (a) the tested sample and (b) the non-tested sample. EDX point measurements were acquired at each cross on the SEM-BSE micrograph inserted at the top of the figures.
Energies 14 03674 g003
Figure 4. BSE-SEM micrograph of the cathode–electrolyte interface after selective dissolution of LSCF.
Energies 14 03674 g004
Figure 5. Low incidence angle (2°) X-ray diffractogram of the cathode–electrolyte interface after the selective dissolution of LSCF.
Energies 14 03674 g005
Figure 6. XPS windows spectra of the tested interface and the reference sample (a) Ce 3d core-level spectra; (b) Sm 3d5/2 core-level spectra; (c) La 3d core-level spectra; (d) Sr 3d core-level spectra; (e) Fe 2p core-level spectra and (f) C 1s core-level spectra.
Energies 14 03674 g006aEnergies 14 03674 g006b
Figure 7. Schematic of the strontium segregation and lanthanum, cerium and samarium diffusion.
Energies 14 03674 g007
Table 1. Quantities used for slurries preparation.
SlurriesPowder (g)Graphite (g)Ethanol (g)MEK (g)TEA (g)PVB (g)PEG (g)BBP (g)
Cathode (LSCF)251.95.95.61.220.80.8
Cathode Functional layer (LSCF-SDC)LSCF-SDC
12-12
1.95.95.60.820.80.8
Electrolyte (SDC)2206.86.80.820.80.8
AFL (NiO-SDC)2204.54.511.750.70.7
Anode (NiO-SDC)63513132522
Table 2. Fitted elements and mean time constants of the three semicircles.
TimeL (H)RΩ (Ω·cm2)Rhf (Ω·cm2)CPEhf (F) (nhf)τhf (s)Rmf (Ω·cm2)CPEmf (F) (nmf)τmf (s)Rlf (Ω·cm2)CPElf (F) (nlf)τlf (s)
0 h1.3 × 10−622.40.62.4 × 10−3
(0.60)
3.4 × 10−43.02.3 × 10−2
(0.60)
2.3 × 10−224.47.6 × 10−2
(0.87)
5.5
17 h1.2 × 10−625.20.53.5 × 10−4
(0.75)
2.1 × 10−45.53.1 × 10−2
(0.45)
1.8 × 10−231.65.2 × 10−2
(0.88)
4.9
40 h6.6 × 10−733.83.31.9 × 10−3
(0.57)
1.7 × 10−44.77.3 × 10−3
(0.74)
1.8 × 10−237.63.3 × 10−2
(0.86)
4.4
Table 3. Equivalent capacitances for the three mechanisms, calculated according to Musiani [36].
Equivalent Capacitance, Ceq [F cm−2]
Aging TimehfMfLf
0 h3.06 × 10−53.87 × 10−38.33 × 10−2
17 h1.94 × 10−53.57 × 10−35.56 × 10−2
40 h4.14 × 10−52.23 × 10−33.41 × 10−2
Table 4. Elemental composition (atomic%) of the tested interface, reference SDC and reference LSCF obtained by XPS. Adventitious carbon, cobalt and residual chlorine were removed from the elemental composition. ND (Non Determined).
AreaCCeSmLaSrFeO
Tested interfaceND10.22.24.64.111.367.7
Reference SDCND19.44.4NDNDND76.2
Reference LSCF8.5NDND4.715.45.765.7
Publisher’s Note: MDPI stays neutral with regard to jurisdictional claims in published maps and institutional affiliations.

