Article

Methodology for Calculating the Energy Security Index of the State: Taking into Account Modern Megatrends

by
Andriy Stavytskyy
1,
Ganna Kharlamova
1,*,
Olena Komendant
2,
Jarosław Andrzejczak
3 and
Joanna Nakonieczny
4
1
Faculty of Economics, Taras Shevchenko National University of Kyiv, 01033 Kyiv, Ukraine
2
Department of Economic Security and Financial Investigations, National Academy of Internal Affairs, 03035 Kyiv, Ukraine
3
Institute of Information Technology, Lodz University of Technology, 90-001 Łódź, Poland
4
Faculty of Management, Rzeszow University of Technology, 35-959 Rzeszów, Poland
*
Author to whom correspondence should be addressed.
Energies 2021, 14(12), 3621; https://doi.org/10.3390/en14123621
Submission received: 16 May 2021 / Revised: 7 June 2021 / Accepted: 16 June 2021 / Published: 18 June 2021
(This article belongs to the Special Issue Biowaste Management)

Abstract

:
Energy issue stays a top priority for the national security of most countries. Despite numerous international forums, large-scale geoeconomic research, international and national projects, and the development of appropriate strategies, the issue of energy security assessment and understanding of its terminology is not a universal practice. The presented study has an ambitious goal to develop a methodology that can provide an objective picture of the energy sector on an international scale with cross-country comparisons under the influence of modern megatrends. Based on 29 indicators, according to the World Bank data since 1991, the energy security index is calculated for the set of world states with further analysis of the cluster dynamics of their common trends in energy security. The index showed its objectivity and resistance to existing shocks in geoeconomic dynamics. An important feature of the proposed index is the possibility to compare the energy security index with 1. This value is, in fact, a European average: if a country has an energy security index greater than 1, it means that its energy level is currently better than the European average, and if it is lower than 1, it means that it is inferior to the level of energy security currently achieved on average in Europe. The concept of calculating the index of energy security of the state is based on a unified comparison of all countries, which allows us to move away from the use of signaling approaches and eliminate subjectivity in calculations, as well as provide a basis for dynamic comparison of energy security. The vital aspect of the index is that it takes into account changes in the energy paradigm, the transition to alternative energy sources, and the comprehension of the role of energy efficiency, in particular, of fossil fuels. The study identifies clusters of countries that have consistent similarities in energy security, which can usually be of practical interest in developing energy strategies and understanding the similarity of geoeconomic interests of these states. Thus, this article contributes not only to the development of scientific approaches to the assessment of energy issues, in particular, through the methodological development of a representative index, but also through the presentation of statistically sound results for further effective management decisions at the state level.

1. Introduction

Energy is widely understood as an important component of national security [1]. The concept of “energy security” has become widely used and closely related to the security of the country [2], given that the problem of providing the economy and population with energy resources is becoming more complicated every year in general (in particular, from a European point of view). The world currently faces the fight and intensive search for energy resources. Despite the technological development and the integration of robots in our life, still, most wars and world conflicts are about energy resources. Quite obviously, most governments and international unions are increasingly worried about the stability in the energy sector and the availability of peaceful alternatives that will be harmless to the environment [3].
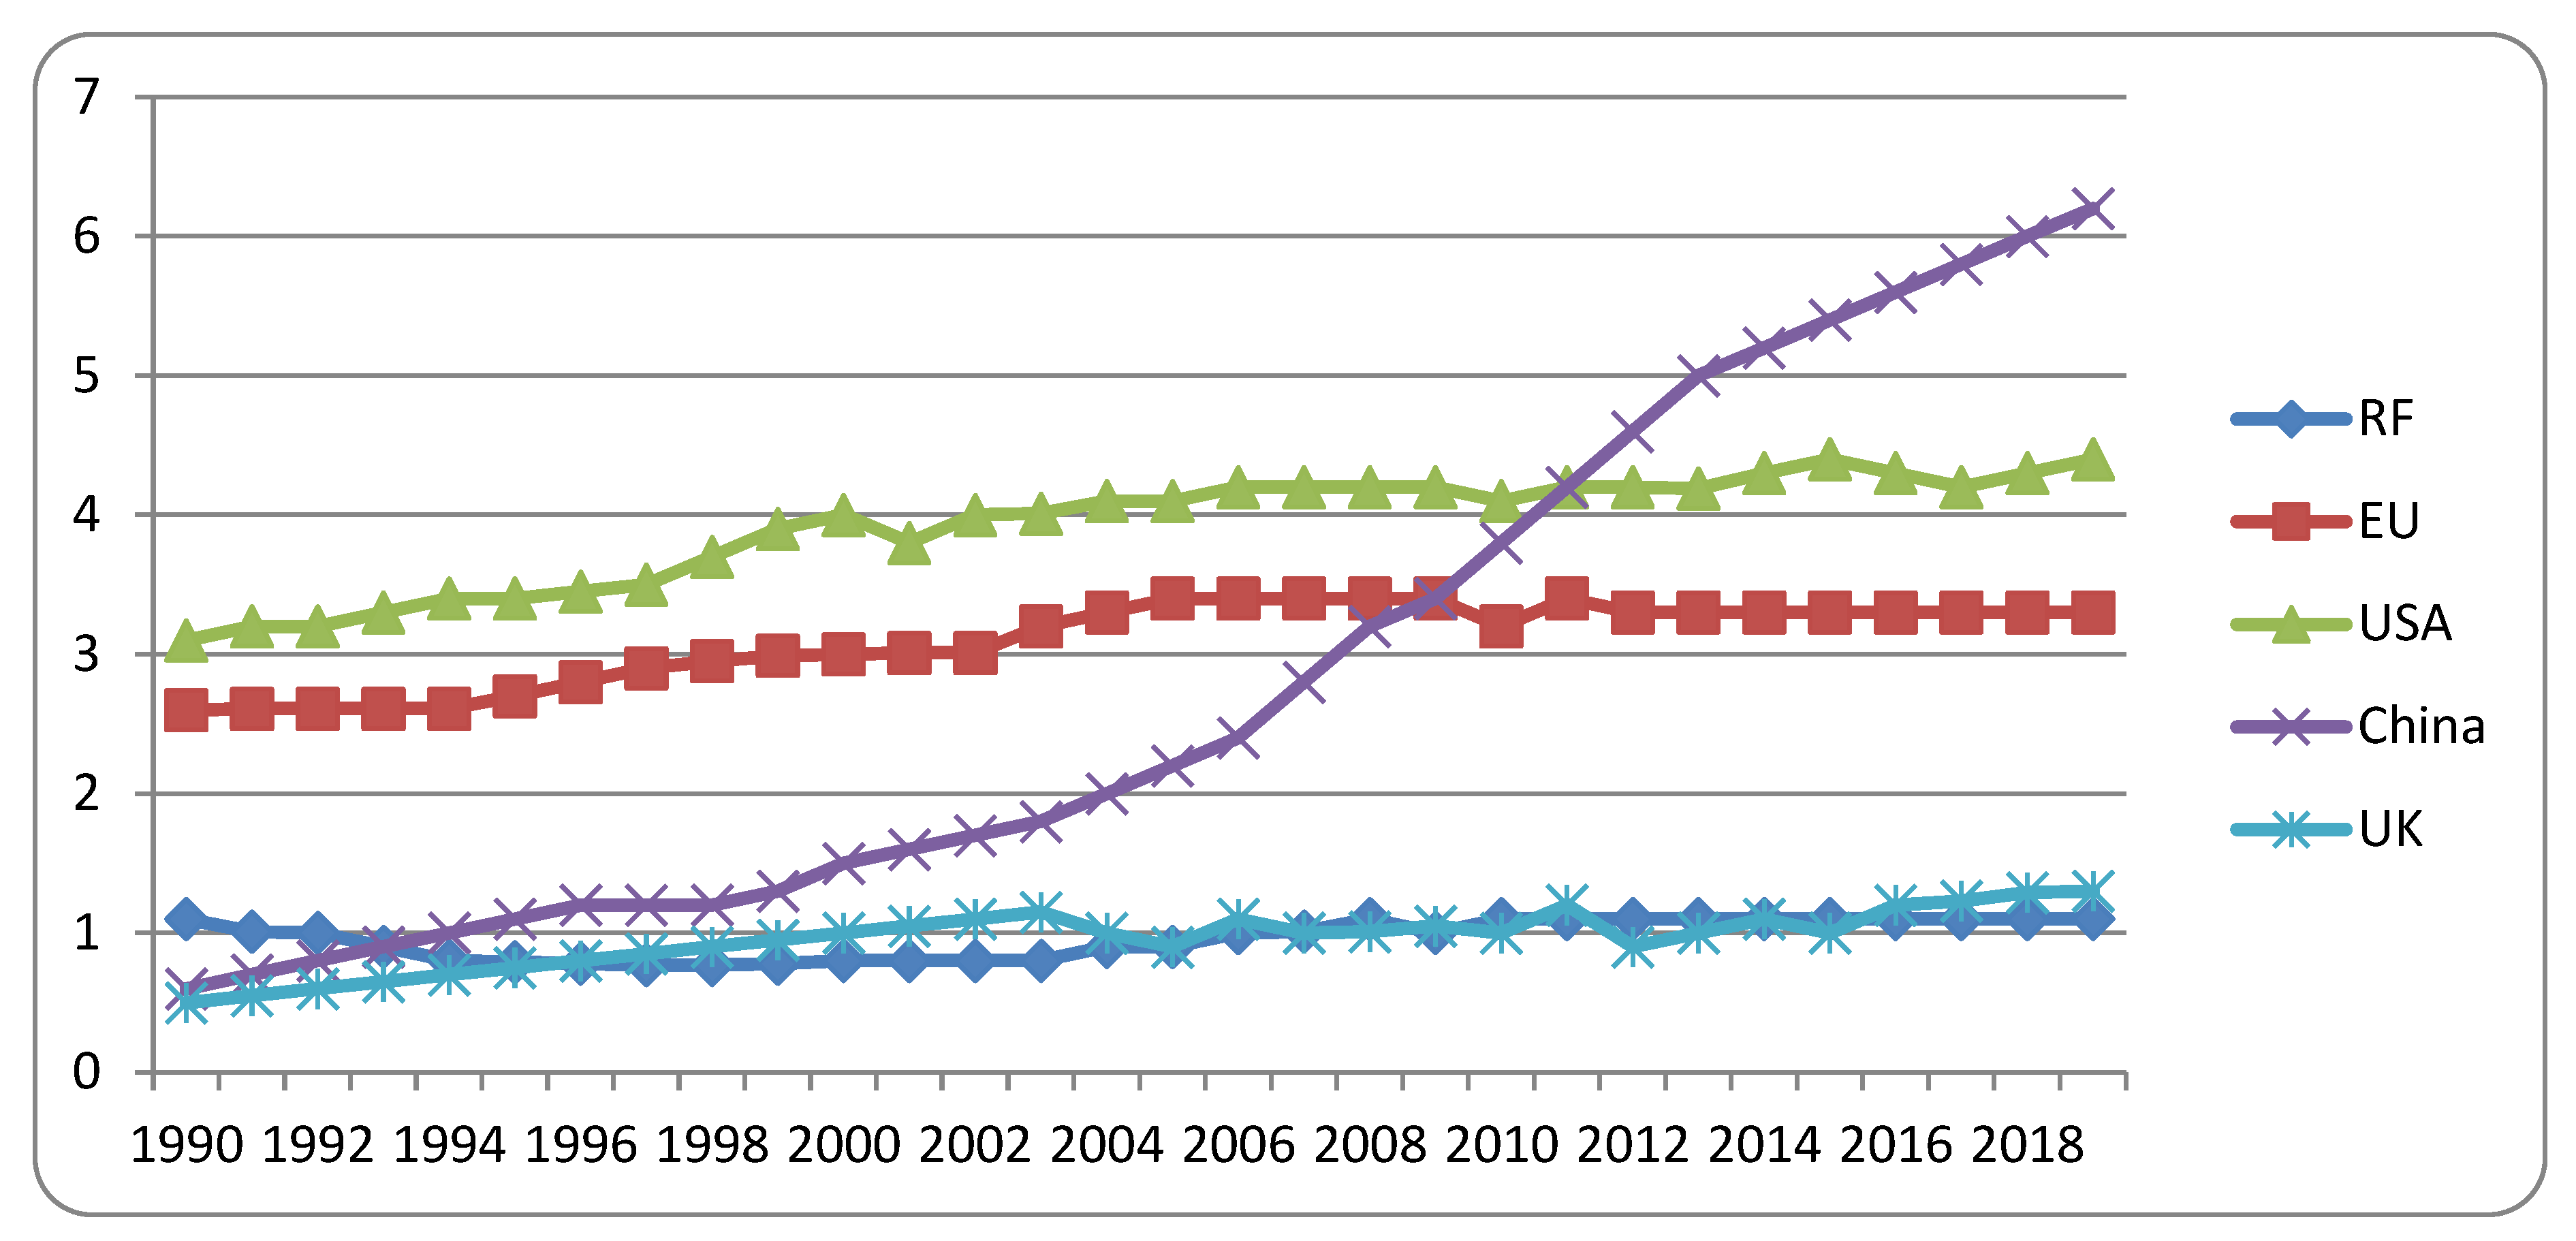
Despite the constant steps towards circular economy and sustainable development, countries are increasing electricity consumption (Figure 1); one of the triggers for this is, in particular, digitalization. Scientists’ forecasts show that energy consumption will not decrease in the coming decades [4].
The term “energy security” is used almost everywhere in economic and political discussions related to energy supply [5]. However, it should be emphasized that different authors attach several meanings to the concept of energy security. Quite often, this term is used to give more importance or relevance to the issues covered, which are often not inherently related to energy security [6]. For example, the Shannon–Wiener formula addresses the issue of diversification of resource use, rather than the direction of their supply [7]. The trilemma index focuses on only three areas of energy security [8,9].
Energy security, in general, can be seen as ensuring uninterrupted access to energy resources at an affordable price [9,10]. Currently, there is a systematic reduction in hydrocarbon fuel reserves. It stimulates the ongoing efforts of some countries, mainly oil and natural gas exporters, to put pressure on energy importers to achieve their political goals. Thus, the issue of energy security becomes even more important.
The concept of “energy security” first became the subject of theoretical and practical research only in the early 1970s because of the first world energy crisis, which was associated with the embargo of OPEC member countries on oil supplies to developed countries [11]. The response to these challenges has been in the realization of a comprehensive definition of energy security by the UN World Energy Council as the assurance that energy will be available in the quantity and quality required under such economic conditions [12].
Based on the above definitions, it is advisable to identify the characteristics of energy security of the state:
  • first, it is one of the most important components of economic security that shows the level of energy resources that guarantee to the state its full life;
  • second, it is considered in the scale of the appropriate state of security of the fuel and energy complex and its ability to ensure energy independence of the country.
The country’s energy independence is determined by the readiness of the country’s fuel and energy complex to withstand the destabilizing influence of internal and external factors that threaten the country’s independent policy in the field of energy supply of the economy and population [13]. In addition to the usual diversification of fuels, this includes ensuring the invulnerability of its own extracted minerals, independence in making geopolitical decisions, and assessing the reliability and predictability of actions of energy exporting partners to prevent pressure, such as has occurred with the Russian Federation’s push on Ukraine.
The energy security of the state has quantitative and qualitative indicators. A quite principal indicator is the production of energy [14]. Prospects for the development of the fuel and energy complex (FEC) of any modern state, as well as strategic objectives to strengthen the country’s position in the global system of division of labour, make new demands on the security and reliability of almost all FEC facilities. For example, under modern conditions of strengthening terrorism, this factor must be taken into account when forecasting existing or potential forms of danger to high-risk facilities, which include fuel and energy facilities—nuclear and hydropower plants, oilrigs, gas and oil pipelines, hydrocarbon storage facilities, power lines, and others. Damage to these facilities can lead to emergencies and significant losses to the national economy, the death of hundreds of thousands of people, significant economic damage, and large-scale environmental consequences [15].
Special emphasis should be placed on the paradigm shift in energy security in recent years, which is associated with the transition to alternative energy sources and ensuring the greening of energy security.
Thus, attempts to define the essence of the concept of “energy security” were not systematic and were marked by a variety of approaches (i.e., [16,17,18,19]) and some with insufficient justification. The same applies to methods of calculating energy security. In particular, the most common of them are:
  • International energy security risk index-analysis of the methodological settings [7];
  • Index of U.S. energy security risk [8];
  • World energy outlook 2020 [9].
Different approaches are also characterized by attempts to develop analytical tools for assessing the level of threats and the state of energy security, but they do not make it possible to clearly define the subject field of energy security and define the scope of its concept. At the same time, the need to assess the level of energy security in Europe and the world, in general, is urgent [20]. Therefore, the scientific problem of the paper is to supplement the existing literature with enhanced methodology of the energy security assessment that could be adaptive to the current situation in the world and spread over a wide range of states.
This article, as a research paper, considers the possibility of creating a methodological approach to energy security assessment that takes into account the strengths of existing methods but is easy to calculate, adapted to existing data in open access, effective in cross-country comparisons, and takes into account current megatrends and geopolitical trends. Note that we consider megatrends as “trends that occur on a large scale; they, therefore, affect large groups of humans, states, regions, and in many cases, the entire world”, according to [21]. Such a formulation of the research question stimulated the presentation of the material in the following logical sequence: the introduction reveals the problem area and emphasizes the feasibility and relevance of this scientific research, which aims to close a scientific gap and be a springboard for further research by a wide range of scholars of this field [22]. The literature review is based on three vectors to confirm scientific methodology and justify the novelty of the work:
-
the consideration of key searches for the term “energy security” in the last 10 years,
-
the analysis of existing publications on methods of energy security assessment,
-
a critical consideration of scientific works to confirm or refute the hypothesis of the impact of economic development and modern megatrends on energy security [23].
The methodology section reveals the key essence of the authors’ approach to the calculation of the energy security index. It follows up with the assessment of the countries of the world by the authors’ approach, their clustering and critical qualitative understanding of the obtained quantitative results. That is reflected in the results section [24]. Conclusions and consideration of the possibilities of continuing the scientific discussion on the chosen topic conclude this article.

2. Literature Review

Energy security is the most important component of the comprehensive security of both individual states and the world as a whole [25]. At the same time, it is impossible to allow the access factor, depending on the energy sector, to become a cornerstone in geopolitical and geoeconomic areas. Rationalization of the use and integration of energy markets should be based on a well-thought-out symbiosis of supranational and national competence in the form of clearly defined economic and legal models of both states and supranational structures [26]. In addition, emergencies and cyclical crises in the energy sector and in ensuring its security are on the agenda when developing strategies to universalize relations between energy producers and consumers. At the same time, the tasks facing states differ significantly from countries that consume energy and countries that deal with their supply or transit [27].
Energy security is a systemic process, part of which are national policies and international institutions [28]. Their goal is to respond in a coordinated manner to failures, problems, and operational emergencies. Thus, ensuring energy security is impossible without active international cooperation, the basis of which should be international institutions. The importance of the problem of energy security policy is based on the general social significance of energy, which consists of four main aspects of its use by the socio-economic system [29]:
(1)
functioning, i.e., ensuring basic human needs and energy supply of economic activity;
(2)
maintaining the existing level of infrastructure of modern society;
(3)
use of energy to ensure population growth, capital, and consumption;
(4)
ensuring the dynamics of changes in economic infrastructure, technical progress, and productivity growth.
An important factor that should be highlighted when considering energy security is the depletion of natural resources, and these resources are usually extracted in the so-called “developing countries” and consumed mostly by developed countries, which leads to imbalances in socio-economic relations between these groups of states [30]. To ensure the reduction of this gap in the level of socio-economic development, an updated architecture of international institutions capable of prudent control of national and supranational relations in this area is needed [31].
In general, most articles on energy security introduce their wording of the term “energy security”, such as [32]. For example, energy security is defined by the World Energy Council as “… the confidence that energy will be available and in the quantity and quality required by economic conditions …” [33]. International Energy Agency formulates energy security as “… continuous physical availability of resources at a price that is acceptable in terms of environmental compliance …” [10,34,35,36,37,38,39]. However, all scientists agree that energy security is a dynamic phenomenon [40]. Thus, there are long-term and short-term energy security’s aspects. The first is mostly about the economic aspects of timely energy supply and environmental safety [36]. The second is oriented on the prompt adaptation of the energy system to sudden threats or changes in the energy balance [10].
Based on the above [37,38,39,40,41,42], the following definition of energy security in the system of modern geoeconomic threats can be given:
Energy security is the state’s ability to ensure efficient use of its fuel and energy, to optimize diversification of sources and resources to ensure the livelihood of the population and volatility of prices for fuel and energy resources or to create conditions for rapid adaptation of the national economy to new prices for these resources.
Therefore, the authors’ approach clarifies the definition of “energy security” as the correspondence of the country’s development indicators to similar indicators of other countries, which allows for a dynamic comparison of countries without taking into account certain weights, as well as automatically taking into account any fundamental changes in the world.
Analyzing the methods of assessing energy security over the past 10 years, several typical trends can be noted:
(1)
the state of energy security and its components is assessed using appropriate methods and analysis of specially designed sets of representative quantitative indicators [43]. Their composition depends on many factors [44], for example, geography and country size [45], the type of the economy [46], and the level of economic development, i.e., GDP [47], and the specific indicators of living standards, etc. [48];
(2)
due to the diversity of energy structures, national energy balances, each country tries to build its energy security system and adapt it optimally to its priorities to counter internal and external threats, including economic, increased international economic interdependence, and the desire to increase own level of global competitiveness [49];
(3)
there are a few features of the calculating method of the state and indicators of energy security. The first step of the calculation algorithm is the determination of the normalized values of individual indicators, for example, index-indicators [49,50] of the individual sectors of the economy [47] or the economy as a whole [51]. Then, the integrated index of energy security is determined on this basis, using the weights of the special procedure determined;
(4)
the indicators used to assess safety are, to some extent, inherent in the properties of the criteria. It is believed that “the true criterion for building any system (energy security system) is the possibility of its accounting” [52]. It is also obvious that the number of indicators for the region [53] or a type of economic activity [54] is much smaller than for the country as a whole [55]. It can be expected that any set of indicators is not final and will be adjusted, improved, or refined over time [56]. Therefore, the methods usually assume their periodic updating; sometimes it is drastic in the life cycle and the emergence of new threats to the risks of hazards.
(5)
some countries, such as Ukraine, do not have a specially developed and officially recognized method for calculating energy security [57]. For example, in Ukraine, there are recommendations for the definition of energy security as a component of economic security that are contained only in the methods of economic security calculating (since 2007). That was the first time when the indicators of the components of the economic security of this state, and hence, the energy security, received more or less objective quantitative estimates [58].
After the critical review of world practices, it is likely to claim that the GEI world survey (Global Energy Institute) is particularly successful. It was conducted for a long period of historical data for a large set of countries, which insures its validation. GEI as a research organization at the US Department of Energy’s Chamber of Commerce has developed and is supporting the international energy security index project [10,59]. The project “international index of energy security risks” provides a rating assessment of energy security for different countries. Relevant editions of 2018, 2019, and 2020 are publicly available [International index 2020]. These estimates are performed on 29 parameters of energy security profiles. In this case, the base year is 1980, i.e., the risks are calibrated according to OECD indicators in 1980, which correspond to 1000 points. In general, GEI energy security assessments cover the period from 1995 to the present [60].
Critical consideration of scientific work on the confirmation or refutation of the hypothesis of the impact of economic development and modern megatrends on energy security allows us to identify the following meaningful triggers:
(1)
to test these hypotheses, most scientists use the production function, which describes the functional relationship between production volumes and economic costs [61]; econometric modelling [62]; systems of network analogies of optimization models of production type; optimization problems; the economic and mathematical model of the fuel supply system, presented in the form of a theoretical fuel supply network; a model taking into account the indicator of energy security “share of imports from one source”; and the linear programming [63];
(2)
the autoreactive evolution of energy use and new technologies pushed economic growth [64,65]. There is the proven opinion that energy prices have had a crucial long-term role in economic development as well [66,67].
Thus, the analysis of modern scientific literature and international practice proves the existence of a scientific gap in both methodological and substantive sense of energy security assessment, which is the task of this study.

3. Methodology

The modern economy assumes that the main actors in the market are households and firms that are related by certain relationships. These are the entities that determine the main components of our analysis. The exchange of certain resources is required for the functioning of firms and households. The availability of the resource market should reflect the state of supply of various resources, availability, and the efficiency of their use. First, we should focus on indicators that characterize energy security. In particular, the following groups of indicators are identified:
(1)
indicators of consumption of natural resources;
(2)
indicators of resource depletion;
(3)
indicators of efficient use of resources;
(4)
indicators of attracting new energy sources;
(5)
indicators of pollution due to mining activities;
(6)
indicators of access to resources.
It should be noted that this division requires further development and selection of specific indicators for each group of indicators. In this case, the following certain principles are applied to obtain comparative data:
(1)
indicators cannot be selected as officially calculated only in the national currency. This is because countries have been able to devalue their currencies at convenient times, which does not reflect the real state of affairs at purchasing power parity;
(2)
indicators cannot be estimated in nominal terms, such as population, as these indicators only indicate the potential of the economy but not the state of their effective use or involvement in economic processes;
(3)
the indicators cannot be incomparable with the indicators of other countries. The peculiarity of the authors’ methodology is that any indicator must be compared with a certain world level, and therefore, the method of their calculation should be similar;
(4)
indicators must have a certain history, at least 10 years. It should be noted that all calculations should be based on a complete database.
Thus, the calculation of the new energy security index should be based on these principles. Obviously, the variety of links increasing should not change the concept of security but only indicate a set of relevant indicators. It is clear that the more interconnections are created in the economy, the more accurate the calculation of energy security will be.
To create an adequate comparative base, each of the parameters selected for the calculation of a particular type of security must be normalized to a certain world value. Intuitively, the average value for all countries can be considered as such an indicator. In addition, it is possible to conduct rationing to the leading country, but, in our opinion, such a calculation will lead to certain distortions, because the leading country on one indicator may be an outsider on the other.
The question remains—which mechanism of combining indicators should be taken into account? In most scientific papers [68,69], the authors gave some weight to each indicator, which created a rather subjective nature of the study. Indeed, if today a scientist believes that macroeconomic stability is unimportant and gives it a weight of, for example, 0.2, then in a few years, during a financial or economic crisis, other scientists will require a completely different weight, for example, 0.8. Due to this subjectivity, the weight approach cannot be used in the long run. One solution is to find a certain mean value that is not based on the arithmetic mean. Apparently, this value can take the same values for indicators with high and low volatility. In our opinion, a country with a stable security indicator should not have significantly volatile indicators. Therefore, the geometric mean is quite appropriate to calculate the safety index based on several indicators. Therefore, the objective function decreases if the components differ significantly from each other.
Special mention should be made of the rules of rationing of disincentives. If the indicator characterizes the state of the economy as positive, then obviously, the greater its growth, the better for the economy. However, if the indicator harms the economy, it is not possible to direct its inclusion in the calculations [70,71]. To solve this problem, such indicators were listed individually. For example, if an indicator shows a percentage of a certain value, then another is used instead that is equal to the difference between 100 and the initial indicator. In addition, if the indicator measures the number of days for bureaucratic procedures, which is understandably a disincentive for the economy, it is normalized by the obvious formula:
New value = 1/Old value
Thus, the energy security index for country s at time t is calculated by the formula:
I t s = f ( j = 1 u g j t s g j t w )
where:
g j t s —the value of the safety indicator for the j-th group of the index at time t in the country s;
g j t w —the value of the safety indicator for the j-th group of the index at time t on average in all countries of the world participating in the study;
u —the number of parameters when calculating the index;
f ( ) —conversion function that allows normalizing the value. In most cases, such a function can use a root of a degree that corresponds to the number of elements taken into account in the formula.
The value of the indicator within the group is based on similar formulas, but special functions are used to eliminate the impact of the lack of data in the database:
g j t s = W ( k = 1 p j H j k t s )
where:
H j k t s = { K j k t s K j k t w , if K j k t s exists   and   K j k t w is   calcualted   for   more   than   30   countries , 1 ,   otherwise ,
K j t s —the k-th statistical indicator from the database for the country s, which is used to calculate the indicator of the j-th group of the index at time t;
K j t w —the average value for the above indicator for all countries for which information is available at time t;
p i j —the number of indicators for calculating the indicator of the j-th group of the index;
W ( ) —rationing function, which can change the impact of a particular indicator. This study uses a linear rationing function, which guarantees the same weight of all considered indicators.
The description of the composition and structure of each safety index indicator is the next stage. Remember that the state of provision and efficient use of available resources and the possibility of obtaining them is considered the level of energy security. The list of indicators for different groups of the indicator is given in Table 1, Table 2, Table 3, Table 4, Table 5 and Table 6.
It should be noted that the part of the indicators, which according to the logic of construction, should have a positive sign, were negative according to the World Bank. The following procedure is used to resolve this issue. If negative values are observed for a certain relative indicator, the number 100 is added to it, which makes it positive. This is necessary to enable the correct usage of the conversion tool for destimulators. The study found that such a mechanism should be used for the indicator “Energy imports, net (% of energy consumption)”.
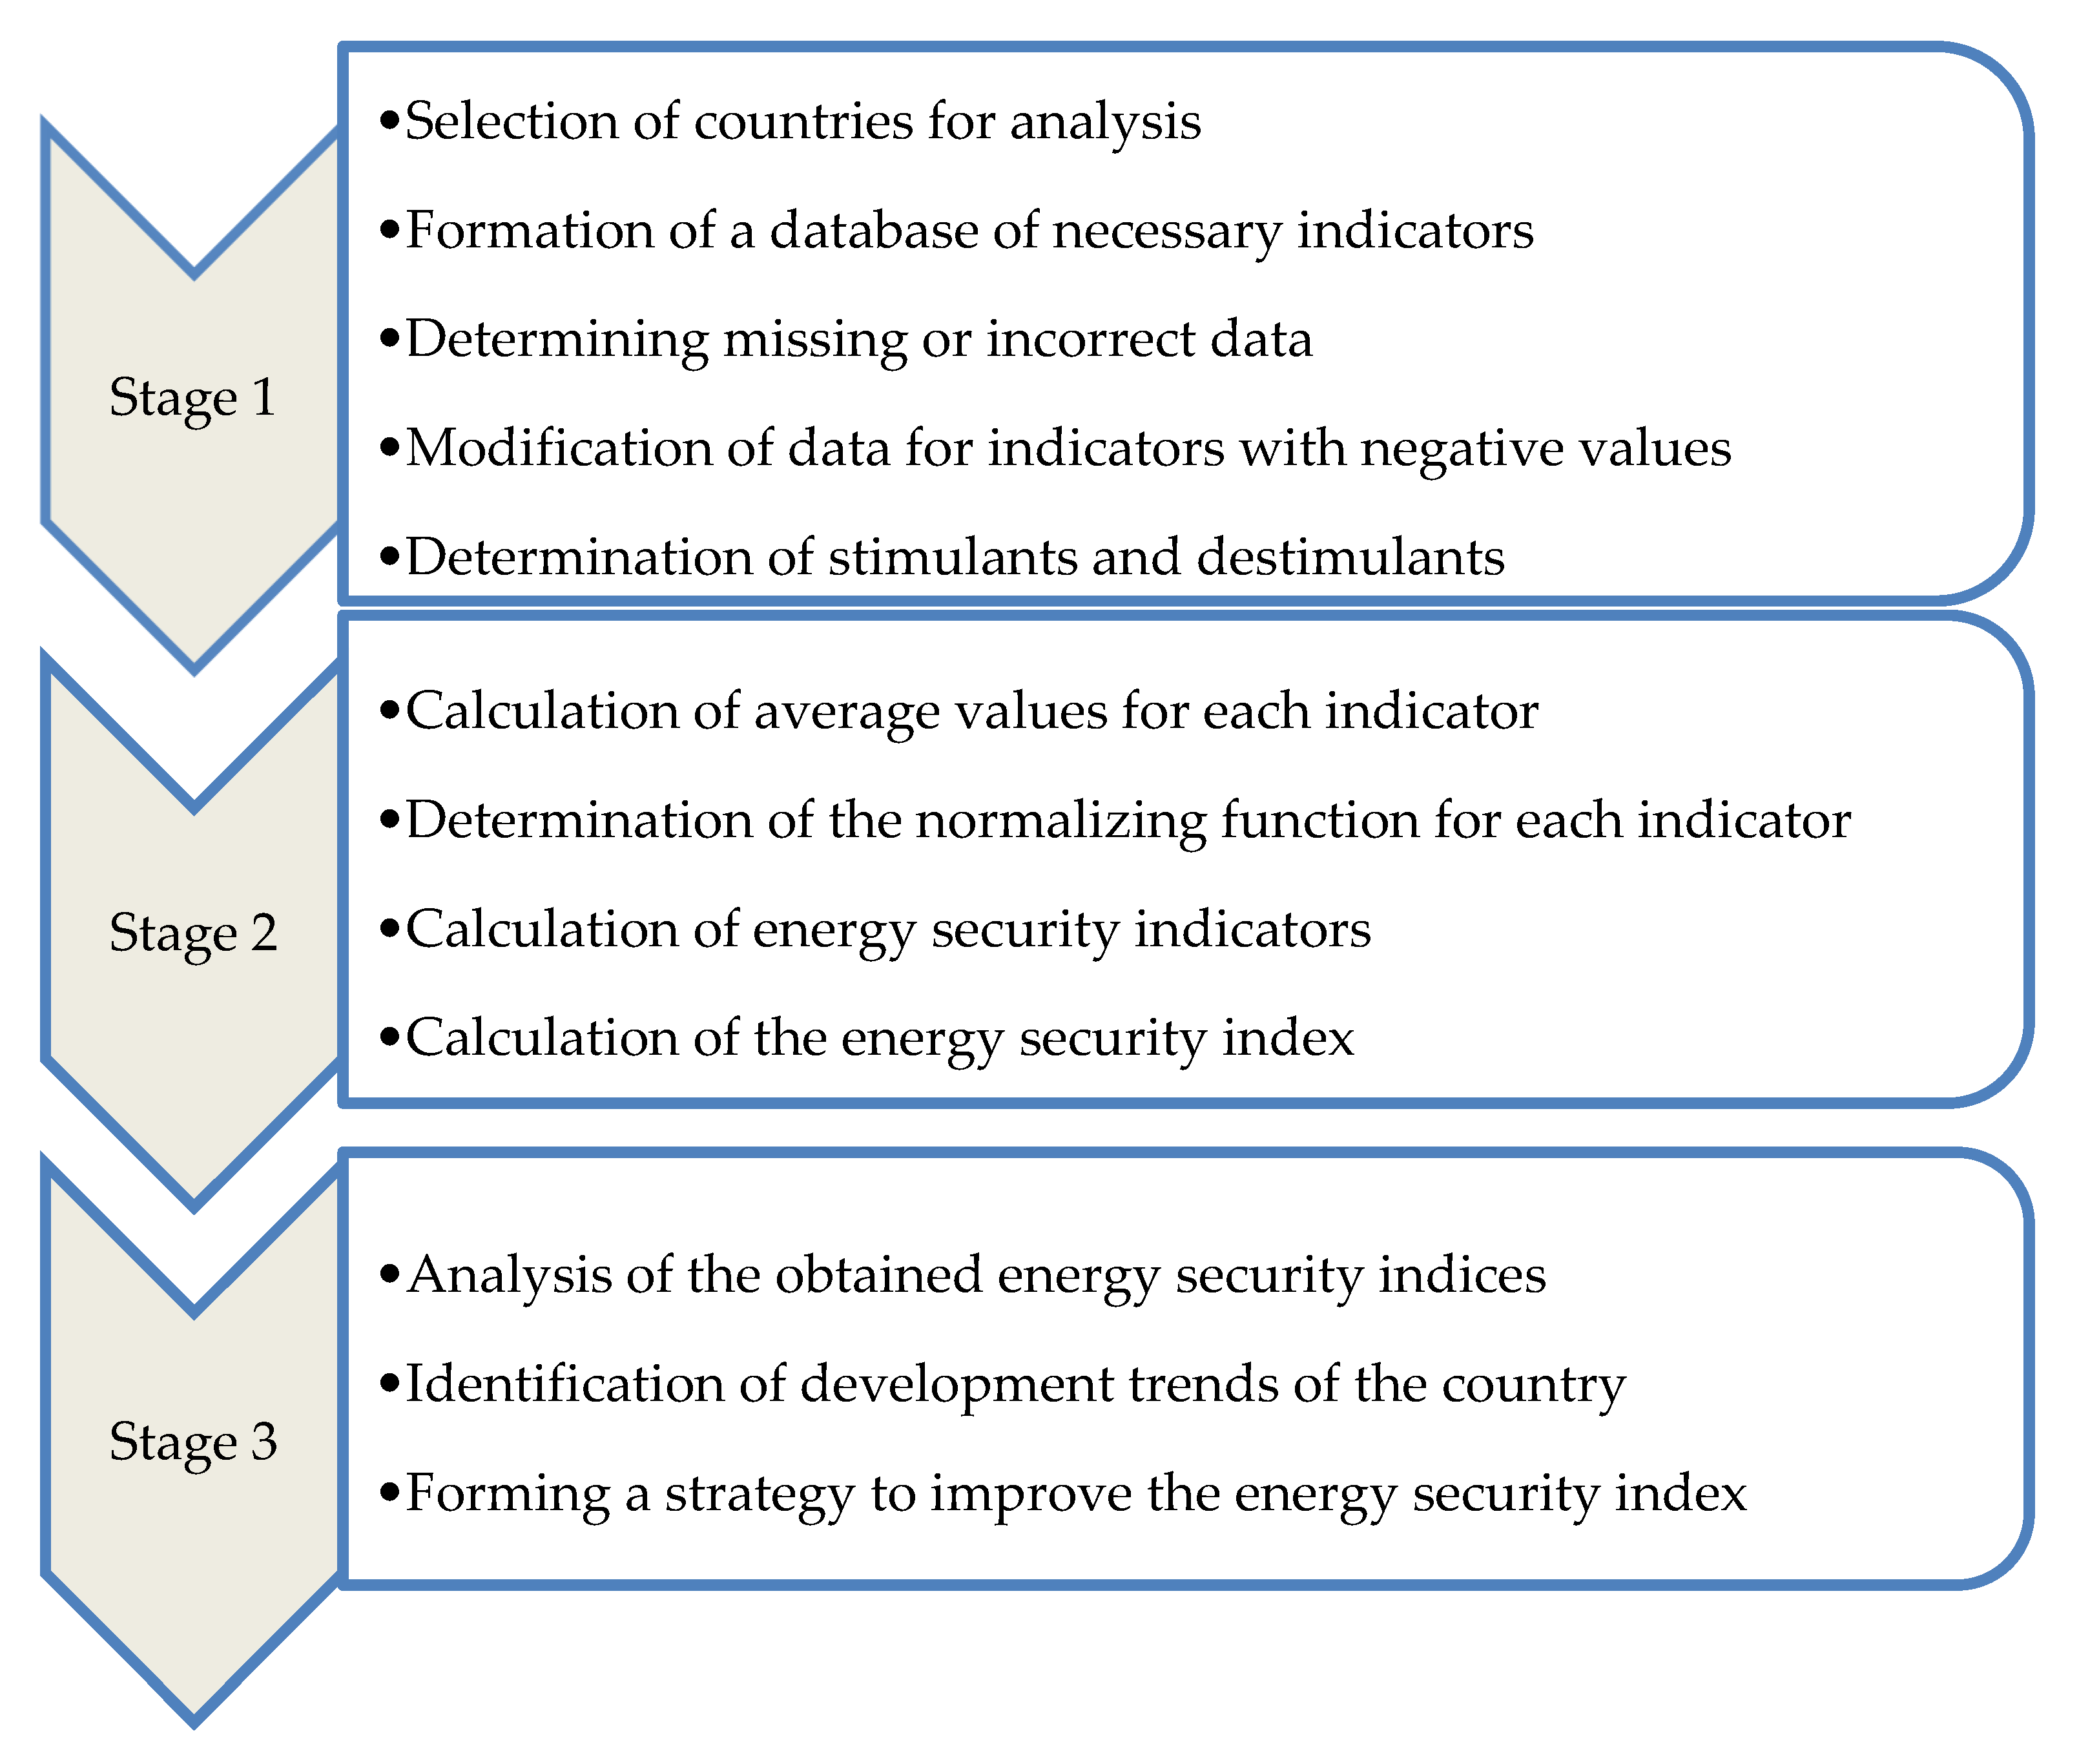
This concept is the basis for calculating the energy security index for different countries, but in this paper, only European countries are depicted. Schematically, the calculation of the economic security index was carried out in several stages (Figure 2).
The first stage of research was the collection of a database that allowed the calculation of all the parameters considered. In the study, annual data from the World Bank database since 1991 were used (Appendix A Table A1). The database indicated the appropriate stimulants and destimulators in accordance with the method, the normalization of data according to the above rules.
In the second stage, all the necessary calculations described in the methodology were performed. For European countries, the undoubted advantage of the analysis is the completeness of the data. In fact, for observations of all 183 indicators, until 2016, most of the data are present, and since 1995—almost all data for all countries. Due to this, from this year on, it is not necessary to apply the rule according to which only those indicators calculated for at least 30 states are taken into analysis. In total, calculations were performed for 49 European countries. Unfortunately, the World Bank database does not have a significant amount of data for 2003–2005 and partly for 2016–2017, which forced us to abandon some of the calculations for these years.

4. Results

The results of the calculations are given in Appendix A Table A2 and Table A3. Table A2 and Table A3 shows that the volatility of the change in the energy security index is quite moderate and does not change dramatically. Even during the financial crisis of 2008, the changes were not fundamental, which is an obvious advantage of the proposed methodology. This was achieved by comparing the changes in one country with the European level. Thus, during the crisis of 2008, prices for oil and other resources fell significantly, which led to the restructuring of the entire energy market. Accordingly, countries exporting raw materials experienced significant problems with filling the budget, maintaining domestic stability, and ensuring a high level of economic and energy security. If we calculate the energy security index by standard (known) methods, then for most countries, it would be necessary to show a significant decline. However, this situation was typical of a large number of states, and therefore, due to the competitiveness of the newly developed index, the fall of one country was not significant relative to other states. That is supposed to be the main advantage of the presented methodology, the index that is sensitive only to the state’s tangible changes but not to the general changes over the world.
An important issue is to compare the energy security index with 1. This value is, in fact, a European average: if a country has an energy security index greater than 1, it means that its energy level is currently better than the European average, and if it is lower than 1, it means that it is inferior to the level of energy security currently achieved on average in Europe. For example, Norway consistently shows above the level of 1, selling its resources, accumulating its assets in a special fund, and developing green energy through economic incentives.
Given a large number of indicators for calculations, it should be understood that any changes in several indicators will not have an immediate effect on energy security, but the study of trends provides an understanding of what to expect from the country and how to influence this index.
The next block of research is the clustering of countries and the study of the dynamics of changes in the composition of clusters.
In general, it should be noted that the changes in energy security in Europe were not particularly dramatic. Most states, if they changed the cluster, usually returned to it in a few periods. Thus, it can be stated that the dynamic change of clusters is associated in most cases only with the manifestations of competition or the uneven introduction of new technologies.
A particular case should be mentioned—Ukraine should be analyzed separately as it has visited five different clusters in 20 years according to the integrated indicator. Noticeably, this is primarily due to the different geopolitical components of the state’s development. If, at the beginning of 2000, there was significant energy influence from the Russian Federation, then after the revolutions of 2004 and 2014, the energy balance was transformed. The 2004 revolution changed one oligarchic system to another. This change was not easy in the energy sector as Ukraine was forced to switch to market energy prices. Not taking into account the significant corruption component, such a transition led to a significant reduction in resource consumption, the abolition of energy purchases in Turkmenistan, changes in gas transit payments, and so on. These changes were significant and were accompanied by gas and gasoline wars. The revolution of 2014 led to the war with Russia, the seizure of the energy regions of Donbas and Crimea by Russia, and the fall in the production of its energy resources by almost a third. Ukraine has also refused to purchase gas from Russia, buying it from European partners. This transformation completely changed the energy balance of the country and led to the formation of completely new schemes for the transportation of raw materials and pricing in the energy market.
Very often, clustering puts Ukraine in the same group as Malta, Cyprus, Armenia, Poland, and Hungary, i.e., countries that are highly dependent on energy supplies. At the same time, a group of Scandinavian countries, led by Norway and Sweden, seems to be stable. They have a strong resource supply and made significant progress in the introduction of alternative energy sources (Table 7).
Thus, the clustering of the states represents the groups of states that have the most common situation in energy security. These results could be helpful for geopolicy development, indicating possible partners for alliances or considering competitors in the search for new fuel sources or additional volumes, as well, the fragility of the fuel-energy complexes could be assessed as similar inside each state.

5. Discussion

This study analyzed the problem of energy security in the world. It has been shown that despite numerous attempts to propose a single methodology for analyzing the state of energy security, they have not provided an adequate final answer in the medium- and long-term [72]. The main problems of most methods are: limited factors for analysis, focus on purely national issues, lack of comparison with international counterparts, and failure to take into account technological changes in the analysis [73]. Indeed, if we consider the existing methods of the energy security index calculation, they primarily use a given set of indicators that are considered important for a particular country but that is irrelevant for another. None of the methods can take into account the effectiveness of systemic changes in the energy market: for example, the transition from coal to oil, from oil to gas, and from gas to alternative energy sources [74,75].
The proposed methodology for the energy security index calculating is based on the comparison of indicators of different countries, which allows us to automatically take into account new trends. For example, if all countries reduce oil consumption by 20% in favor of gas in the next five years, the ratio of indices will remain unchanged [57]. A similar situation will be observed in the case of new energy sources [58]. At the same time, if one of the countries is late with the transition, its energy security index will decrease significantly [59].
It is impossible to say that this approach seems to be ideal. Of course, any methodology has its drawbacks. In particular, the question of why all factors are in fact weighted with the same weight is debatable [60]. Obviously, further research can determine the optimal ratio of factor levers that will make the technique more accurate [61]. This is primarily due to the coefficients that determine the efficiency of resource use, the attraction of alternative energy sources, and the level of losses in energy transmission [73].
The second shortcoming of the methodology is related to the insufficient speed of providing statistical information to world databases [74]. It should be noted that some data are missing for a significant number of countries for 2017–2019, which forced us to make forecasts and, accordingly, reduce the accuracy of the calculation of the energy security index [75]. It is obvious that this problem will decrease with increasing quality and speed of filling of world databases or development of more efficient and reliable artificial intelligence models, as well as statistical analyses usable in forecasting methods resistant to missing or incomplete data. During the COVID-19 pandemic, most governments significantly increased their spending [76,77,78,79,80], so determining the impact on the energy sector seems relevant.

6. Conclusions

At the same time, the obtained results are already quite interesting to analyze. In particular, the paper clustered countries according to the energy security index for 2000, 2010, and 2020. This allowed us to identify common elements in the implementation of energy policy in groups of countries, as well as to determine which countries have become more or less competitive in this area. Of particular note is the increase in the index in the Nordic and Baltic countries due to the active use of alternative fuel sources and the replacement of fossil fuels.
The obtained results also contribute to further research in this direction. In particular, with the help of economic and mathematical modeling, it is possible to study the impact of fiscal and monetary policy on the state of the energy security index in European countries. Such an analysis would be particularly useful using panel regression, which would allow the study of commonalities and differences in response to relevant macroeconomic shocks.
The calculated table of energy security indices also allows studying in more detail the dynamics of changes in individual countries and their relationship with macroeconomic parameters. This area of research is designed to promote the development of national energy strategies.
No less important is the analysis of changes in energy security indices in geopolitical discourse. For example, the struggle for energy spheres creates a controversy over the feasibility of building certain gas pipelines in Europe, such as Nord Stream-2. Evidently, the proposed method automatically takes into account all changes without reconfiguration and, therefore, allows the predicting of the index in different scenarios.

Author Contributions

Conceptualization, G.K. and O.K.; methodology, A.S.; software, J.A.; validation, A.S., G.K., and O.K.; formal analysis, A.S.; investigation, J.N.; resources, J.A.; data curation, J.A.; writing—original draft preparation, A.S., G.K., O.K., and J.N.; writing—review and editing, A.S., G.K., O.K., and J.A.; visualization, J.A.; supervision, G.K. All authors have read and agreed to the published version of the manuscript.

Funding

This research was carried out as a part of project no. POIR.01.01.01-00-0281/20-00, entitled: “Predictive energy management system EnMS”, co-financed by the National Center for Research and Development.

Data Availability Statement

Free data access of [8,9,10,59] and Data of World bank (Appendix A Table A1).

Acknowledgments

Authors would like to acknowledge the support given by the Institute of Information Technology, Lodz University of Technology and FINN sp. z o. o. for sharing a research infrastructure as well as technical and essential support.

Conflicts of Interest

The authors declare no conflict of interest. The funders had no role in the design of the study; in the collection, analyses, or interpretation of data; in the writing of the manuscript, or in the decision to publish the results.

Appendix A

Table A1. Data sources for the study of the energy security index.
GroupIndicatorLink
resource consumption groupFossil fuel energy consumption (% of total)https://data.worldbank.org/indicator/EG.USE.COMM.FO.ZS (accessed on 1 March 2021)
Renewable energy consumption (% of total final energy consumption)https://data.worldbank.org/indicator/EG.FEC.RNEW.ZS (accessed on 1 March 2021)
Electric power consumption (kWh per capita)https://data.worldbank.org/indicator/EG.USE.ELEC.KH.PC (accessed on 1 March 2021)
Energy use (kg of oil equivalent per capita)https://data.worldbank.org/indicator/EG.USE.PCAP.KG.OE (accessed on 1 March 2021)
Energy use (kg of oil equivalent) per $1000 GDP (constant 2011 PPP)https://data.worldbank.org/indicator/EG.USE.COMM.GD.PP.KD (accessed on 1 March 2021)
Energy imports, net (% of energy use)https://data.worldbank.org/indicator/EG.IMP.CONS.ZS (accessed on 1 March 2021)
Fuel imports (% of merchandise imports)https://data.worldbank.org/indicator/TM.VAL.FUEL.ZS.UN (accessed on 1 March 2021)
resource depletion groupAdjusted savings: energy depletion (% of GNI)https://data.worldbank.org/indicator/NY.ADJ.DNGY.GN.ZS (accessed on 1 March 2021)
Adjusted savings: mineral depletion (% of GNI)https://data.worldbank.org/indicator/NY.ADJ.DMIN.GN.ZS (accessed on 1 March 2021)
Adjusted savings: natural resources depletion (% of GNI)https://data.worldbank.org/indicator/NY.ADJ.DRES.GN.ZS (accessed on 1 March 2021)
Adjusted savings: net forest depletion (% of GNI)https://data.worldbank.org/indicator/NY.ADJ.DFOR.GN.ZS (accessed on 1 March 2021)
resource efficiency groupEnergy intensity level of primary energy (MJ/$2011 PPP GDP)https://data.worldbank.org/indicator/EG.EGY.PRIM.PP.KD (accessed on 5 March 2021)
GDP per unit of energy use (constant 2011 PPP $ per kg of oil equivalent)https://data.worldbank.org/indicator/EG.GDP.PUSE.KO.PP.KD (accessed on 5 March 2021)
Electric power transmission and distribution losses (% of output)https://data.worldbank.org/indicator/EG.ELC.LOSS.ZS (accessed on 5 March 2021)
Fuel exports (% of merchandise exports)https://data.worldbank.org/indicator/TX.VAL.FUEL.ZS.UN (accessed on 5 March 2021)
group to attract new energy sourcesRenewable energy consumption (% of total final energy consumption)https://data.worldbank.org/indicator/EG.FEC.RNEW.ZS (accessed on 5 March 2021)
Alternative and nuclear energy (% of total energy use)https://data.worldbank.org/indicator/EG.USE.COMM.CL.ZS (accessed on 5 March 2021)
Combustible renewables and waste (% of total energy)https://data.worldbank.org/indicator/EG.USE.CRNW.ZS (accessed on 5 March 2021)
Electricity production from renewable sources, excluding hydroelectric (% of total)https://data.worldbank.org/indicator/EG.ELC.RNWX.ZS (accessed on 5 March 2021)
Renewable electricity output (% of total electricity output)https://data.worldbank.org/indicator/EG.ELC.RNEW.ZS (accessed on 5 March 2021)
group of pollution due to mining activitiesAdjusted savings: particulate emission damage (% of GNI)https://data.worldbank.org/indicator/NY.ADJ.DPEM.GN.ZS (accessed on 5 March 2021)
CO2 emissions (kg per 2011 PPP $ of GDP)https://data.worldbank.org/indicator/EN.ATM.CO2E.PP.GD.KD (accessed on 5 March 2021)
CO2 emissions (metric tons per capita)https://data.worldbank.org/indicator/EN.ATM.CO2E.PC (accessed on 5 March 2021)
Adjusted net savings, including particulate emission damage (% of GNI)https://data.worldbank.org/indicator/NY.ADJ.SVNG.GN.ZS (accessed on 5 March 2021)
Adjusted savings: carbon dioxide damage (% of GNI)https://data.worldbank.org/indicator/NY.ADJ.DCO2.GN.ZS (accessed on 5 March 2021)
resource access groupAccess to electricity (% of the population)https://data.worldbank.org/indicator/EG.ELC.ACCS.ZS (accessed on 5 March 2021)
Access to electricity, rural (% of rural population)https://data.worldbank.org/indicator/EG.ELC.ACCS.RU.ZS (accessed on 5 March 2021)
Access to electricity, urban (% of urban population)https://data.worldbank.org/indicator/EG.ELC.ACCS.UR.ZS (accessed on 5 March 2021)
Table A2. The energy security index calculated.
CountryCountry Code19911992199319941995199619971998199920002001200220032004
AlbaniaALB1.0381.0951.1191.1561.1361.1821.1481.1001.1031.0611.0351.0460.9891.082
ArmeniaARM0.7290.7910.8720.8650.7990.8030.7230.7820.7800.7620.7230.7480.7640.761
AustriaAUT1.2321.2971.2851.2871.2701.2421.2301.2141.2171.1841.1981.2001.1931.200
AzerbaijanAZE0.7790.7440.6970.6780.6810.7750.7680.8120.8140.8200.7880.7790.8140.784
BelgiumBEL0.7950.8130.7900.7910.8150.8020.7820.7960.7730.7800.7870.8000.8150.819
BulgariaBGR0.7060.7140.7090.7070.7380.7290.7240.7800.7850.8380.8060.8250.8370.692
Bosnia and HerzegovinaBIH0.8250.9040.9191.0621.0601.0691.0131.0321.0400.9850.9860.9780.9680.969
BelarusBLR0.8850.8160.8190.8530.8480.8680.8720.8670.8790.9190.9260.9390.9380.749
SwitzerlandCHE1.0281.0451.0581.0651.0501.0351.0341.0301.0331.0351.0301.1061.1031.081
CyprusCYP0.5380.5490.5410.6270.8970.8880.8490.8710.8590.8540.8520.8700.8800.809
Czech RepublicCZE0.8550.8650.8490.8800.8740.8470.8420.8420.8510.8090.8200.8320.8010.819
GermanyDEU0.8270.8670.8550.8640.8550.8440.8530.8620.8680.8640.8740.9010.9220.938
DenmarkDNK1.0941.1691.1491.1621.1471.1141.1461.1501.1801.2041.1991.2141.2251.253
SpainESP1.0030.9970.9990.9980.9771.0060.9920.9790.9620.9690.9940.9731.0040.988
EstoniaEST0.8450.9660.9670.9430.8820.9170.9410.9310.9230.9450.9230.9971.0020.992
FinlandFIN1.3091.3581.3421.3301.3391.3181.3151.3221.3211.3241.2951.2921.2651.283
FranceFRA1.0531.0971.0831.1031.0791.0481.0291.0091.0090.9850.9880.9710.9720.961
United KingdomGBR0.7290.7920.7920.8230.8210.7980.8040.7980.7980.7960.7840.8000.7930.803
GeorgiaGEO1.0181.0041.0721.0151.1941.1761.1711.1511.1411.1121.1651.1451.1381.105
GreeceGRC0.9090.9561.0111.0150.9910.9830.9590.9631.0010.9990.9920.9920.9870.975
CroatiaHRV1.0701.1331.1611.1041.0921.0900.9831.0161.0080.9221.1311.1231.1190.964
HungaryHUN0.7480.7700.7480.7600.7510.7390.7240.7150.7120.7080.7150.6990.7460.795
IrelandIRL0.8500.7960.8200.8280.8050.8130.8320.8440.8320.8260.8350.8540.8320.857
IcelandISL1.2361.2741.2541.2931.2531.2241.2141.3111.3581.3991.3751.3981.3501.376
ItalyITA0.9891.0301.0121.0160.9820.9740.9660.9590.9610.9610.9700.9831.0090.988
KazakhstanKAZ0.8370.7450.7190.7230.7500.7580.7630.7570.7730.8060.7580.7830.7790.749
LithuaniaLTU0.7660.7910.8480.8980.8750.8850.8970.9250.9450.9550.8290.8420.8580.864
LuxembourgLUX0.9700.9210.9281.0021.0121.0011.0191.0310.8680.9070.9090.8950.8840.895
LatviaLVA1.0811.0751.0901.0471.0820.9190.9290.9640.9930.9980.9891.0291.0711.115
MoldovaMDA0.8060.8130.7950.7600.7080.5700.8190.5770.6510.7020.6590.6710.7720.785
North MacedoniaMKD0.8641.0060.9810.8520.8870.8920.8620.8620.9070.9230.8750.8600.9090.901
MaltaMLT0.8080.8361.1090.8360.7500.8120.7750.7511.0690.5170.7370.7840.7740.937
MontenegroMNE1.0101.0091.0111.0101.0111.0091.0101.0111.0100.9960.9960.9960.9960.997
NetherlandsNLD0.9090.9360.9320.9410.9280.9270.9300.9220.9250.9230.9200.9260.9210.935
NorwayNOR1.4721.5351.5091.5381.5191.5091.4741.4521.4381.4191.4031.4471.4171.400
PolandPOL0.7620.8140.8740.8820.8790.8770.8730.8860.8690.8610.8980.8970.8870.903
PortugalPRT1.2071.2431.2381.2551.2251.1931.1691.1391.1151.1091.0981.0971.1171.100
RomaniaROU0.8920.7710.7720.9780.9690.9810.8430.8460.9910.9780.9460.7950.8070.809
Russian FederationRUS0.7270.7660.7590.7470.7360.7980.7880.7530.7520.7330.7580.7610.7710.777
SerbiaSRB1.1211.0611.0331.0301.0700.9950.9000.9210.9110.8270.9140.9290.9660.898
Slovak RepublicSVK0.7650.7770.8530.8420.8440.8350.8080.7970.8080.8150.8760.8700.8250.812
SloveniaSVN1.0361.0141.0121.0390.9990.9650.9440.9500.8810.9250.9380.9450.9530.950
SwedenSWE1.3371.3861.3711.3491.3361.2981.3151.3031.3001.3341.3071.2781.2851.296
TurkeyTUR0.9790.9880.9770.9590.9650.9270.8990.9080.8850.8540.8640.8710.8630.863
UkraineUKR0.6800.6020.6250.6290.6090.5620.5710.5030.5010.4940.5190.5190.5250.530
Table A3. The energy security index calculated.
CountryCountry Code200520062007200820092010201120122013201420152016201720182019 *2020 *
AlbaniaALB1.1251.0861.0311.0841.0701.0901.0501.0511.0500.9341.2841.1280.6980.7841.0050.994
ArmeniaARM0.7070.7400.6340.5650.5570.6610.6420.6220.6100.6400.6470.4790.3980.1680.1840.184
AustriaAUT1.2021.2281.2101.1971.1861.1681.1651.1641.1431.1361.0780.8830.9170.9201.0651.055
AzerbaijanAZE0.8120.8170.9480.9390.7750.7720.9490.9340.8300.7980.7801.2611.1871.1541.0781.089
BelgiumBEL0.8410.8740.8910.9040.9150.9240.9520.9740.9710.9800.9540.8930.9470.9580.9510.952
BulgariaBGR0.7310.7700.7550.7770.7970.8370.8200.8630.8830.8560.8140.8160.8050.7970.8490.852
Bosnia and HerzegovinaBIH0.9480.9310.9130.9040.9200.9180.8850.8640.8851.0320.9150.8490.8520.8690.8510.839
BelarusBLR0.7520.7870.8350.8490.8520.8470.8570.8480.8320.8270.5600.8450.8430.8450.8150.811
SwitzerlandCHE1.0721.0701.0731.0531.0431.0451.0421.0360.9910.9980.9720.7580.7530.7780.9980.994
CyprusCYP0.4930.4910.4930.7840.8060.5720.6620.9120.5080.8920.8620.9491.0221.0590.9060.911
Czech RepublicCZE0.8200.8220.8280.8330.8530.8640.8900.8880.8780.8820.8540.7080.7130.7220.8190.813
GermanyDEU0.9440.9680.9910.9620.9650.9590.9790.9760.9600.9660.9230.7760.8060.8200.9390.937
DenmarkDNK1.2731.2471.2541.2261.2041.2061.2291.2391.2191.2201.2081.1021.1411.1481.2421.243
SpainESP0.9680.9830.9930.9971.0141.0201.0291.0191.0161.0110.9860.9140.9750.9900.9920.991
EstoniaEST1.0101.0301.0221.0261.1201.1341.1401.1431.0871.0951.1261.0241.0991.1211.1401.147
FinlandFIN1.2791.2661.2631.2631.2331.2261.2391.2581.2541.2451.1931.0561.1081.1041.1631.155
FranceFRA0.9530.9560.9690.9720.9590.9570.9550.9560.9510.9530.9420.7780.7850.7950.8670.858
United KingdomGBR0.8180.8290.8480.8780.8830.8860.9030.9050.9230.9500.9640.9310.9700.9860.9530.956
GeorgiaGEO1.0301.0241.0441.0291.0081.0020.9620.9300.9670.9681.0140.8480.8040.7110.9030.891
GreeceGRC0.9670.9920.9870.9871.0061.0061.0241.0641.0341.0211.0391.1331.1611.1621.0831.086
CroatiaHRV1.0001.0060.9930.9940.9911.0081.0041.0201.0341.0421.0931.0211.0221.0180.9990.996
HungaryHUN0.8280.8240.8380.8490.8650.8860.8910.8920.8900.8800.8670.7460.7620.7770.8530.852
IrelandIRL0.8830.8910.9000.8980.8970.8990.9250.9160.8950.9110.8770.7020.7610.7630.9160.917
IcelandISL1.4281.5011.5091.4711.4401.4071.4841.4751.1901.1711.1210.8300.8400.8891.2641.258
ItalyITA1.0101.0231.0391.0471.0381.0411.0281.0421.0411.0381.0300.9100.9250.9271.0141.013
KazakhstanKAZ0.7260.7500.7400.7450.7550.7360.7530.5990.5960.6110.5680.8810.8940.8760.7320.720
LithuaniaLTU0.8640.9120.9350.9500.9541.0671.0921.0891.1011.0971.1431.1031.0871.0881.1231.129
LuxembourgLUX0.8750.8940.9570.9360.9230.8960.8880.8900.9060.9250.8840.4460.4850.4930.8280.816
LatviaLVA1.1291.0971.0821.0531.0711.0381.0941.1251.1241.1491.1251.0160.9710.9641.0761.077
MoldovaMDA0.6980.7210.7100.7130.7150.7630.8210.7940.6570.6960.4660.4030.3760.3610.5410.483
North MacedoniaMKD0.9090.9170.8940.8980.8670.9120.7260.7350.7440.7910.7700.6440.6360.6430.7380.726
MaltaMLT0.9050.9090.9260.8850.8610.6110.7320.7690.7830.8610.9681.1081.1501.0990.9500.941
MontenegroMNE1.1041.0011.0361.0341.0741.0921.0731.0701.1111.0741.1741.2201.1161.2231.1521.157
NetherlandsNLD0.9660.9820.9870.9850.9780.9530.9770.9670.9600.9460.9030.9360.9860.9880.9600.959
NorwayNOR1.4141.3971.3971.3461.3201.3031.3391.3241.2901.2791.2801.5101.5771.5481.3851.380
PolandPOL0.8990.9060.9090.9230.9240.9340.9520.9540.9390.9370.9190.8270.8220.8150.9180.915
PortugalPRT1.1041.1471.1561.1411.1461.1551.1481.1171.1231.1101.1031.0511.0631.0481.0651.060
RomaniaROU0.8350.8080.8620.8490.8210.9020.9190.9230.9520.9771.0280.8670.8360.8390.8940.889
Russian FederationRUS0.7770.7840.7900.7610.7510.7430.7390.7360.7330.7200.6481.0091.0141.0060.8500.850
SerbiaSRB0.9050.8770.8690.9290.9480.9350.9320.7500.7730.7860.6610.8740.8540.8450.7840.771
Slovak republicSVK0.8010.8730.9020.8900.9170.9140.9490.9060.9170.9370.8840.7610.7820.7680.9020.903
SloveniaSVN0.9300.9370.9200.9460.9560.9540.9680.9720.9820.9840.9470.8560.8710.8760.9050.900
SwedenSWE1.3091.3261.3341.3161.3221.2921.2881.3091.2901.2981.2981.1141.1571.1651.2341.229
TurkeyTUR0.8520.8560.8640.8770.8600.8720.8670.8590.8540.8310.8580.7080.6890.6530.7480.734
UkraineUKR0.5330.5550.6150.6220.5960.5940.5970.6000.6210.6100.4320.4350.4460.4480.5210.516
* Calculated by forecast data.

References

  1. Maroušek, J. Study on agriculture decision-makers behaviour on sustainable energy utilization. J. Agric. Environ. Ethics 2013, 26, 679–689. [Google Scholar] [CrossRef]
  2. Mardoyan, A.; Braun, P. Analysis of Czech subsidies for solid biofuels. Int. J. Green Energy 2015, 12, 405–408. [Google Scholar] [CrossRef]
  3. Jandačka, J.; Mičieta, J.; Holubčík, M.; Nosek, R. Experimental Determination of Bed Temperatures during Wood Pellet Combustion. Energy Fuels 2017, 31, 2919–2926. [Google Scholar] [CrossRef]
  4. Valaskova, K.; Throne, O.; Kral, P.; Michalkova, L. Deep learning-enabled smart process planning in cyber-physical system-based manufacturing. J. Self-Gov. Manag. Econ. 2020, 8, 121–127. [Google Scholar]
  5. Maroušek, J. Removal of hardly fermentable ballast from the maize silage to accelerate biogas production. Ind. Crop. Prod. 2013, 44, 253–257. [Google Scholar] [CrossRef]
  6. Peters, E.; Kliestik, T.; Musa, H.; Durana, P. Product decision-making information systems, real-time big data analytics, and deep learning-enabled smart process planning in sustainable industry 4.0. J. Self-Gov. Manag. Econ. 2020, 8, 16–22. [Google Scholar]
  7. Stavytskyy, A.; Kharlamova, G.; Giedraitis, V.; Šumskis, V. Estimating the interrelation between energy security and macroeconomic factors in European countries. J. Int. Stud. 2018, 11, 217–238. [Google Scholar] [CrossRef]
  8. Index of, U.S. Energy Security Risk. Available online: https://www.globalenergyinstitute.org/sites/default/files/2020-10/024036%20Global%20Energy%20Institute%20US%20Index_Web.pdf (accessed on 1 April 2021).
  9. World Energy Outlook 2020. Available online: https://www.iea.org/reports/world-energy-outlook-2020 (accessed on 1 April 2021).
  10. IEA. Available online: https://www.iea.org/topics/energy-security#our-work-on-energy-security (accessed on 1 April 2021).
  11. Kliestik, T.; Misankova, M.; Valaskova, K.; Svabova, L. Bankruptcy prevention: New effort to reflect on legal and social changes. Sci. Eng. Ethics 2018, 24, 791–803. [Google Scholar] [CrossRef]
  12. Lenhard, R.; Malcho, M.; Jandačka, J. Modelling of heat transfer in the evaporator and condenser of the working fluid in the heat pipe. Heat Transf. Eng. 2019, 40, 215–226. [Google Scholar] [CrossRef]
  13. Marousek, J.; Kawamitsu, Y.; Ueno, M.; Kondo, Y.; Kolar, L. Methods for improving methane yield from rye straw. Appl. Eng. Agric. 2012, 28, 747–755. [Google Scholar] [CrossRef]
  14. Hadzima, B.; Janeček, M.; Estrin, Y.; Kim, H.S. Microstructure and corrosion properties of ultrafine-grained interstitial free steel. Mater. Sci. Eng. A 2007, 462, 243–247. [Google Scholar] [CrossRef]
  15. Kovacova, M.; Kliestik, T.; Valaskova, K.; Durana, P.; Juhaszova, Z. Systematic review of variables applied in bankruptcy prediction models of Visegrad group countries. Oecon. Copernic. 2019, 10, 743–772. [Google Scholar] [CrossRef] [Green Version]
  16. Santos, T. Regional energy security goes South: Examining energy integration in South America. Energy Res. Soc. Sci. 2021, 76, 102050. [Google Scholar] [CrossRef]
  17. Axon, C.; Darton, R. Sustainability and risk–a review of energy security. Sustain. Prod. Consum. 2021, 27, 1195–1204. [Google Scholar] [CrossRef]
  18. Tongsopit, S.; Kittner, N.; Chang, Y.; Aksornkij, A.; Wangjiraniran, W. Energy security in ASEAN: A quantitative approach for sustainable energy policy. Energy Policy 2016, 90, 60–72. [Google Scholar] [CrossRef]
  19. Cherp, A.; Jewell, J. The concept of energy security: Beyond the four As. Energy Policy 2014, 75, 415–421. [Google Scholar] [CrossRef] [Green Version]
  20. Kliestik, T.; Valaskova, K.; Nica, E.; Kovacova, M.; Lazaroiu, G. Advanced methods of earnings management: Monotonic trends and change-points under spotlight in the Visegrad countries. Oecon. Copernic. 2020, 11, 371–400. [Google Scholar] [CrossRef]
  21. ESPAS. Welcome to 2030: Megatrends. Available online: https://ec.europa.eu/assets/epsc/pages/espas/chapter1.html (accessed on 3 June 2021).
  22. Kliestik, T.; Nica, E.; Musa, H.; Poliak, M.; Mihai, E.A. Networked, Smart, and Responsive Devices in Industry 4.0 Manufacturing Systems. Econ. Manag. Financ. Mark. 2020, 15, 23–29. [Google Scholar]
  23. Maroušek, J.; Bartoš, P.; Filip, M.; Kolář, L.; Konvalina, P.; Maroušková, A.; Zoubek, T. Advances in the agrochemical utilization of fermentation residues reduce the cost of purpose-grown phytomass for biogas production. Energy Sources Part A Recovery Util. Environ. Eff. 2020, 42, 1–11. [Google Scholar] [CrossRef]
  24. Vatankhah, S.; Zarra-Nezhad, M.; Amirnejad, G. An empirical assessment of willingness to accept “low-cost” air transport services: Evidence from the Middle East. J. Tour. Serv. 2019, 10, 79–103. [Google Scholar] [CrossRef]
  25. Vu, H.M.; Ngo, V.M. Strategy development from triangulated viewpoints for a fast growing destination toward sustainable tourism development–a case of Phu Quoc Islands in Vietnam. J. Tour. Serv. 2019, 10, 117–140. [Google Scholar] [CrossRef]
  26. Maroušek, J.; Myšková, K.; Žák, J. Managing environmental innovation: Case study on biorefinery concept. Rev. Téc. Fac. Ing. Univ. Zulia 2015, 38, 216–220. [Google Scholar]
  27. Biagi, G.; Bertaccini, B. Public Information and Perception of the Environmental Risk about the Works for the City High Speed Railroad Underpass in Florence, Italy. J. Tour. Serv. 2018, 9, 1–22. [Google Scholar] [CrossRef]
  28. Bencsik, A.; Tóbiás Kosár, S.; Machová, R. Corporate Culture in Service Companies that Support Knowledge Sharing. J. Tour. Serv. 2018, 9, 7–13. [Google Scholar] [CrossRef]
  29. Maroušek, J.; Rowland, Z.; Valášková, K.; Král, P. Techno-economic assessment of potato waste management in developing economies. Clean Technol. Environ. Policy 2020, 22, 937–944. [Google Scholar] [CrossRef]
  30. Muo, I.; Azeez, A. Green Entrepreneurship: Literature Review and Agenda for Future Research. Int. J. Entrep. Knowl. 2019, 7, 17–29. [Google Scholar] [CrossRef]
  31. Štreimikienė, D. Externalities of power generation in Visegrad countries and their integration through support of renewables. Econ. Sociol. 2021, 14, 89–102. [Google Scholar] [CrossRef]
  32. Kalinichenko, O.V.; Lesyuk, A.S. The energy security of Ukraine. Ekonomika 2013, 1, 3–6. Available online: http://dspace.pdaa.edu.ua:8080/bitstream/123456789/3135/1/%D0%95%D0%BD%D0%B5%D1%80%D0%B3%D0%B5%D1%82%D0%B8%D1%87%D0%BD%D0%B0%20%D0%B1%D0%B5%D0%B7%D0%BF%D0%B5%D0%BA%D0%B0.pdf (accessed on 1 April 2021).
  33. Vo, H.D. Sustainable agriculture & energy in the U.S.: A link between ethanol production and the acreage for corn. Econ. Sociol. 2020, 13, 259–268. [Google Scholar] [CrossRef]
  34. Tvaronavičienė, M.; Prakapienė, D.; Garškaitė-Milvydienė, K.; Prakapas, R.; Nawrot, Ł. EnergyEfficiency in the Long-Run in the Selected European Countries. Econ. Sociol. 2018, 11, 245–254. [Google Scholar] [CrossRef] [PubMed] [Green Version]
  35. Maroušek, J. Study on commercial scale steam explosion of winter Brassica napus straw. Int. J. Green Energy 2013, 10, 944–951. [Google Scholar] [CrossRef]
  36. Shindina, T.; Streimikis, J.; Sukhareva, Y.; Nawrot, Ł. Social and Economic Properties of the Energy Markets. Econ. Sociol. 2018, 11, 334–344. [Google Scholar] [CrossRef]
  37. Hnatyshyn, M. Decomposition analysis of the impact of economic growth on ammonia and nitrogen oxides emissions in the European Union. J. Int. Stud. 2018, 11, 201–209. [Google Scholar] [CrossRef] [PubMed] [Green Version]
  38. Streimikiene, D. Ranking of Baltic States on progress towards the main energy security goals of European energy union strategy. J. Int. Stud. 2020, 13, 24–37. [Google Scholar] [CrossRef] [PubMed]
  39. Stávková, J.; Maroušek, J. Novel sorbent shows promising financial results on P recovery from sludge water. Chemosphere 2021, 276, 130097. [Google Scholar] [CrossRef] [PubMed]
  40. Svazas, M.; Navickas, V.; Krajnakova, E.; Nakonieczny, J. Sustainable supply chain of the biomass clusteras a factor for preservation and enhancement of forests. J. Int. Stud. 2019, 12, 309–321. [Google Scholar] [CrossRef]
  41. Loiko, V.V. Energy Security in the Context of Economic Security. Available online: http://www.economy.nayka.com.ua/?op=1&z=2150 (accessed on 1 April 2021).
  42. Maroušek, J. Novel technique to enhance the disintegration effect of the pressure waves on oilseeds. Ind. Crop. Prod. 2014, 53, 1–5. [Google Scholar] [CrossRef]
  43. Sovacool, B.K. The methodological challenges of creating a comprehensive energy security index. Energy Policy 2012, 48, 835–840. [Google Scholar] [CrossRef]
  44. Narula, K.; Sudhakara, R.B. A SES (sustainable energy security) index for developing countries. Energy 2016, 94, 326–343. [Google Scholar] [CrossRef]
  45. Radovanović, M.; Filipović, S.; Pavlović, D. Energy security measurement—A sustainable approach. Renew. Sustain. Energy Rev. 2017, 68, 1020–1032. [Google Scholar] [CrossRef]
  46. Sovacool, B.K. An international assessment of energy security performance. Ecol. Econ. 2013, 88, 148–158. [Google Scholar] [CrossRef]
  47. Sovacool, B.K.; Mukherjee, I.; Drupady, I.M.; D’Agostino, A.L. Evaluating energy security performance from 1990 to 2010 foreigh teen countries. Energy 2011, 36, 5846–5853. [Google Scholar] [CrossRef]
  48. Franki, V.; Višković, A. Energy security, policy and technology in South East Europe: Presenting and applying an energy security index to Croatia. Energy 2015, 90, 494–507. [Google Scholar] [CrossRef]
  49. Kruyt, B.; van Vuuren, D.P.; de Vries, H.J.; Groenenberg, H. Indicators for energy security. Energy Policy 2009, 37, 2166–2181. [Google Scholar] [CrossRef]
  50. Ang, B.W.; Wei, L.C.; Tsan, S.N. Energy security: Definitions, dimensions and indexes. Renew. Sustain. Energy Rev. 2015, 42, 1077–1093. [Google Scholar] [CrossRef]
  51. Winzer, C. Conceptualizing energy security. Energy Policy 2012, 46, 36–48. [Google Scholar] [CrossRef] [Green Version]
  52. Maroušek, J.; Hašková, S.; Zeman, R.; Vaníčková, R. Managerial preferences in relation to financial indicators regarding the mitigation of global change. Sci. Eng. Ethics 2015, 21, 203–207. [Google Scholar] [CrossRef] [PubMed]
  53. Song, Y.; Ming, Z.; Ruifeng, S. Using a new aggregated indicator to evaluate China’s energy security. Energy Policy 2019, 132, 167–174. [Google Scholar] [CrossRef]
  54. Lefèvre, N. Measuring the energy security implications of fossil fuel resource concentration. Energy Policy 2010, 38, 1635–1644. [Google Scholar] [CrossRef]
  55. Kharazishvili, Y.M. Sistemna Bezpeka Stalogoro Zvitku: Instrumentarij Ocinki Rezervi ta Strategichni Scenariy i Realizaciyi [System Security of Sustainable Development: Tools for Assessing Reserves and Strategic Implementation Scenarios]; National Academy of Sciences of Ukraine, Institute of Industrial Economics: Kyiv, Ukraine, 2019; p. 304. [Google Scholar]
  56. Georgios, L.; Kerstin, S.; Theofylaktos, A. Internet of Things in the Context of Industry 4.0: An Overview. Int. J. Entrep. Knowl. 2019, 7, 4–19. [Google Scholar]
  57. Chernyak, O.; Kharlamova, G.; Stavytskyy, A. Trends of international energy security risk index in European countries. Balt. J. Eur. Stud. 2018, 8, 5–32. [Google Scholar] [CrossRef] [Green Version]
  58. Khalatov, A.A.; Fialko, N.M.; Tymchenko, M.P. Energy security of Ukraine: Methodological bases of safety level assessment and comparative analysis of the current state. Thermophys. Therm. Power Eng. 2020, 42, 18–30. [Google Scholar] [CrossRef]
  59. Global Energy Institute. International Index of Energy Security Risk, Assessing Risk in a Global Energy Market, 2020 Edition; Global Energy Institute An affiliate of the U. S. Chamber of Commerce: Washington, DC, USA, 2020; p. 114. Available online: https://www.globalenergyinstitute.org/sites/default/files/IESRI-Report_2020_4_20_20.Pdf (accessed on 30 March 2021).
  60. Cepel, M. Social and cultural factors and their impact on the quality of business environment in the SME segment. Int. J. Entrep. Knowl. 2019, 7, 65–73. [Google Scholar] [CrossRef]
  61. Kaletnik, G.M.; Burennikova, N.V.; Potapova, N.A. Production and use of biofuels in Ukraine: Econometric approaches, modeling. Econ. Financ. Manag. Top. Issues Sci. Pract. Act. 2018, 9, 7–23. Available online: http://efm.vsau.org/ (accessed on 15 March 2021).
  62. Kapitula, S.V.; Mishchuk, E.V. Methodical Approaches to the Assessment of Energy Security as a Component of Economic Security of the National Economy of Ukraine In Modern Conditions of Transformation of the Economy. Prychornomorsky Econ. Stud. 2016, 7. Available online: http://bses.in.ua/journals/2016/7-2016/11.pdf (accessed on 15 March 2021).
  63. Stogniy, O.V.; Kaplin, M.I.; Bilan, T.R. An economic mathematical model for the import of coal to Ukraine. Probl. Gen. Energy 2012, 1, 29–34. Available online: http://www.irbis-nbuv.gov.ua/cgi-bin/irbis_nbuv/cgiirbis_64.exe?I21DBN=LINK&P21DBN=UJRN&Z21ID=&S21REF=10&S21CNR=20&S21STN=1&S21FMT=ASP_meta (accessed on 15 March 2021).
  64. Maroušek, J.; Kwan, J.T.H. Use of pressure manifestations following the water plasma expansion for phytomass disintegration. Water Sci. Technol. 2013, 67, 1695–1700. [Google Scholar] [CrossRef]
  65. Calvo, J. High-tech start-ups in Japan: Cogent Labs, AI-OCR Solutions for Automated Business Process Outsourcing. Int. J. Entrep. Knowl. 2018, 6, 12–31. [Google Scholar] [CrossRef]
  66. Foster, J. Energy, Knowledge and Economic Growth. In The Evolution of Economic and Innovation Systems; Springer: Cham, Switzerland, 2015; pp. 9–39. [Google Scholar]
  67. Bruns, S.B.; Gross, C. Can declining energy intensity mitigate climate change? Decomposition and meta-regression results. Papers Econ. Evol. 2012, 1211, 1–10. [Google Scholar]
  68. Sovacool, B.K.; Mukherjee, I. Conceptualizing and measuring energy security: A synthesized approach. Energy 2011, 36, 5343–5355. [Google Scholar] [CrossRef]
  69. Blazkova, I.; Dvoulety, O. Sectoral and firm-level determinants of profitability: A multilevel approach. Int. J. Entrep. Knowl. 2018, 6, 32–44. [Google Scholar] [CrossRef]
  70. Vasylieva, T.; Pavlyk, V.; Bilan, Y.; Mentel, G.; Rabe, M. Assessment of Energy Efficiency Gaps: The Case for Ukraine. Energies 2021, 14, 1323. [Google Scholar] [CrossRef]
  71. Kasperowicz, R.; Bilan, Y.; Štreimikienė, D. The renewable energy and economic growth nexus in European countries. Sustain. Dev. 2020, 28, 1086–1093. [Google Scholar] [CrossRef]
  72. Nefzi, N. Fear of failure and entrepreneurial risk perception. Int. J. Entrep. Knowl. 2018, 6, 45–58. [Google Scholar] [CrossRef]
  73. Jonek-Kowalska, I. Transformation of energy balances with dominant coal consumption in European economies and Turkey in the years 1990?2017. Oecon. Copernic. 2019, 10, 627–647. [Google Scholar] [CrossRef] [Green Version]
  74. Chovancová, J.; Tej, J. Decoupling economic growth from greenhouse gas emissions: The case of the energy sector in V4 countries. Equilib. Q. J. Econ. Econ. Policy 2020, 15, 235–251. [Google Scholar] [CrossRef]
  75. Mazur, I.M. Analysis of the Energy Safety for the National Economy: Theoretical and Applied Aspects. Available online: http://global-national.in.ua/archive/2-2014/51.pdf (accessed on 1 April 2021).
  76. Pardal, P.; Dias, R.; Šuleř, P.; Teixeira, N.; Krulický, T. Integration in Central European capital markets in the context of the global COVID-19 pandemic. Equilib. Q. J. Econ. Econ. Policy 2020, 15, 627–650. [Google Scholar] [CrossRef]
  77. Dias, R.; Teixeira, N.; Machova, V.; Pardal, P.; Horak, J.; Vochozka, M. Random walks and market efficiency tests: Evidence on US, Chinese and European capital markets within the context of the global Covid-19 pandemic. Oecon. Copernic. 2020, 11, 585–608. [Google Scholar] [CrossRef]
  78. Zinecker, M.; Doubravský, K.; Balcerzak, A.P.; Pietrzak, M.B.; Dohnal, M. The Covid-19 Disease and Policy Response to Mitigate the Economic Impact in the EU: An Exploratory Study Based on Qualitative Trend Analysis. Technol. Econ. Dev. Econ. 2021, 27, 742–762. [Google Scholar] [CrossRef]
  79. Kufel, T. ARIMA-based forecasting of the dynamics of confirmed Covid-19 cases for selected European countries. Equilib. Q. J. Econ. Econ. Policy 2020, 15, 181–204. [Google Scholar] [CrossRef]
  80. Korzeb, Z.; Niedziółka, P. Resistance of commercial banks to the crisis caused by the COVID-19 pandemic: The case of Poland. Equilib. Q. J. Econ. Econ. Policy 2020, 15, 205–234. [Google Scholar] [CrossRef]
Figure 1. Electricity consumption in different countries from 1990 to 2019, trillion kW (authors’ scheme based on World Bank data).
Energies 14 03621 g001
Figure 2. The scheme of authors’ stages for calculation of an ecological security index.
Energies 14 03621 g002
Table 1. Indicators for calculating energy security: resource consumption group.
Title of the Indicator in the World Bank DatabaseDescription of IndicatorsThe Role of the Indicator
Fossil fuel energy consumption (% of total)The role of fossil fuels in modern economies should decrease; the share of this indicator, which exceeds the world average, will be a disincentive for resource security.Destimulator
Renewable energy consumption (% of total final energy consumption)The role of energy from renewable sources is constantly growing. The more a country introduces new technologies, the less it depends on energy supplies; the resource security is increasing.Stimulator
Electric power consumption (kWh per capita)Electricity consumption has a dual role in the economy. On the one hand, the development of technology, new devices, are increasing the comfort of people, but it requires an increase in consumption. On the other hand, the latest technologies can reduce consumption through energy efficiency. In comparison with other countries, the advance of this indicator under equal conditions of efficiency will be a stimulator of resource security.Stimulator
Energy use (kg of oil equivalent per capita)This indicator is analogous to the previous one. In turn, it shows the efficiency of resource use compared to other countriesStimulator
Energy use (kg of oil equivalent) per $1000 GDP (constant 2011 PPP)This indicator determines the efficiency of resource use from a material point of view.Stimulator
Energy imports, net (% of energy use)The indicator shows the country’s dependence on imported resources.Destimulator
Fuel imports (% of merchandise imports)The indicator shows the country’s dependence on fuel imports.Destimulator
Table 2. Indicators for calculating resource security: resource depletion group.
Title of the Indicator in the World Bank DatabaseDescription of IndicatorsThe Role of the Indicator
Adjusted savings: energy depletion (% of GNI)Energy depletion is the ratio of the cost of energy reserves to its remaining service life. It covers coal, crude oil, and natural gas. Obviously, the higher this figure, the worse for resource security.Destimulator
Adjusted savings: mineral depletion (% of GNI)The same indicator but only applied to resources such as tin, gold, lead, zinc, iron, copper, nickel, silver, bauxite, and phosphate.Destimulator
Adjusted savings: natural resources depletion (% of GNI)Depletion of natural resources is the sum of net depletion of forests, depletion of energy and depletion of minerals.Destimulator
Adjusted savings: net forest depletion (% of GNI)Pure forest depletion shows how much deforestation exceeds natural growth. Apparently, it is a disincentive.Destimulator
Table 3. Indicators for calculating resource security: resource efficiency group.
Title of the Indicator in the World Bank DatabaseDescription of Indicators The Role of the Indicator
Energy intensity level of primary energy (MJ/$2011 PPP GDP)Energy intensity shows how much energy is used to produce one unit of economic output. The less energy is needed to produce, the more efficient a country is.Destimulator
GDP per unit of energy use (constant 2011 PPP $ per kg of oil equivalent)An indicator that demonstrates energy efficiency.Stimulator
Electric power transmission and distribution losses (% of output)The greater the losses are, the more technologically backward the country is.Destimulator
Fuel exports (% of merchandise exports)The more fuel a country can export, the less dependent it is on other countries.Stimulator
Table 4. Indicators for calculating resource security: group to attract new energy sources.
Title of the Indicator in the World Bank DatabaseDescription of Indicators The Role of the Indicator
Renewable energy consumption (% of total final energy consumption)The indicator indicates the technological development of the country is a stimulating parameter.Stimulator
Alternative and nuclear energy (% of total energy use)An indicator that shows how much the country uses nuclear energy. On the one hand, such energy is evidence of the technological capabilities of the state, on the other—it is a threat to the environment, which was evidenced by the Chernobyl and Fukushima accidents. Therefore, this parameter should be considered as a disincentive.Destimulator
Combustible renewables and waste (% of total energy)This indicator indicates the degree of waste recycling in the country. Obviously, the more fully the waste is recycled, the better for the environment and the people in the country, so it is a stimulating indicator.Stimulator
Electricity production from renewable sources, excluding hydroelectric (% of total)The more the country attracts renewables, the better for the human economy, so it is a stimulus.Stimulator
Renewable electricity output (% of total electricity output)Similar to the previous indicator, this indicator is a stimulus.Stimulator
Table 5. Indicators for calculating resource security: a group of pollution due to mining activities.
Title of the Indicator in the World Bank DatabaseDescription of IndicatorsThe Role of the Indicator
Adjusted savings: particulate emission damage (% of GNI)Perceptibly, any emissions reduce the safety of people, so this indicator should be considered a disincentive.Destimulator
CO2 emissions (kg per 2011 PPP $ of GDP)Similar to the previous indicator, emissions are a disincentive.Destimulator
CO2 emissions (metric tons per capita)The lower the emissions per capita, the more technological the production is. Thus, this indicator is a disincentive.Destimulator
Adjusted net savings, including particulate emission damage (% of GNI)Adjusted net savings are equal to net national savings plus education costs and minus energy depletion, mineral depletion, clean forest depletion and carbon damage, and greenhouse gas emissions.Stimulator
Adjusted savings: carbon dioxide damage (% of GNI)The lower the cost of carbon dioxide, the better for the country’s security.Destimulator
Table 6. Indicators for calculating resource security: resource access group.
Title of the Indicator in the World Bank DatabaseDescription of Indicators The Role of the Indicator
Access to electricity (% of the population)The more people have the opportunity to use energy, the more developed the country is.Stimulator
Access to electricity, rural (% of rural population)The indicator is similar to the previous one; it only determines how developed the countryside is in the country.Stimulator
Access to electricity, urban (% of urban population)This indicator defines how developed cities are in the country.Stimulator
Table 7. Clustering results in dynamics on the base of the energy security index.
Cluster | Year200020102020
Cluster 1Finland, Iceland, Norway, SwedenDenmark, Finland, Iceland, Norway, SwedenDenmark, Ireland, Norway, Sweden
Cluster 2Austria, Denmark, Georgia, PortugalAlbania, Austria, Switzerland, Estonia, Italy, Lithuania, Latvia, Montenegro, PortugalAzerbaijan, Estonia, Finland, Greece, Lithuania, Latvia, Montenegro
Cluster 3Albania, Bosnia and Herzegovina, Switzerland, Spain, Estonia, France, Greece, Italy, Lithuania, Latvia, Montenegro, RomaniaGermany, Spain, France, Georgia, Greece, Croatia, Netherlands, Poland, Serbia, SloveniaAlbania, Austria, Switzerland, Spain, Croatia, Italy, Portugal
Cluster 4Belarus, Cyprus, Germany, Croatia, Luxembourg, Nth. Macedonia, Netherlands, Poland, Slovenia, TurkeyBelgium, Bulgaria, Bosnia and Herzegovina, Belarus, Czech Rep., UK, Hungary, Ireland, Luxembourg, Nth. Macedonia, Romania, Slovakia, TurkeyBelgium, Cyprus, Germany, UK, Georgia, Ireland, Malta, Netherlands, Poland, Romania, Slovak Rep., Slovenia
Cluster 5Armenia, Azerbaijan, Belgium, Bulgaria, Czech Rep., UK, Hungary, Ireland, Kazakhstan, Moldova, RF, Serbia, Slovak Rep.Azerbaijan, Kazakhstan, Moldova, RFBulgaria, Bosnia and Herzegovina, Belarus, Czech Rep., France, Hungary, Kazakhstan, Luxembourg, Nth. Macedonia, RF, Serbia, Turkey
Cluster 6Malta, UkraineArmenia, Cyprus, Malta, UkraineArmenia, Moldova, Ukraine
Publisher’s Note: MDPI stays neutral with regard to jurisdictional claims in published maps and institutional affiliations.

