Abstract
Voltage source converters (VSCs) are self-commutated converters able to generate AC voltages with or without the support of an AC connecting grid. VSCs allow fast control of active and reactive powers in an independent way. VSCs also have black start capability. Their use in high-voltage direct current (HVDC) systems, comparative to the more mature current source converter (CSC)-based HVDC, offers faster active power flow control. In addition, VSCs provide flexible reactive power control, independent at each converter terminal. It is also useful when connecting DC sources to weak AC grids. Steady-state RMS analysis techniques are commonly used for early-stage analysis, for design purposes and for relaying. Sources interfaced through DC/AC or AC/DC/AC converters, opposite to conventional generators, are not well represented by electromotive forces (E) behind impedance models. A methodology to include voltage source converters (VSCs) in conventional RMS short-circuit analysis techniques is advanced in this work. It represents an iterative procedure inside general calculation techniques and can even be used by those with only basic power electronics knowledge. Results are compared to those of the commercial software package PSS®CAPE to demonstrate the validity of the proposed rmsVSC algorithm.
1. Introduction
Voltage source converters (VSCs) are used to connect high-voltage AC and DC systems. VSCs maintain DC voltage polarity for their building blocks (for the two-level or three-level converter), as well as for “modules” forming a Modular Multi-Level Converter (MMC). In VSCs, the direction of the DC current controls the direction of the active power flow (P). Compared to the more mature current source converters (CSC-HVDC), VSCs offer faster active power flow and independent reactive power controllability, allowing for easy integration in multi-terminal high-voltage DC systems (VSC-based HVDC).
VSCs have evolved from the basic two-level or three-level neutral point clamped (NPC) configurations. The three-level active NPC, two-level with optimum pulse width modulation (OPWM), cascaded two-level converter (CTL) and modular multi-level converter (MMC) have been discussed throughout recent years. MMC is the latest and most advanced technology used for HVDC transmission, and differentiates further into the so-called half bridge type and full bridge type MMC [1]. The MMC is becoming dominant in the AC/DC conversion for offshore HVDC grids. Its ability to reverse the power flow by DC current reversal instead of the DC voltages, its modularity and scalability, as well as its inherent capability of storing energy internally in the converter, make it advantageous compared to other VSC topologies [1].
Electrical power systems are usually dominated by large synchronous generators with large inertia, high current capacity and slow frequency/voltage regulators. Generators are usually represented by constant electromotive forces (E) behind convenient impedances, according to the relevant sub-transient, transient or permanent fault period. VSC-HVDC is being proposed to connect offshore large wind generation to onshore AC grids, either in a point-to-point or in a multiterminal configuration [2,3,4]. While for classic HVDC solutions it is considered that they do not contribute to short-circuit currents, due to the risks of commutation failure, and VSCs can remain connected. VSCs are able to operate even in very low voltage scenarios and can connect to weak or isolated grids [5]. Although they have limited overcurrent capacity, even for extremely low voltage scenarios, an effective contribution to steady state short-circuit currents is expected because of the large VSC-HVDC capacity.
Methodologies to include VSC interfaced sources into SC analysis have been investigated by different authors. Fischer and Mendonca [6] performed short-circuit analysis considering Thevenin’s equivalent. They assumed wind energy converters (WECs) with full AC/DC/AC VSCs were injecting purely inductive constant currents, and that all the network elements were purely reactive. Yan and Zhe [7] considered VSCs as constant current sources, in which the maximum current was 150% of its nominal current. The equivalent reactance was analytically calculated assuming all impedances as purely reactive. Goksu et al. [8] have considered an arbitrary reactive current injection, neglecting the VSC behavior. Gautam and Joseph [9] show an extension of classical fault analysis techniques to form “fault coefficients”, which are used along with the Newton–Raphson technique to find current contributions of voltage source converter (VSC)-based wind turbines. In this work, a methodology to include VSC in steady-state RMS short-circuit analysis is proposed, extending the classical (matrix-based) short-circuit calculation techniques to include a VSC generic model. Referred as rmsVSC, the technique can be easily included into short-circuit analysis, both for symmetrical and unsymmetrical short circuits.
After this introduction, this paper has four sections and a conclusion. Section 2 addresses the control and modelling of voltage source converters, and Section 3 recalls RMS-based short-circuit analysis techniques. Section 4 shows the proposed rmsVSC technique to include a VSC (and evaluates its impacts) in short-circuit currents and voltages evaluation. In Section 5, steady-state RMS short-circuit analysis application examples are shown, and results are compared to those obtained with PSS®CAPE, a commercial RMS-based software package used extensively in protection design and analysis.
2. Control and Modelling of Voltage Source Converters Connected to the Grid
Figure 1 shows a voltage source converter, including AC filtering and a step-up transformer. The current through the series R-L branch depends on the voltage difference between uv and the shunt filter voltage uf. The shunt filter current can be neglected for RMS-based analysis because it aims to eliminate high frequencies to get the desired sinusoidal current output. Thus, it can be assumed that the current from the converter and the current in the step-up transformer are the same. The current flowing into the AC network can be controlled by way of the voltage uv.
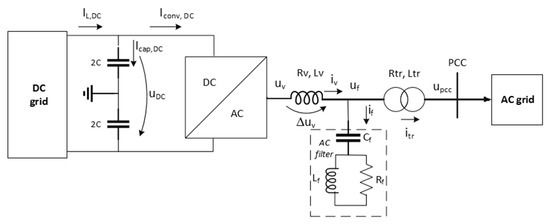
Figure 1.
Representation of a VSC (adapted from [5]).
2.1. General Control of a VSC
VSCs have 6 possible control modes: frequency, AC voltage, active power, reactive power, DC voltage and AC current control [10]. There is a natural connection between DC voltage control, active power control and frequency control, as well as between AC voltage control and reactive control [5]. The AC voltage control regulates the magnitude of the AC voltage by modifying the DC capacitor voltage (direct control) or the modulation index (vector control). The active power flow is controlled by regulating the phase angle of the converter-generated AC voltage. The capacitive/inductive reactive power is controlled by the AC voltage through the control of the modulation index. DC voltage is controlled through the active power balance, charging or discharging the DC capacitor. The AC current control is usually integrated as an intermediate step in the control of other parameters. The DC voltage controller regulates the active power flow. Reactive power is controlled by each converter in an independent way.
Usually, there are two levels of control. Outer controllers receive measured quantities (voltage/current, active/reactive power or DC voltage) and compare it to reference signals, producing output (error) signals which are passed to inner controllers to define the on-off state of individual switches. “Vector control”, “dual vector control” and “vector control with LCL filter” and other control strategies can be found [5]. Vector control is one of the most frequent options [9] and will be assumed.
A phase-locked loop (PLL) algorithm is used to get a reference frame for the AC quantities of the converter [11,12]. Voltage and currents are transformed from time domain quantities (sa-sb-sc) to a d-q-0 rotating reference frame, according to Equation (1) (Park transformation), where
is the angular position, in radians, of the dq0 rotating frame relative to the stationary frame [13].
Considering the dq0 rotating frame aligned with phase a axis at t = 0, then and Equation (1) transforms into Equation (2).
For per-unitization purposes, the voltage, current and power base quantities should be chosen according to [13], in order to have a correct correspondence between abc and dq0 reference frames.
2.2. Steady-State Power Flow Control
Assuming, as per usual, the per-unit system based calculation, then active and reactive powers injected by the VSC can be calculated using d- and q-current components, according to Equations (3) and (4), respectively.
In a normal operation, knowing the voltage at a given bus, active/reactive power set points lead to d-q current calculation through Equations (5) and (6), respectively.
All operation points should, at least, respect the maximum current defined for the converter [14].
Individual limits can be imposed to the active power from the AC to the DC sides of the converter, avoiding DC overvoltage, and to the reactive power in capacitive mode, particularly when grid voltages become high (low load scenarios, for example).
2.3. VSC Behavior under Low-Voltage Scenarios—rmsVSC Model
Assuming that VSC is operating with given active/reactive power setpoints ( and ), voltage variations lead to inverse current variations. Larger voltage reductions may result in current limitations and, consequently, in active/reactive power limitations. In addition, even if current limits are not reached, yet any other condition is met (voltage below/above a defined level, for example), currents may need to change. In the proposed rmsVSC model, and multiplying coefficients are defined to obtain, according to Equations (8) and (9), the effective active and reactive power setpoints ( and , respectively).
The
and
coefficients, which are equal 1 when current limits are not violated, will be modified according to the control strategies adopted. Three fundamental strategies will be discussed, but others can also be considered in the same way:
- –
- To maintain a fixed power angle, reducing both (active and reactive) power setpoints (mode PQ);
- –
- Prioritizing the active power injection, reducing the reactive component as necessary (mode P);
- –
- Prioritizing the reactive power injection, reducing the active power as necessary (mode Q).
2.3.1. Mode PQ—Constant Power Angle
The active and reactive power coefficients are equally reduced, if necessary, according to Equations (10) and (11).
2.3.2. Mode P—Priority to the Active Power Injection
Priority is given to the active current (power), reducing reactive power, if necessary. First, the active power reduction coefficient is determined, according to Equation (12).
If the active current is below the maximum allowed current, the remaining capacity is used to inject the reactive current. The available reactive current is given by Equation (13), and the effective multiplier is determined by Equation (14).
2.3.3. Mode Q—Priority to the Reactive Power Injection
Priority is given to the reactive power being delivered by the VSC. The reactive power delivered is maximized and the active component reduced, if necessary. The reactive current component coefficient is calculated by Equation (15).
The remaining current capacity, if any, is used to inject the active current, according to Equations (16) and (17).
2.4. VSC Modelling under Short-Circuit Condition: Main Assumptions
Although considering
and limited to the unity, in the identified modes of operation, it is also possible to implement particular “fault ride through” type algorithms, where could be higher than one to support network voltages. Nevertheless, once the maximum converter current is reached, the results are equal to those of mode Q.
Regarding the active power, limitations on the maximum active power being injected in the faulted network may lead to DC overvoltage. It was assumed that HVDC networks can fully control the DC voltage, even if no active power can be in the AC grid. Different strategies are described in the literature, depending on the DC network characteristics. Large DC choppers can be considered, for the HVDC networks, to protect converters from DC overvoltage. Other strategies can be adopted, such as those related to the active power generation reduction, by sending signals that lead to the active power reduction [15].
3. RMS-Based Short-Circuit Analysis
Symmetrical AC short-circuit currents can be computed from steady-state network models, combining phasor analysis and symmetric components, and an adequate per unit system when different voltage levels are present. This approach is also considered adequate in IEC 60909 standard [16].
For large networks, network information (source, lines and transformer impedances) is stored in the form of a representative matrix (ZBUS or YBUS, depending on the network elements chosen characteristic—impedance or admittance, respectively), allowing calculation of maximum/minimum short-circuit currents and voltages [17,18,19].
Main network busbars are used as electrical nodes where a short-circuit can be simulated using data from the corresponding row/columns of those matrices. Considering the voltage of the faulted bus, immediately before the fault, the Norton equivalent current injection is given by Equation (18).
To obtain the total short circuit current at bus k the last current is added to the current being injected at the same node immediately before the fault according to Equation (19).
If the prefault currents and voltages are unknown, then it is common to consider an unloaded network, where prefault voltages are all equal, in magnitude and phase. If unitary prefault voltages (1.0 p.u.) are considered, then the total current being injected into the network is given by Equation (20).
The previous methodology can be extended to any short-circuit and network configuration [20], both for symmetrical and asymmetrical faults. If a symmetrical three-phase fault is to be considered, a single-phase equivalent can be used. If unsymmetrical faults are to be studied, sequence components must be used [17,18,19].
Voltages at non-faulted buses, as well as fault currents flowing through transmission lines, can be calculated. Equation (21) is the equivalent form of Equation (19), where the injected current due to the fault is a vector where only the faulted bus position (fault bus) has a non-zero value, as in Equation (22).
Multiplying each element of (21) by the system’s
matrix, as in (23), we can identify pre-fault voltages and fault voltages
as well as bus voltages variation due to the fault current injection .
4. Using rmsVSC Model in the Evaluation of VSC Impacts in Short-Circuit Currents and Voltages
Adding or removing sources to/from a network impacts short-circuit levels. The highest impacts occur for a local fault, but some impacts can also be expected for neighboring network nodes (busbars).
4.1. Local Impacts Evaluation
The short-circuit current for the usual approach of an unloaded network is given by Equation (24), assuming only conventional sources. Under the usual assumption of a resistive nature for electrical arcs, it is necessary for the fault voltage phasor to have the same phase angle of the current.
The VSC current can be expressed in the d-q frame by Equation (25), where (lim) refers to the effective current components. Each current limit is set according to the pre-fault setpoints and to the control modes. The resulting current may (or not) be the maximum converter current.
Both current contributions must be added under a common reference to get the total fault current. The phase angle of the VSC contribution is adjusted according to the bus voltage phase (which corresponds to the new fault current phase angle). It is assumed that the VSC is always operating as a generator, imposing a positive d-current component. The short-circuit current shows magnitude, as well as phase variation, according to Equation (26).
Regarding the magnitude of the full short-circuit current, we can derive Equation (27).
Using the VSC active power as the reference for per-unitization, the short-circuit current before connecting the source equals the short-circuit ratio (SCR). Using Imax as the maximum source current, for the same reference, the short-circuit current variation, χ, is given by (28).
Considering the reactive part of the VSC current (q-current component), it is negative and is positive for the inductive case, while a capacitive current has a positive q-current component and a negative .
For both cases, the term (*) is always negative, and then the maximum possible current variation is given by Equation (29) relating to the case where the VSC current is fully active with null reactive component.
Replacing the reactive current component by zero in Equation (29) we obtain Equation (30), showing that cannot be different from zero. The maximum variation is given by Equation (31).
For a fully inductive/capacitive current , the short-circuit current variation is given by Equation (32) and can be negative (that is, χ < 1) if condition Equation (33) becomes true.
For a fully reactive current, depends on the maximum VSC current and on the SCR, according to Equation (34). After substitution, the current variation can be calculated directly from Equation (35).
It is clear from the last expression that a full reactive (inductive or capacitive) VSC current always represents a short-circuit current reduction.
4.2. Remote Impacts Evaluation
With all VSCs disconnected from the network, an initial injected currents vector is obtained. With the bus voltages information, the current being injected by each VSC is calculated, and the initial currents are updated according to Equation (36). Non-zero values in Equation (37) are VSC current injections (at bus m and at bus n).
VSC currents are calculated based on the last known values of the voltage at bus m, according to Equation (38).
Then, prefault voltages are updated according to Equation (39), resulting in the short-circuit current variation expressed by Equation (40).
The injected fault current variation originates bus voltages variations, according to Equation (41).
For each iteration, post-fault voltages considering all contributions, including the VSC influence, are calculated by Equation (42).
With the new voltage at VSC connection buses, a new iteration is run until the convergence condition is met. The convergence test can be performed by comparing, between successive iterations, the fault current variation due to the VSC, .
5. Steady-State RMS Short-Circuit Analysis
Figure 2 represents the EPRI 9-bus test system [21] modified to include a VSC-HVDC connection. A large synchronous generator was connected at bus 2. Remote generation (Rem G) was connected to the sending end converter (SEC), and the receiving end converter (REC) was connected to bus 8.
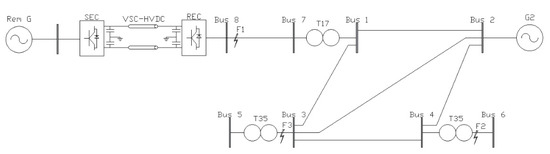
Figure 2.
EPRI 9-bus test case with a VSC-HVDC connection at bus 8.
For the VSC connected to bus 8 (REC), it was considered that current components (d, q) were both limited to 0.75 p.u. on the system’s MVA, while the total current was limited to 0.825 p.u. (10% over the VSC nominal current).
Three-phase short circuits were considered: F1, close to bus 8 (where the VSC is connected); F2 at bus 6 (considered, relative to the VSC, a remote fault); and F3, at bus 3, closer to the VSC than bus 6. The first case is discussed analytically, while for the other, the rmsVSC methodology is applied and results are compared to those of PSS®CAPE.
5.1. Three-Phase Short Circuit at Bus 8
As the voltage reduces to zero, for a solid fault (F1) close to the VSC, the reference angle for the VSC current definition becomes indetermined, leading to mathematical non-convergence problems. Therefore, this case was analytically discussed. Results are shown in Figure 3.
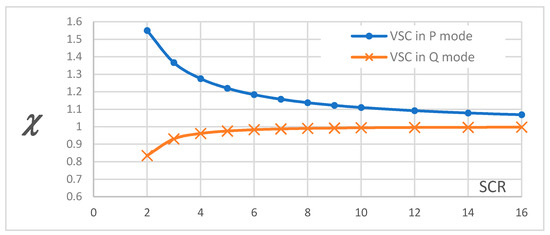
Figure 3.
Short-circuit current (relative to the non-VSC value) considering a VSC connected at the faulted bus, for different SCR values and for two different operating modes.
A VSC operating under P-mode represented large short-circuit current contributions for low SCR connections. For an SCR equal to 6, the short-circuit current increased 18%, and for SCR = 4, the variation was 27.5%. In reactive power mode, for low SCR, the short-circuit current reduction can be large, but for SCR equal to 8 or higher, it becomes almost zero. Any other operating condition for a given SCR will represent a current variation between the two limiting curves.
Although solid faults should be interpreted as null fault resistance, an extremely low resistance was applied in simulation. Therefore, the fault voltage phasor was aligned to the very inductive fault current. Under active power priority, the converter current aligned with the fault voltage phasor and, consequently, with the fault current, was fully added to it. For a fully inductive current, the VSC injection is 90 degrees lagging from fault voltage and, then, will also be in quadrature to the short-circuit current.
5.2. Three-Phase Short Circuit at Bus 6
For a three-phase fault at bus 6 (F2), two cases were defined regarding the VSC operating points: case 1 refers to 60MW/20MVAr setpoints, while case 2 considers a higher reactive power setpoint (40 MVAr). For both cases, the three VSC control strategies discussed before were considered.
Results are shown, respectively, in Table 1 and Table 2, and compared to those obtained by PSS®CAPE [22]. For reference, the SC and bus voltages before the VSC connection were 2.037 and 0.795 per unit, respectively.

Table 1.
Comparative results for case 1 (60 MW/20 MVAr).
Table 2.
Comparative results for case 2 (60 MW/40 MVAr).
The impact of VSC on the SC current was 1.43% for case 1 and 3.67% for case 2. Regarding VSC bus voltages, a 11.55% voltage drop was sensed in the first case, against only 4.17% for case 2, showing the voltage support of the reactive current injection.
5.3. Three-Phase Short Circuit at Bus 3
A three-phase fault at bus 3 (closer to the VSC connection bus), where the fault current without VSC is 5.642 p.u., was considered. The total short circuit current, the VSC current, as well as the VSC reference voltage and current components are shown in Table 3.
Table 3.
Results for case 2 (60 MW/40 MVAr), for a fault at bus 3, under active or reactive current priority.
Results from the rmsVSC-based methodology showed that the VSC reduced the SC current to 5.379 in P mode, while it increased to 6.223 in mode Q (increased by 10.3%). In the first case, the active current reached its maximum while in the reactive power mode, and the reactive current reached the maximum. At bus 8, the fault voltage increased from 0.2208 to 0.4346 under mode Q, showing the voltage support effects of the VSC.
Results from PSS®CAPE were different and showed a change of the operation mode, which had not yet been considered in the rmsVSC-based methodology. In the active current priority mode, the active current order was reduced to close to zero because a fault ride-through (FRT) option was activated using the full converter capacity to inject only reactive current, even under the active current priority strategy (**). Under reactive current priority, the maximum current (*) of the generator was not respected in PSS®CAPE, while the rmsVSC-based methodology reduced the active current component to respect the maximum current.
6. Final Remarks and Main Conclusions
In this work, a model and a methodology to include voltage source converters (VSCs) in conventional RMS short-circuit analysis have been presented and discussed. The methodology was applied to an example network and the results compared to those obtained from the commercial software package, PSS®CAPE. It was demonstrated that the proposed methodology (rmsVSC model) was suitable for evaluating the effective short-circuit current contribution of VSC, as well as for deriving other indirect information. It can also accommodate different control strategies regarding the active/reactive current components.
A short-circuit current, as well as bus voltages calculation, support the design, selection and parametrization of electrical equipment. The rmsVSC-based methodology can be used to introduce the new DC/AC interfaced sources in SC analysis related studies, even with only a basic background of power electronics subjects. With the rmsVSC-based methodology, contribution (and impacts) to short-circuit currents from VSC can be determined. In addition, based on the proposed methodology, protection coordination studies, overcurrent and distance relays parameterization can be performed.
Author Contributions
Both two authors have made great efforts and contributions to this article. All authors have read and agreed to the published version of the manuscript.
Funding
This research received no external funding.
Institutional Review Board Statement
Not applicable.
Informed Consent Statement
Not applicable.
Conflicts of Interest
The authors declare no conflict of interest.
References
- ENTSO-E. Voltage Source Converters (Vsc). Available online: https://www.entsoe.eu/Technopedia/techsheets/voltage-source-converters-vsc (accessed on 4 January 2021).
- Sandeberg, P.; Stendius, L. Large scale offshore wind power energy evacuation by hvdc light®. In Proceedings of the European Wind Energy Conference & Exhibition, Brussels, Belgium, 31 March–3 April 2008. [Google Scholar]
- Chaudhary, S.K.; Teodorescu, R.; Rodriguez, P. Wind farm grid integration using vsc based hvdc transmission—An overview. In Proceedings of the Energy 2030 Conference, ENERGY 2008, Atlanta, GA, USA, 17–18 November 2008; pp. 1–7. [Google Scholar]
- Bresesti, P.; Kling, W.L.; Hendriks, R.L.; Vailati, R. Hvdc connection of offshore wind farms to the transmission system. IEEE Trans. Energy Convers. 2007, 22, 37–43. [Google Scholar] [CrossRef]
- Du, C. Vsc-Hvdc for Industrial Power Systems; Chalmers University of Technology: Goteborg, Sweden, 2007. [Google Scholar]
- Fischer, M.; Mendonca, A. Representation of variable speed full conversion wind energy converters for steady state short-circuit calculations. In Proceedings of the IEEE Power and Energy Society General Meeting, Detroit, MI, USA, 24–29 July 2011; pp. 1–7. [Google Scholar]
- Yan, L.; Zhe, C. Short circuit ratio analysis of multi-infeed hvdc system with a vsc-hvdc link. In Proceedings of the IECON 2011—37th Annual Conference on IEEE Industrial Electronics Society, Melbourne, VIC, Australia, 7–10 November 2011; pp. 949–954. [Google Scholar]
- Goksu, O.; Teodorescu, R.; Bak-Jensen, B.; Iov, F.; Kjaer, P.C. An iterative approach for symmetrical and asymmetrical short-circuit calculations with converter-based connected renewable energy sources. Application to wind power. In Proceedings of the Power and Energy Society General Meeting, San Diego, CA, USA, 22–26 July 2012; pp. 1–8. [Google Scholar]
- Gautam, P.V.P.; Joseph, F.C. Evaluation of short circuit currents in networks with low voltage ride through (lvrt) enabled voltage source converters (vsc) based wind turbines. In Proceedings of the 2018 20th National Power Systems Conference (NPSC), Tiruchirappalli, India, 14–16 December 2018; pp. 1–6. [Google Scholar]
- Arrilaga, J.; Liu, Y.H.; Watson, N.R. Flexible Power Transmission—The Hvdc Options; John Wiley & Sons, Ltd.: Hoboken, NJ, USA, 2007. [Google Scholar]
- Indu Rani, B.; Aravind, C.K.; Saravana Ilango, G.; Nagamani, C. A three phase pll with a dynamic feed forward frequency estimator for synchronization of grid connected converters under wide frequency variations. Int. J. Electr. Power Energy Syst. 2012, 41, 63–70. [Google Scholar] [CrossRef]
- Freijedo, F.D.; Doval-Gandoy, J.; Lopez, O.; Acha, E. A generic open-loop algorithm for three-phase grid voltage/current synchronization with particular reference to phase, frequency, and amplitude estimation. IEEE Trans. Power Electron. 2009, 24, 94–107. [Google Scholar] [CrossRef]
- Kundur, P. Power System Stability AND Control; McGraw-Hill, Inc.: New York, NY, USA, 1994. [Google Scholar]
- Zhang, C.; Zeng, J.; Zhao, W.; Zhong, G.; Zhang, W.; Li, W.; Dai, M. Fault characteristics of full power inverted sources and its short-circuit current calculation model. J. Eng. 2017, 2017, 2471–2476. [Google Scholar] [CrossRef]
- Feltes, C.; Wrede, H.; Koch, F.W.; Erlich, I. Enhanced fault ride-through method for wind farms connected to the grid through vsc-based hvdc transmission. IEEE Trans. Power Syst. 2009, 24, 1537–1546. [Google Scholar] [CrossRef]
- IEC. IEC 60909-0—Short-Circuit Currents in Three-Phase A.C. Systems; IEC (International Electrotechnical Commission): London, UK, 2016; Volume 60909. [Google Scholar]
- Grainger, J.J.; Stevenson, W.D. Power Systems Analysis; McGraw-Hill: New York, NY, USA, 1994. [Google Scholar]
- Elgerd, O.I. Electric Energy Systems Theory; McGraw-Hill: New York, NY, USA, 1982. [Google Scholar]
- Brown, H.E. Solution of Large Networks by Matrix Methods; John Wiley & Sons, Inc.: New York, NY, USA, 1975. [Google Scholar]
- Reitan, D.K. A new method using the bus-impedance matrix model for short-circuit calculations. Proc. IEEE 1980, 68, 1027–1030. [Google Scholar] [CrossRef]
- Siemens. Inverter-based generator models with controlled power and current. In 2019 PSS®CAPE User Group Meeting; Siemens Industry, Inc.: Munich, Germany, 2019. [Google Scholar]
- Siemens. Pss®cape 14. Available online: https://new.siemens.com/global/en/products/energy/energy-automation-and-smart-grid/grid-resiliency-software/psscape.html (accessed on 20 March 2021).
Publisher’s Note: MDPI stays neutral with regard to jurisdictional claims in published maps and institutional affiliations. |
© 2021 by the authors. Licensee MDPI, Basel, Switzerland. This article is an open access article distributed under the terms and conditions of the Creative Commons Attribution (CC BY) license (https://creativecommons.org/licenses/by/4.0/).