Article

A Study on the Energy Reduction Measures of Data Centers through Chilled Water Temperature Control and Water-Side Economizer

1
Department of Architectural Engineering, Graduate School, Gyeongsang National University, Jinju 52828, Korea
2
Architectural Engineering Major, Division of Urban, Architecture and Civil Engineering, Dong-Eui University, Busan 47340, Korea
3
Department of Architectural Engineering, ERI, Gyeongsang National University, Jinju 52828, Korea
*
Author to whom correspondence should be addressed.
Energies 2021, 14(12), 3575; https://doi.org/10.3390/en14123575
Submission received: 1 May 2021 / Revised: 31 May 2021 / Accepted: 10 June 2021 / Published: 16 June 2021
(This article belongs to the Special Issue Advanced Control Strategies for Buildings and HVAC Systems)

Abstract

:
The degree of integration of IT devices and consumption of cooling energy are consistently increasing owing to developments in the data center industry. Hence, to ensure the smooth operation and fault prevention of IT devices, the energy consumption of cooling systems has increased, leading to active research on improvements in cooling system performance for reducing energy consumption. This study examines the reduction in cooling energy consumption using a simulation by applying chilled water control and a water-side economizer (WSE) system to enhance the cooling system efficiency. The simulation results showed that the energy consumption was reduced by 1.8% when the chilled water temperature was set to 11 °C in a conventional system and by up to 19.6% when WSE was also applied. Furthermore, when the changes in chilled water temperature were applied for efficient operation of WSE, the energy consumption was reduced by up to 30.1% compared to that in conventional energy systems.

1. Introduction

Data centers have been constructed to efficiently supply and process data, which are exponentially growing owing to the expansion of internet availability and advancements in the IT industry; thus, energy consumption is consistently growing with the rapid increase in the demand for such facilities. The energy consumption of data centers in the United States has increased by 4% annually from 2014 to 2020, where approximately 73 billion kWh of energy was consumed in 2020 [1]. Moreover, the size of data centers has grown at hyperscale in order to process the enormous amounts of data, and this growth is expected to further increase the energy consumption of these facilities.
Data centers generally refer to facilities in which ICT equipment such as servers and storage equipment are integrated and managed on a large scale, and internal loads are maintained at maximum levels all year round because the facilities are operated nonstop, 24 h a day, and for 365 d. Therefore, a cooling system uses around 40% of the total energy consumption of an entire facility, and reducing the cooling energy is therefore essential for reducing the overall energy consumption [2]. Because chillers account for 50% of the energy consumed by cooling systems [3], various studies have been conducted to reduce the energy of a chiller in heating, ventilation, and air conditioning (HVAC) systems.
Ha et al. (2020) analyzed the energy consumption according to temperature variation and chilled water outlet temperature of the main cooling period in order to increase the coefficient of performance (COP) of a chiller [4]. The results showed that energy savings of up to 12.4% were realized at a chiller water exit temperature of 7 °C and a temperature difference of 10 K. Thu et al. (2017) analyzed the changes in the chiller COP and cooling capacity according to the increase in the temperature of chilled water for mechanical vapor compression (MVC) chillers [5]. The study results showed that the COP and cooling capacity improved by 3.5% and 4%, respectively, as the temperature of chilled water increased by 1 °C.
Most data centers apply free cooling in order to reduce the energy consumption of chillers. This system does not use a chiller but uses cold outside air to cool down an indoor space and can be categorized as a water-side economizer (WSE) and air-side economizer (ASE).
Among the free cooling systems, WSE does not directly introduce outside air but rather produces chilled water using a cooling tower and heat exchanger. It is therefore often preferred because of the unlimited humidity conditions under which it can operate, or the inflow of contaminants from ambient environment, and for being more economical than ASE [6,7,8,9,10]. Accordingly, in recent years, there has been ongoing research in terms of applying WSE to data centers.
Wang et al. (2018) developed a Markov model and analyzed the reliability and availability of a hybrid WSE system combined with a lake water tank [11]. In addition, Deymi (2019) examined the effects of using ASE, WSE, and an air source heat pump (ASHP) simultaneously for a cooling system in which free cooling and a waste heat recovery system are combined [12]. The study results showed that the annual energy consumption and energy efficiency were reduced by 250 MWh and 16%, respectively.
In a study by Diaz (2020), the potential of WSE was investigated for different climatic conditions in Chile [7]. The Annual average COP was increased by 7.8–9.7 compared to normal operation in a cool summer Mediterranean climate, while the annual average COP was the lowest in the desert climate. Steven (2014) proposed that the period of using a chiller from the increased free cooling period should be reduced, while the performance of an economizer should be maximized by applying high-temperature chilled water to efficiently operate the WSE system [6].
Paul et al. (2018) investigated the energy reduction of a chiller in terms of the chilled water supply temperature and efficiency improvement of a chilled water system for a packaged air-cooled chiller system to which an economizer is applied for cooling of a data center [13]. The study results showed that the energy consumption was reduced by 39% at the supply chilled water temperature of 17 °C when compared to the reference temperature of 7 °C; the energy consumption was reduced by 50% at the supply chilled water temperature of 21 °C when the computer room air handler (CRAH) coil was optimized.
When the chilled water supply temperature of a chiller is increased, the cooling load of a chiller is reduced, thus reducing the energy consumption, which can be further reduced by applying a free cooling system. Furthermore, the efficiency can also be improved when the WSE system is operated at high returned chilled water temperature as the period of using an economizer is lengthened.
However, in the abovementioned studies, the efficiency improvement of a chiller considering the chilled water supply temperature was examined for general buildings; hence, it is difficult to analyze the same effect when applied to data centers, which maintain high load levels all year round. In the studies that examined data centers, the energy reduction efficiency was improved by integrating diverse systems, but the application is limited with respect to different climates. Only an air-cooled chiller was taken into consideration in a study that examined the supply chilled water temperature for the WSE system, in which the energy saving potential was greater when a water-cooled chiller was applied compared to an air-cooled chiller [14]; however, there is limited research analyzing the chilled water supply temperature of the WSE system.
Therefore, this study aims to seek an efficient WSE operation method by conducting a phased simulation for WSE applications and chilled water control in order to reduce the energy consumption of a cooling system in data centers.
The floor plan of the data center in the building subject to analysis was designed by introducing hyperscale conditions considering the IT loads, which are expected to grow with the advancements of the IT industry. A hyperscale data center is defined as “a data center having modular advanced infrastructures built on the ground surface of 400,000 ft2 or larger” by Lawrence Berkeley National Laboratory, which is the national research institute of the United States [11].
A central cooling system was analyzed for the HVAC system, and only WSE was considered for a free cooling system. The annual consumption of cooling energy was analyzed, and the methodology specified in ISO 15927-4: 2005 was used to analyze the data of 15 years (2003–2017) to apply the standardized data in the simulation. Design Builder v4.7, which is an EnergyPlus-based dynamic simulation program, was also used to model the building and HVAC system as well as to determine the energy consumption.
Figure 1 shows the overall organization and research method of this study. To determine the energy savings of the central cooling system due to the introduction of cooling energy reduction technology, (1) the central cooling system was modeled, and the cooling energy consumption was examined. (2) To examine the energy savings according to the changes in the chilled water temperature of the central cooling system, the cooling energy consumption was measured for every 1 °C with respect to the reference temperature of 7 °C. (3) The system was modeled and simulated to determine the usefulness of WSE, and the cooling energy consumption was reviewed according to the set temperature of chilled water. Finally, (4) for an efficient operation of WSE, the chilled water temperature difference (ΔT) was varied to analyze the energy savings with respect to an increase in the set temperature of chilled water and flow rate changes; finally, the energy reduction rate with respect to type 1 was determined.

2. Building Outline

Table 1 shows the details of the simulation target building. This building is a data center located in Seoul, South Korea, and the target area corresponds to the climate zone 4A of the ASHRAE 90.1 Guideline [15]. The building consists of nine floors, and the typical floor area is 41,845 m2. The building has 12 computer rooms with an area of 10,312 m2, and each room has 3396 racks. In this study, however, we targeted only one computer room for the precise implementation of the simulation. Due to the nature of the building, the data center is operated 24 h a day without interruption throughout the year, and the internal load is maintained at 2305 W per unit area throughout the year. Regarding the building envelope conditions, the thermal performances of the outer walls, roof, and door were set to 0.24, 0.15, and 1.90 W/m2·K according to the energy-saving design standards of South Korea [16].
Based on the American Society of Heating, Refrigerating, and Air-conditioning Engineers (ASHRAE) technical committee 9.9, indoor environments are recommended and allowable ranges are proposed for data communications device grades. Data centers are classified as large-scale facilities in which the enterprise server and storage are integrated, and they thus need to comply with the strictest indoor environmental conditions [15]. Figure 2 shows the indoor environmental conditions proposed by the ASHRAE. The indoor environmental conditions for data centers recommended by ASHRAE are a dry-bulb temperature of 18–27 °C and a relative humidity of 20–80%; thus, the indoor temperature of the computer rooms in this study was set to 26 °C.

3. Analysis of Cooling Energy Consumption of Central Cooling System (Type 1)

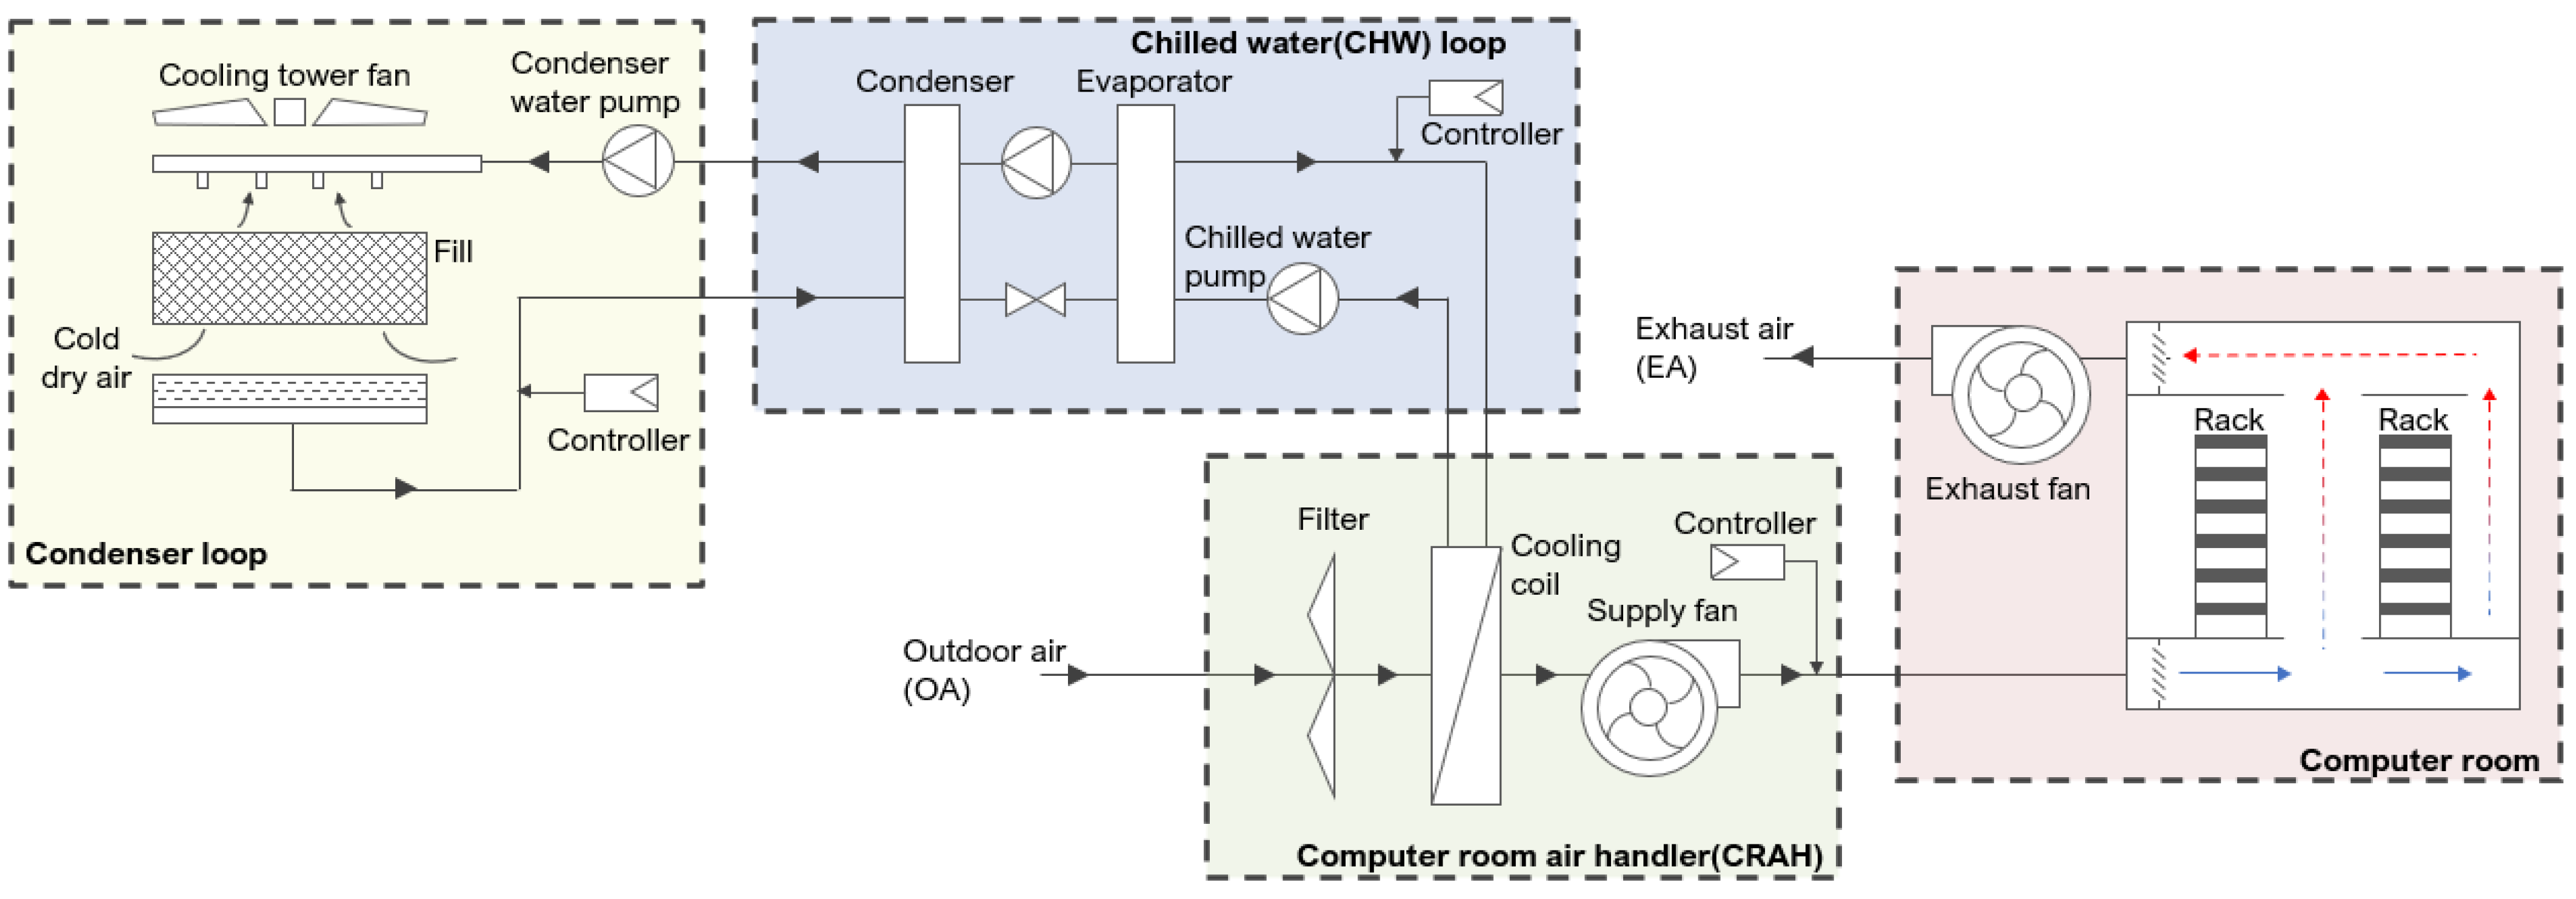
3.1. System Modeling

In this study, a central cooling system (type 1) was applied as the convention model; Figure 3 shows the schematic diagram of the proposed system. The system consists of an open-type cooling tower, a turbo chiller, and a CRAH, in which one variable-speed pump is connected to each of a condenser loop and a chilled water loop. The capacity of the cooling tower and chiller has a ratio of 1:1—the cooling tower capacity is 67,572 kW, while that of the chiller is 54,058 kW. The chilled water inlet and outlet temperatures of a chiller are 7 °C and 12 °C, respectively; while fixing the temperature difference (ΔT) of the chilled water inlet and outlet at 5 K, the condenser water inlet and outlet temperatures are set to 32 °C and 37 °C, respectively. The specifications of other equipment and cooling conditions are presented in Table 2.

3.2. Type 1 Model Simulation Result

By setting the reference chilled water temperature at 7 °C, simulations were conducted to determine the annual energy consumption of each piece of equipment of the central cooling system. The subject area was set to Seoul, and the calculation interval was 1 h.
The cooling load of the subject building ranges from 27,475–27,950 kW, where the changes in loads owing to outside air are negligible (Figure 4a). The annual energy consumptions of a chiller, CRAH fan, cooling tower, condenser water pump, and chilled water pump are 41,765 MWh, 42,762 MWh, 6193 MWh, 4491 MWh, and 2193 MWh, respectively; the total cooling energy consumption is 97,404 MWh. The greatest amount of energy was consumed in the CRAH fan because the thermal density of internal IT devices is highly distributed. Among the total energy consumption of the HVAC system, the CRAH fan accounts for approximately 43.9% of the consumption, following by the chiller, cooling tower, condenser water pump, and chilled water pump at 42.9%, 6.4%, 4.6%, and 2.3%, respectively (Figure 4b).

4. Supply Chilled Water Temperature Control (Type 2)

4.1. System Modeling

When the system is operated at a high chilled water supply temperature, the amount of cooling processed by a chiller is increased, while the energy consumed by the compressor is reduced. This leads to an increase in the COP of the chiller, which results in the chiller energy reduction (Figure 5). Therefore, simulations were conducted for type 2 by increasing the chilled water set temperature by 1 °C from 7 °C, which is the rated condition, to 17 °C, which is the condition required to maintain the CRAH supply air temperature and indoor set temperature. The temperature difference between the chilled water inlet and the outlet of a chiller was fixed at 5 K, while the capacity of each equipment remains the same for 7 °C conditions in type 1.
C h i l l e r C a p F T e m p = a + b ( T c w , l s ) + c ( T c w , l s ) 2 + d ( T c o n d , e ) + e ( T c o n d , e ) 2 + f ( T c w , l s ) ( T c o n d , e )
C h i l l e r E I R F T e m p = a + b ( T c w , l ) + c ( T c w , l ) 2 + d ( T c o n d , e ) + e ( T c o n d , e ) 2 + f ( T c w , l ) ( T c o n d , e )
C h i l l e r E I R F P L R = a + b ( P L R ) + c ( P L R ) 2
P r e f = Q r e f ˙ / C O P r e f
P c h i l l e r = ( Q ˙ a v a i l ) ( 1 C O P r e f ) ( C h i l l e r E I R F T e m p ) ( C h i l l e r E I R F P L R ) ( C h i l l e r C y c l i n g R a t i o )
The energy input ratio (EIR) model of EnergyPlus was used for the performance curve of the water-cooled chiller used in this study [17]. The chiller’s energy consumption P c h i l l e r is determined by three elements: C h i l l e r D a p F T e m p , C h i l l e r E I R F T e m p , and C h i l l e r E I R F P L R . Each element has a value of 1 in the rated condition. Equation (1) represents the cooling capacity change curve, Equation (2) expresses the energy consumption change curve, and Equation (3) describes the energy consumption change curve by the partial load.
T c w , l s is the leaving chilled water temperature of the chiller, and T c o n d , e denotes the temperature of the condenser water entering the condenser of the chiller. In Equation (3), P L R represents the chiller energy consumption at a specific partial load ratio (PLR). Q r e f and C O P r e f are the chiller capacity and the coefficient of performance (COP) under the rated condition, respectively.

4.2. Simulation Result

The results in Table 3 show the variation in the calculation model with changes in the chilled water set temperature. Energy savings of type 2 were the highest at a chilled water temperature of 11 °C. The energy reduction rate of a chiller at 11 °C is 4%, which is similar to the results obtained when the chilled water set temperature is 9–15 °C; however, the energy consumption of a chilled water pump is reduced by 2.3%, which is higher than other temperature ranges, thus resulting in a total energy consumption reduction of 1775 MWh/year. In contrast, the consumption of the CRAH fan at the chilled water set temperature ranging from 15–17 °C is increased, resulting in an increased total annual energy consumption.

5. Water-Side Economizer Applied Model (Type 3)

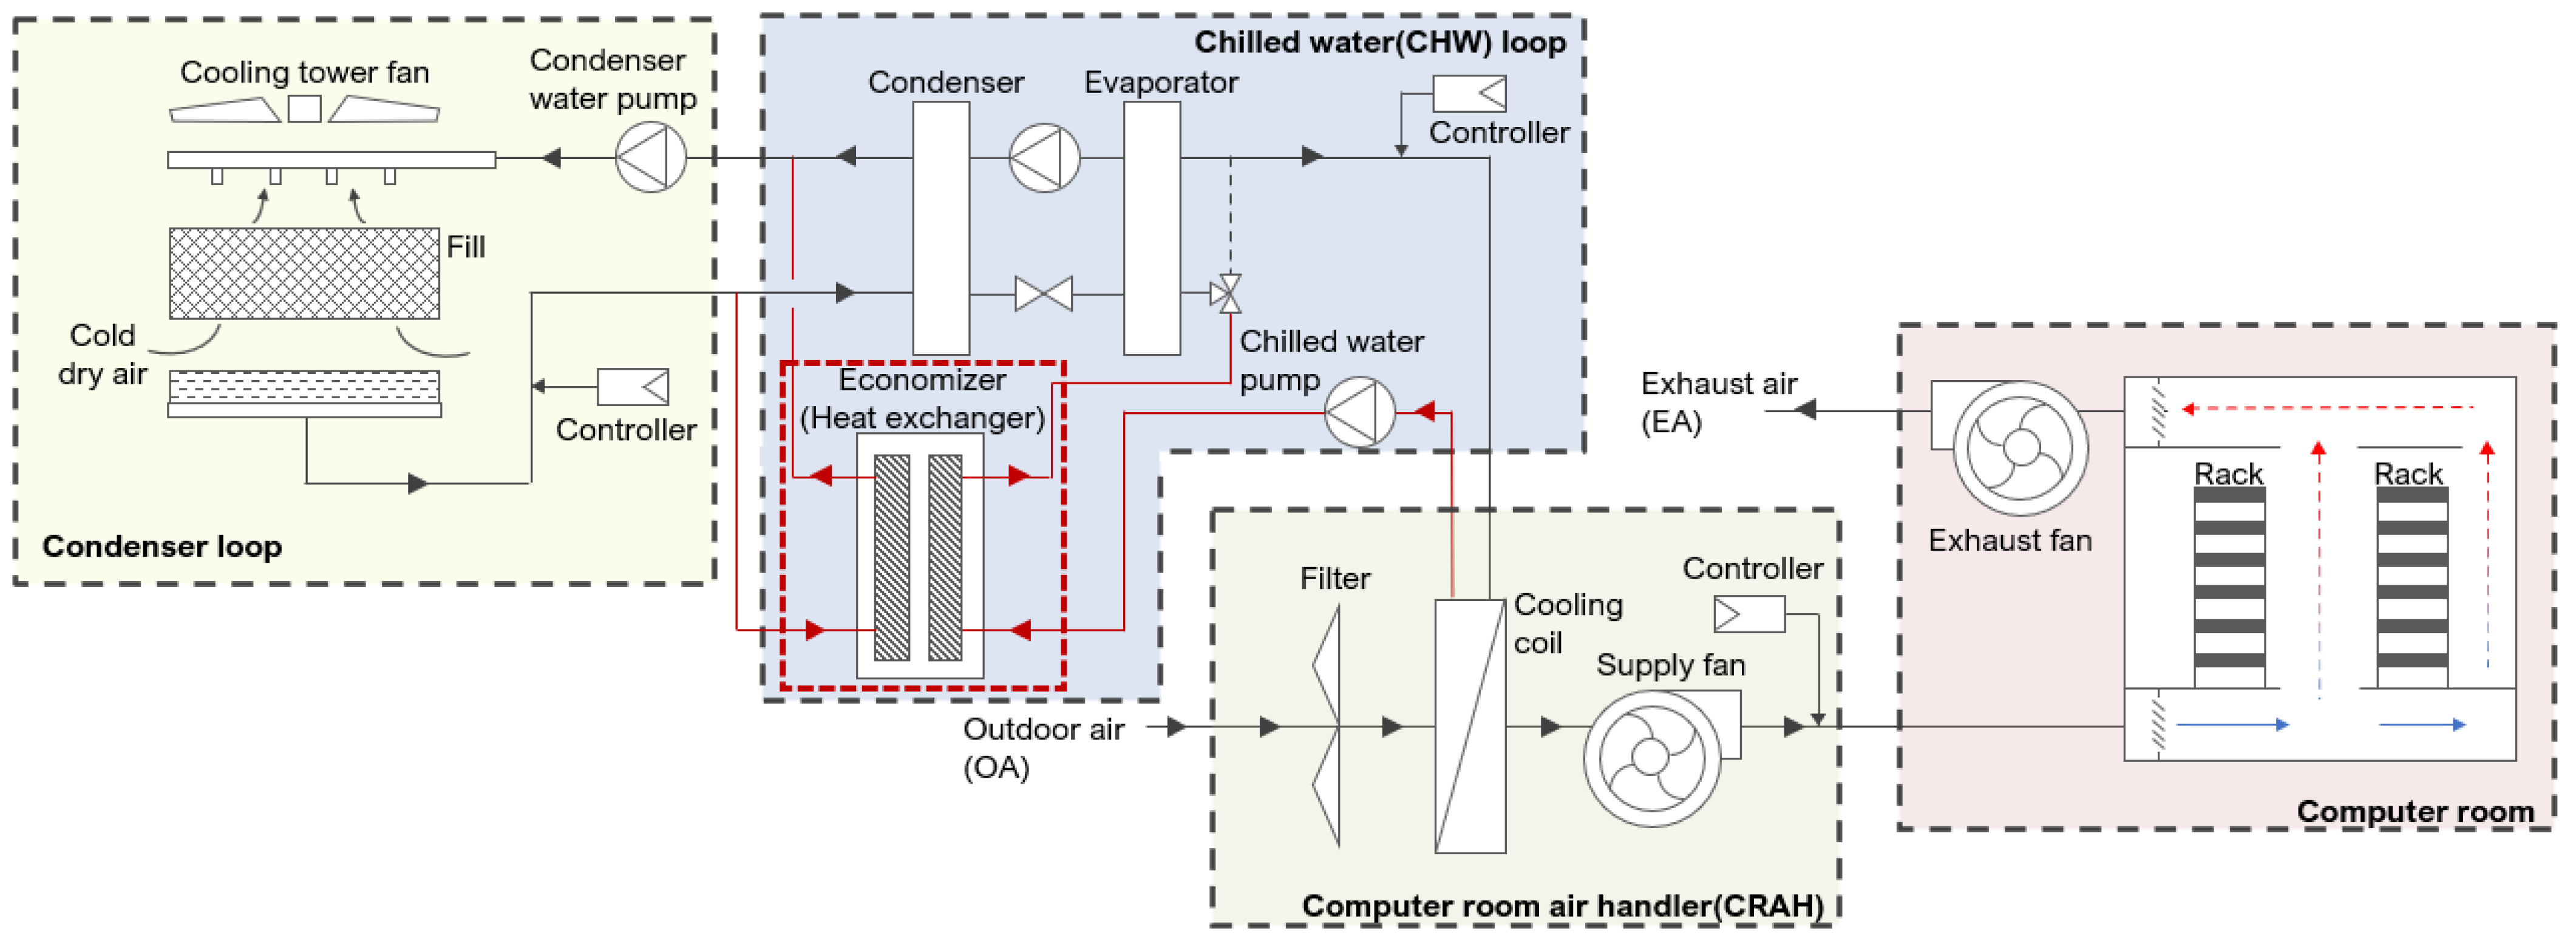
5.1. System Modeling

This section discusses the application of the WSE system as a measure for reducing the cooling energy. Figure 6 shows the schematic diagram of the WSE system in which heat exchangers are connected to the condenser loop of the central cooling system and the chilled water loop. The heat exchanger at the chilled water loop receives the returned chilled water from the CRAH cooling coil and exchanges heat with the condenser water. Then, it supplies the returned chilled water that has been heat-exchanged as an evaporator of a chiller, or it bypasses to deliver the chilled water back to CRAH cooling coil. The heat exchanger at the condenser loop receives the condenser water produced in the cooling tower to cool the returned chilled water, and then delivers the returned chilled water to the cooling tower.
WSE is operated using three methods, including full-free cooling, partial free cooling, and chiller cooling. The full-free cooling mode is operated in winter and cold outdoor air conditions of the intermediate period; the chiller stops operating, while the chilled water produced in the cooling tower and the secondary returned chilled water exchange heat to produce supply chilled water at the set temperature. Partial free cooling is operated in the outdoor air condition where the chilled water cannot produce supply-chilled water at the set temperature because it exchanged heat with the returned chilled water. The mode involves cooling the returned chilled water first and then supplying the secondarily heat-exchanged chilled water to the chiller in order to produce supply-chilled water at the set temperature. The chiller cooling mode is operated in the same manner as the conventional system.

5.2. Simulation Result

Table 4 shows the energy consumption of each equipment of the WSE system with respect to the changes in the chilled water set temperature. The calculation results show that the optimal chilled water set temperature for type 3 is 17 °C. The energy consumption of the chiller and chilled water decreases as the chilled water set temperature increases; the cooling tower and condenser water pump show a similar overall energy consumption, but the energy consumption increases from 15 °C.
The annual total energy consumption at the chilled water set temperature of 17 °C is 78,343 MWh, which is around 14.8% less than that of 7 °C; the greatest energy reduction was exhibited in the chiller (59.6%) and chilled water pump (40.1%). It can be inferred that the temperature of the chilled water supply and returned water increased, thus expanding the range of the chilled water supply temperature that can be produced through the free cooling operation. However, the energy consumption of the CRAH fan increased in order to process the secondary load as the chilled water set temperature increased from 13 °C. The energy consumption of the cooling tower and condenser water pump increased because the flow supplied to both the chiller and heat exchanger is increased by securing partial and full free cooling time.
Figure 7a shows the annual free cooling time within the range of the chilled water set temperature. The overall free cooling time increased as the chilled water temperature increased; the full free cooling time also increased as the chilled water set temperature increased, thus shortening the chiller cooling time. However, full free cooling was not operated at temperatures between 7–8 °C because the system is operated at a low temperature for the supply and returned chilled water to use outside air.
Figure 7b shows the energy reduction rate for type 3 with respect to that for type 2. For type 3, the cooling tower capacity and the condenser water flow rate were designed to be 200% in order to operate partial free cooling by applying the WSE system [18], and therefore, the energy consumption in the CRAH fan, cooling tower, and condenser water pump all increased compared to type 2. However, from free cooling operation, the energy consumption of the entire chilled water set temperature range was reduced by 5–23% as the energy consumption of the chiller and chilled water pump decreased.

6. WSE Application and ΔT Variation Model (Type 4)

6.1. System Modeling

To maximize the efficiency of WSE, the temperature of the supply and returned chilled water should be increased in order to secure the maximum free cooling time [14]. When the chilled water set temperature is increased, based on the simulation type 3 in Section 5, the energy consumption was reduced as the system is operated at a high returned chilled water temperature, and the free cooling time is expanded. Therefore, in this section, an additional energy consumption reduction was pursued by guaranteeing a higher returned chilled water temperature; this was achieved by increasing ΔT.

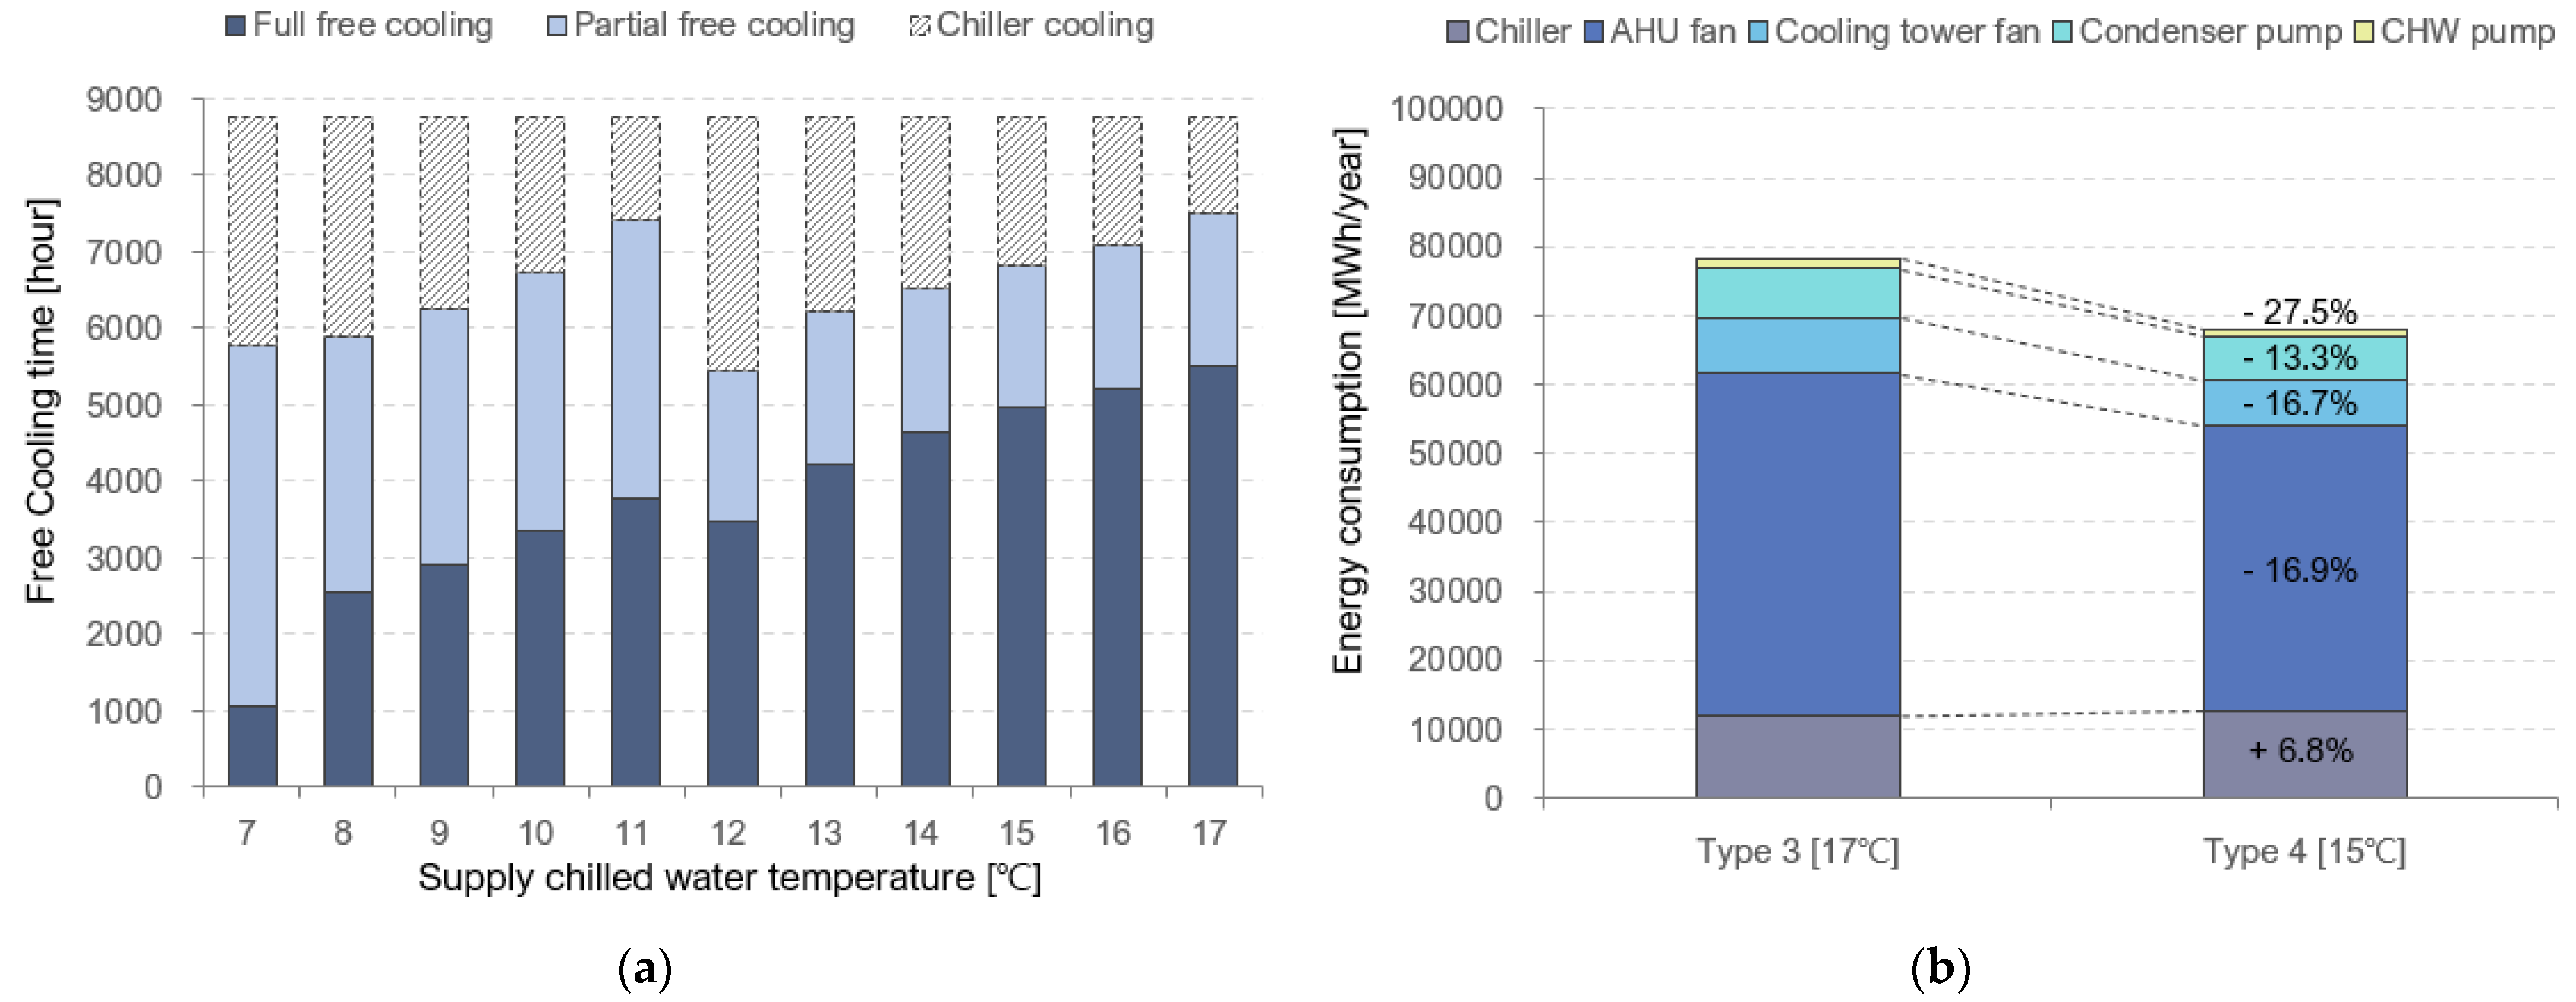
6.2. Simulation Result

6.2.1. Return Chilled Water Temperature and ΔT

In this section, the energy reduction rate of the optimal chilled water set temperature of type 4 is examined with respect to type 1 in order to determine the effectiveness of type 4. To improve the efficiency of the WSE system, the energy consumption was analyzed according to the high chilled water temperature difference (ΔT) and the reduction in the chilled water flow rate. Figure 8 shows the variations in the returned chilled water temperature and in ΔT according to the chilled water set temperature.
For a chilled water set temperature of 7 °C, the returned chilled water temperature and ΔT are 19 °C and 12 K, respectively, thus guaranteeing a higher returned chilled water temperature compared with type 3. Then, at the chilled water set temperature of 11 °C, the returned chilled water temperature and ΔT are 25 °C and 14 K, respectively, as the chilled water set temperature increased owing to the increased ΔT and decreased flow rate. However, at the chilled water set temperature of 12 °C, the returned chilled water temperature and ΔT briefly decreased to 6.3 K and 18.3 °C, respectively. Secondary load processing becomes impossible when the system is operated with a small flow rate at a high chilled water supply temperature, and the returned chilled water exceeding the set indoor temperature cannot produce the set supply chilled water. For a chilled water set temperature greater than 12 °C, the system was operated under the same conditions as the temperature range of 7–11 °C, thus having the returned chilled water temperature and ΔT of 25 °C and 8 K, respectively, at the set temperature of 17 °C.

6.2.2. Energy Consumption and Free Cooling Time

Table 5 presents the energy consumption of the type 4 model with respect to the chilled water set temperature and the energy reduction rate compared to the set temperature of 7 °C. The energy consumption was reduced as the full free cooling time increased from the increased chilled water set temperature of the chiller and the chilled water pump, but the energy consumption was increased at 12 °C because the flow rate of the chilled water increased and the returned chilled water temperature decreased. The energy consumption of the cooling tower and condenser water pump increased according to the flow rate of the chilled water; similar to the type 3 model, the partial free cooling time was increased, which resulted in an increased flow rate of chilled water as well as an increased energy consumption of the chilled water pump. The energy consumption of the CRAH fan maintains a consistent level within the range of the chilled water set temperature; however, the CRAH capacity decreased at 12 °C and then increased again from 14 °C from the increased air flow for processing the load according to the chilled water set temperature, thus consuming the greatest amount of energy at 17 °C.
As the temperature increased, the total energy consumption decreased within the chilled water set temperature range of 7–11 °C, but the energy consumption increased at 12 °C from the operation of the chiller and chilled water pump, which are affected by the flow rate and ΔT. Subsequently, the energy consumption gradually decreased from 13 °C as ΔT is guaranteed, but it increased again from 16 °C, at which point the usage of the CRAH fan cannot be counterbalanced; thus, the optimal chilled water set temperature for type 4 was 15 °C.
Figure 9a shows the free cooling time for type 4. The full free cooling time for type 4 can be expanded as the chilled water set temperature increases. The full free cooling time decreased after 12 °C because the full free cooling operation range decreased owing to the lowered returned chilled water temperature. The chiller cooling time decreases as the chilled water set temperature increases, while the partial free cooling time remains constant at a certain level for the ranges of 7–11 °C and 12–17 °C.
Figure 9b shows the energy consumption for type 4 at 15 °C with respect to that of type 3 at 17 °C. The full free cooling time is reduced because the optimal chilled water set temperature of type 4 is lower than that of type 3, which caused the energy consumption of the chiller in type 4 to increase by 6.8%. However, because the flow rate of the chilled water decreased as the system is operated at a higher returned chilled water temperature compared with type 3 owing to the increased ΔT, the energy consumption of all equipment, excluding the chiller, was reduced by 13–27%, while the total energy consumption was reduced by 13.1%.

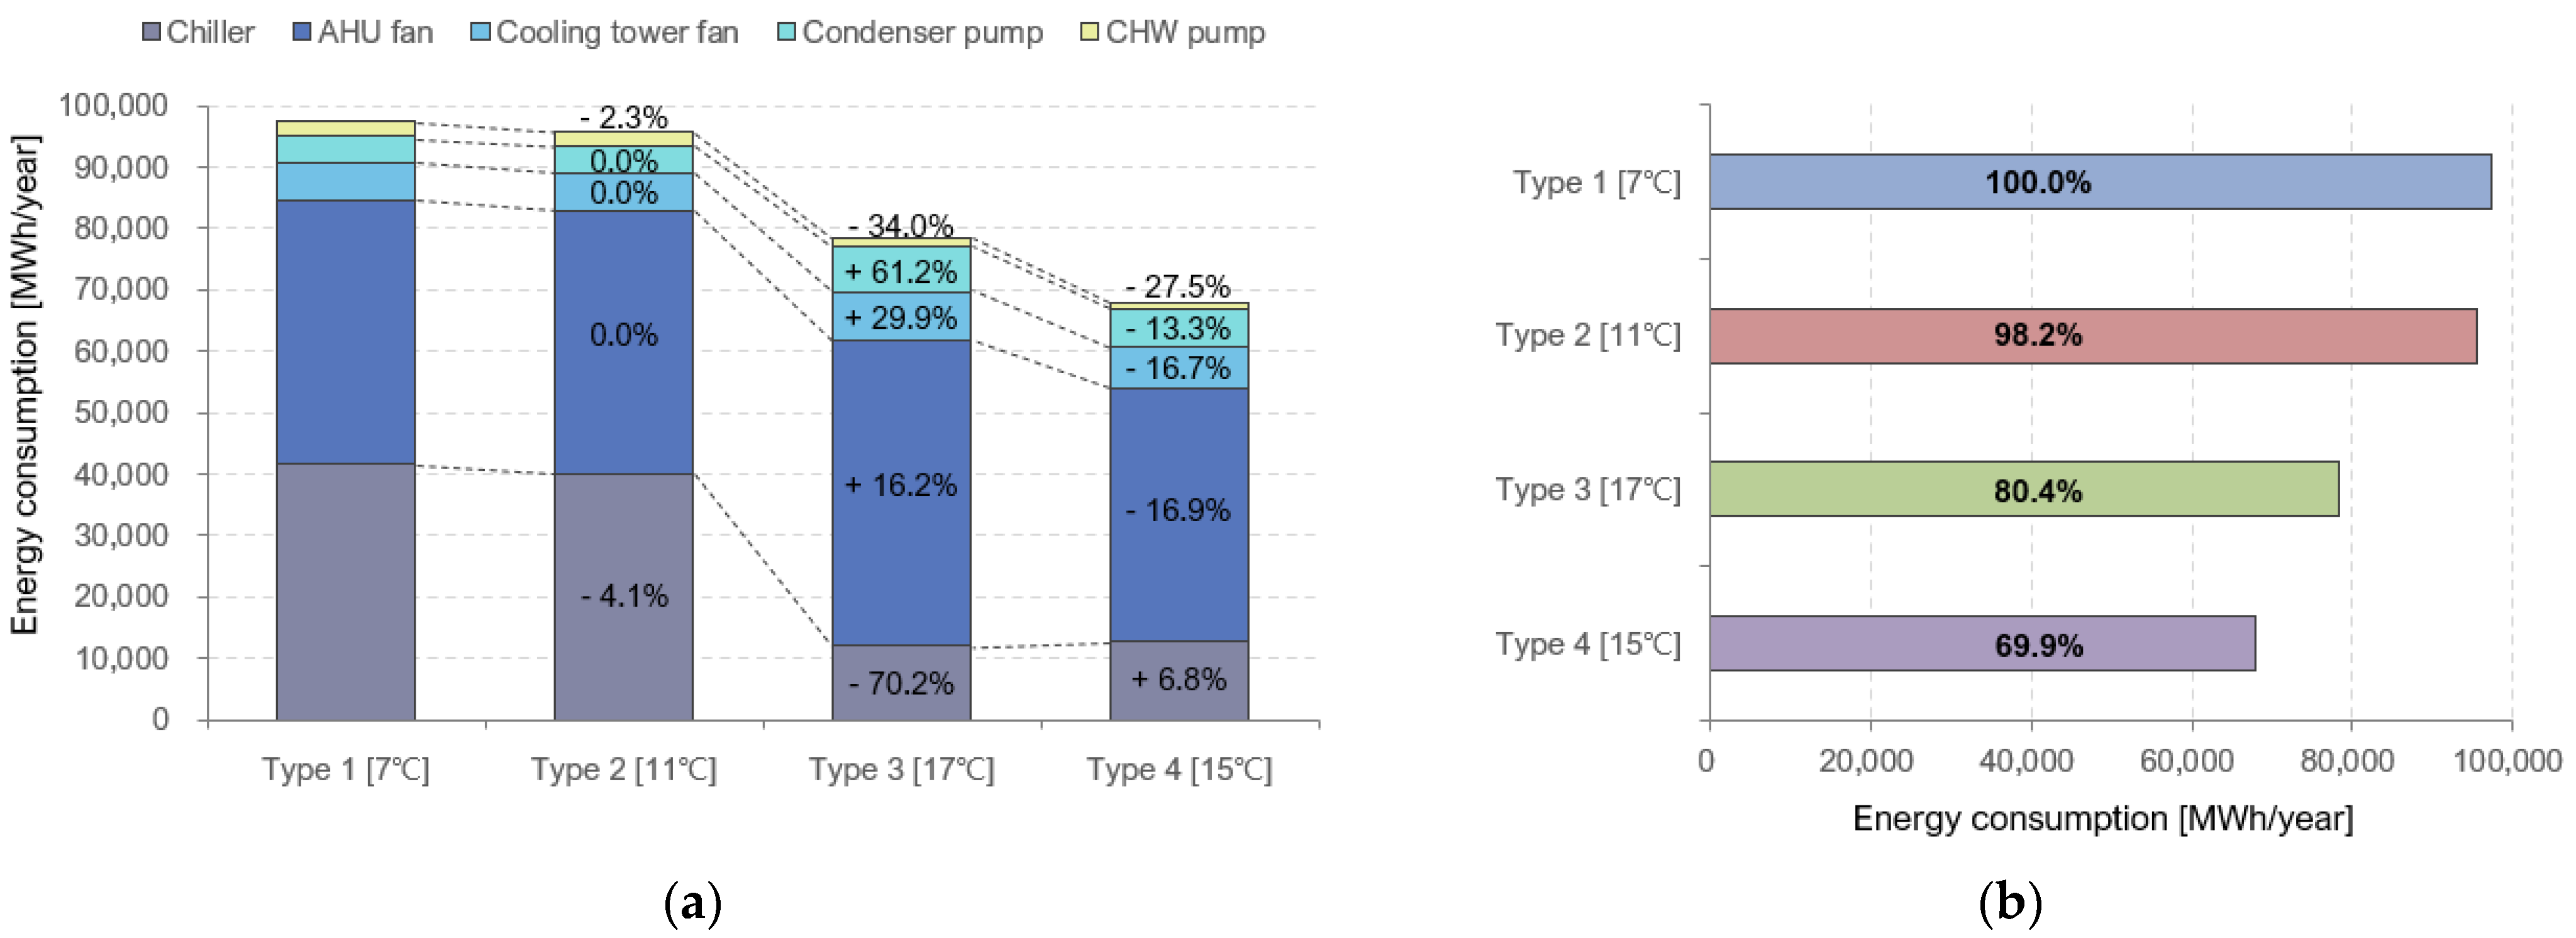
6.2.3. Comparison of Type 4 Energy Saving Rate

The cooling energy consumption of the type 4 model was reduced by 30.1% in total compared to the type 1 model in which the energy consumption of the chiller and chilled water pump was reduced by 69.5% and 53.2%, respectively; this was because the chiller was partially operated, or the operation was halted owing to the free cooling operation. In contrast, the energy consumption of the cooling tower and condenser water pump was increased by 8.3% and 39.8%, respectively, compared to type 1 owing to the application of WSE.
Compared to type 1, which is a conventional model, the energy reduction rate was a maximum of 1.8% when the chilled water set temperature was increased (type 2), and a maximum of 19.6% when the WSE was applied (type 3) while ΔT was fixed at 5 K. Furthermore, the energy reduction rate was a maximum of 30.1% in the WSE system (type 4), where ΔT was varied as in Section 6.2.1 (Figure 10b).

7. Conclusions

This study applied a chilled water set temperature control and WSE system to reduce the cooling energy of a data center in Seoul, Korea, and it quantitatively analyzed the reduced amount of energy consumption by adjusting the chilled water temperature difference for the efficient operation of WSE.
The simulation results showed that the energy consumption of a conventional model based on a central cooling system was 97,404 MWh, where the energy consumption was reduced by 1.8%, 19.6%, and 30.1% from the increased chilled water set temperature, application of WSE, and variation in ΔT, respectively.
Therefore, the general central cooling system can be efficiently operated when the supply chilled water temperature is set to 11 °C. A greater amount of energy can be saved as the chilled water set temperature is higher when WSE is applied, but the increased usage of the CRAH needs to be considered. A higher returned chilled water temperature should be used by securing ΔT in order to maximize the energy reduction from the application of WSE.
In future studies, ways of realizing the efficient design of the WSE system and the related effects of energy reduction will be examined based on the findings of this study in order to improve the efficiency of the WSE system.

Author Contributions

Y.-J.K. searched the literature, made simulation models, and wrote the paper; J.-W.H. and K.-S.P. examined calculated values and reviewed the draft phase; Y.-H.S. conceived and designed the methodology the paper. All authors have read and agreed to the published version of the manuscript.

Funding

This work was supported by the National Research Foundation of Korea (NRF) through a grant funded by the Korean government (MSIT) (No. 2017R1A2B2006424).

Conflicts of Interest

The authors declare no conflict of interest and the funders had no role in the design of the study; in the collection, analyses, or interpretation of data; in the writing of the manuscript, or in the decision to publish the results.

References

  1. Shehabi, A.; Smith, S.; Sartor, D.; Brown, R.; Herrlin, M.; Koomey, J.; Masanet, E.; Horner, N.; Azevedo, I.; Lintner, W.; et al. United States Data Center Energy Usage Report; Number LBNL-1005775; Lawrence Berkeley National Laboratory: Berkeley, CA, USA, 2016. [Google Scholar]
  2. Rong, H.; Zhang, H.; Xiao, S.; Li, C.; Hu, C. Optimizing energy consumption for data centers. Renew. Sustain. Energy Rev. 2016, 58, 674–691. [Google Scholar] [CrossRef]
  3. Dayarathna, M.; Wen, Y.; Fan, R. Data center energy consumption modeling: A survey. IEEE Commun. Surv. Tutor. 2016, 18, 732–794. [Google Scholar] [CrossRef]
  4. Ha, J.W.; Cho, S.; Kim, H.Y.; Song, Y.H. Annual energy consumption cut-off with cooling system design parameter changes in large office buildings. Energies 2020, 13, 2034. [Google Scholar] [CrossRef] [Green Version]
  5. Thu, K.; Saththasivam, J.; Saha, B.B.; Chua, K.J.; Srinivasa Murthy, S.; Ng, K.C. Experimental investigation of a mechanical vapour compression chiller at elevated chilled water temperatures. Appl. Therm. Eng. 2017, 123, 226–233. [Google Scholar] [CrossRef] [Green Version]
  6. Taylor, S.T. How to design & control waterside economizers. ASHRAE J. 2014, 56, 30–36. [Google Scholar]
  7. Díaz, A.J.; Cáceres, R.; Torres, R.; Cardemil, J.M.; Silva-Llanca, L. Effect of climate conditions on the thermodynamic performance of a data center cooling system under water-side economization. Energy Build. 2020, 208, 1–12. [Google Scholar] [CrossRef]
  8. Christy, S.D.; Abimannan, S. Energy efficient free cooling system for data centers. In Proceedings of the 2011 IEEE Third International Conference on Cloud Computing Technology and Science, Athens, Greece, 29 November–1 December 2011; pp. 646–651. [Google Scholar] [CrossRef]
  9. Cho, J.; Lim, T.; Kim, B.S. Viability of datacenter cooling systems for energy efficiency in temperate or subtropical regions: Case study. Energy Build. 2012, 55, 189–197. [Google Scholar] [CrossRef]
  10. Stein, J. Waterside economizing in data Centers: Design and control considerations. ASHRAE Trans. 2009, 115, 192–200. [Google Scholar]
  11. Wang, J.; Zhang, Q.; Yoon, S.; Yu, Y. Reliability and availability analysis of a hybrid cooling system with water-side economizer in data center. Build. Environ. 2019, 148, 405–416. [Google Scholar] [CrossRef]
  12. Deymi-Dashtebayaz, M.; Valipour Namanlo, S.; Arabkoohsar, A. Simultaneous use of air-side and water-side economizers with the air source heat pump in a data center for cooling and heating production. Appl. Therm. Eng. 2019, 161, 114133. [Google Scholar] [CrossRef]
  13. Lin, P.; Avelar, V.; Bean, J. How Higher Chilled Water Temperature Can Improve Data Center Cooling System Efficiency. Int. J. Sci. Innov. Technol. 2018, 1, 88–101. [Google Scholar]
  14. Agrawal, A.; Khichar, M.; Jain, S. Transient simulation of wet cooling strategies for a data center in worldwide climate zones. Energy Build. 2016, 127, 352–359. [Google Scholar] [CrossRef]
  15. American Society of Heating, Refrigerating and Air-conditioning Engineers (ASHRAE). ASHRAE Handbook Fundamentals; ASHRAE: Atlanta, GA, USA, 2019; ISBN 9781947192133. [Google Scholar]
  16. Ministry of Land, Infrastructure and Transport (MOLIT). Building Energy Saving Design Standards; MOLIT: Sejong, Korea, 2018. [Google Scholar]
  17. The U.S. Department of Energy. EnergyPlus Engineering Reference. Available online: https://energyplus.net/sites/all/modules/custom/nrel_custom/pdfs/pdfs_v9.5.0/EngineeringReference.pdf (accessed on 30 March 2021).
  18. Udagawa, Y.; Waragai, S.; Yanagi, M.; Fukumitsu, W. Study on free cooling systems for data centers in Japan. In Proceedings of the International Conference on Telecommunications Energy (INTELEC), Orlando, FL, USA, 6–10 June 2010; pp. 1–5. [Google Scholar] [CrossRef]
Figure 1. Flow chart of research.
Energies 14 03575 g001
Figure 2. Indoor environmental conditions of the data center. (a) Class A1: Typically, a datacom room with tightly controlled environmental parameters (dew point, temperature, relative humidity) and mission critical operations; types of products typically designed for this environment are enterprise servers and storage products. (b) Class A2/A3/A4: Typically, an information technology space with some control of environmental parameters (dew point, temperature, relative humidity); types of products typically designed for this environment are volume servers, storage products, personal computers, and workstations.
Energies 14 03575 g002
Figure 3. Schematic diagram of a central cooling system.
Energies 14 03575 g003
Figure 4. Annual internal load and type 1 energy consumption of the computer room. (a) Internal load of computer room, (b) type 1 energy consumption.
Energies 14 03575 g004
Figure 5. Mollier diagram with increasing chilled water supply temperature.
Energies 14 03575 g005
Figure 6. Schematic diagram of WSE.
Energies 14 03575 g006
Figure 7. Free cooling time for type 3 and energy reduction for type 3 with respect to the optimal chilled water temperature for type 2. (a) Type 3 free cooling time, (b) energy saving of type 3 (17 °C) compared to type 2 (11 °C).
Energies 14 03575 g007
Figure 8. Chilled water temperature difference, returned chilled water temperature difference, and flow rate changes of type 4 with respect to chilled water set temperature.
Energies 14 03575 g008
Figure 9. Free cooling time for type 3 and energy reduction for type 3 with respect to the optimal chilled water set temperature for type 2. (a) Type 4 free cooling time, (b) energy saving for type 4 (17 °C) compared to type 3 (11 °C).
Energies 14 03575 g009
Figure 10. Total energy reduction trend for each system type compared to a conventional model. (a) Energy reduction rate of cooling system equipment by type, (b) total energy consumption by type.
Energies 14 03575 g010
Table 1. Target building outlines.
Categories Detail
Building outlinesSite (Climate zone [15])Seoul, South Korea (4A)
UseData Center
Operation time24 h/7 days
Floors9F
Floor area (m2)41,845
Computer room area (m2)10,312
Thermal Performance (W/m2·K) [16]Outer wall/Roof/Door0.24/0.15/1.90
Internal room conditionsRack (EA/room)3396
Internal load (W/m2)2305
Table 2. HAVC system specifications.
ComponentDesign ParameterQuantity
Cooling systemCentral cooling system
RoomCooling set condition (°C)26
CRAHCRAH supply temp. (°C)20
Turbo chillerCapacity (kW)/COP54,058/6.34
Inlet/outlet temp. (°C)12/7
Water flow rate (m3/s)1.92
Cooling towerCapacity (kW)67,572
Inlet/outlet temp. (m3/s)37/32
Fan power (kW)710
Air flow rate (m3/s)2135
Condenser water pumpPower (kW)513
Chilled water pumpPower (kW)367
Table 3. Variation of energy consumption of equipment with changes in the chilled water set temperature of the central cooling system (type 2). Values marked in red indicate increased energy consumption compared to 7 °C. The value shown in blue indicates the optimum value among the set temperature of chilled water in the range of 7–17 °C.
CHW Set Temp. (°C)Energy Consumption (MWh)Energy Reduction Rate (%)
ChillerCRAH FanCooling Tower FanCondenser PumpCHW PumpSum
741,76542,76261934491219397,404 Energies 14 03575 i001
840,90442,76261944491217696,527
940,05942,76261954491219395,700
1040,06142,76261954491218995,697
1140,05842,76261954491214395,649
1240,07342,76261944491223795,758
1340,07542,76261944491223095,753
1440,07642,76261944491221195,734
1540,27244,13361944491218297,273
1641,07549,782617744912267103,792
1740,61846,35361784491218399,824
Table 4. Variation in energy consumption with changes in the chilled water set temperature of WSE (type 3). The value shown in blue indicates the optimum value among the set temperature of chilled water in the range of 7–17 °C.
CHW Set Temp. (°C)Energy Consumption (MWh)Energy Reduction Rate (%)
ChillerCRAH FanCooling Tower FanCondenser PumpCHW PumpSum
729,52146,14275156448236391,990 Energies 14 03575 i002
826,29846,14277466620234289,148
922,97546,14278405997232585,279
1021,39146,14275865664227483,058
1119,95946,14272136107221681,638
1218,57246,14272255410216679,515
1316,38048,77871865708191579,967
1415,17249,23776216372179080,192
1514,22550,17179967075166281,131
1613,19549,70281087254154079,799
1711,93549,70280507240141578,343
Table 5. Energy consumption for the application of WSE (type 4) with ΔT control with respect to changes in the chilled water set temperature. The value shown in blue indicates the optimum value among the set temperature of chilled water in the range of 7–17 °C.
CHW Set Temp. (°C)Energy Consumption (MWh)Energy Reduction Rate (%)
ChillerCRAH FanCooling Tower FanCondenser PumpCHW PumpSum
721,90940,6578236690596778,673 Energies 14 03575 i003
819,50042,7627848618393677,229
916,97542,7627797621186474,610
1014,98242,7627264625076372,023
1113,41542,7626707638869769,970
1218,21441,14672195741168074,000
1315,61540,87367335514115569,889
1414,11440,99766235474109368,301
1512,74941,28567046280102668,044
1611,39142,0126943675596268,064
1710,04342,7627293723490968,241
Publisher’s Note: MDPI stays neutral with regard to jurisdictional claims in published maps and institutional affiliations.

