Article

Numerical and Physical Modeling of a Tension-Leg Platform for Offshore Wind Turbines

1
Lehrstuhl für Windenergietechnik (LWET), Universität Rostock, Albert-Einstein-Str. 2, 18059 Rostock, Germany
2
GICON—Großmann Ingenieur Consult GmbH, Tiergartenstr. 48, 01219 Dresden, Germany
*
Author to whom correspondence should be addressed.
Energies 2021, 14(12), 3554; https://doi.org/10.3390/en14123554
Submission received: 9 April 2021 / Revised: 3 June 2021 / Accepted: 8 June 2021 / Published: 15 June 2021
(This article belongs to the Special Issue Floating Offshore Wind Turbines)

Abstract

:
In order to tap the world wide offshore wind resources above deep waters, cost efficient floating platforms are inevitable. Tension-Leg Platforms (TLPs) could enable that crucial cost reduction in floating wind due to their smaller size and lighter weight compared to spars and semi-submersibles. The continuous development of the GICON®-TLP is driven by computer-aided engineering. So-called aero-hydro-servo-elastic coupled simulations are state-of-the-art for predicting loads and simulating the global system behavior for floating offshore wind turbines. Considering the complexity of such simulations, it is good scientific praxis to validate these numerical calculations by use of scaled model testing. This paper addresses the setup of the scaled model testing as carried out at the offshore basin of the École Centrale de Nantes, as well as the numerical model for the GICON®-TLP. The results of dedicated decay tests of the scaled model are used to validate the computational model at the first stage and to determine the natural frequencies of the system. Besides different challenges to the scaled model during the survey, it was possible to take these difficulties into account when updating the numerical model. The results show good agreements for the tank tests and the numerical model.

1. Introduction

In 2015, 195 nations consented to limit global warming to well below 2 °C [1]. As a consequence, conventional fossil power plants will be dismantled on a global scale. Simultaneously, the demand for electric energy is ever increasing due to digitalization and sector coupling. For instance, in 2018 the world wide power consumption of data centers alone was estimated at about 200 terawatt hours [2]. The estimated growth rates of information and communication technologies (ICT) for this decade are huge. Different scenarios show that ICT could consume as much as 51% of global electricity in 2030. This would equal 23% of the globally released greenhouse gas emissions in 2030 [3]. The energy consumption of other branches, such as mobility and transportation, are growing rapidly. Green hydrogen is considered a promising energy carrier and raw material for different industries. The expected demand for green hydrogen will accelerate the need for an intensive expansion of wind and solar power generation together with the aforementioned branches.
On the other hand, the space available for the use of onshore wind is often limited due to geographic boundary conditions or conflicts of use [4]. Furthermore, opposition against onshore wind farms is rising in many countries. “Not in my backyard” disputes have slackened the expansion of wind energy in different countries such as Ireland or Germany [5,6]. Simultaneously, bottom fixed offshore wind is a great success in Europe, which has led to very competitive levelized costs of energy (LCOE). Yet, there are great wind resources around the globe, which cannot be tapped economically by conventional bottom fixed wind turbine substructures. More than 75% of global offshore wind potential is located in areas with water depths greater than 60 m [7]. In order to develop these resources, floating substructures such as semi-submersibles, spars and tension-leg platforms (TLP) are regarded as inevitable. Though, such wind turbines on floating substructures are not yet as economical as bottom-fixed offshore wind for shallow waters.

1.1. Problem Statement

The installation and preparation of spar-type floaters is regarded as complicated, as the mounting of the turbine on top of the deep-drafted spar requires deep waters of up to 100 m. Therefore, for mounting the wind turbine on top of a spar, heavy duty floating cranes are necessary [8]. TLPs are more shallow drafted than SPARs. Simultaneously, due to the system’s inherent stability when moored to the seabed, TLPs as a floating substructure can be smaller and therefore less material-intensive, especially in comparison with semi-submersibles. This is why they have the potential to offer a significantly higher efficiency compared to other floating substructures [9]. Different TLP designs have been suggested [10,11]. However, until now there is still no full scale wind turbine on a TLP in operation. Common TLPs are complicated when it comes to transport and installation (T&I). These TLPs are not stable until attached to the mooring cables, which keep the entire structure in place and prevent it from capsizing. Therefore, different concepts for special installation vessels have been proposed to enable the secure installation of TLPs [12]. These installation vessels are certainly regarded as further cost drivers.
These considerations have been taken into account when designing the GICON®-TLP. It has experienced various major design revisions during its development. An initial design proposed a three-legged latticed structure. A later revision introduced a four-legged latticed structure including dedicated buoyancy bodies. The latest major design revision consists of four buoyancy bodies, interconnected with a bracing [13]. One of the main characteristics of the final, simple four-column design is its self-stabilization during T&I, enabling a simple installation with the need for two to three tug-boats only [14]. Furthermore, this design enables the so called self-installation approach, which is currently under development. By this, the floating substructure including the wind turbine is transported on top of the lowerable gravity anchor. After arriving at the installation site, the ballastable gravity anchor is lowered to the seabed and the tendons are fastened.
A scaled representation of this design was tested at ECN in its installed state. The results of the tank tests have been used to verify the coupled simulations carried out by use of NRELs OpenFAST. This paper, for the first time, addresses the setup of the tank test model in detail as well as the numerical implementation of the GICON®-TLP supporting a 5–6 MW wind turbine in OpenFAST. Furthermore, the results for the free decay tests for the experiments, as well as for the numerical model, are presented and compared.

1.2. State-of-the-Art and Research Gaps

Similar tank tests for different floating offshore wind turbine systems and comparisons with numerical models have been performed by other researchers in the past. The first experimental investigations of TLPs carrying a wind turbine were conducted by Nihei and Fujioka [15,16,17]. They tested different TLP designs in 1:100 scale, both in waves and wind, with a focus on finding conditions and designs that do not show mooring slack events and resulting in the capsizing of the structure. They also showed that aerodynamic damping has a positive effect on the floaters pitch motion.
Further experiments, with the aim of improving the existing simulation tools for the coupled analysis of floating offshore wind turbines, were conducted by the DeepCWind consortium. In these 1:50 model tests three different floating platform, a TLP, a spar-buoy and a semi-submersible, are compared against each other and with the numerical simulation tool FAST [18]. The experimental results were used to calibrate numerical simulation models, which after the calibration are showing good agreement in the wave-excitation frequency range in the DOFs excited by wind and waves. Discrepancies, however, have been found in other areas and it is still not completely clear if these differences are coming from model calibration errors, sensor error or weaknesses of the simulations tools [19]. The investigators are emphasizing the importance of thoughtful calibration of the numerical models to get meaningful results from the simulation [20]. Free decay tests with steady wind further revealed a significant increase of pitch damping due to aerodynamic damping effects of the wind turbine [21,22]. Conclusions and recommendations drawn from these experiments are summarized by Robertson et al. [23]. They propose that, for future test campaigns, care has to be taken on the scaling approach, the instrumentation, the wind quality and the wind turbine testing. The authors also suggest further tests with focus on the water/structure interaction, on damping and in steady winds. Additionally, some limitations of FAST identified during the validation work based on the experiments were presented, whereas meanwhile most of these limitations have been eliminated by updates of FAST.
A 1:40 scale model of the IBERDROLA TLPWT has been tested under operational, survival, failure and transport conditions by Zamora-Rodriguez et al. [22]. The paper presents the experimental setup, decay test results, regular and irregular motion responses, as well as tendon loads and accelerations. For the decay tests, the paper focuses on the results for horizontal plane motions (surge, sway and yaw). Decay test in vertical plane (heave, roll and pitch) were found to be much harder to measure due to the high systems stiffness in vertical direction. The natural frequencies and damping values deduced from the decay tests coincided well with values reported in the literature.
Oguz et al. [24,25] compared experimental and numerical test results for a wind turbine on a TLP. A software-in-the-loop approach was used to account for the aerodynamic forces acting on the wind turbine. The numerical simulations were carried out by use of FAST. It was found that the system’s response due to aerodynamic forces is significantly higher than those due to hydrodynamic forces. Difficulties occurred while determining the systems natural frequencies for the scaled model. It was only possible to obtain reliable results for the free oscillation results for surge and pitch. The results showed an agreement of 9% for surge, while for pitch the variation was 1.5%. The natural frequency for surge was found to be 0.0417 Hz, while it is 0.24 Hz for pitch.
The WindStar TLP has been tested in wind, wave and current conditions as well as in combined load cases with a 1:50 scale model to investigate the motional behavior of the TLP by ZHAO Yong-Sheng et al. [26]. With these tests the authors have measured the natural periods, the damping and motion response operators (RAOs) of the TLP as well as tendons loads for a TLP in different environmental conditions. Among other things they found out that the upwind tendons were more critical than the downwind tendons under collinear wind and wave conditions. They also figured out that the surge and pitch motions of the TLP in head waves can be stabilized through adding wind and current loads because the pitch motion can be dampened by this extra loads.

1.3. Objectives

There is little literature available that elaborately compares numerical with experimental results for TLPs. Especially when it comes to the natural frequencies (NF) of the different systems, the literature shows that determining NF from experimental tests is challenging. For a dynamic system such as this floating substructure boundary conditions like the moorings have an influence on all of the DOFs and NFs. However, during model setup, it was clearly visible that the mooring stiffness has a significantly higher influence on heave, roll and pitch NF than on those for surge, sway and yaw. In fact, when altering the mooring stiffness, the change of the NF in heave (and so for roll and pitch) is in orders of magnitude higher than for sway or surge (or yaw). This behavior is completely different than for other floating substructures such as semi-subs or spars. Therefore, heave, roll and pitch could be classified as “mooring dominated DOFs”. For these mooring dominated DOFs deflections during a dedicated free decay test are much smaller than those for sway, surge and yaw and therefore are hard to track. Capturing these deflections to calculate the systems NF, however, is important. This is regarded as necessary to enable an adequate representation of the numerical model. Within the work presented here, a scaled (1:50) representation of the GICON®-TLP was built. Together with a dedicated mooring alignment and a scaled wind turbine, it was tested at ECN. Furthermore, the scope of this work comprises the preparation of the numerical model of the TLP in OpenFAST. Based on the findings and results from the tank tests, the numerical model was refined and adjusted and its performance was validated.

1.4. Paper Outline

To understand major challenges when experimentally and numerically modelling a TLP in general, the experimental setup, as well as the configuration of the numerical simulation, is introduced in detail in this paper. By understanding the difficulties and the approaches to overcoming them, it is possible to evaluate the results. The results that are considered as satisfactory, as well as the approach to processing them for the experimental as well as for the numerical model, are discussed. The paper is concluded with the major obstacles and findings in the work presented and their implications for future work on TLPs in general and the GICON®-TLP in particular.

2. Model and Test Setup

Tank tests have been carried out at the offshore basin of the Laboratoire de recherche en Hydrodynamique, Énergétique et Environnement Atmosphérique de École Centrale Nantes (ECN), in Nantes, France. The basin provides a water depth of 5 m, a total length of 46.4 m and a width of 29.7 m. On the short side, wave flaps are installed covering the entire front. On the opposing side, an artificial beach is able to reduce wave reflections by dissipating much of the waves’energy. Four wind generators are installed just behind the wave maker on solid ground. The air is led through four ducting systems to a large quadratic nozzle with a width of 2.8 m, which is equipped with different current grids in order to reduce the turbulence. The entire ducting systems as well as the nozzle are mounted below a rig. Thus, all equipment is hanging freely above the water surface, so there is no interference with the water and therefore experiment results are not affected. Two wave gauges are used to measure the wave height in line with the model, that is, on its Y-axis. Both are placed at 7 m which relates to 350 m for full scale, from the model one is on starboard, the other on the port side. This means both wave gauges are positioned 7.5 m or 375 m in full scale from the basin edge, which should be a sufficient distance to neglect influences from wall friction. Furthermore four optical motion tracking cameras are mounted on the rig above the tank. An illustration of the experimental setup is shown in Figure 1.
Froude scaling law was applied for the scaling of the substructure and all respective components as well as for upsacling the measurement results for comparison with simulations [27]. All values given in this section are for the scaled model except those mentioned.

2.1. RNA and Tower

The wind turbine mounted on the TLP for the tank tests is a scaled representation of the NREL 5-MW Reference Offshore Wind Turbine [28]. A 1:50 scaled version of the NREL 5-MW turbine has been designed and built together with a respective wind generation setup by Courbois and was available at ECN [29]. As the ducting system and the diffusors, etc. of the wind generation setup as illustrated in Figure 1 are not variable in height, the wind turbines hub must be placed exactly 1800 mm above still water level. Thus, the turbine tower provided by ECN is shorter than the tower defined by NREL. This arises from the fact that ECN’s turbine and tower were designed to fit on a floater which provides a higher tower interface, sometimes also called transition piece (TP). Therefore, contrary to the full scale GICON®-TLP, the TP for the scaled model was extended in order to bring the tower base to a higher position and to meet with the expected hub height, 1800 mm above still water level. Due to challenges regarding scaling, that is, especially for manufactural reasons, also the tower stiffness differs from the NREL 5-MW values. Difficulties in scaling also lead to further slight discrepancies between the turbine available at ECN and the ideally scaled 5-MW turbine, as shown in Table 1.

2.2. Tension-Leg Platform

As described before, the GICON®-TLP has undergone several major design revisions [13]. The latest design consists of four buoyancy bodies, that are arranged in a rectangle shape. The buoyancy bodies are connected by horizontal bracing tubes. Vertical and diagonal tubes above the buoyancy bodies are evenly distributing the payload, for example, from the wind turbine. The scaled platform is illustrated in Figure 2. The basic design which is examined in this paper is based on a non-optimized concrete hull. This means, that future design updates would include possible taper and other approaches for reducing the platform’s mass. It furthermore does not include secondary steel components or other equipment. Buoyancy bodies are set together by several concrete shell segments, known from tunnelling. Furthermore, the different tubes, interconnecting buoyancy bodies, and other components of the TLP are proposed to be made out of concrete [30]. For this study, a wall thickness of 30 cm was assumed for all components. This is quite conservative and leads to an also conservative weight of the substructure itself of 4712.5 t. This, once more, represents a non-optimized design. Detail engineering, implementing several approaches like tapering, and so forth, is expected to allow for significant weight reduction up to 30% or more. A heavier structure means a greater need for buoyancy to utilize the advantages of a TLP and to keep it stable. This by implication means a need for more water to be displaced which again would make a bigger structure necessary. On the other hand, for the GICON®-TLP ultra high performance concrete (UHPC) is considered. UHPC enables a very lightweight design but has a higher cost than conventional concrete [30]. For this type of structure a lighter design would cause a shift of the natural frequencies, especially for surge, sway and yaw. The NF for these DOFs would decline.
For carrying out the tank tests, an adequate 1:50 scale model of the GICON®-TLP has been designed and built by LWET staff members. Besides the geometrical scaling, accurately implementing the scaled mass distribution and therefore moments of inertia is important. The main components of the hull, especially the vertical, horizontal and diagonal tubes have been made from 60 × 3 mm aluminium tubes. The tubes have been connected with each other by the use of milled connecting elements, forming the transition piece (TP), the upper nodes (UN) and lower nodes (LN). These connectors have been machined from polyoxymethylene (POM). All tubes and connectors have been bolted together by use of 8 mm stainless steel threaded rods. The threaded rods are located in the geometrical center of the tubes. Additional ballasting has been installed to the threaded rods in order to meet with the desired weight of the different members such as buoyancy bodies (BB), or vertical tubes (VT). The wider BB have been build by use of polyurethane (PUR) rigid foam. This PUR foam provides an uniform density which allows for correct weight adjustments. PUR foam is well known from scaled modeling of ships for maneuvering tests and so forth. The foam itself has a negligible water absorbency. Furthermore, the foam was coated with an epoxy compound in order to smoothen the surface. Because of the materials negligible water absorbency itself and the additional coating, it is expected that there is no increase of weight due to water absorption by the foam. Finally, all components have been painted by use of a non-reflective, high visible color in order to ease visibility of the platform and simultaneously guarantee good tracking by the motion capturing system.
Unfortunately, after the test campaign was completed, it was observed that water entered certain sections of the model due to a leak. By its design, the model could only take up a limited amount of water. The buoyancy bodies, for instance, are of full material. The model has been weighted after it was removed from the basin and the amount of water leaked into the structure was furthermore estimated based on the mooring tensions measured. The model was already in the basin at least for 18 h before the free decay tests were started. All free decay tests, except those for yaw, were carried out on the same day within a time frame of 7 h. The yaw free decay tests were carried out on the following day in the morning. Due to the fact that the water poured out of the model within one to two hours after its removal from the basin, it is assumed that the water ingress happened similarly fast. Furthermore, the mooring pre-tension with the model in its neutral position was assessed for all free decay tests. As the pre-tension in the neutral position did not change between the different free decay tests, it is assumed that The water ingress happened quickly after the model was installed and did not change during the test period. By this approach the additional ballast was calculated and accounted for in the OpenFAST simulations. This is addressed in Section 3.2.

2.3. Moorings

The mooring tendons for the full scale floater have an extensional stiffness EA of 2146 MN each. The pretension is 20% of the breaking load of 25 MN. This corresponds to 17,168 N for the scaled tendon. 2 mm (7 × 7) stainless steel lines have been used for the tendons for the tank tests. The line stiffness for such a steel rope is usually not given by the manufacturer and is tricky to be determined without dedicated tensile tests. However, Young’s Modulus E of the steel rope was estimated to lie in the range of
130 × 10 3   N / m m 2 E 150 × 10 3   N / m m 2 ,
after consulting different manufacturers. With a line diameter of 2 mm the EA of the tendon would therefore be in the range of
408 , 400   N E A 471 , 239   N .
This shows that the steel rope offers a stiffness which is about 24 times higher than the target value. Thus, for the tank tests coil springs are mounted at the end of the mooring line to model the correct axial stiffness. The respective target scaled axial stiffness of the mooring tendons can be calculated by
c t a r g e t = E A · 1 λ 3 l 0 · 1 λ 1 = 2146 , 000 , 000   N × 1 50 3 168 , 421   m m × 1 50 = 5.097   N / m m ,
where c t a r g e t is the spring constant, EA is the ropes extensional stiffness, l 0 the unstretched length and λ the scaling factor. Respective springs were manufactured to represent the correct mooring stiffness for the scaled model by winding an 8 mm thick wire made of spring steel. Unfortunately, due to a mistake the manufactured springs were stiffer than intended as the unstretched length L 0 = 200 mm (which corresponds to 10,000 mm for full scale) of the springs themselves were used to calculate their stiffness instead of the rope length of 3368 mm (which corresponds to ~168,421 mm for full scale). This error leads to a much higher stiffness of
c t a r g e t w r o n g = E A · 1 λ 3 l 0 · 1 λ 1 = 2146 , 000 , 000   N × 1 50 3 10 , 000   m m × 1 50 = 85.84   N / m m ,
than intended. The respective coil springs therefore were designed to meet with this faulty spring stiffness
c i m p l e m e n t e d = G · d w 4 8 · d m s 3 · n = 81 , 500 × 8 4 8 × 30 3 × 18 = 85.84   N / m m .
Herein, G is the shear modulus, d w is the wire diameter, d m s is the medial spring diameter and n is the number of flexible windings. This mistake was discovered after the tests were completed. For a reasonable validation, the mooring stiffness of the numerical model was updated to meet with those of the physical springs in the tank test. This will be addressed in Section 3.3. All results presented in this publication represent the final implementation in OpenFAST. There were no further adjustments incorporated besides those introduced. In addition to the stainless steel lines and the springs, several swivels have been added to the mooring alignment to ensure the mooring lines will not be twisted. Furthermore, turnbuckles are used to allow for vernier adjustment of the line length and hence of the vertical TLP position. Additionally, the turnbuckles were used to fine-tune the mooring pretension.
The models’ draft in the basin was given by the tendons length, which were prepared accordingly. The moorings themselves were connected to high performance polyethylene (HPP) ropes which were lead through pulleyes at the bottom of the basin and, finally, to the measurement bridge where they have been fixated. The connection between moorings and HPP ropes were furthermore equipped with blockers, which prevented the mooring arrangement themselves from sliding through the pulleys. By this setup, the final position and alignment of the moorings were fixed. After the HPP ropes have been pulled and tightened with the blockers resting on the pulleys, further extensibility by the pretensioned HPP ropes is unlikely. Thus, the draft of the model could be adjusted by releasing and tightening the turnbuckles. At this point it should be noted, that fastening each of the tendons equally is a challenging task. By evaluating the mooring strain gauges (MSG) it was tried to tighten all tendons equally using the turnbuckles. However, this exercise is tricky as the whole mooring arrangement is very sensitive to changes and as soon as one tendon gets fastened, others decline in tension instantly. This behavior has also been observed by other TLP developers [25]. For full scale floaters, special connector elements which allow for respective adjustments are available. Furthermore, a full scale TLP would be equipped with special “self-adjusting” tendons, which are able to equalize in tension due to their inherent capability to adjust depending on the applied tension based on a creep effect. Nevertheless, the process of equally pretensioning the tendons of a mooring-stabilized structure is an object of interest. This becomes even more important for the implementation of the "self-installation" approach for the GICON®-TLP.

2.4. Sensors

Different systems to measure motions and forces on the platform as well as on the turbine have been used during the tank tests. An optical motion capturing system from Qualisys was used to monitor the platform motions. Four cameras have been mounted on the rig in front of the platform with one camera out of plane of the others in order to enable a good 3D-image for the tracking as illustrated in Figure 1. Four reflective bulbs were mounted on the TLP structure above the water surface, as shown in Figure 2. By this setup, motions of the structure in all 6 DOF can be captured. According to the manufacturer, the spatial accuracy of those systems can be below 1 mm, while the resolution is expected to lie below 0.1 mm [31]. These values depend on different conditions like the distance between tracing objects and cameras or light conditions. The accuracy and resolution claimed by the manufacturer have been confirmed by different studies [32,33,34]. Though, the resolution of such optical motion tracking systems is high, it can be insufficient to reproduce small motions. The alignment of the cameras and other environmental influences can hamper good tracking. Especially for rigid systems such as a TLP which typically show very little deflections in the mooring dominated DOFs (heave, roll and pitch) this can be an issue. This was observed during the evaluation of the test results for this paper and also by Robertson et al. [23].
On the turbine itself, the turbine thrust, as well as the rotor torque, can be measured, whereas the rotor speed is held constant by an electric motor. At the tower bottom, that is, the interface to the substructure, the forces in the X and Y directions are measured as well as the moment about the X and the Y axis (roll and pitch). The force in the Z direction, which is mainly caused by turbine and tower weight, as well as heave acceleration and the yaw moment, have not been measured. In line with the mooring tendons four water proof strain gauges of type HBM U9C were applied to measure the axial forces in each of the tendons independently. The measurement range is 500 N with an accuracy class of 0.2. The relative reproducibility and repeatability is <0.2%, also the non-linearity is <0.2% [35].
Using the two wave gauges, the waves were calibrated before the model was installed in the basin. Furthermore, to ensure the best results during wave tests, the distance between the wave gauges and the platform was chosen to ensure good measurements and minimal interaction between the test object and the measurement equipment.

3. Simulation Approach

The numerical calculations, applying the full scale floater and respective turbine, were carried out using OpenFAST v2.3.0 [36,37]. To model the NREL 5-MW turbine the publicly available OpenFAST model was used for the simulations presented in this paper [28]. Nevertheless, different pre-processing steps were mandatory in order to adapt the OpenFAST model to comply with the physical model tested in Nantes. As described in Section 2.1, some of the properties of the turbine differ from the exact scaled values due to scaling issues. This is why the respective properties of the NREL 5-MW as implemented in OpenFAST have been updated to meet with the characteristics of the scaled model. The GICON®-TLP was implemented with its dimensions as described in [14,30]. Some changes were necessary to account for the correct damping and mooring implementation. All changes with regard to the turbine and the substructure will be elucidated in the following. All values given in this and the following sections are for the full scale floater except those mentioned.

3.1. RNA and Tower

As described in Section 2.1, the turbine provided at ECN matches the original NREL 5-MW turbine for most values. The implementation in the numerical model accounts for the discrepancies, especially geometrical changes, changes for weight and centers of mass. In the simulations a shortened version of the original NREL 5-MW turbine tower was used to represent the same total tower length as in the physical tank test model. This approach neglects the changes of the tower mode shapes and their influence on the overall system behavior. Properly calculating the mode shapes of a tower on a floating substructure is a sophisticated task, which has been neglected for this work. This is justified by a small sensitivity study showing that the mode shapes are having only minor influence on the calculated natural frequencies. As per this study, the correct representation of tower mass and tower stiffness are much more important. Additionally, the case study revealed by neglecting the flexibility of the tower a strong coupling between platform rotational DOFs (pitch, roll) and the tower bending, as also observed by Prowell et al. [20] and Stewart et al. [19].

3.2. Substructure and Hydrodynamics

HydroDyn offers different approaches for the calculation of the hydrodynamic loads on fixed and floating substructures for wind turbines. The strip theory approach which is also known as Morison-Theory approach is applicable to members which can be considered as “hydraulic transparent”. Such members have a diameter to deep water wave length (D/L) ratio of less than 0.05. For such slender members, diffraction, radiation and dissipation are considered to be negligible [38]. For the GICON®-TLP, with its 14 m in diameter buoyancy bodies, hydraulic transparency cannot be assumed for many sea states. For the decay tests on the other hand, strip theory might be considered as applicable as the influence of diffraction and radiation are expected to be small. However, for the sake of consistency, the model described in this paper implements another available approach based on potential flow theory and an augmentation to account for additional drag loads [39]. This approach was chosen, having in mind that the results of combined wind and wave tests will also be compared with those from OpenFAST in the near future. Considering the further evaluation, it is found to be reasonable to apply the same approach for the hydrodynamic modelling in OpenFAST for decay tests as well as for different sea states, where the potential flow approach is expected to deliver more reasonable results.
By use of ANSYS AQWA, the potential flow solution for different wave frequencies and directions (from – π to π with 34 intermediates) has been computed for the substructure in the frequency domain. In this computation, only the hull (the wetted surface) of the floating substructure without moorings, anchor or wind turbine was considered. By use of the Matlab Tool AQWA2WAMIT, the results of the AQWA computation were converted to the WAMIT file format, which is expected by HydroDyn [39].
As described above, a hybrid approach will take the viscous drag effects from the strip theory solution into account as this is not otherwise considered in the potential flow solution. Determining respective drag coefficients C D for the different members depends on the Reynolds number Re and the Keulegan-Carpenter number (KC). This means that for different flow regimes like different waves and currents, drag coefficients would vary. Due to suggested drag and inertia coefficient values by the DNVGL, C D can be considered as independent from K C for values below 10 [27]. For the decay tests without waves and current K C is below 10. K C is calculated as per Equation (6).
K c = V · T L .
Herein V is the maximum amplitude of the flow velocity of the oscillating body as presented in Table 3, T the period of the oscillation, as derived from the model tests and L, is a characteristic length. It is represented by the pile diameter of 3 m respectively the buoyancy bodies diameter of 14 m. The arising K C values are shown in Table 2.
This is especially critical for varying sea states such as irregular waves and unsteady currents. For the decay tests, however, Re is considered constant and was calculated as per Equation (7).
R e = u · D ν .
Herein, u is the current velocity, D is the pile diameter and ν is the fluid kinematic viscosity. It was estimated that the water temperature is 15 C. For this temperature the kinematic viscosity for fresh water is considered to equal ν = 1.14 × 10 6 m2/s [40]. u has been obtained for surge and sway decay tests directly while the rotating velocity about the z-axis for yaw has been calculated based on the angular velocity. The respective Re have been calculated accordingly. The results are shown in Table 3. The pile diameter for all tubes (vertical and horizontal) is three and for the buoyancy bodies 14 m.
For cylinders, different drag coefficients are suggested. For Re = 10 5 DNVGL recommends C D = 1.0 [40]. However, as worked out in Table 3 Re is beyond 10 5 for the decay tests. Clauss et al. suggest a more sophisticated approach, which might be less conservative but closer to physical behavior. He suggests to assume C D = 1.2 for Re 2.5 × 10 5 and C D = 0.7 for Re > 5.0 × 10 5 . For 2.5 × 10 5 R e 5.0 × 10 5 , the transitional phase, a range from 0.7 to 1.2 is suggested for C D [41]. This approach has been adopted for surge and sway decay. For yaw, the horizontal tubes are not subjected perpendicular to the flow, and it is not sure if a coefficient of C D = 0.7 is correct. Though, for the scope of this paper, this difficulty will be regarded as of minor influence and C D = 0.7 is assumed also for the horizontal tubes for yaw decay. Determining the velocities for heave roll and pitch is, again due to the high stiffness of the mooring setup, difficult as the motions are small. However, the velocity for these decay tests are expected, due to the dominating influence of the moorings, to be rather higher than lower compared to those for surge, sway and yaw. Thus, C D = 0.7 seems also a reasonable value for heave, roll and pitch.
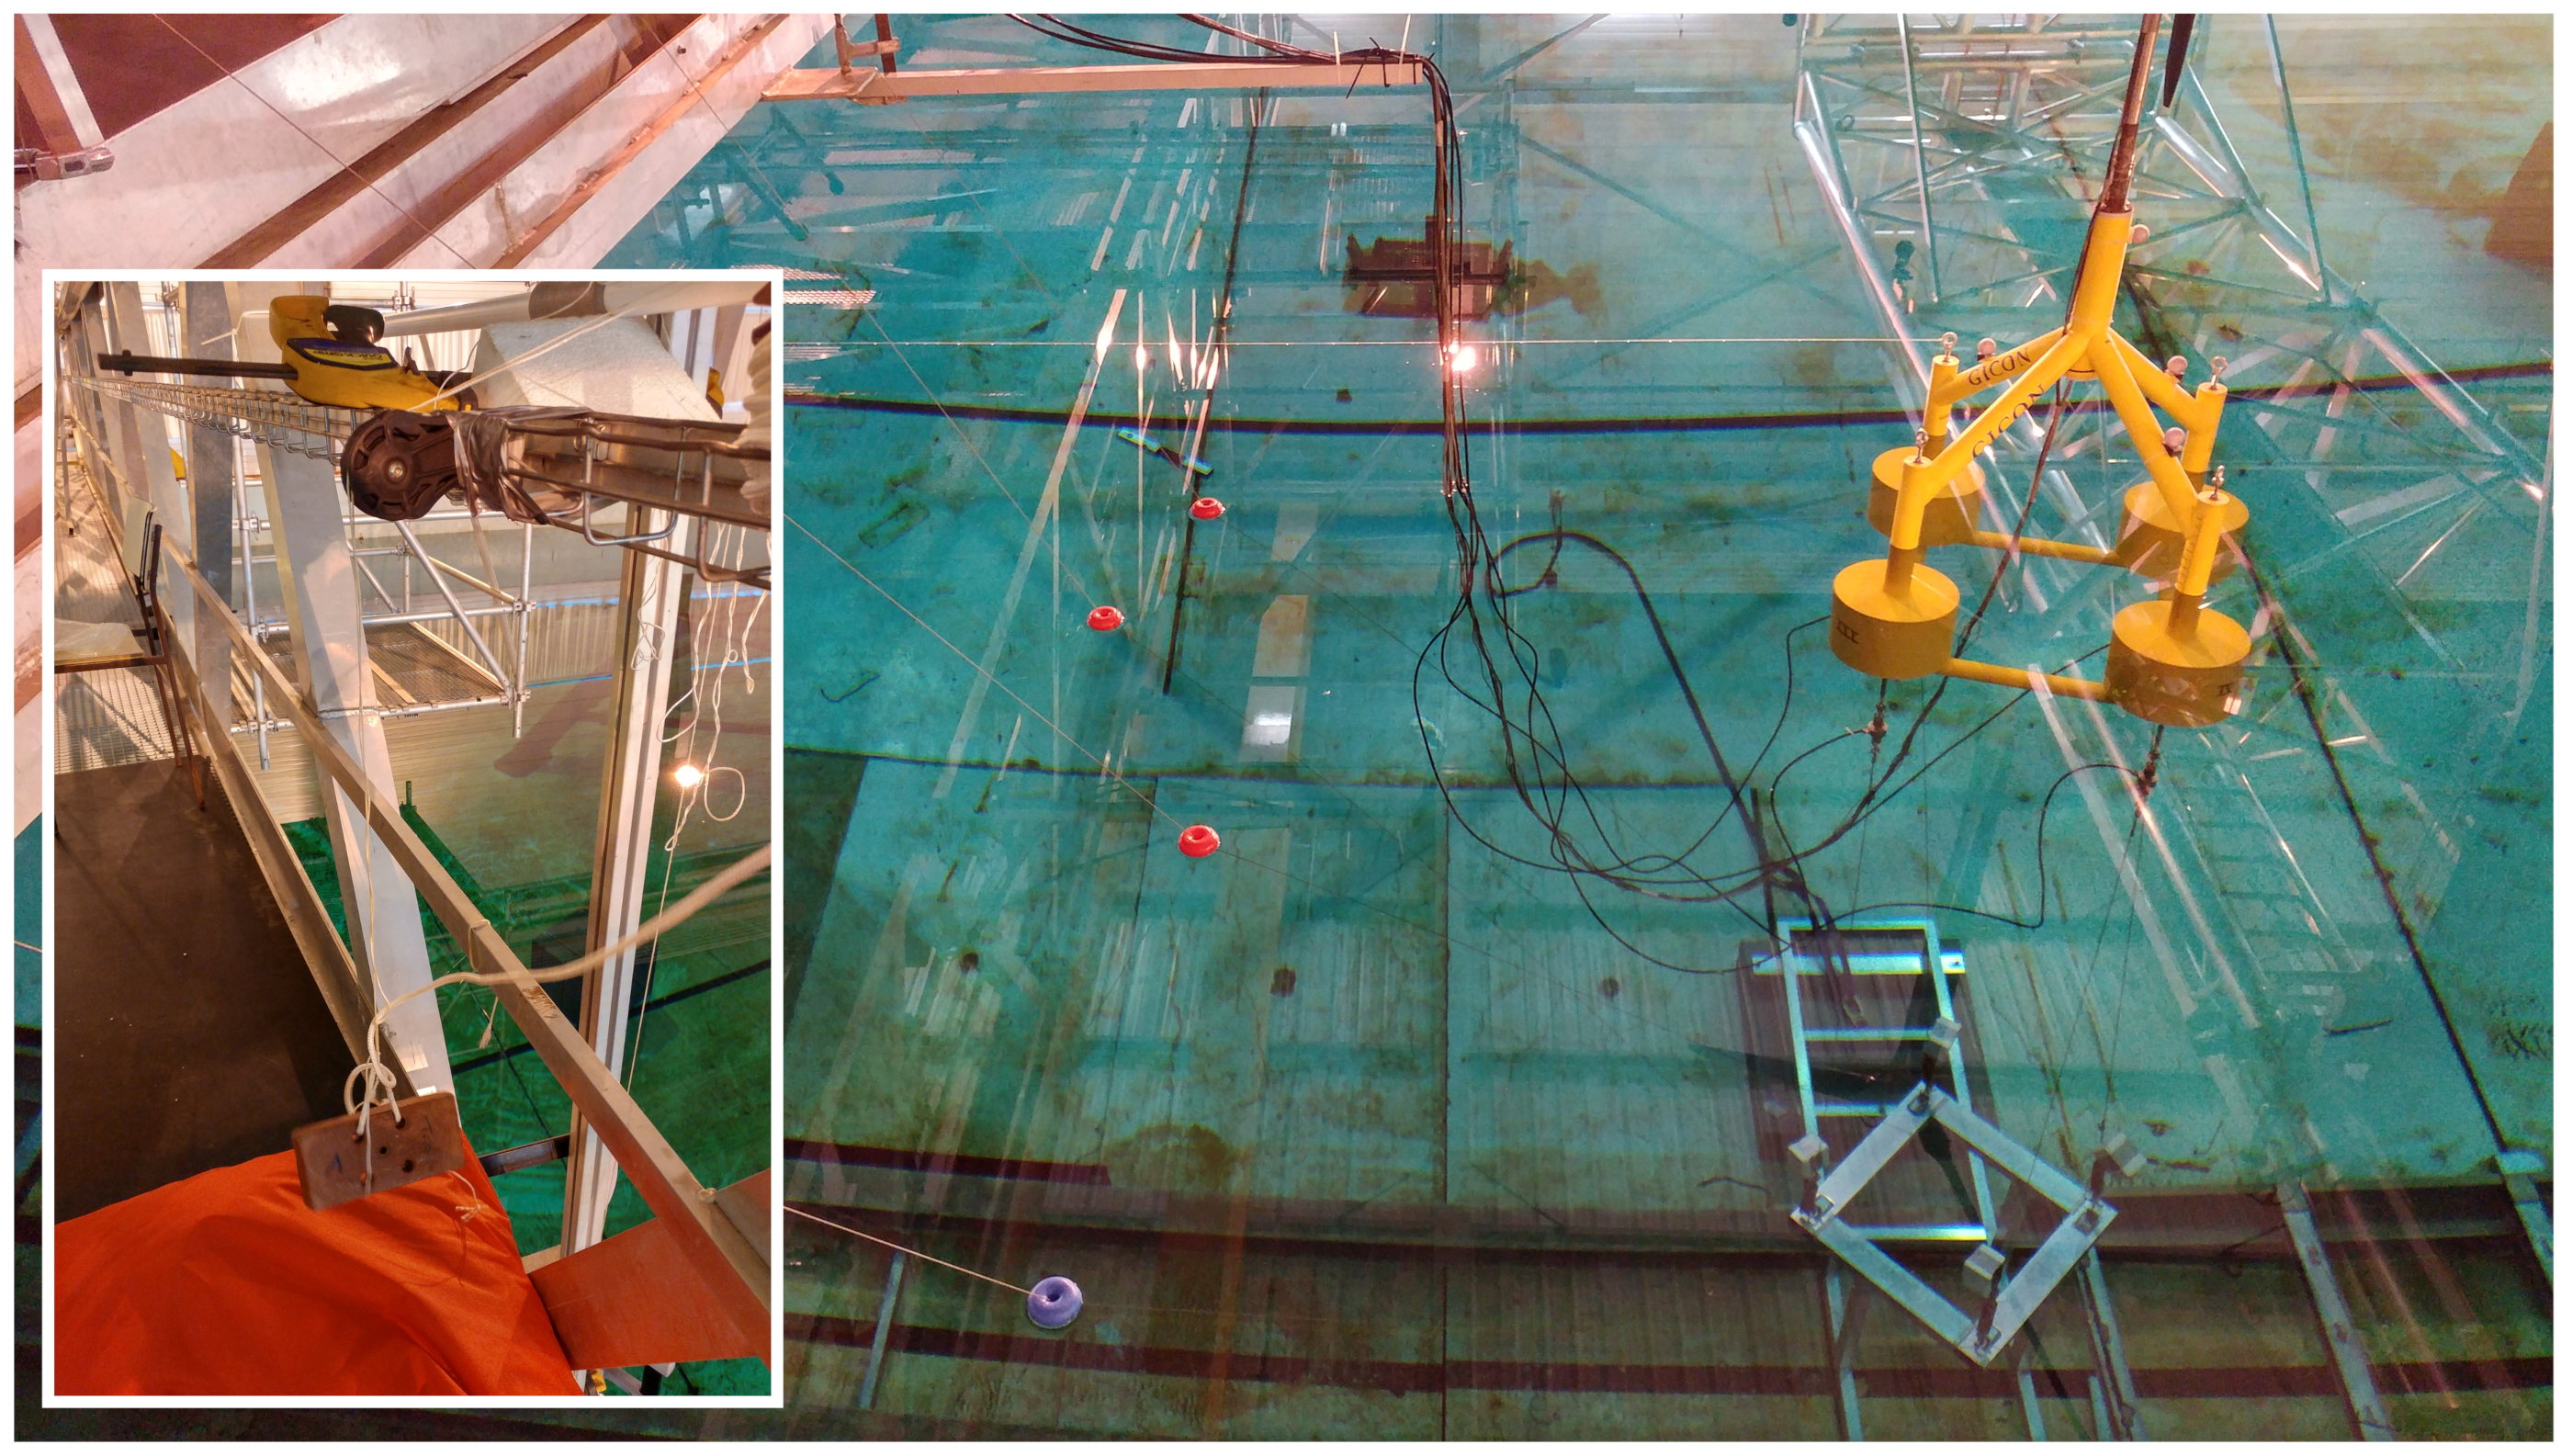
The strip theory model of the TLP in HydroDyn was set up with a respective alignment as in the physical model tests as shown in Figure 2. Thirty-four joints have been defined including those four at the bottom of the TLP at −30.70 m below MSL, where the moorings are attached, as well as the joint at 37.25 m above MSL where the intersection between substructure and tower is located. The water depth is 200 m corresponding to the 4 m from the attachment point of the moorings to still water level for the tank tests.
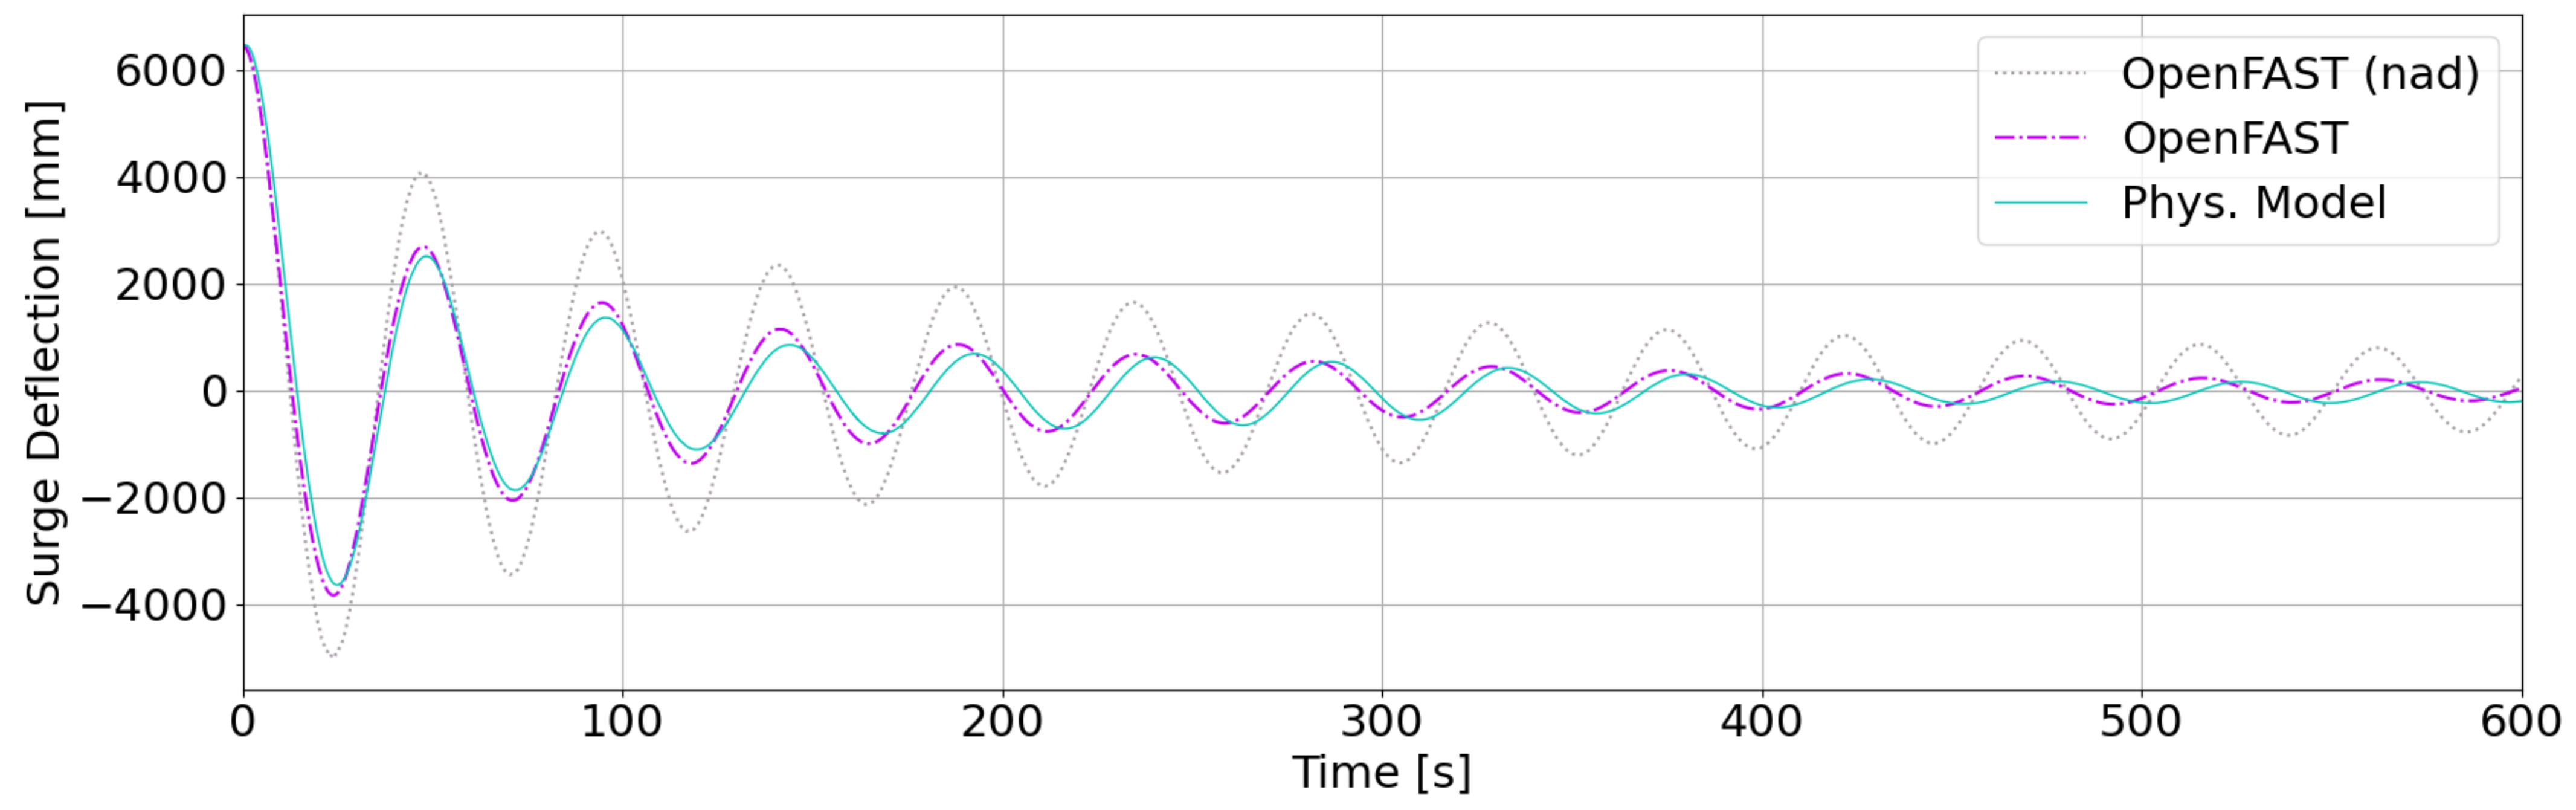
It was observed when comparing the computational model with the results from the tank tests that OpenFAST underestimates the damping of the system. This behavior is known [39,42]. This is why additional damping by use of the additional linear damping (AddBLin) and the additional quadratic damping matrix (AddBQuad) was implemented to better agree with the results from the experimental results. The matrices are applied at the intersection of the tower centerline and the mean sea level which Jonkman calls the “Wamit Reference Point” [39]. Basically, due to the symmetry of the platform additional damping for surge and sway should coincide. Though, there is a slight mismatch between surge and sway envelope curve seen in the tank tests. This is led back to the influence of the turbine on the overall system. Thus, damping for surge is a little bit higher, compared to the damping for sway. As the aerodynamic effects should not be taken account in the HydroDyn tuning the B 22 q u a d and B 22 l i n were adjusted for a good agreement with sway damping. Furthermore, due to the aforementioned symmetry B 11 q u a d and B 22 q u a d as well as B 11 l i n and B 22 l i n were equalized. This approach is considered reasonable due to the aerodynamic effects of the rotor and the respective representation in OpenFAST. Also for heave, roll and pitch the damping was tuned in order to agree well with the results from the tank tests. Linear and quadratic damping matrices as implemented in OpenFAST are shown in Table 4 and Table 5. Herein B 11 corresponds to the damping for surge and B 22 for sway motion. B 33 in analogy represents damping for heave while B 44 represents pitch and B 55 roll damping. Finally B 66 corresponds to the yaw damping [42]. The additional damping matrices have been determined for and applied to the full scale floater as implemented in OpenFAST. In that way, the matrices are valid for the given geometry and Froude number.
As addressed in Section 2.2 the platform unintentionally became heavier than expected due to a leak. The water ingressed, and its weight was calculated and, based on these findings, the structure weight was adjusted to account for the further ballasting. Furthermore, the inertia properties and the center of gravity (COG) were adjusted, respectively. The final values are shown in Table 6.

3.3. Moorings

The mooring system of the tested platform was modelled with MAP++ in the numerical simulations. In order to implement the moorings from the scaled model tests correctly the overall mooring stiffness has been calculated by underlying actual spring and stainless steel rope properties. The total spring constant of the system (one rope of length x and one spring, at one corner of the TLP) was calculated as per Equation (8).
1 c t o t a l = 1 c r o p e + 1 c s p r i n g .
Additional mooring components like swivels and eyelets are difficult to be taken into account. It is assumed that the stiffness of swivels and eyelets are by orders higher than the steel rope and the spring. However, a parametric study was carried out to find the optimal mooring properties to be implemented in MAP++. The values of EA = 1.93 × 10 10 N and L 0 = 169.2155 m were found best suitable by resulting in a good agreement of the NF with those from the model and have been used further on.

4. Results

Decay tests have been carried out to determine the natural frequencies (NF) of the platform in its 6 degrees of freedom (DOF). For each DOF, a specific setup has been applied in order to deflect the structure in the respective direction. The decay tests have been carried out at least three times per DOF in order to guarantee valid results and enable plausibility checks. In total, more than 18 decay tests have been performed.

4.1. Natural Frequencies of the Physical Model

For finding the NF in surge direction, a string was attached to the eyeloop at structure aft. The string was lead through several pulleys. At the other end of the string, a weight was attached, so the structure became deflected from its equilibrium position. The string with the weight attached was cut, which caused the structure to oscillate about its neutral position. The motions of the structure were recorded in order to determine the NF. For the sway DOF, this procedure was repeated but with the string attached to the eyeloop on port side. To cause a deflection in heave, strings were attached to two eyeloops at bow and aft, and lead through a pulley above the platform in order to deflect the structure in vertical direction. For pitch DOF the string was attached to the aft eyeloop, and also vertically lead through a pulley above the eyeloop. For roll the same setup was used but with the port side eyeloop. Finally, the yaw DOF was excited by bringing the TLP into a twisted (around z-axis) starting position. This was done by attaching the string once again to the eyeloop on the port side and pulling horizontally as shown in Figure 3. The clump weight used for the decay tests was 2.9 kg.
The system deviation for surge, sway and yaw were of high significance and therefore could be tracked well by the motion capturing system. The results have been post-processed by use of different python3 libraries in order to identify the peaks of the time signal. The time lags between single peaks have been used to determine the NF. The results have been plotted against those from the numerical simulation to allow for a better comparison and are shown in Section 4.2.
For heave, roll and pitch, on the other hand, the deflections due to the attached weight are small. The reason for this is the high stiffness of the mooring tendons. While for surge, sway and yaw the mooring stiffness is of lower importance, it has a dominating influence for heave, roll and pitch. As explained in Section 2.4 the tracking system is expected to allow for resolutions of 0.2–1 mm and up. It was found that the resolution of the motion capturing system was still sufficient for heave and roll. For pitch, however, where the noise amplitude was higher, the resolution is considered insufficient and thus the motion for this DOF could not clearly be monitored. The different results for roll and pitch are ascribed to the camera arrangement. All 4 cameras were placed in front of the model, one out of plane of the others. For this setup the roll motion seems to be more significant than the pitch motion for the same deviation which leads to less noise for this DOF or in other words to a better motion recognition.
For heave and roll, the frequencies calculated by use of the motion data have been verified by also examining the tendon forces. The left plot in Figure 4 shows all four mooring forces for the heave decay test. It can be well observed that the amplitudes of oscillation for all moorings are similar. Furthermore, the frequencies found for all four moorings are equal, as one would expect and coincide well with those found from the motion data. For roll tendon forces #2 and #4 which are located on starboard and portside and thus are relevant for the roll NF are shown in the right plot of Figure 4. The 180 phase shift of both tendon forces to each other is clearly visible. As described above for the pitch free decay tests, the resolution of the motion tracking system is considered insufficient. This is why the NF for pitch have been computed based on the mooring forces measured for the respective tendons (2 and 4).
For both plots in Figure 4, an offset between the mean values for the different mooring tendons can be observed. As described above, this results from the nature of the system’s behavior, where adjusting and bringing more than two tendons to the same pretension is a demanding task. As equal pretension for all tendons is crucial for TLP’s this is topic of current research and will be addressed in future publications. All repetitions of the decay tests have been evaluated. For two tests it was found that the motion tracking system failed. Besides that, the outputs of the different repetitions of the tests agreed well which indicates reliable results.
The peaks were counted in order to calculate the NF. Therefore, the NF found for the surge direction is 0.0210 Hz while it is 0.0213 Hz for sway. For heave the NF was estimated at 0.9705 Hz. Roll with 0.3840 Hz and pitch with 0.3941 show a slight mismatch, which will be discussed later. For yaw the NF is 0.0243 Hz. All frequencies are summed up with the respective results for the numerical model in Table 7.

4.2. Coupled Simulation Results for Natural Frequencies and Result Comparison

In OpenFAST decay tests have been carried out by a similar approach as for the physical model. For all decay tests calm water and zero wind were underlain. In ElastoDyn, deviations in the different DOFs have been set as initial conditions which caused a swing-out which can be used to calculate the NF for the respective DOF. The plots below provide an overview of the system response for the different DOFs. Plotted are the results for the physical model, those for the simulations with additional damping matrices applied and furthermore the results for the simulations where no additional damping was applied (nad).
Figure 5 and Figure 6 show the deflection for the free decay test in the surge and sway direction for the physical model used in the tank tests and OpenFAST simulation. In order to ease comparison, the results for the scaled model have been upscaled to meet with full-scale simulation in OpenFAST. As mentioned above, linear and quadratic damping matrices in HydroDyn have been tuned for a good agreement of damping for sway. For the sake of symmetry the same damping coefficients have applied for surge as well. This causes a slight mismatch between the damping of the physical model and the simulation for surge. This behavior is traced back to the turbine in the physical model and how it is represented in OpenFAST. The results in surge and sway having a good agreement between simulation and tank test. The deviation between tank test results and those for OpenFAST for surge is 1.4% and for sway 0.0%.
Figure 7 shows the system response for the heave free decay test. The OpenFAST results can be easily evaluated with a clearly visible oscillation. For the physical model the first 6 peaks can easily be identified as the response to the initial excitation. The respective frequency agrees well with the results from the mooring tension forces. However, it can be observed that the oscillation decays fast and cannot be distinguished well after 7 s. The results of the simulation with a NF of 1.0232 Hz versus the physical model with 0.9705 Hz agrees well. The deviation is 5.2%.
Responses for roll free decay test are plotted in Figure 8. Intentionally no filters were applied to these data. The peaks can be clearly identified for the physical model as well as for the OpenFAST simulation. The frequency for the physical model is 0.3840 Hz while, for the simulation, 0.3699 Hz was determined.
In Figure 9, it can be seen that for the physical model the pitch motions cannot be clearly identified as they are hidden in the signal noise. This is due to the very small deflection for the pitch free decay tests and the camera alignment which makes the detection for small pitch motions particularly difficult and was expected as initially outlined in Section 2.4. The mooring tensions for the pitch free decay test for the physical model as well as the OpenFAST simulation as shown in Figure 10 give a much clearer impression. Herein tendons #1 and #3 are plotted, which are located at front and rear (with regard to the coordinate system) and therefore are appealed significantly by pitch motions. Again, as for roll the phase shift between the forces in tendon #1 and #3 is clearly visible for the tank test as well as the simulation results. Therefore, the natural frequency for pitch for the physical model was determined with 0.3941 Hz and 0.3656 Hz for the numerical model. Thus, the deviation corresponds to 7.8%.
Figure 11 finally shows the deflection for the yaw free decay test. Due to the limited stiffness for yaw, the deflection due to the clumb weight is high, which results in a good readable system response with clear peaks and throughs for physical model and simulation. The NF found for the physical model is 0.0243 Hz and for the simulation 0.0236 Hz, the resulting deviation is 3.0%.
The natural frequencies found for the tank test results, as well as the coupled simulation, are summarized in Table 7. Moreover, the damping ratios are given. It also states, for each degree of freedom, the standard deviation of the natural frequencies of the repeat measurements. Finally, the table comprises the deviation between simulation and tank test results.

5. Discussion

Comprehensive tank tests have been carried out. As part of this, the results of the 6 DOF free decay tests were evaluated and compared to those for numerical simulations based on OpenFAST for this paper. The tank tests showed different difficulties. The structure became heavier than intended due to limited water ingress. As the amount of water which entered the structure was assessed and therefore could be accounted for, when updating and evaluating the OpenFAST simulations, the effects on the primary purpose of the tank tests, the validation of the OpenFAST model for the GICON®-TLP is limited and the results are still considered valuable.
For a TLP the moorings are of significant importance, when evaluating its natural frequencies. Especially heave, roll and pitch motions are influenced by mooring restraints. Thus, the unintentional high stiffness of the tendons dominate the systems response to external influences. This error was identified after the completion of the model tests. With this knowledge, it was possible to account for the higher stiffness of the mooring alignment. Based on the higher stiffness of the coil springs the moorings in the numerical model were adjusted respectively. After adjusting the moorings stiffness in the numerical model, both the tank tests results and those for the numerics agree well. The intention of scaled model tests is the validation of numerical models. A validated numerical model can be used to efficiently compute time series for various load cases as demanded by different standards. The comparison showed that the presented model shows legit results. Even if validated against tank tests with higher mooring stiffness applied, the numerical model seems consistent and robust enough to be used for extensive load simulations.
The german federal authority for maritime tasks Bundesamt für Seeschiffahrt und Hydrographie (BSH) recommends to make sure that “excitation frequencies (1P and 3P) of the installation and the natural frequencies of the support structure are suitably far apart” [43]. Herein, it is advised that the ratio between rotation frequency of the rotor during normal operation (1P) and first natural frequency of the support structure should be less than 0.95. Furthermore, it is advised that the quotient of blade passing frequency (3P) and first natural frequency of the support structure should be less than 0.90 or greater than 1.05. This shows that uncertainties regarding the natural frequencies of the support structure are to be expected and have to be taken into account. The model as set up in OpenFAST and the scaled model in the tank tests show a good agreement for the natural frequencies. Overall, it can be seen that the simulation as presented in this paper overpredicts the platforms natural frequencies. The discrepancy for the different DOF range from 0 to 7.8%. Despite the conscientious evaluation of the mooring tension and the water ingressed the model, little uncertainties remain. Thus, it is expected that a repetition of the tank tests with an adequate mooring stiffness and platform weight would allow for further enhancement of the results.

6. Conclusions

Numerical tools depend on adjustments and tuning at different positions to represent physical correlations correctly. Free decay tests are commonly used to adjust and compare the numerical implementation with experimental results for the hydrodynamics of a floating substructure. If those results are not available, setting up the numerical model correctly is difficult and error prone.
TLPs represent a minor share of the platforms tested as the majority of floating substructure designs are based on semi-submersible or spar-type concepts. Both concepts commonly utilize slack moorings. For TLPs, with their inherent small deflections in heave, roll and pitch, due to taut moorings; on the other hand, the measuring concept should account for system specific characteristics. Other than for semi-submersibles or spar-type floaters, the motions for the mooring dominated DOF’s for a TLP are in the same order as the resolutions to be expected by commonly used motion tracking systems. However, these small deflections are of high importance when analyzing natural frequencies and higher order effects. Therefore, the measurement concept should reflect the typical behavior of a TLP. It was shown by evaluating the time series for the mooring strain gauges, reasonable results can be found, enabling the determination of the natural frequencies beyond the capabilities of the optical motion tracking system. This also emphasizes the advantage of redundancy within the measurement concept. If one sensor, or even a complete set of sensors fail, other sensors might help to compensate for insufficient data by others. With regard to the sampling frequency of sensors and measurement concepts it seems that common state of the art equipment such as inertial measurement units or strain gauges and respective amplifiers provide sufficient performance. The frequencies of motions to be expected by floating wind turbine systems are regarded as of orders lower than typical sampling frequencies for modern sensors and respective equipment.
Many of the scaled representations of floating substructures before were made of welded steel or aluminium. Welding stainless steel and aluminium, especially with thin wall thicknesses can be difficult. It needs an experienced welder and can therefore be time and cost intensive. The model represented here was built by applying a different approach, made of aluminium pipes and POM connector elements, which were bolted together and sealed afterwards. Furthermore, the buoyancy bodies were made from foam. This approach can be less complex and time-consuming. However, the intersection between the different components should be treated with great care to avoid water ingress. An eye should be kept on tolerances and sealing materials. In a later version of the model, these findings were taken into account when designing the different components and applying dedicated sealing measures.
The platform’s sensitivity to the mooring alignment is typical for TLPs. It was found that adjusting the different tendons to equal their pretension is very difficult. Current research focuses on the installation and pre-tensioning of the moorings for the GICON®-TLP, which is of great interest for scaled model tests and, more importantly, for the serial- fabrication and installation of floating wind farms. For scaled model testing as described in this paper, accounting for the mooring stiffness by the use of respective coil springs is considered as an adequate solution if applied correctly. However, for model tests which aim at situations other than the operational phase of the installed platform with the turbine on top, this approach might not be suitable. Such tests may include transport and installation conditions, where the moorings have to be winded up and down. For these kinds of tests, other approaches, based on flexible mooring materials, should be considered. At the same time, this raises known challenges with regard to the correct scaling of stiffness and damping for the ropes themselves.
Even though the structure was heavier than intended and therefore provided less buoyancy, its motion behavior was very stable and satisfied the expectations. Known limitations for hydrodynamic modeling make it necessary to apply additional drag and damping terms. These are depending on the Reynolds- and Keulegan-Carpenter number and therefore have to be adjusted depending on the load case or, to be more precise, the fluid regime. It could be shown that the results of the numerical model in OpenFAST show a good agreement when the respective adjustments for drag and damping are implemented. For other load cases implying higher K C numbers, for example, violent waves, these considerations have to be taken into account.
This paper deals with the model specifications and determination of the natural frequencies for the tank tests, as well as for the numerical model. Further experiments were conducted using the same physical model, including different load cases such as wind only, wave only and combined wind- wave tests for a rated wind speed and a 50 years storm. In order to not exceed the scope of this paper, the respective results will be published in the near future.

Author Contributions

Conceptualization, D.W., H.H. and F.A.; methodology, D.W. and F.A.; software, D.W. and P.S.; model preparation, D.W.; validation, D.W. and P.S.; formal analysis, H.H.; investigation, H.H.; resources, H.H.; data curation, H.H.; writing—original draft preparation, D.W.; writing—review and editing, P.S.; visualization, D.W.; supervision, D.W.; project administration, F.A. and J.G.; funding acquisition, F.A. All authors have read and agreed to the published version of the manuscript.

Funding

The authors would like to express their sincere gratitude for the funding of the tank tests and travel costs by the Marinet2 programme which received funding from the European Union’s Horizon 2020 research and innovation programme under grant agreement No 731084. Furthermore, the authors would like to acknowledge the funding of this research by the European Regional Development Fund (EFRE) of the European Union and Ministry of Economic Affairs, Construction and Tourism of the State of Mecklenburg-Vorpommern (FK: TBI-V-1-071-VBW-02).

Data Availability Statement

The data presented in this study are available on request from the corresponding author.

Acknowledgments

The authors would like to thank Peter Dierken for his continuous support during model preparation and laboratory testing. We would furthermore like to express our sincere gratitude to the dedicated team at LHEEA de Centrale Nantes in particular Sylvain Bourdier, Jeremy Ohana, Anne Levesque and Matthieu Weber. Without their strong support the tank tests would not have been possible. A further thank you goes to Andreas Fretwurst of the University of Rostock for supporting the model building. Frank Lemmer of SWE supported this research by providing the AQWA2FAST Matlab script which enabled the conversion of the frequency domain solution from ANSYS AQWA to the WAMIT file format which were used in the HydroDyn model.

Conflicts of Interest

The authors declare no conflict of interest. The funders had no role in the design of the study; in the collection, analyses, or interpretation of data; in the writing of the manuscript, or in the decision to publish the results.

Abbreviations

The following abbreviations are used in this manuscript:
BSHBundesamt für Seeschiffahrt und Hydrographie
DOFDegree of Freedom
ECNÉcole Central Nantes
HPPHigh Performace Polyethylene
LWETLehrstuhl für Windenergietechnik
NFNatural Frequency
RNARotor Nacelle Assembly
MSGMooring Strain Gauge
TLPTension-Leg Platform
TPTransition Piece

References

  1. The Paris Agreement; Technical Report; United Nations—Framework Convention on Climate Change Official Journal of the European Union: Paris, France, 2016; Available online: https://eur-lex.europa.eu/legal-content/EN/TXT/?uri=CELEX:22016A1019(01) (accessed on 13 June 2021).
  2. Jones, N. Data Centres Are Chewing up Vast Amounts of Energy. Nature 2018, 561, 5. [Google Scholar] [CrossRef] [PubMed]
  3. Andrae, A.; Edler, T. On Global Electricity Usage of Communication Technology: Trends to 2030. Challenges 2015, 6, 117–157. [Google Scholar] [CrossRef] [Green Version]
  4. European Environment Agency. Europe’s Onshore and Offshore Wind Energy Potential. An Assessment of Environmental and Economic Constraints; Technical Report; European Environment Agency: Copenhagen, Denmark, 2009; Available online: https://www.eea.europa.eu/ds_resolveuid/58683b10a5ec519d1384c3e4a2c82168 (accessed on 13 June 2021).
  5. McCarthy, M. SOCIAL ACCEPTANCE OF WIND ENERGY PROJECTS ”Winning Hearts and Minds” STATE-OF-THE-ART REPORT. The International Energy Agency. p. 26. Available online: http://www.socialacceptance.ch/images/State-of-the-Art_Acceptance_Wind_Energy_Ireland.pdf (accessed on 13 June 2021).
  6. The Social Acceptance of Wind Energy: Where We Stand and the Path Ahead; JRC Science for Policy Report; European Commission, Joint Research Centre, Directorate for Nuclear Safety and Security: Brussels, Belgium, 2016; Available online: https://publications.jrc.ec.europa.eu/repository/handle/JRC103743 (accessed on 13 June 2021).
  7. Arent, D.; Sullivan, P.; Heimiller, D.; Lopez, A.; Eurek, K.; Badger, J.; Jorgensen, H.E.; Kelly, M.; Clarke, L.; Luckow, P. Improved Offshore Wind Resource Assessment in Global Climate Stabilization Scenarios; National Renewable Energy Lab. (NREL): Golden, CO, USA, 2012. [CrossRef] [Green Version]
  8. Lande-Sudall, D.R. Wave-Induced Loads between a Spar-Buoy Floating Wind Turbine and Installation Vessel. J. Phys. Conf. Ser. 2020, 1669, 012009. [Google Scholar] [CrossRef]
  9. Rhodri, J.; Marc Costa, R. Floating Offshore Wind: Market and Technology Review; Technical Report; The Carbon Trust: London, UK, 2015; Available online: https://www.carbontrust.com/resources/floating-offshore-wind-market-technology-review (accessed on 13 June 2021).
  10. Wehmeyer, C.; Ferri, F.; Andersen, M.; Pedersen, R. Hybrid Model Representation of a TLP Including Flexible Topsides in Non-Linear Regular Waves. Energies 2014, 7, 5047–5064. [Google Scholar] [CrossRef] [Green Version]
  11. Hurley, W.L.J.; Nordstrom, C.J. Offshore Wind Floating Platform Demonstration Project FEED Study; Pelastar: Seattle, WA, USA, 2014; 61p, Available online: http://pelastar.com/wp-content/uploads/2015/01/PelaStar-LCOE-Paper-21-Jan-2014.pdf (accessed on 13 June 2021).
  12. Amate, J.; Gonzalez, G.; Sanchez, G.D. Development of a Semi-Submersible Barge for the Installation of a TLP Floating Substructure. In Proceedings of the Wind Europe Summit 2016, Hamburg, Germany, 27–29 September 2016. [Google Scholar]
  13. Adam, F.; Myland, T.; Dahlhaus, F.; Grossmann, J. GICON-TLP for Wind Turbines—The Path of Development; CRC Press: London, UK, 2015; Available online: https://www.researchgate.net/publication/281086717_GICONR-TLP_for_wind_turbines_-_the_path_of_development (accessed on 13 June 2021).
  14. Hartmann, H.; Walia, D.; Adam, F.; Ritschel, U.; Großmann, J. One Step Installation of a TLP Substructure: Requirements, Assumptions, Issues. In Proceedings of the ASME 2017 International Conference on Ocean, Offshore & Arctic Engineering OMAE, Trondheim, Norway, 25–30 June 2017; p. V010T09A066. [Google Scholar] [CrossRef]
  15. Nihei, Y.; Fujioka, H. Motion Characteristics of TLP Type Offshore Wind Turbine in Waves and Wind. In Proceedings of the 29th International Conference on Ocean, Offshore and Arctic Engineering, Shanghai, China, 6–11 June 2010; ASMEDC: Shanghai, China, 2010; Volume 3, pp. 283–292. [Google Scholar] [CrossRef]
  16. Nihei, Y.; Kozen, M.; Lijima, K. Elastic Characteristics of TLP Type Offshore Wind Turbine. In Proceedings of the ASME 2012 31st International Conference on Ocean, Offshore and Arctic Engineering, Rio de Janeiro, Brazil, 1–6 July 2012. [Google Scholar]
  17. Nihei, Y.; Matsuura, M.; Murai, M.; Iijima, K.; Ikoma, T. New Design Proposal for the TLP Type Offshore Wind Turbines. In Volume 3: Materials Technology; Ocean Space Utilization; American Society of Mechanical Engineers: Nantes, France, 2013; p. V003T05A026. [Google Scholar] [CrossRef]
  18. Goupee, A.J.; Koo, B.; Lambrakos, K.; Kimball, R. Model Tests for Three Floating Wind Turbine Concepts. In Proceedings of the Offshore Technology Conference, Houston, TX, USA, 30 April 2012. [Google Scholar] [CrossRef]
  19. Stewart, G.; Lackner, M. Calibration and Validation of a FAST Floating Wind Turbine Model of the DeepCwind Scaled Tension-Leg Platform: Preprint. In Proceedings of the 22nd International Offshore and Polar Engineering Conference, Rhodes, Greece, 17–22 June 2012. [Google Scholar]
  20. Jonkman, J.; Prowell, I.; Robertson, A.; Goupee, A.J.; Stewart, G.M. Numerical Prediction of Experimentally Observed Behavior of a Scale-Model of an Offshore Wind Turbine Supported by a Tension-Leg Platform. In Proceedings of the Offshore Technology Conference, Houston, TX, USA, 6–9 May 2013. [Google Scholar] [CrossRef] [Green Version]
  21. Koo, B.; Goupee, A.J.; Lambrakos, K.; Kimball, R.W. Model Tests for a Floating Windturbine on Three Different Floaters. J. Offshore Mech. Arct. Eng. 2014, 136, 020907. [Google Scholar] [CrossRef]
  22. Zamora-Rodriguez, R.; Gomez-Alonso, P.; Amate-Lopez, J.; De-Diego-Martin, V.; Dinoi, P.; Simos, A.N.; Souto-Iglesias, A. Model Scale Analysis of a TLP Floating Offshore Wind Turbine. In Volume 9B: Ocean Renewable Energy; American Society of Mechanical Engineers: San Francisco, CA, USA, 2014; p. V09BT09A016. [Google Scholar] [CrossRef]
  23. Robertson, A.N.; Jonkman, J.M.; Goupee, A.J.; Coulling, A.J.; Prowell, I.; Browning, J.; Masciola, M.D.; Molta, P. Summary of Conclusions and Recommendations Drawn From the DeepCwind Scaled Floating Offshore Wind System Test Campaign. Ocean Renew. Energy 2013, 8, V008T09A053. [Google Scholar] [CrossRef] [Green Version]
  24. Oguz, E.; Day, A.H.; Clelland, D.; Incecik, A.; Dai, S.; Lopez, J.A.; González, G.; Sánchez, G.D. Experimental and Numerical Analysisof a TLP Floating Offshore Wind Turbine. 2014. Available online: https://pure.strath.ac.uk/ws/portalfiles/portal/70589419/Oguz_OE2017_Experimental_and_numerical_analysis_of_a_TLP_floating_offshore.pdf (accessed on 13 June 2021).
  25. Oguz, E.; Clelland, D.; Day, A.H.; Incecik, A.; López, J.A.; Sánchez, G.; Almeria, G.G. Experimental and Numerical Analysis of a TLP Floating Offshore Wind Turbine. Ocean Eng. 2018, 147, 591–605. [Google Scholar] [CrossRef] [Green Version]
  26. Zhao, Y.S.; She, X.H.; He, Y.P.; Yang, J.M.; Peng, T.; Kou, Y.F. Experimental Study on New Multi-Column Tension-Leg-Type Floating Wind Turbine. China Ocean Eng. 2018, 32, 123–131. [Google Scholar] [CrossRef]
  27. Journee, J.; Massie, W. Offshore Hydromechanics; Delft University of Technology: Delft, The Netherlands, 2001; Available online: https://ocw.tudelft.nl/wp-content/uploads/OffshoreHydromechanics_Journee_Massie.pdf (accessed on 13 June 2021).
  28. Jonkman, J.; Butterfield, S.; Musial, W.; Scott, G. Definition of a 5-MW Reference Wind Turbine for Offshore System Development; Technical Report NREL/TP-500-38060, 947422; National Renewable Energy Laboratory: Golden, CO, USA, 2009. [CrossRef] [Green Version]
  29. Courbois, A. Étude Expérimentale du Comportement Dynamique d’une éolienne Offshore Flottante Soumise à l’action Conjuguée de la Houle et du vent. Ph.D. Thesis, Ecole Centrale de Nantes (ECN), Nantes, France, 2013. [Google Scholar]
  30. Walia, D.; Schunemann, P.; Kuhl, M.; Adam, F.; Hartmann, H.; Großmann, J.; Ritschel, U. Prestressed Ultra High Performance Concrete Members for a TLP Substructure for Floating Wind Turbines. In Proceedings of the 27th International Ocean and Polar Engineering Conference, San Francisco, CA, USA, 25–30 June 2017; p. 8. [Google Scholar]
  31. Berlander, M. Accuracy and Resolution of a Motion Capture System. 2012. Available online: https://www.qualisys.com/cameras/arqus/ (accessed on 13 June 2021).
  32. Zhou, H.; Hu, H. Human Motion Tracking for Rehabilitation—A Survey. Biomed. Signal Process. Control 2008, 3, 1–18. [Google Scholar] [CrossRef]
  33. Vox, J.P.; Wallhoff, F. Evaluation of Motion Tracking Methods for Therapeutic Assistance in Everyday Living Environments. In Proceedings of the 2016 IEEE International Conference on Multisensor Fusion and Integration for Intelligent Systems (MFI), Baden-Baden, Germany, 19–21 September 2016; pp. 96–101. [Google Scholar] [CrossRef]
  34. Vito, L.; Postolache, O.; Rapuano, S. Measurements and Sensors for Motion Tracking in Motor Rehabilitation. IEEE Instrum. Meas. Mag. 2014, 17, 30–38. [Google Scholar] [CrossRef]
  35. U9C Force Transducer-Documentation; Technical Documentation; HBM - Hottinger Brüel & Kjaer GmbH. Available online: https://www.hbm.com/en/3926/u9c-miniature-force-sensor-for-tensile-and-compressive-forces/ (accessed on 13 June 2021).
  36. Github: OpenFAST. OpenFAST Software on Github, NREL. Available online: https://github.com/OpenFAST/openfast (accessed on 13 June 2021).
  37. OpenFAST Documentation — OpenFAST v2.6.0 documentation. Available online: https://openfast.readthedocs.io/en/main/ (accessed on 13 June 2021).
  38. Oumeraci, H. Belastung von Bauwerken durch Seegang-Teil 1: Umströmte Bauwerke; Leichtweiß-Institute for Hydraulic Engineering and Water Resources, Technische Universität Braunschweig: Braunschweig, Germany, 2013. [Google Scholar]
  39. Jonkman, J.; Robertson, A.; Hayman, G. HydroDyn Users Guide and Theory Manual; Technical Report NA; National Renewable Energy Laboratory: Golden, CO, USA, 2009.
  40. DNV-RP-C205: Environmental Conditions and Environmental Loads; DNVGL: Bærum, Norway, 2017; Available online: https://home.hvl.no/ansatte/tct/FTP/H2020%20Marinteknisk%20Analyse/Regelverk%20og%20standarder/DnV_documents/RP-C205.pdf (accessed on 13 June 2021).
  41. Clauss, G.; Lehmann, E.; Östergaard, C. Offshore Structures—Volume 1: Conceptual Design and Hydromechanics; Springer: Berlin, Germany, 1992. [Google Scholar]
  42. Jonkman, J. Definition of the Floating System for Phase IV of OC3; NREL-TP-500-47535; National Renewable Energy Lab. (NREL): Golden, CO, USA, 2010. [CrossRef] [Green Version]
  43. Standard Design-Minimum Requirements Concerning the Constructive Design of Offshore Structures within the Exclusive Economic Zone (EEZ); Technical Report; Bundesamt für Seeschifffahrt und Hydrographie BSH: Hamburg/Rostock, Germany, 2015; Available online: https://www.bsh.de/DE/PUBLIKATIONEN/_Anlagen/Downloads/Offshore/Standards/Standard-Design_en.pdf?__blob=publicationFile&v=7 (accessed on 13 June 2021).
Figure 1. Test Setup at ECN offshore basin.
Energies 14 03554 g001
Figure 2. Scaled (1:50) model of the GICON®-TLP.
Energies 14 03554 g002
Figure 3. Decay test setup for yaw NF in the ocean basin.
Energies 14 03554 g003
Figure 4. Decay test results for Heave and roll from the tank tests by examining the MSG signals.
Energies 14 03554 g004
Figure 5. Deflection for surge free decay test.
Energies 14 03554 g005
Figure 6. Deflection for sway free decay test.
Energies 14 03554 g006
Figure 7. Deflection for heave free decay test.
Energies 14 03554 g007
Figure 8. Deflection for roll free decay test.
Energies 14 03554 g008
Figure 9. Deflection for pitch free decay test.
Energies 14 03554 g009
Figure 10. Mooring Tension for pitch free decay test.
Energies 14 03554 g010
Figure 11. Deflection for yaw free decay test.
Energies 14 03554 g011
Table 1. Summary of the scaled turbine properties (calculated and measured).
Target Values (NREL)ImplementedDeviation [%]
Nacelle mass [kg]1.971.951
Nac. Mom. of inertia [kg × m 2 ] 8.554 × 10 3 8 × 10 3 6.9
Distance tower axis - Nac COG [mm]3839.43.6
Vert. distance Tower top - NAC COG [mm]35362.8
Inclination angle of the nacelle [ ]550
Hub height [mm]180018000
Hub diameter [mm]60600
Hub mass [g]47063526
Blade length [mm]123012300
Distance blade root-CM [mm]409.54100.2
Blade mass [g]145132/135/1369.8/7.4/6.6
Blade Nat Freq [Hz]4.73859.81262
Blade Nat. Freq (installed) [Hz]4.7387.335
Moment of Inertia [kg × m 2 ]0.039no value-
Horiz- Dist. Yaw-Axis-Rotor Apex [mm]10099.640.3
Table 2. K C number for surge, sway and yaw decay tests.
DOFAmplitudePeriod K C V-Tube K C B-Body
[m/s][s][-][-]
Surge0.419547.61906.65871.4269
Sway0.404946.94846.33641.3578
Yaw0.284541.15233.90260.8363
Table 3. Velocity for surge, sway and yaw decay tests.
DOFVelocityRe V-TubeRe B-Body
[m/s][-][-]
Surge0.4195 1.058 × 10 6 4.935 × 10 6
Sway0.4049 1.021 × 10 6 4.764 × 10 6
Yaw0.2845 7.172 × 10 5 3.347 × 10 6
Table 4. Additional linear damping matrix (AddBLin).
5 × 10 4 N m / s 00000
05 × 10 4 N m / s 0000
001 × 10 6 N m / s 000
0002 × 10 9 N m r a d / s 00
00002 × 10 9 N m r a d / s 0
000001 × 10 4 N m r a d / s
Table 5. Additional quadratic damping matrix (AddBQuad).
4.6 × 10 5 N m 2 / s 2 00000
04.6 ×10 5 N m 2 / s 2 0000
001 × 10 8 N m 2 / s 2 000
0006 × 10 11 N m r a d 2 / s 2 00
00006 × 10 11 N m r a d 2 / s 2 0
000001.3 × 10 10 N m r a d 2 / s 2
Table 6. Platform inertia properties and weight.
WeightCOGPtfmRInerPtfmPInerPtfmYIner
[kg][m][kg × m 2 ][kg × m 2 ][kg × m 2 ]
5.3125 × 10 6 −13.732.4556 × 10 9 2.4556 × 10 9 2.1010 × 10 9
Table 7. NF for the GICON®-TLP derived from tank tests as well as the respective damping ratio ζ and the NF for the numerical calculations.
TanktestNumericalNumerical vs Tanktest
Nat. Freq [Hz]St. Deviation [-]Damping Ratio ζ Nat. Freq [Hz]Deviation [%]
Surge0.02100.000280.0557540.02131.4
Sway0.02130.000070.0519060.02130.0
Heave0.97050.006710.0397041.02325.2
Roll0.38400.001360.0227650.36993.8
Pitch0.39410.002450.0213500.36567.8
Yaw0.02430.000200.0430110.02363.0
Publisher’s Note: MDPI stays neutral with regard to jurisdictional claims in published maps and institutional affiliations.

