1. Introduction
Concentrated photovoltaic (CPV) systems are designed to increase the sun concentration ratio for an ample electrical power output but require an adequate cooling mechanism [
1,
2]. Besides that, the involvement of expensive multi-junction solar cells (MJSCs) is necessary to limit the elevated operating temperature to 80 °C and allow higher power generation, resulting in diminishing the MJSC cost to the overall system cost [
1]. However, the MJSC cannot sustain a temperature of 110 °C without one form of pre-cooling or post-cooling mechanisms [
3]. Another approach to mitigate the thermal impact is through graphene coating for the front-grid metallisation of the MJSC. Although applying a graphene layer absorbs light, resulting in a reduction in the short circuit current, graphene’s excellent electrical conductivity enhances the fill factor (FF) and hence the power output [
4]. Indeed, the impact of temperature on the cost-effective single-junction solar cell is severe since its outdoor typical operating temperature is between 45 and 55 °C [
5,
6]. A high operating temperature due to >1 sun of concentration ratio induces thermal stress on the solar cell, resulting in rapid cracking of the solar cell due to the low thermal expansion coefficient of the semiconductors materials and high fragility. Under thermal stress operating conditions, metallisation can be affected by melting the electrical busbars, resulting in diffusing or forming alloys with the semiconductor materials. This impact leads to permanent damage caused by shunting of junction, increasing shunt resistance [
7]. Thus, the melting temperature point for both the soldering and electrical conductors must be higher than the operating temperature [
8].
Graphene, as a form of lineament two-dimensional (2D) carbon [
9,
10,
11] material, has astonished researchers with its superior thermomechanical properties, particularly with thermal conductivity of almost ~5000 W.m
−1K
−1 and a negative thermal expansion coefficient, i.e., the graphene allotrope contracts as the temperature increases [
12,
13]. These rare properties make graphene an excellent material for nanoelectromechanical systems (NEMS) [
4]. Ye et al. [
14] fabricated a graphene resonator and examined their electrothermal performance at a high-temperature operation up to 927 °C. Considering the stability of graphene with a chemical vapour deposition (CVD) synthesis temperature of regularly less than 900 °C, the researchers found that graphene can work at a higher temperature with excellent stability. The thermal stability of graphene is associated with its layers. It was conveyed that graphene’s thermal stability strongly correlated with the interlayer interaction in atmospheric conditions. Two or more graphene layers show higher thermal stability than just one. Nan et al. [
15] investigated the thermal stability of graphene in atmospheric conditions utilising Raman spectroscopy for two synthesising methods: microchemical cleavage (MC) and chemical vapour deposition. Their study attempted to observe the structural alterations in graphene under high temperature. The two synthesising methods showed that a single graphene layer starts to exhibit defects at a temperature of around 500 °C. In contrast, two graphene layers are stable up to 600 °C, and graphene remains intact beyond 700 °C. It is clear that multiple factors play a positive role in revealing how high temperature is related to thermal stability, such as annealing time, vacuum and monitored atmospheric conditions, and synthesising and characterisation approaches. However, further investigations are still required. Although the inert atmosphere was controlled to test graphene thermal stability with diverse heat treatment temperature, the results showed that a temperature above 800 °C would damage the graphene even with a controlled atmosphere and conditions [
16]. Other studies investigated replacing the expensive indium–tin–oxide (ITO) with graphene in an optically transparent and flexible metallic electrode. It was identified that graphene is stable with standard test conditions (STC) and high temperature up to 600 °C and relative humidity of 100% [
17].
Our previous study attempted to improve a CPV module efficiency utilising a single-junction (polycrystalline Si) solar cell by introducing a graphene layer for heat control [
18]. The solution incorporated neutral density (ND) filters as a subsequent optical stage to the concentrator to improve thermal performance as a pre-illumination cooling technique. Various samples of filters were characterised chemically, optically, thermally, and electrically. The results showed that graphene as an ND filter is a suitable approach to attenuate the intensity of concentrated solar irradiance as a trade-off with the graphene thickness allowing control over the operating temperature without the need for any cooling mechanism arrangements.
This work presents an extension of our previous report regarding their thermal analysis [
18] and a corresponding interpretation on the focal spot and graphene-coated ND (GCND) filter. The impact of graphene orientation, whether normal to the solar cell area or the Fresnel lens area, is discussed, considering its effects on the single-junction (polycrystalline Si) solar cell efficiency. Additionally, defects and suggestions are addressed to enhance the ND filter’s durability.
2. Materials and Methodology
The GC was developed by the screen-printing method, and the detailed fabrication process has been mentioned in our earlier work [
18]. Therefore, we adopted similar GC samples for this study. GC samples of 2.2 µm (thin coating), 6.3 µm (medium coating), and 9.1 µm (thick coating) were thermally analysed. Hence, the GC samples consisting of different thicknesses are denoted as GC
2.2, GC
6.3, and GC
9.1 µm for thin, medium, and thick coating samples, respectively, throughout the manuscript.
The scanning electron microscopy (SEM) images of the GC samples were analysed on a TESCAN VEGA3 SEM. The prototype chamber temperature profile was measured under 1000 W.m−2 (1 SUN 1.5 AM) of light from a WACOM AAA + continuous solar simulator (model WXS-210S-20). Temperature recording was performed using the thermocouple meter (Datalogger SDL200-EXTECH INSTRUMENTS). The GC samples were optically characterised to correlate the GC thickness to transmittance using a PerkinElmer LAMBDA 1050 + UV/Vis/NIR spectrophotometer.
A refractive optical concentrator silicon-on-glass (SOG) Fresnel Lens of 23 cm × 23 cm surface area was used to concentrate solar irradiance, an optical length and focal spot of 42 cm and 2.8 cm, respectively. In addition, a polycrystalline Si solar cell of 26 cm
2 surface area was placed in the focal spot region and shaded by the GC samples to overcome any simultaneous optical and thermal (optothermal) stresses. The used polycrystalline Si solar cell has a manufacturing cell efficiency of 17% [
19].
Figure 1a,b represents the scanning electron microscopy (SEM) microstructural cross-sectional and surface images of the GC sample consisting thickness of 6.3 µm, respectively. The images show that the coating was homogeneous and well distributed throughout the glass surface.
3. Results and Discussion
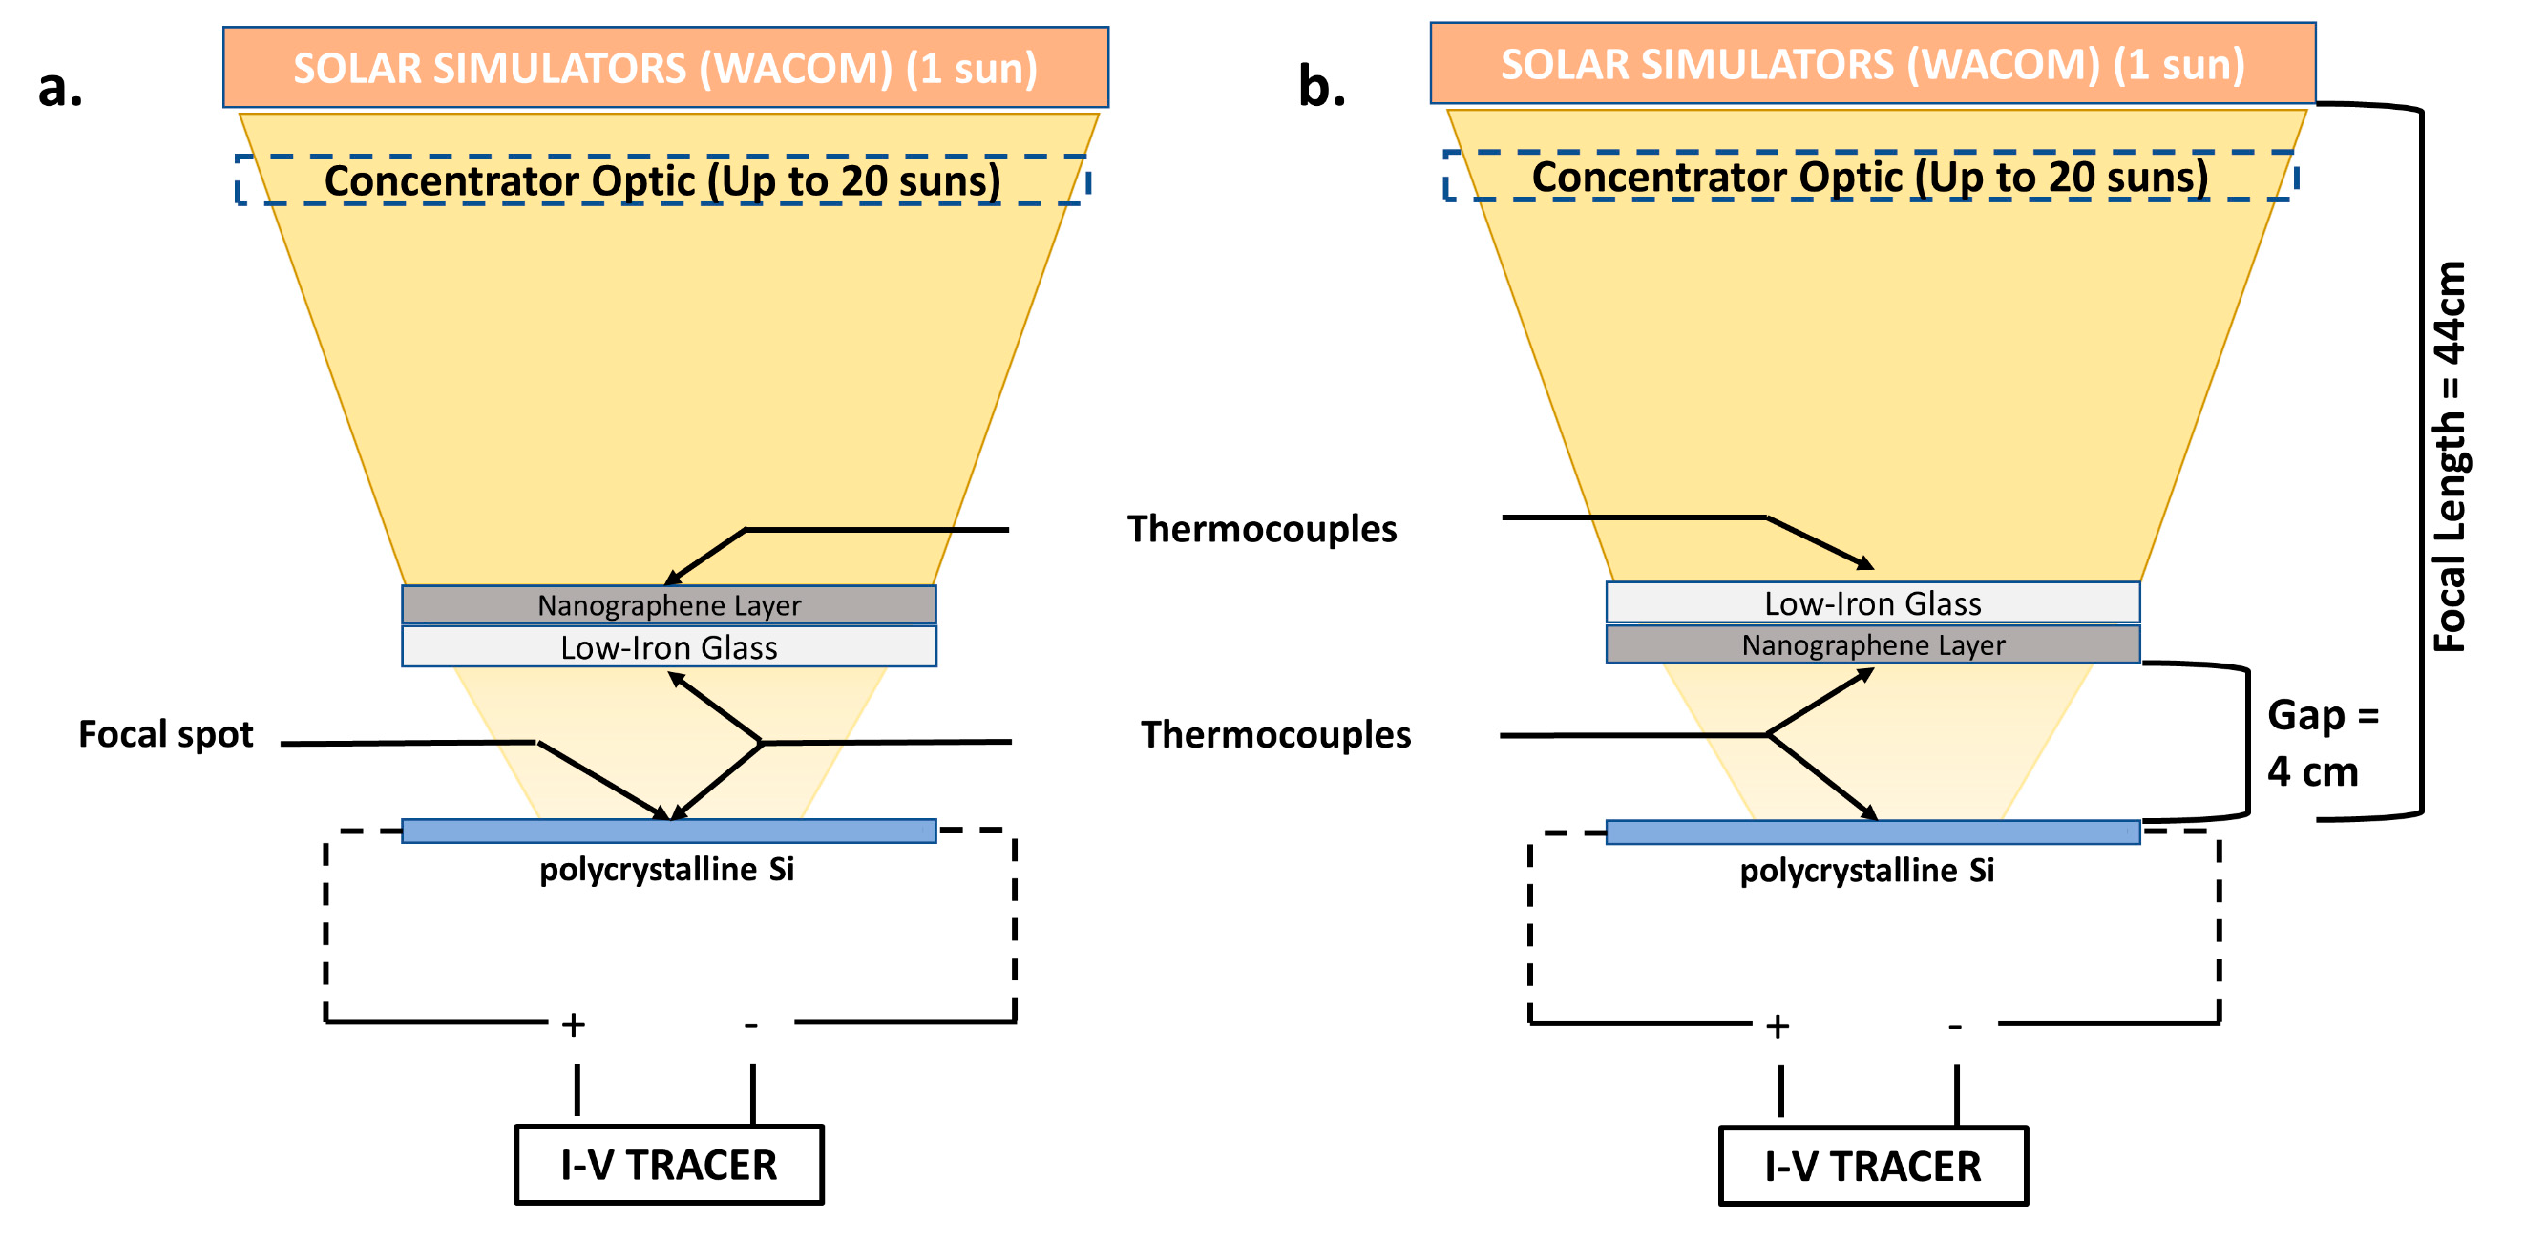
The experimental approach and set-up for this study are the same as reported in our previous work [
18]. A further schematic is given in this study to illustrate the overall experimental set-up configuration highlighting the graphene layer orientation. It faces the source of solar irradiance and the solar cell, as in
Figure 2a,b, respectively.
The temperature was logged for the three developed graphene samples, GC
9.3, GC
6.3, and GC
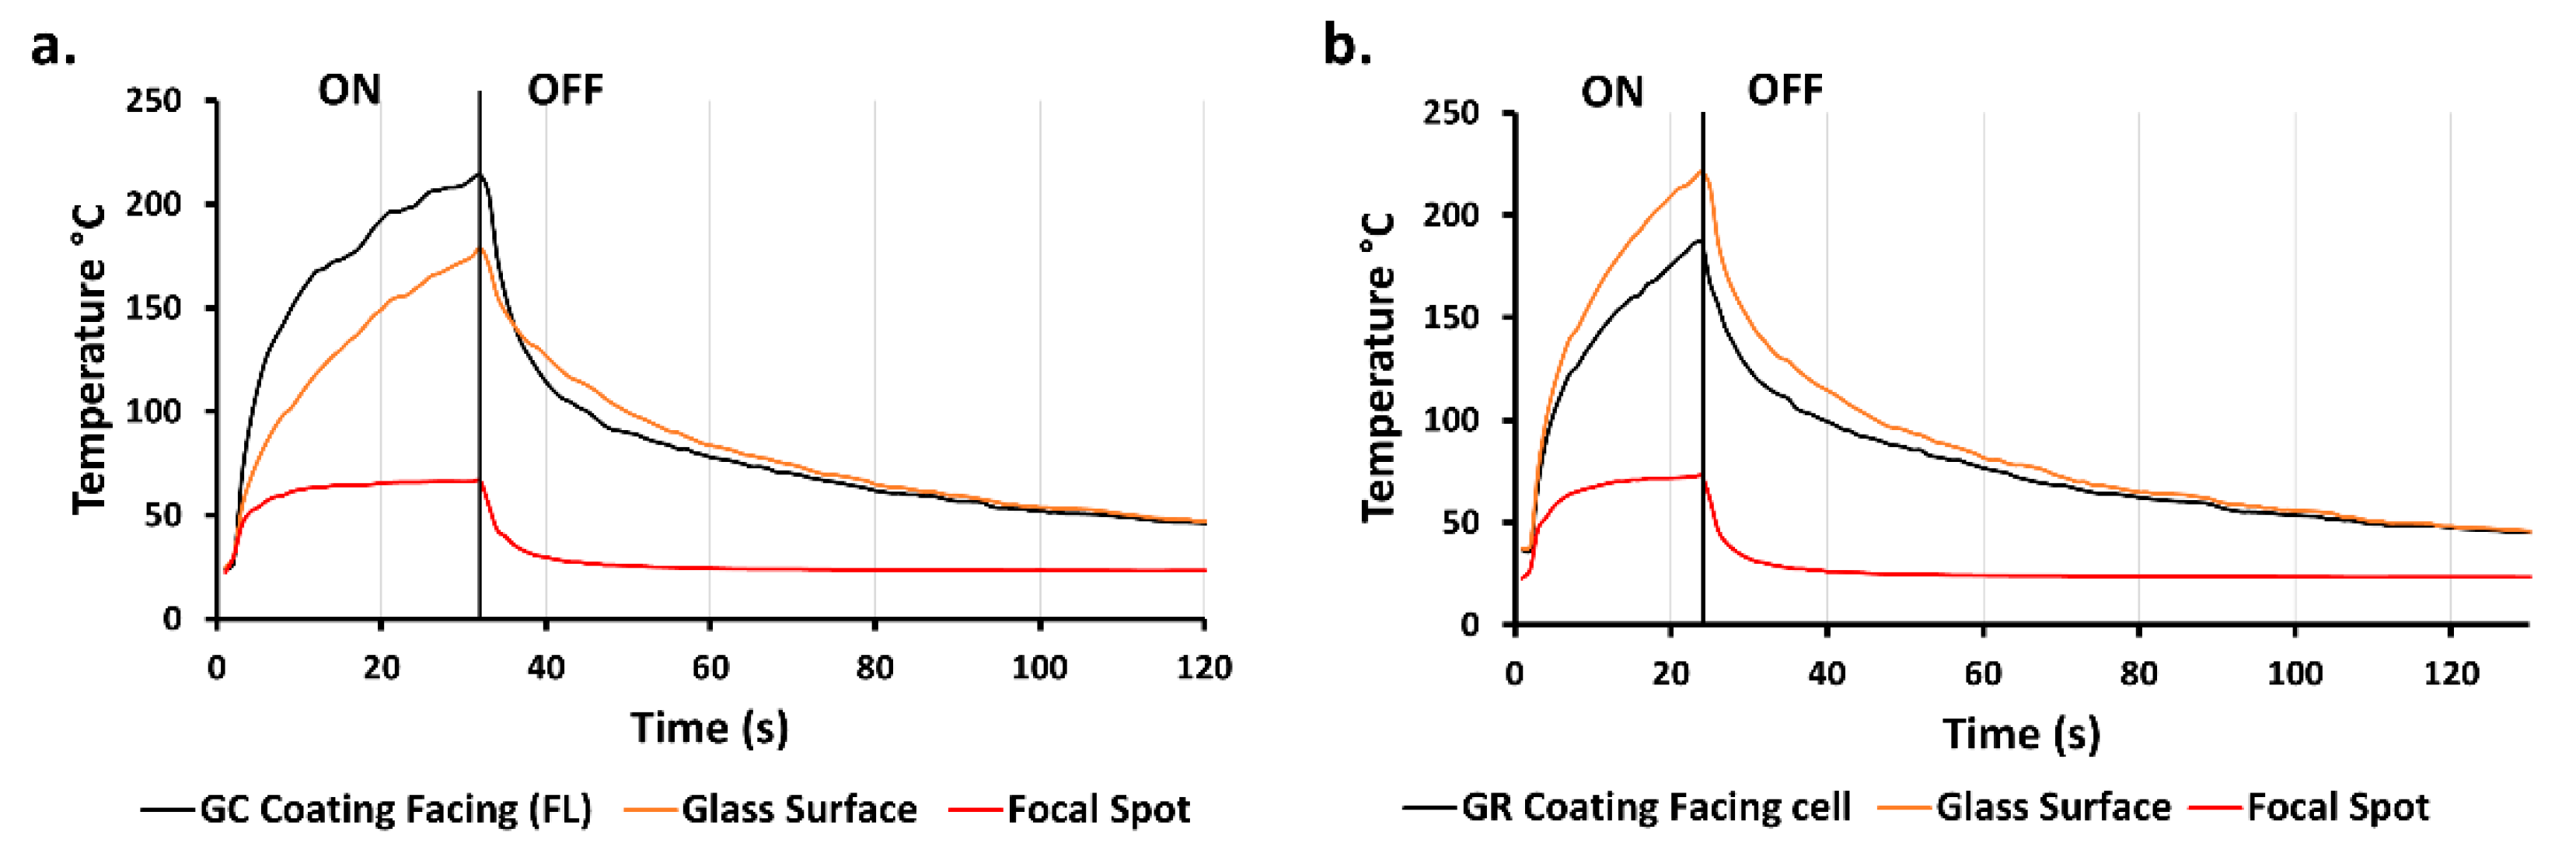
2.2, and in three various positions to observe the heat-absorbing behaviour of graphene and to identify the level of temperature on the consecutive stages. First, we concentrated the light until the focal spot temperature showed a maintained temperature level within a short period to avoid the thermal stress effect. Then, we switched off the source of solar irradiance. The results showed that the temperature peaked significantly on the graphene surface and glass surface, sustained on the focal spot area. The GC
9.3 demonstrated that the glass surface temperature was affected by the orientation of the GC surface. The temperature on the GC surface was found to be less than on the surface glass for the GC facing the source of the solar irradiance by 50%, as shown in
Figure 3a. In contrast, the temperature on the GC surface was found to be less than the surface glass for the GC facing the solar cell by 7%, as in
Figure 3b.
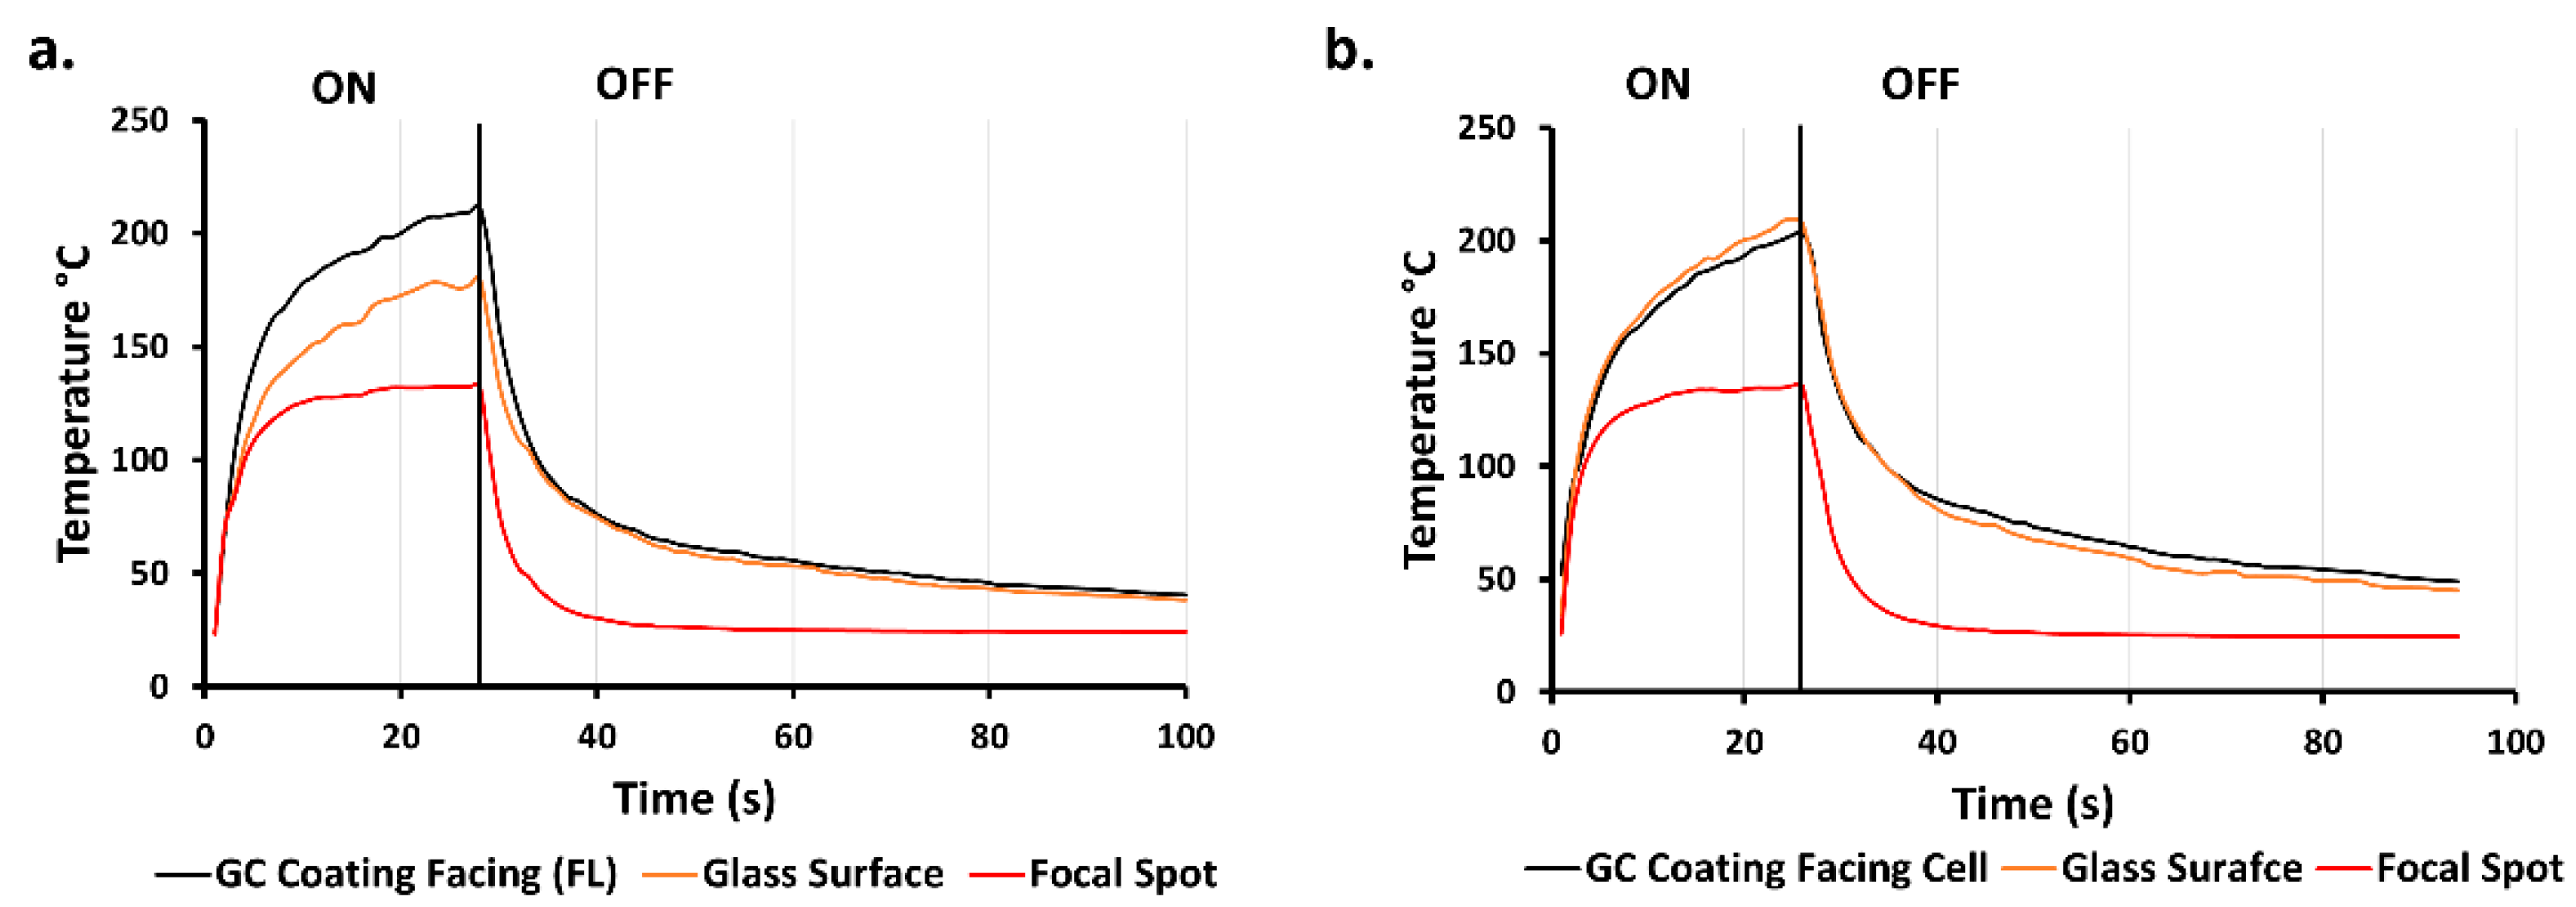
The GC
6.3 showed a lower discrepancy in temperature than the GC
9.3, which is due to the thickness of graphene. As a result, the temperature on the GC surface was lower than on the surface glass for the GC facing the source of the solar irradiance by 17%, as in
Figure 4a. In contrast, the temperature on the GC surface was lower than the surface glass for the GC facing the solar cell by 15%, as in
Figure 4b.
The GC
2.2 demonstrated a relatively low-temperature difference, in contrast to GC
6.3. The temperature on the GC surface was higher than the surface glass for the GC facing the source of the solar irradiance by 15%, as in
Figure 5a. In contrast, the temperature on the GC surface was lower than the surface glass for the GC facing the solar cell by only 2.2%, as in
Figure 5b.
The results showed a lower thermal reduction of the GC facing the solar cell than the GC facing the light source. This is due to the accumulation of heat on GC up to a level after which the GC begins to transfer heat through the medium (air) in the form of radiation. In addition, the small gap between the GC and the focal spot causes the temperature to build up in the focal spot region. This is the reason for less heat reduction of the GC facing the solar cell. This thermal effect contributes to the polycrystalline Si solar cell efficiency.
The graphene showed excellent thermal stability in the focal spot by blocking accumulated heat and concentrated solar irradiance. For a longer time, keeping the light on led to further thermal stability in the focal spot region; however, the graphene-coated surface temperature reached an extreme level. This is discussed in the subsequent section. The GC orientation indicated a minimal temperature gradient across the coated glass sample due to unusual reversible directional thermal behaviour [
20]. The GC surface for all samples showed an excellent heat absorption capacity and took a relatively long time to release heat and return to the room temperature status.
Although the single-junction (polycrystalline Si) cell efficiency for samples facing the solar irradiance source was represented in [
18], the comparison for the cell efficiency according to the graphene orientation is needed to prove the optimum performance.
Figure 6 shows the cell efficiency as a function of the measured solar cell power output to the effective solar irradiance on the solar cell area. The cell efficiency for the GC
9.3 was the highest. This is because the solar cell was subjected to the lowest concentrated solar irradiance and hence heat, in comparison to the samples, as its transmissivity was only 2%, representing the lowest power output of 0.25 W and 0.18 W for GC facing the source of the solar irradiance and GC facing the solar cell, respectively. The difference in cell efficiency for GC
9.3 between GC facing the solar irradiance and the GC source facing the solar cell was 26.4%. GC
6.3 and GC
2.2 demonstrated 6.6% and 4.9% efficiency for the GC facing the solar irradiance source and 5.9% and 4% for the GC facing the solar cell. The GC orientation, either facing the solar cell or the solar irradiance source, resulted in a solar cell efficiency discrepancy of 11% and 17% for GC
6.3 and GC
2.2.
Many low-iron glass samples were coated with different graphene thicknesses to enable this experiment to observe the thermal performance limitation and potential. Some of those samples were kept under a concentrated light for a longer time, and unfortunately, most of those samples were cracked at a certain point.
Figure 7a shows a photograph of the thick coating sample that suffered extreme thermal stress resulting in cracking. Within 30 s, the temperature of the coated surface kept rising, reaching 285.6 °C, which was higher than the temperature of the glass sample with no coatings by 66.6 °C. The temperature consistency is noticeable, considering that the focal spot temperature remained constant at only 23.9 °C, as
Figure 7b.
Figure 8 shows a medium coating sample. The glass breakage here was significant, and the size of the pieces was small, as in
Figure 8a. Within 118 s, the coated surface temperature kept increasing until it reached 338.1 °C, which was higher than the glass sample with no coating, by 119.1 °C. The temperature in the focal spot region remained constant at 50.4 °C, as in
Figure 8b.
Figure 9a shows another medium coating sample facing the solar cell in which others were remained facing the source of solar irradiance. Within 24 s, the temperature of the coated surface increased to reach only 213.7 °C, and this sample broke quicker than expected. The temperature in the focal spot region remained constant at 51.8 °C. The maximum achieved temperature without the GC was 219 °C, and this sample exhibited a low cracking point temperature of about 5.3 °C, as in
Figure 9b.
The low-iron glass’s uniform arrangements and lower impurity, in comparison to the standard glass, provide a transmissivity of more than 91.5%, in addition to its cost affordability. However, the low-iron glass is unstable under thermal stress since it is tempered glass. All the tested samples under a long period of concentrated solar irradiance exposure have shown instability in the low-iron glass-cracking pattern, especially when coated with graphene. Low-iron glass is not an ideal candidate for concentrated solar irradiance-high temperature applications as it can only tolerate a constant temperature of up to ≈250 °C [
21,
22]. Still, the low-iron glass is an excellent selection as a safety glass. It mitigates the chances of health and safety issues through fracturing in small pieces below 250 °C. The low-iron glass, classified as tempered glass, is strengthened through thermal or chemical treatment, causing the low-iron glass to shatter into relatively small fragments under high temperature instead of a large, sharp-angle [
19] cracking pattern
Figure 8. The temperature and accumulated heat on the GC surface caused an extreme thermal shock on the low-iron glass. The graphene’s remarkable thermal properties have a significant thermal impact on the glass.
The GC coating significantly reduces the focal spot temperature, which facilitates the polycrystalline Si solar cell performance and avoids thermal stress because of the concentrated light and heat in the focal spot using an optical concentrator. The GC coating absorbs heat proportionally to the GC thickness. This absorption stage collects heat up to a certain point at which severe thermal stress causes breakage for the substrate. Therefore, the optothermal properties of the used substrate (low-iron glass) cannot cope with the optothermal properties of graphene materials. Nevertheless, the vulnerability of the substrate did not hinder the excellent performance of the polycrystalline Si solar cell, where it was found that the cell efficiency increased by about 12% at a concentration ratio of 8 suns, in comparison to the sample with no GC [
18]. The GC sample protected the solar cell from cracking and also increased the cell efficiency.
Ceramic glass should be used to avoid a range of glass cracking patterns as it has excellent thermal performance for temperatures up to 983 °C [
23]. Ceramic glass is made of polycrystalline transparent material. It does not shatter under high temperatures and can tolerate rapid temperature changes. This type of glass was initially produced to be integrated into the mirror mounts of astronomical telescopes [
24], and it is used domestically on cooker hobs. The ceramic glass is also compatible with graphene materials. Both have a strong negative thermal expansion coefficient [
13,
25], can attain a transparency level comparable to low-iron glass, and have the potential for further improvement [
26,
27]. Graphene has a superior thermal capacity and thermal conductivity, allowing a higher temperature to accumulate on the glass surface beyond low-iron glass’s safe operating temperature limits. Consequently, being a highly thermally conductive material, graphene films can be projected as a viable economic option for efficient heat dissipation materials suitable for mass production.


