
Techno-Economic Aspects of Noble Gases as Monitoring Tracers


Abstract
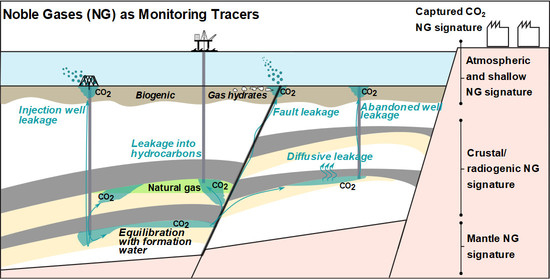
1. Introduction
2. Materials and Methods
2.1. Background Concentrations
2.2. Phase Partitioning
2.3. Distinctiveness
3. Results
3.1. Equilibration with Formation Water
3.2. Tracer Addition
4. Discussion
4.1. Inherent Distinctiveness
4.2. Limitations of the Method
4.2.1. Calculation Method
4.2.2. Leakage Scenarios
4.2.3. Mixing Calculations
4.3. Tracer Addition
4.4. Technical Aspects of Tracer Addition
4.5. Noble Gases in Monitoring Schemes
5. Conclusions
Author Contributions
Funding
Data Availability Statement
Acknowledgments
Conflicts of Interest
References
- IEAGHG. Monitoring and Modelling of CO2 Storage: The Potential for Improving the Cost-Benefit Ratio of Reducing Risk, 2020-01. Available online: https://climit.no/wp-content/uploads/sites/4/2020/05/2020-01-Monitoring-and-Modelling-of-CO2-Storage.pdf (accessed on 2 April 2021).
- Ringrose, P. How to Store CO2 Underground: Insights from Early-Mover CCS Projects; Springer Nature Switzerland AG: Cham, Switzerland, 2020. [Google Scholar]
- Hongo, T. Carbon Pricing to Promote Green Energy Projects. In Handbook of Green Finance; Springer: Singapore, 2019; pp. 157–181. [Google Scholar] [CrossRef]
- Myers, M.; Stalker, L.; Pejcic, B.; Ross, A. Tracers—Past, present and future applications in CO2 geosequestration. Appl. Geochem. 2013, 30, 125–135. [Google Scholar] [CrossRef]
- Holland, G.; Gilfillan, S. Application of Noble Gases to the Viability of CO2 Storage. In The Noble Gases as Geochemical Tracers; Springer: Berlin/Heidelberg, Germany, 2012; pp. 177–223. [Google Scholar] [CrossRef]
- Flude, S.; Johnson, G.; Gilfillan, S.M.V.; Haszeldine, R.S. Inherent Tracers for Carbon Capture and Storage in Sedimentary Formations: Composition and Applications. Environ. Sci. Technol. 2016, 50, 7939–7955. [Google Scholar] [CrossRef]
- Sano, Y.; Marty, B.; Burnard, P. Noble Gases in the Atmosphere. In Advances in Isotope Geochemistry; Springer: Berlin/Heidelberg, Germany, 2013; pp. 17–31. [Google Scholar] [CrossRef]
- Ballentine, C.J.; Burnard, P.G. Production, Release and Transport of Noble Gases in the Continental Crust. Rev. Mineral. Geochem. 2002, 47, 481–538. [Google Scholar] [CrossRef]
- Moreira, M.A.; Kurz, M.D. Noble Gases as Tracers of Mantle Processes and Magmatic Degassing. In Advances in Isotope Geochemistry; Springer: Berlin/Heidelberg, Germany, 2013; pp. 371–391. [Google Scholar] [CrossRef]
- Burnard, P. (Ed.) The Noble Gases as Geochemical Tracers; Springer: Berlin/Heidelberg, Germany, 2013. [Google Scholar] [CrossRef]
- Flude, S.; Györe, D.; Stuart, F.; Zurakowska, M.; Boyce, A.; Haszeldine, R.; Chalaturnyk, R.; Gilfillan, S. The inherent tracer fingerprint of captured CO2. Int. J. Greenh. Gas Control 2017, 65, 40–54. [Google Scholar] [CrossRef]
- Weber, U.W.; Kipfer, R.; Horstmann, E.; Ringrose, P.; Kampman, N.; Tomonaga, Y.; Brennwald, M.S.; Sundal, A. Noble gas tracers in gas streams at Norwegian CO2 capture plants. Int. J. Greenh. Gas Control 2021, 106, 103238. [Google Scholar] [CrossRef]
- Weber, U.; Kampman, N.; Mikoviny, T.; Thomassen, J.; Sundal, A. Noble Gases as Monitoring Tracers in CCS: A Case Study with CO2 from the Waste-to-Energy Plant Klemetsrud, Norway. SSRN Electron. J. 2021. [Google Scholar] [CrossRef]
- Gilfillan, S.M.; Sherk, G.W.; Poreda, R.J.; Haszeldine, R.S. Using noble gas fingerprints at the Kerr Farm to assess CO2 leakage allegations linked to the Weyburn-Midale CO2 monitoring and storage project. Int. J. Greenh. Gas Control 2017, 63, 215–225. [Google Scholar] [CrossRef]
- Nimz, G.; Hudson, G. The Use of Noble Gas Isotopes for Monitoring Leakage of Geologically Stored CO2. In Carbon Dioxide Capture for Storage in Deep Geologic Formations—Results from the CO2 Storage Project, 0-08-044570-5; Elsevier: Oxford, UK, 2005; Volume 2. [Google Scholar]
- Györe, D.; Stuart, F.M.; Gilfillan, S.M.; Waldron, S. Tracing injected CO2 in the Cranfield enhanced oil recovery field (MS, USA) using He, Ne and Ar isotopes. Int. J. Greenh. Gas Control 2015, 42, 554–561. [Google Scholar] [CrossRef]
- Györe, D.; Gilfillan, S.M.; Stuart, F.M. Tracking the interaction between injected CO2 and reservoir fluids using noble gas isotopes in an analogue of large-scale carbon capture and storage. Appl. Geochem. 2017, 78, 116–128. [Google Scholar] [CrossRef]
- Roberts, J.J.; Gilfillan, S.M.; Stalker, L.; Naylor, M. Geochemical tracers for monitoring offshore CO2 stores. Int. J. Greenh. Gas Control 2017, 65, 218–234. [Google Scholar] [CrossRef]
- Ju, Y.; Lee, S.S.; Kaown, D.; Lee, K.K.; Gilfillan, S.M.; Hahm, D.; Park, K. Noble gas as a proxy to understand the evolutionary path of migrated CO2 in a shallow aquifer system. Appl. Geochem. 2020, 118, 104609. [Google Scholar] [CrossRef]
- Warr, O.; Rochelle, C.A.; Masters, A.; Ballentine, C.J. Determining noble gas partitioning within a CO2–H2O system at elevated temperatures and pressures. Geochim. Cosmochim. Acta 2015, 159, 112–125. [Google Scholar] [CrossRef]
- Prinzhofer, A. Noble Gases in Oil and Gas Accumulations. In The Noble Gases as Geochemical Tracers; Springer: Berlin/Heidelberg, Germany, 2013; pp. 225–247. [Google Scholar] [CrossRef]
- Chadwick, R.; Eiken, O. Offshore CO2 storage: Sleipner natural gas field beneath the North Sea. In Geological Storage of Carbon Dioxide CO2; Woodhead Publishing: Cambridge, UK, 2013; pp. 227–253. [Google Scholar] [CrossRef]
- Hansen, O.; Gilding, D.; Nazarian, B.; Osdal, B.; Ringrose, P.; Kristoffersen, J.B.; Eiken, O.; Hansen, H. Snøhvit: The History of Injecting and Storing 1 MtCO2 in the Fluvial Tubåen Fm. Energy Procedia 2013, 37, 3565–3573. [Google Scholar] [CrossRef]
- Halland, E.; Riis, F.; Mujezinović, J. (Eds.) CO2 Storage Atlas Norwegian Continental Shelf; Norwegian Petroleum Directorate: Stavanger, Norway, 2014. [Google Scholar]
- IEA Greenhouse Gas R&D Programme (IEA GHG). Remediation of Leakage form CO2 Storage Reservoirs, 2007/11; IEA Greenhouse R&D Programme: Stoke Orchard, UK, 2007. [Google Scholar]
- The Full-Scale CCS Project in Norway. Available online: www.ccsnorway.com (accessed on 9 April 2021).
- Furre, A.K.; Meneguolo, R.; Pinturier, L.; Bakke, K. Planning deep subsurface CO2 storage monitoring for the Norwegian full-scale CCS project. First Break 2020, 38, 55–60. [Google Scholar] [CrossRef]
- Barry, P.; Lawson, M.; Meurer, W.; Warr, O.; Mabry, J.; Byrne, D.; Ballentine, C. Noble gases solubility models of hydrocarbon charge mechanism in the Sleipner Vest gas field. Geochim. Cosmochim. Acta 2016, 194, 291–309. [Google Scholar] [CrossRef]
- Ballentine, C.; O’Nions, R.; Coleman, M. A Magnus opus: Helium, neon, and argon isotopes in a North Sea oilfield. Geochim. Cosmochim. Acta 1996, 60, 831–849. [Google Scholar] [CrossRef]
- Ballentine, C.J.; Schoell, M.; Coleman, D.; Cain, B.A. 300-Myr-old magmatic CO2 in natural gas reservoirs of the west Texas Permian basin. Nature 2001, 409, 327–331. [Google Scholar] [CrossRef] [PubMed]
- Gilfillan, S.M.; Ballentine, C.J.; Holland, G.; Blagburn, D.; Lollar, B.S.; Stevens, S.; Schoell, M.; Cassidy, M. The noble gas geochemistry of natural CO2 gas reservoirs from the Colorado Plateau and Rocky Mountain provinces, USA. Geochim. Cosmochim. Acta 2008, 72, 1174–1198. [Google Scholar] [CrossRef]
- Tomonaga, Y.; Brennwald, M.S.; Kipfer, R. Using helium and other noble gases in ocean sediments to characterize active methane seepage off the coast of New Zealand. Mar. Geol. 2013, 344, 34–40. [Google Scholar] [CrossRef]
- Nuzzo, M.; Tomonaga, Y.; Schmidt, M.; Valadares, V.; Faber, E.; Piñero, E.; Reitz, A.; Haeckel, M.; Tyroller, L.; Godinho, E.; et al. Formation and migration of hydrocarbons in deeply buried sediments of the Gulf of Cadiz convergent plate boundary—Insights from the hydrocarbon and helium isotope geochemistry of mud volcano fluids. Mar. Geol. 2019, 410, 56–69. [Google Scholar] [CrossRef]
- Winckler, G.; Aeschbach-Hertig, W.; Holocher, J.; Kipfer, R.; Levin, I.; Poss, C.; Rehder, G.; Suess, E.; Schlosser, P. Noble gases and radiocarbon in natural gas hydrates. Geophys. Res. Lett. 2002, 29, 63-1–63-4. [Google Scholar] [CrossRef]
- Sano, Y.; Takahata, N. Measurement of Noble Gas Solubility in Seawater Using a Quadrupole Mass Spectrometer. J. Oceanogr. 2005, 61, 465–473. [Google Scholar] [CrossRef]
- Horstad, I.; Larter, S.R. Petroleum Migration, Alteration, and Remigration Within Troll Field, Norwegian North Sea. AAPG Bulletin 1997, 81. [Google Scholar] [CrossRef]
- Horstmann, E.; Tomonaga, Y.; Brennwald, M.; Schmidt, M.; Liebetrau, V.; Kipfer, R. Noble gases in sediment pore water yield insights into hydrothermal fluid transport in the northern Guaymas Basin. Mar. Geol. 2021, 434, 106419. [Google Scholar] [CrossRef]
- Mazzini, A.; Svensen, H.; Planke, S.; Forsberg, C.; Tjelta, T. Pockmarks and methanogenic carbonates above the giant Troll gas field in the Norwegian North Sea. Mar. Geol. 2016, 373, 26–38. [Google Scholar] [CrossRef]
- Ballentine, C.J.; Burgess, R.; Marty, B. Tracing Fluid Origin, Transport and Interaction in the Crust. Rev. Mineral. Geochem. 2002, 47, 539–614. [Google Scholar] [CrossRef]
- Ouyang, L.B. New Correlations for Predicting the Density and Viscosity of Supercritical Carbon Dioxide Under Conditions Expected in Carbon Capture and Sequestration Operations. Open Pet. Eng. J. 2011, 5, 13–21. [Google Scholar] [CrossRef]
- NIST. Thermophysical Properties of Fluid Systems. Available online: https://webbook.nist.gov/chemistry/fluid/ (accessed on 2 November 2020).
- Burnside, N.; Naylor, M. Review and implications of relative permeability of CO2/brine systems and residual trapping of CO2. Int. J. Greenh. Gas Control 2014, 23, 1–11. [Google Scholar] [CrossRef]
- Miocic, J.M.; Gilfillan, S.M.V.; Frank, N.; Schroeder-Ritzrau, A.; Burnside, N.M.; Haszeldine, R.S. 420,000 year assessment of fault leakage rates shows geological carbon storage is secure. Sci. Rep. 2019, 9, 1–9. [Google Scholar] [CrossRef]
- Wilkinson, M.; Gilfillan, S.V.M.; Haszeldine, R.S.; Ballentine, C.J. Plumbing the depths: Testing natural tracers of subsurface CO2 origin and migration, Utah. Carbon Dioxide Sequestration Geol. Media—State Sci. AAPG Stud. Geol. 2009, 59, 619–634. [Google Scholar] [CrossRef]
- Weltje, G.J. End-member modeling of compositional data: Numerical-statistical algorithms for solving the explicit mixing problem. Math. Geol. 1997, 29, 503–549. [Google Scholar] [CrossRef]
- Carrigan, C.R.; Heinle, R.A.; Hudson, G.B.; Nitao, J.J.; Zucca, J.J. Trace gas emissions on geological faults as indicators of underground nuclear testing. Nature 1996, 382, 528–531. [Google Scholar] [CrossRef]
- Kilgallon, R.; Gilfillan, S.; Edlmann, K.; McDermott, C.; Naylor, M.; Haszeldine, R. Experimental determination of noble gases and SF6, as tracers of CO2 flow through porous sandstone. Chem. Geol. 2018, 480, 93–104. [Google Scholar] [CrossRef]
- Cho, A. Helium-3 Shortage Could Put Freeze On Low-Temperature Research. Science 2009, 326, 778–779. [Google Scholar] [CrossRef] [PubMed]
- IEA. Levelised Cost of CO2 Capture by Sector and Initial CO2 Concentration. 2019. Available online: https://www.iea.org/data-and-statistics/charts/levelised-cost-of-co2-capture-by-sector-and-initial-co2-concentration-2019 (accessed on 6 April 2021).
- Alcalde, J.; Flude, S.; Wilkinson, M.; Johnson, G.; Edlmann, K.; Bond, C.E.; Scott, V.; Gilfillan, S.M.V.; Ogaya, X.; Haszeldine, R.S. Estimating geological CO2 storage security to deliver on climate mitigation. Nat. Commun. 2018, 9. [Google Scholar] [CrossRef] [PubMed]
- Al-Siyabi, I. Effect of Impurities on CO2 Stream Properties. Ph.D. Thesis, Heriot-Watt University, Edinburgh, UK, 2013. [Google Scholar]
- Porter, R.T.; Fairweather, M.; Pourkashanian, M.; Woolley, R.M. The range and level of impurities in CO2 streams from different carbon capture sources. Int. J. Greenh. Gas Control 2015, 36, 161–174. [Google Scholar] [CrossRef]
- Brennwald, M.S.; Schmidt, M.; Oser, J.; Kipfer, R. A Portable and Autonomous Mass Spectrometric System for On-Site Environmental Gas Analysis. Environ. Sci. Technol. 2016, 50, 13455–13463. [Google Scholar] [CrossRef] [PubMed]
- Chatton, E.; Labasque, T.; de La Bernardie, J.; Guihéneuf, N.; Bour, O.; Aquilina, L. Field Continuous Measurement of Dissolved Gases with a CF-MIMS: Applications to the Physics and Biogeochemistry of Groundwater Flow. Environ. Sci. Technol. 2016, 51, 846–854. [Google Scholar] [CrossRef] [PubMed]
- Falcone, P.M. Environmental regulation and green investments: The role of green finance. Int. J. Green Econ. 2020, 14, 159. [Google Scholar] [CrossRef]


| He | Ne | Ar | Kr | Xe | |
|---|---|---|---|---|---|
| Natural Gas/Oil | 1.2E-05–1.3E-04 | 7.0E-07–2.7E-08 | 1.1E-05–4.1E-05 | 4.1E-09–5.2E-09 | 1.3E-09–1.6E-09 |
| Natural, geologic | 1.0E-04–1.0E-02 | 7.0E-08–1.8E-06 | 1.5E-05–2.7E-05 | 1.0E-10–1.0E-08 | 5.0E-12 |
| Gas Hydrates | 7.0E-10–9.0E-10 | 2.5E-09–6.2E-08 | 3.5E-05–5.3E-04 | 1.8E-08–3.0E-07 | 2.7E-09–9.4E-08 |
| Seafloor Sediments () | 1.0E-04–1.0E-02 | 5.0E-09–5.0E-07 | 1.0E-05–1.0E-08 | 5.0E-08–1.5E-09 | 8.0E-09–1.7E-08 |
| Seawater () | 4.0E-08 | 5.7E-09 | 1.1E-06 | 8.5E-08 | 1.1E-08 |
| Atmosphere | 5.24E-06 | 1.82E-05 | 9.34E-03 | 1.13E-06 | 8.7E-08 |
| Captured | 2.3E-09–2.9E-06 | 5.9E-11–4.3E-07 | 3.7E-10–1.4E-04 | 3.6E-12–6.3E-09 | 1.1E-13–1.9E-09 |
| (R/) | Xe/Xe | ||||
|---|---|---|---|---|---|
| Atmospheric Signature | 1 | 0.029 | 296 | 0.303 | 6.61 |
| Crustal signature | ∼0.1 | ∼0.033 | ∼455 | ∼0.303 | ∼6.61 |
| Mantle signature (MORB) | 8 | 0.06 | ∼30,000 | - | - |
| Analytical | Variability | rel. | rel. | rel. | |||
|---|---|---|---|---|---|---|---|
| Low Captured | High Captured | Uncertainty | in Natural | to Average | to Atmosphere | to Hydrates | |
| Values | Values | Gas | Natural Gas | ||||
| He | 3.90E-05 | 3.92E-05 | 2% | 8% | 62–63% | 744–749% | 4,900,000% |
| 3.90E-05 | 3.92E-05 | 2% | 8% | 62–63% | 744–749% | - | |
| 5.86E-12 | 6.49E-12 | 3% | 35% | 62–68% | 80–88% | - | |
| / | 1.50E-07 | 1.65E-07 | 3% | 13% | 104–115% | 11–12% | - |
| Ar | 5.22E-05 | 7.09E-05 | 2% | 30% | 166–225% | 1% | 52–71% |
| 1.13E-07 | 1.75E-07 | 1% | 45% | 166–258% | 1% | - | |
| 5.21E-05 | 7.07E-05 | 2% | 30% | 166–225% | 1% | - | |
| / | 4.63E+02 | 4.05E+02 | 1% | 5% | 99–87% | 156–137% | - |
| Kr | 1.06E-08 | 1.16E-08 | 2% | 18% | 239–262% | 1% | 13–14% |
| 8.12E-09 | 8.89E-09 | 2% | 18% | 239–261% | 1% | - | |
| 2.46E-09 | 2.69E-09 | 1% | 17% | 239–262% | 1% | - | |
| / | 3.03E-01 | 3.03E-01 | 1% | 1% | 100% | 99% | - |
| Xe | 6.36E-09 | 6.67E-09 | 5% | 10% | 458–480% | 7–8% | 13% |
| 6.37E-12 | 7.46E-12 | 3% | 8% | 458–536% | 8–9% | - | |
| 5.66E-12 | 6.67E-12 | 3% | 11% | 458–540% | 7–9% | - | |
| 1.16E-10 | 1.38E-10 | 3% | 17% | 458–544% | 7–8% | - | |
| 1.68E-09 | 1.98E-09 | 3% | 11% | 458–540% | 7–9% | - | |
| 2.56E-10 | 3.03E-10 | 3% | 12% | 458–541% | 7–9% | - | |
| 1.36E-09 | 1.60E-09 | 3% | 10% | 458–539% | 7–9% | - | |
| 1.71E-09 | 2.02E-09 | 3% | 9% | 458–540% | 7–9% | - | |
| 6.63E-10 | 7.82E-10 | 3% | 11% | 458–540% | 7–9% | - | |
| 5.64E-10 | 6.65E-10 | 3% | 11% | 458–540% | 7–9% | - | |
| / | 2.49E-02 | 2.46E-02 | 5% | 9% | 101–100% | 106–105% | - |
| / | 2.21E-02 | 2.20E-02 | 5% | 3% | 101% | 101–101% | - |
| / | 4.52E-01 | 4.55E-01 | 5% | 5% | 101–102% | 96–96% | - |
| / | 6.55E+00 | 6.54E+00 | 5% | 1% | 101% | 101% | - |
| / | 5.31E+00 | 5.30E+00 | 5% | 2% | 101% | 102% | - |
| / | 6.68E+00 | 6.67E+00 | 5% | 1% | 101% | 101% | - |
| / | 2.59E+00 | 2.58E+00 | 5% | 1% | 101% | 101% | - |
| / | 2.20E+00 | 2.20E+00 | 5% | 1% | 101% | 101% | - |
| Nec. Conc./ | Nec. Conc. | Nec. Volume | Gas Price | Cost | Cost; Method | Gas Price | |
|---|---|---|---|---|---|---|---|
| Ratio in | in Injected | in a 1Mt/a | ($US/l) | ($US/t) | as in [18] | Source | |
| Equilibrated | Project (l/a) | ($US/t) | |||||
| He | 1.53E-04 | 1.26E-03 | 6.43E+08 | 57.2 | 37,000 | 18,000 | [18] |
| 3.02E-11 | 2.72E-10 | 1.39E+02 | 3800 | 0.69 | 750 | [18] | |
| / | 7.72E-07 | 2.74E-10 | 1.40E+02 | 3800 | 0.69 | 0.07 | [18] |
| Ar | 1.43E-04 | 7.60E-04 | 3.88E+08 | 64.38 | 32,000 | 13,400 | [18] |
| 3.91E-07 | 2.09E-06 | 1.07E+06 | 1000 | 1066 | 450 | Shell | |
| / | 3.79E-03 | 1.17E-06 | 5.97E+05 | 1000 | 597 | 23 | Shell |
| Kr | 1.50E-08 | 3.60E-08 | 1.84E+04 | 107 | 2.55 | 3.16 | [18] |
| 3.14E-09 | 5.55E-09 | 2.83E+03 | 1490 | 5.48 | 10.16 | [18] | |
| / | 4.25E-01 | 1.08E-08 | 5.51E+03 | 1490 | 10.67 | 0.01 | [18] |
| Xe | 4.89E-09 | Condition met inherently | 340 | - | 3.13 | [18] | |
| / | 8.48E-02 | 9.70E-11 | 4.95E+01 | 28,554 | 1.84 | 0.00026 | [18] |
| / | 6.21E-02 | 6.48E-11 | 3.31E+01 | 17,600 | 0.76 | 0.00014 | [18] |
| / | 1.35E+00 | 1.45E-09 | 7.40E+02 | - | - | - | |
| / | 1.63E+01 | 1.58E-08 | 8.06E+03 | 330 | 2.66 | 0.0062 | Shell |
| / | 1.44E+01 | 1.48E-09 | 7.55E+02 | 1650 | 1.25 | 0.0025 | Shell |
| / | 1.66E+01 | 1.60E-08 | 8.16E+03 | 2200 | 17.96 | 638 | Shell |
| / | 6.50E+00 | 6.33E-09 | 3.23E+03 | 4585 | 19.25 | 0.0044 | [18] |
| / | 5.55E+00 | 5.43E-09 | 2.77E+03 | 2200 | 6.09 | 0.0014 | Shell |
Publisher’s Note: MDPI stays neutral with regard to jurisdictional claims in published maps and institutional affiliations. |
© 2021 by the authors. Licensee MDPI, Basel, Switzerland. This article is an open access article distributed under the terms and conditions of the Creative Commons Attribution (CC BY) license (https://creativecommons.org/licenses/by/4.0/).
Share and Cite
Weber, U.W.; Kampman, N.; Sundal, A. Techno-Economic Aspects of Noble Gases as Monitoring Tracers. Energies 2021, 14, 3433. https://doi.org/10.3390/en14123433
Weber UW, Kampman N, Sundal A. Techno-Economic Aspects of Noble Gases as Monitoring Tracers. Energies. 2021; 14(12):3433. https://doi.org/10.3390/en14123433
Chicago/Turabian StyleWeber, Ulrich Wolfgang, Niko Kampman, and Anja Sundal. 2021. "Techno-Economic Aspects of Noble Gases as Monitoring Tracers" Energies 14, no. 12: 3433. https://doi.org/10.3390/en14123433
APA StyleWeber, U. W., Kampman, N., & Sundal, A. (2021). Techno-Economic Aspects of Noble Gases as Monitoring Tracers. Energies, 14(12), 3433. https://doi.org/10.3390/en14123433