1. Introduction
We use recent advances in macroeconometrics and financial econometrics to investigate the macroeconomic effects of oil price shocks and oil price uncertainty. In doing so, they appeal to the real options theory (also known as investment under uncertainty), which predicts that firms are likely to delay making irreversible investment decisions in the face of uncertainty about the price of oil, particularly when the cash flow from investments is contingent on the oil price.
In particular, we investigate the effects of oil price uncertainty on total factor productivity growth, and in doing so, we control for two different channels for TFP growth—benefits from the quality of the national innovation system and from adopting new technologies. We use an unbalanced panel for 28 European Union countries over the period from 1990 to 2018. Consistent with the earlier literature, we find that oil price uncertainty has a negative and statistically significant effect on TFP growth even after we control for technological advancements and the effects of globalization.
According to the Solow growth model [
1], the aggregate value added (or GDP) growth can be decomposed into contributions from the aggregate capital input,
K, aggregate labour input,
L, and aggregate total factor productivity, TFP, as follows:
where
is the output elasticity of capital and
is the output elasticity of labour. Under the assumption of constant return to scale
, TFP driven by factors, such as technological progress, that are not tied to explicit input usage. In theory, TFP growth captures technical change and overall efficiency.
We consider two separate channels of technological change: benefits from the National Innovation System and benefits from adopting new technologies. Even within the European Union (EU), there are countries with full-cycle national innovation systems and countries who mainly adopt rather than invent modern technologies. The former countries are referred to as “innovation leaders” and the latter as “innovation followers”, using (here) the Innovation Union Scoreboard terminology in a slightly different manner. Thus, we consider different sets of key indicators to assess technological progress in different groups.
However, not only technological progress affects TFP growth. Globalization and openness of the modern economies suggest that there is an impact of the global business cycle on productivity. The linkage between the stock market volatility and business cycle was investigated in the literature (see, for example [
2] and literature review in [
3]). In addition, Elder and Serletis [
4] and Serletis and Xu [
5], among others, argue that volatility in oil prices has had a negative and statistically significant effect on several investment measures, durables consumption, and aggregate output.
Thus, we investigate the effects of oil price volatility on TFP growth, controlling for variables measuring technological progress and openness of the economy. Our study examines two central research questions. Firstly, we propose a regression model for TFP growth, combining different indicators depending on different innovation strategy types. Secondly, we assess uncertainty in commodity markets.
The rest of the paper is organized as follows.
Section 2 and
Section 3 present the methodology used in the empirical investigation.
Section 4 presents the data and the empirical results.
Section 5 provides a discussion of the results and addresses the policy implications. The final section concludes the paper.
2. Research Model
We use the Conference Board Total Economy Database (TED) as a source of data for TFP growth (The Conference Board, 2019. The Conference Board Total Economy Database™, April 2019,
http://www.conference-board.org/data/economydatabase/ accessed on: 10 March 2020). The database contains time series data for more than 120 countries, covering the period since 1990.
According to Jorgenson and co-authors [
6,
7], capital services and labour input are measured as translog aggregates of heterogeneous capital and labour types. Under the assumptions of competitive markets, full input utilization, and constant returns to scale, the contribution of each input to output equals the share of input cost to total cost—see Measuring Productivity [
8].
TED capital is decomposed into Information and Communication Technology (ICT) capital and non-ICT-capital. Labour is decomposed into pure employment quantity and labour quality. One can find a detailed description of the sources and methods used to construct all TED variables in materials provided on the official website.
According to endogenous growth theory, TFP can be modelled as a function of a country’s innovation capacity (see, for example, [
9,
10]). Innovation capacity depends upon the size and quality of the national innovation system, openness to international trade, the degree of technological specialization, and the ability to adopt and commercialize new-to-the-world technology.
We specify the TFP growth equation to reflect the role of the national innovation system as a source of productivity growth, the impact of technology spillovers, the role of international trade and FDI, and “the health” of the global economy as follows:
where
εit is an error term,
i denotes a country,
t denotes time,
αi captures country fixed effects, and
Zt accounts for the “health” of the global economy at time
t.
As TFP growth is measured from the supply side, period effects in TFP growth models can capture global demand changes. We use oil price volatility to capture the ‘health’ of the economy and changes in demand instead of period fixed effect.
There are several channels through which oil prices may affect productivity. Firstly, at the end of 2019, before the pandemic, the global economy consumed around 100 million barrels of crude oil per day, compared to about 40 million barrels at the end of the 1970s (
https://www.iea.org/reports/world-energy-outlook-2019. accessed on: 1 December 2020). In the case of stable oil prices, firms can more accurately plan their expenses and investments. Rising oil prices reduce the availability of inputs and lead to output decreases (see Hamilton [
11]). The impact of oil price movements on GDP and several macroeconomic and financial variables for the United States economy has been widely investigated in the literature (see, for example, Barsky and Kilian [
12], Kilian and Vigfusson [
13], and Azad and Serletis [
14], among others). In fact, Azad and Serletis [
14] find the linkage between oil price uncertainty and macroeconomic indicators of emerging economies to be significant.
Secondly, financial and commodity markets are good indicators of the state of the global economy. The correlation between commodity (notably, crude oil) prices and equity prices after the global crisis has been established in the literature (see Lombardi and Ravazzolo [
15]).
High volatility of financial and commodity markets causes fear among portfolio investors, and may increase risk aversion. In turn, it may reduce investments in risky innovation projects and slow down technological progress.
For EU countries, uncertainty in commodity markets is even more important, as these countries are pure importers of fossil fuels and other raw materials. According to Eurostat, (
https://ec.europa.eu/eurostat/cache/infographs/energy/bloc-2c.html accessed on: 3 March 2021) the dependency rate (the share of net imports in gross inland energy consumption) was equal to 58% in 2018. The dependency rate on energy imports has increased since 2000, when it was just 56%, despite the increasing efforts to achieve the renewable energy directive target by 2020. Several barriers that were found for the United States and Russia (see [
16]) are also relevant for EU countries (see, for example, [
17]).
The vector Xj in Equation (2) captures a country’s technological advancement and the effect of globalization.
R&D is one of the leading indicators of a national innovation system and potential readiness for technological advances. As R&D expenditure comprises all expenditure on research and development in business enterprises, the government sector, higher education and non-profit firms, it captures all national efforts on product and process innovations quite well. It is therefore suited as a proxy for technological innovation. In the EU, it is one of the main indicators of achieving the strategic goal to grow through innovations. We examine the impact of the growth rate of R&D expenditure on TFP growth to reduce heteroscedasticity in our model.
Globalization is one of the main trends of the last three decades, considered in this study. Public policy, which was changing in the 1990s and 2000s towards a free-market economic system, and communications technology innovations have been identified as the two primary driving factors of globalization. Nowadays, there is growing uncertainty in industrialized countries regarding whether globalization means more opportunity or more risk. Trump, Brexit and increasing populism are named direct consequences of this development (see [
18]). However, we can’t deny the impact of globalization on economic growth in general, and TFP growth in particular. One of our objectives in this study is to investigate the linkage between globalization and TFP growth.
There are several ways to measure globalization. For example, the KOF Globalization Index measures the economic, social, and political dimensions of globalization. (
https://www.kof.ethz.ch/en/forecasts-and-indicators/indicators/kof-globalisation-index.html. accessed on: 03 March 2021) We use factors included in the KOF Globalisation Index from an economic perspective, such as trade openness and free capital movement. Note that European countries are among the leaders in the globalization ranking.
Participation in international trade may be regarded as a driver of productivity increases (see [
19]). Firstly, only efficient and highly productive firms can be successful in world markets. So, the increase in exports can be regarded as a sign of increasing productivity. On the other hand, EU firms mainly import raw materials and intermediate products to produce higher value-added products. So, the value of imports is also associated with productivity, at least in highly industrialized countries.
Secondly, for trading on the world market, the developed infrastructure is essential. To compete on global markets, firms need to be efficient in logistics, inventive in business processes, and successful in adopting advanced technologies. Thus, we consider the growth rate of both exports and imports to be a good candidate in explaining productivity dynamics for EU countries.
As the impact of FDI on TFP growth has been supported by many researchers, we examine FDI inflows and outflows. FDI inflows can bring technological, marketing and organizational innovations, at least in theory, affecting TFP growth. However, for the EU countries, the role of FDI outflows as a source of technology spillovers seems to also be important, as a sizable proportion of the EU outward flows typically are destined for the United States and other European countries (for example, Switzerland and Iceland) (
https://ec.europa.eu/eurostat/web/products-datasets/-/bop_fdi6_geo accessed on: 3 March 2021). Moreover, transnational corporations (TNCs) benefit from investing in emerging countries [
20], which can indirectly affect the TFP of the home country of the transnational corporations. Globalization is also characterized by an ongoing fragmentation of production [
21]. More efficient production chains, achieved by lowering transaction costs while investing in countries with lower factor costs, are assumed to increase productivity.
The technological spillovers can also be captured through flows of payments for the use of intellectual property. We use charges for the benefit of intellectual property rights paid and received by a country to reflect the scale of new technology commercialization on the one hand and the scale of new technology adoption on the other hand.
4. Empirical Evidence
4.1. Data Description and Analysis
We retrieve data from TED, Eurostat, the OECD database, and the World Bank database. We use an unbalanced panel of 28 EU countries (including all EU members as of the end of 2019) for the period 1990–2018. Data on R&D expenditures, international trade and royalties are converted to constant PPP dollars. The growth rate is measured in log changes multiplied by 100.
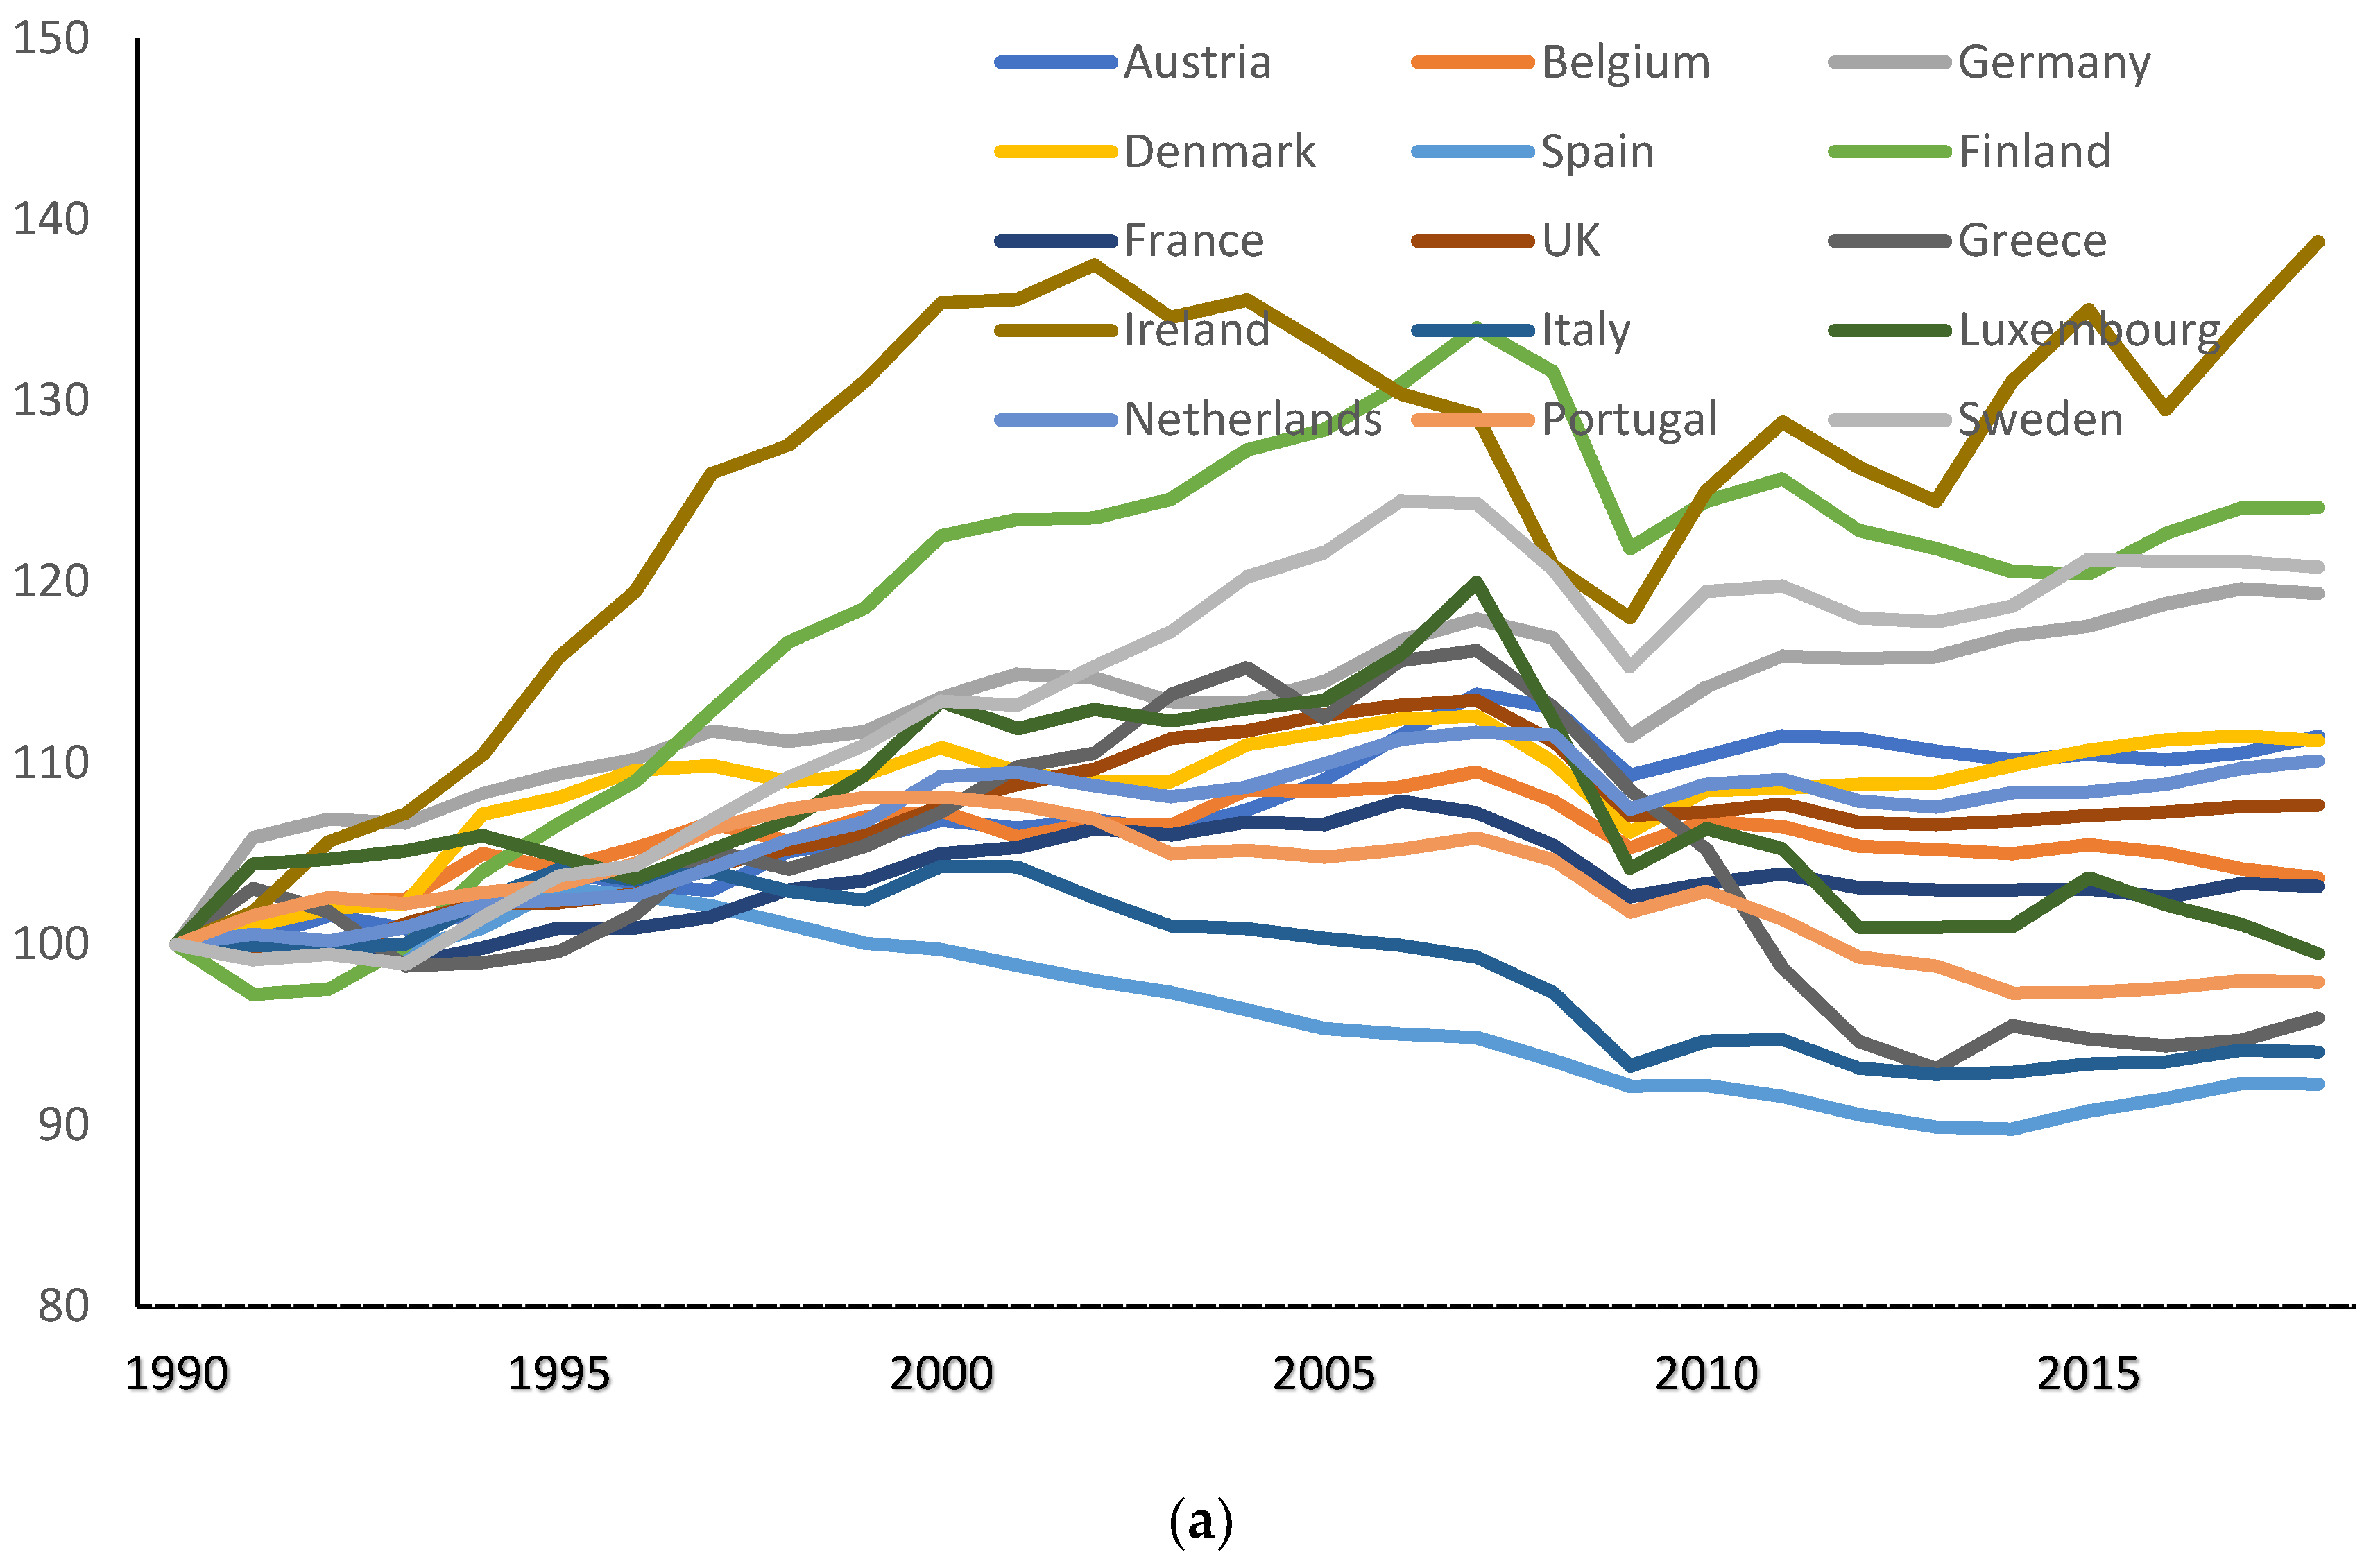
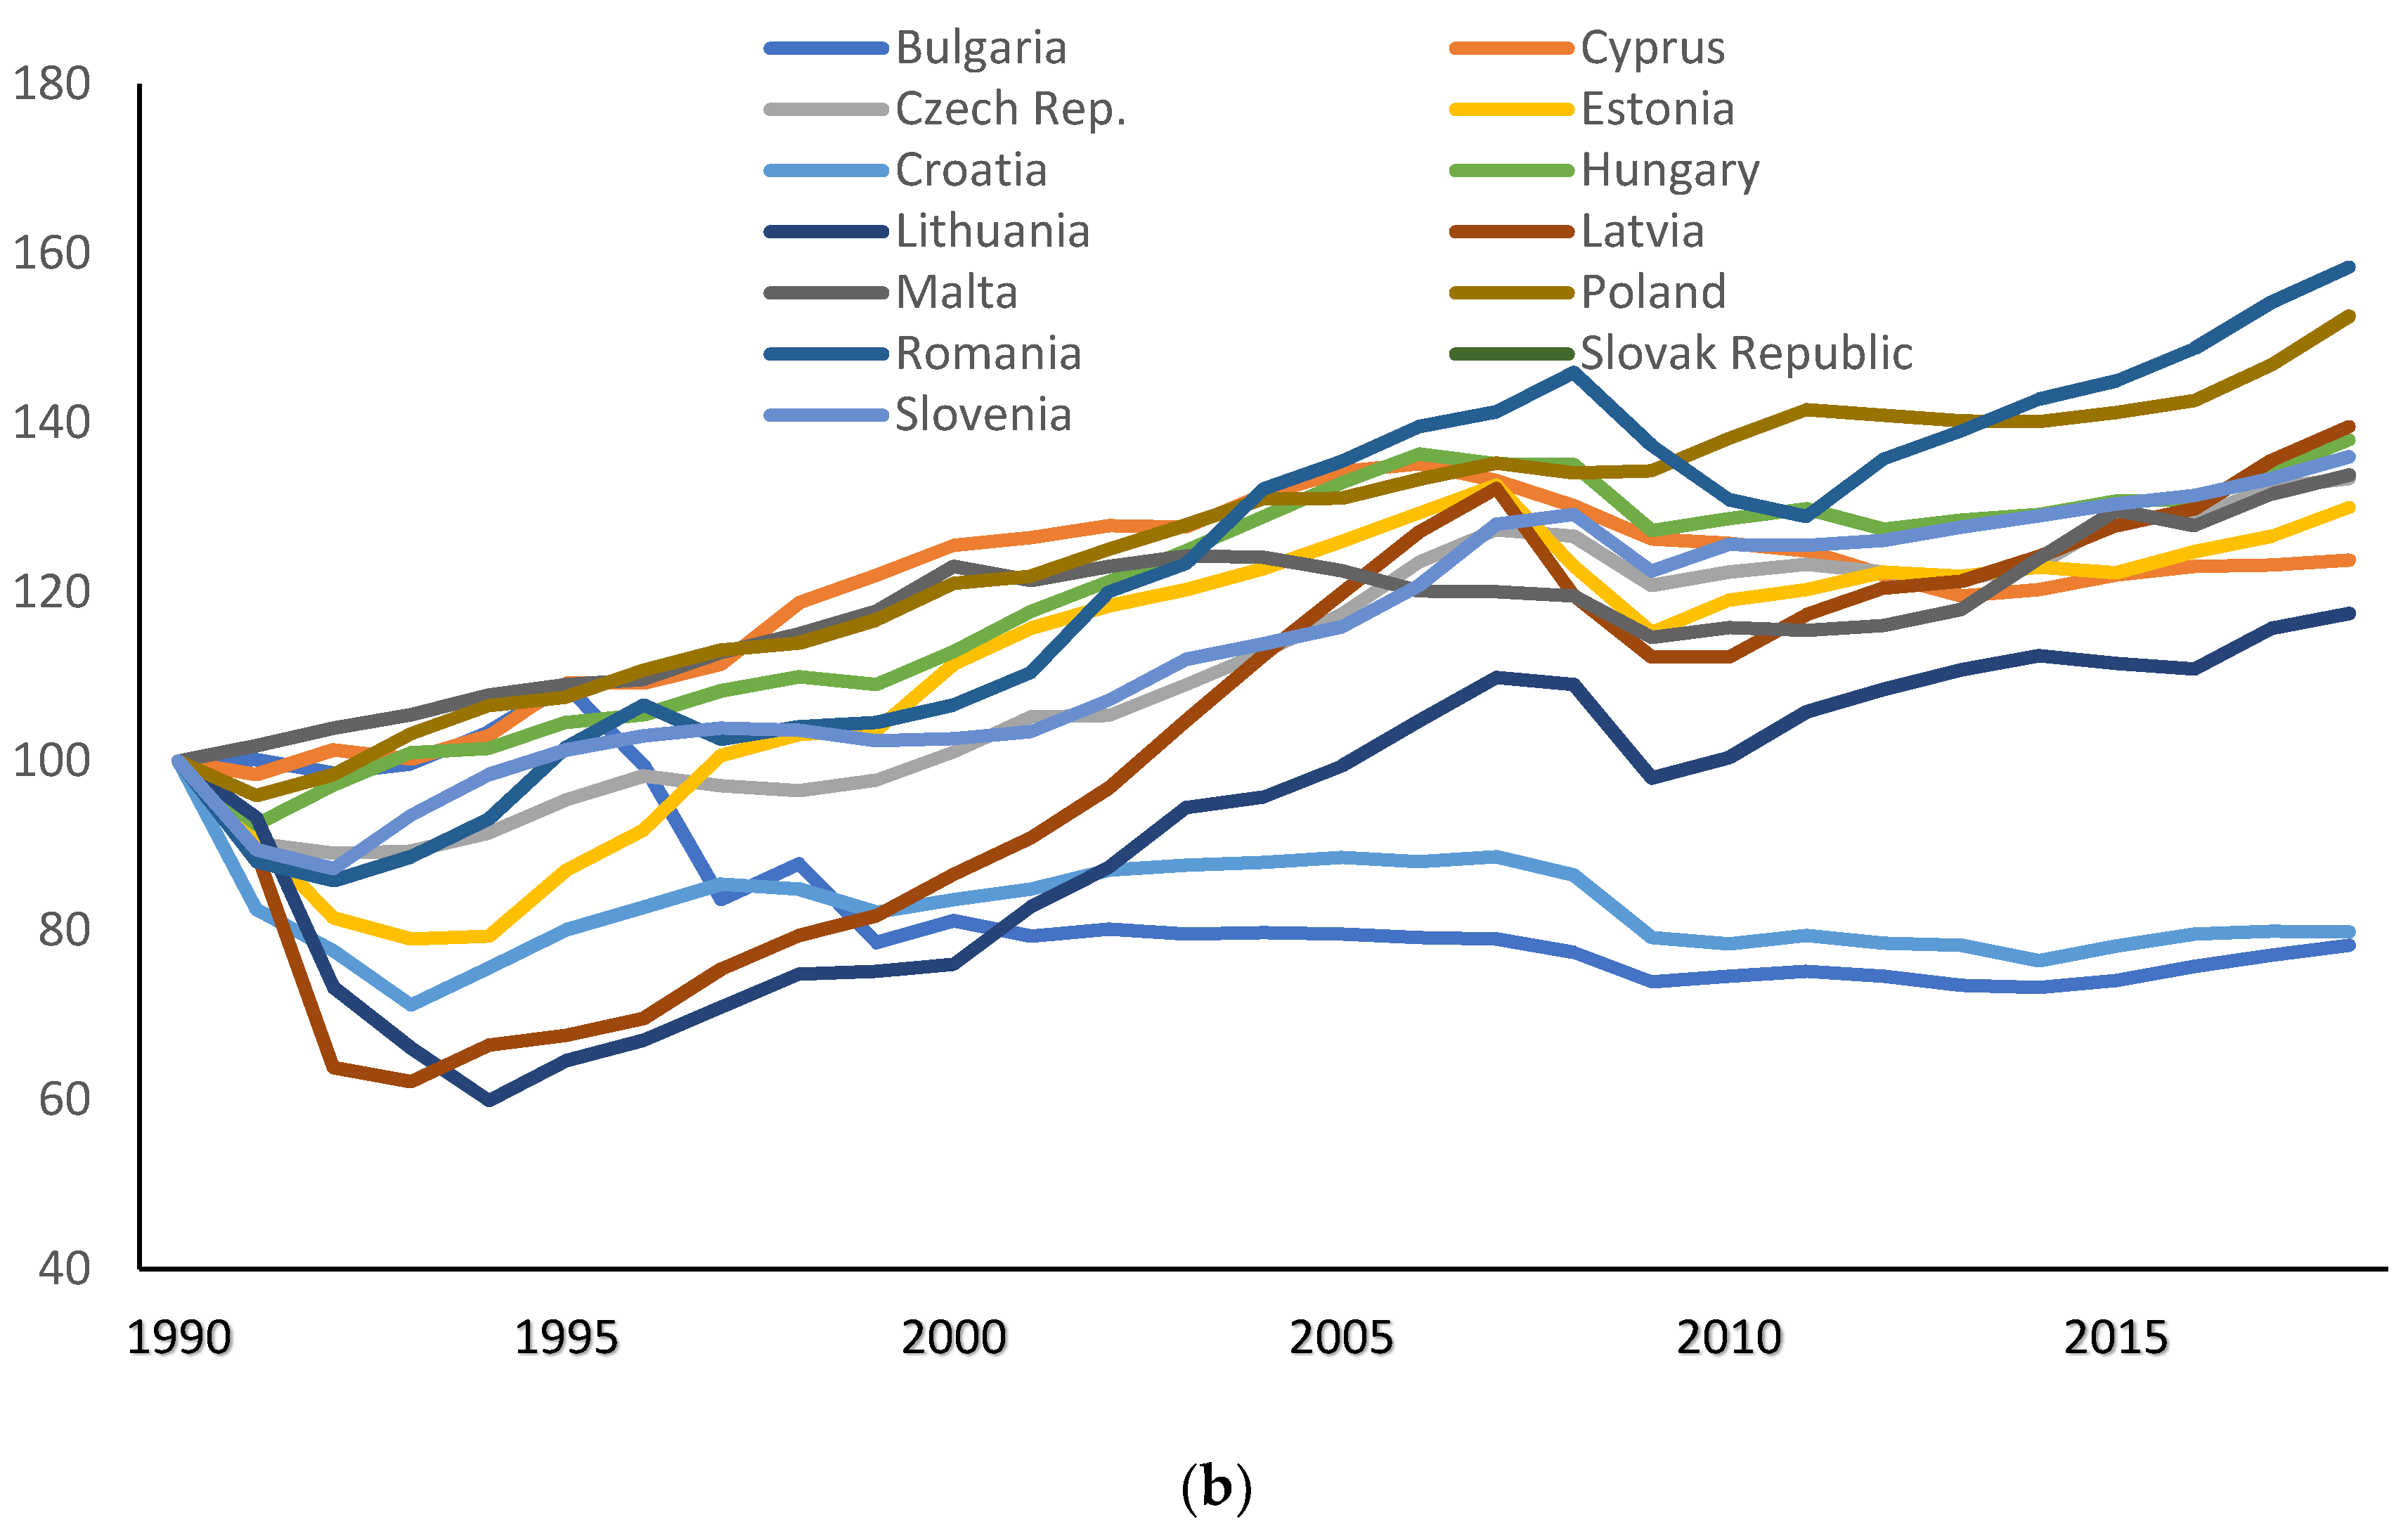
To visualize the dynamics of TFP at a country level, we compute a country-specific TFP index. We create the index setting the year 1990 TFP level equal to 100 for each country. We show the TFP dynamics in panel (a) of
Figure 1 for the EU15 countries and in panel (b) of
Figure 1 for the EU13 countries, using data from the TED database.
The dynamics of productivity vary significantly among the ‘old’ members of the EU. Ireland has the highest productivity gains, followed by Finland, Sweden and Germany (see panel (a) of
Figure 1). The stagnating productivity trends in Spain and Italy are evident, and Greece shows a sharp decline in productivity in the 2010s.
The majority of the former communist states have shown an upward productivity trend since the early 2000s. For example, Romania is one of the most fast-growing EU countries in terms of TFP (see panel (b) of
Figure 1). However, the TFP indexes for Bulgaria and Croatia are far below 100 in 2018, meaning that TFP in these countries was lower in 2018 compared to 1990. (It is to be noted that the TFP series for Croatia is based on TED estimates using data for Yugoslavia.
http://www.conference-board.org/data/economydatabase/ accessed on: 10 March 2020) Notably, all countries display a noticeable decrease in productivity in 2009; however, the recovery rates are different.
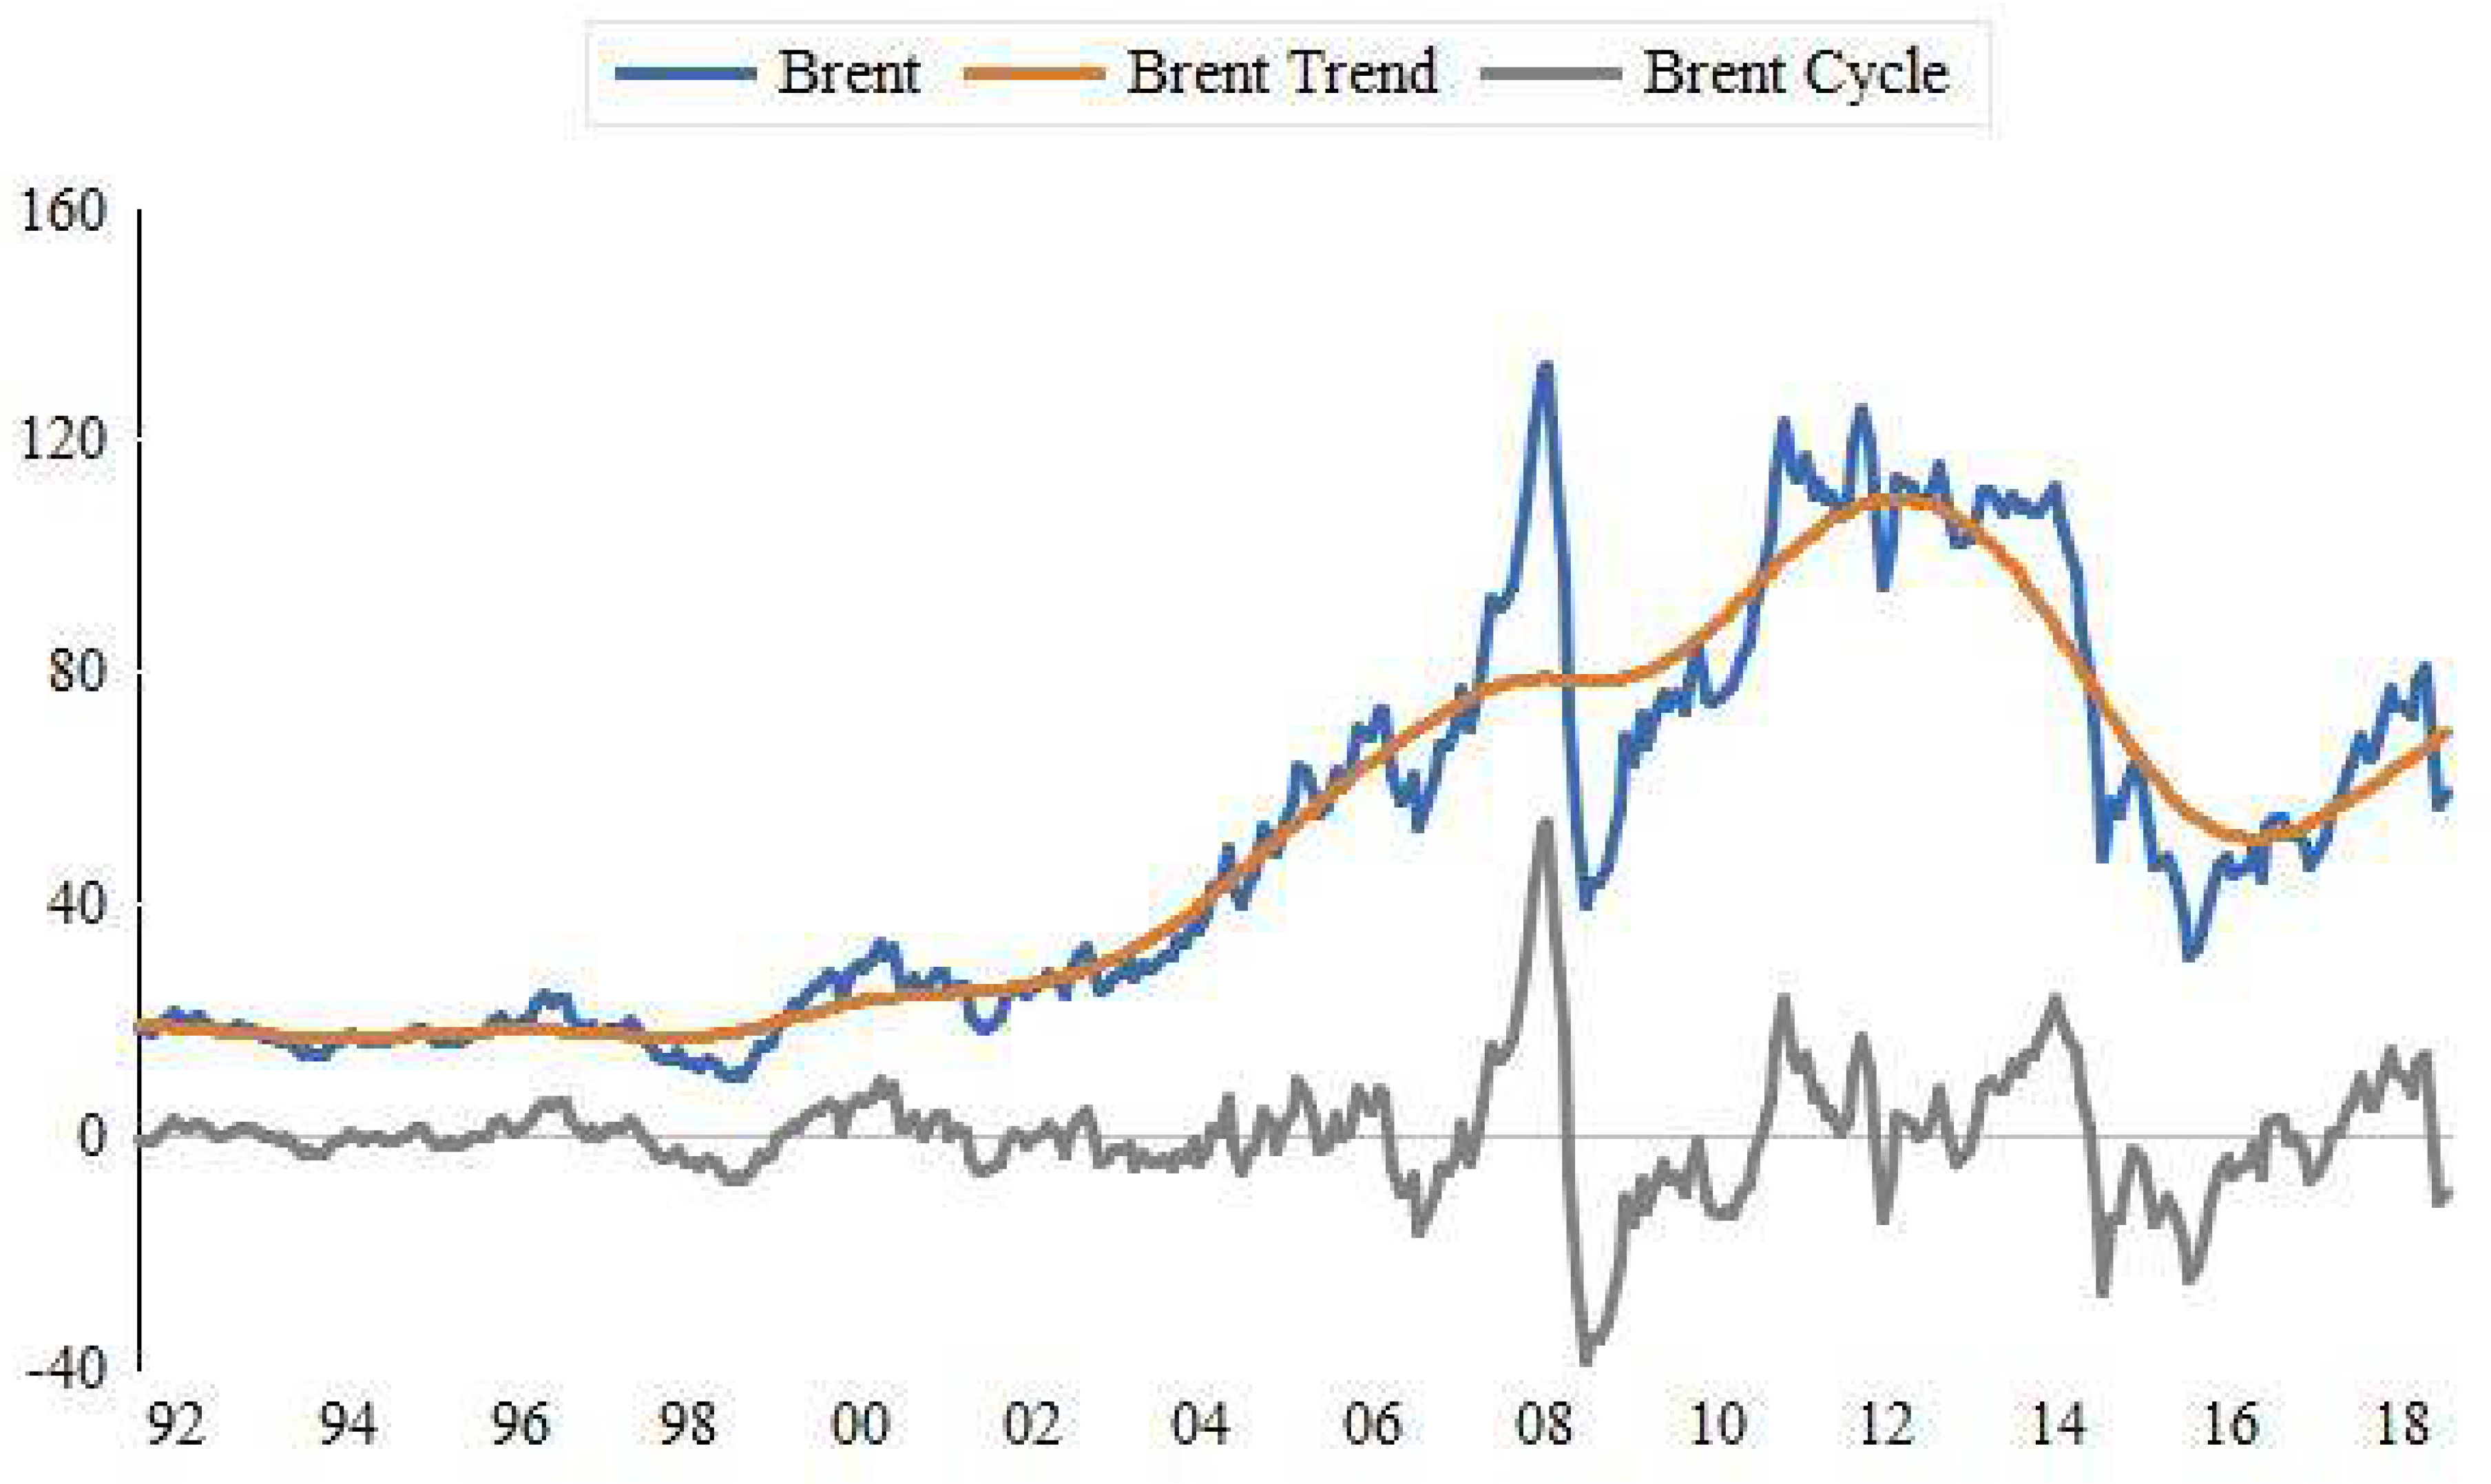
To measure the uncertainty in commodity markets, we estimate the unknown parameters of the GARCH-M(1,1) model (3), using monthly observations of the Brent oil prices (see
Figure 2).
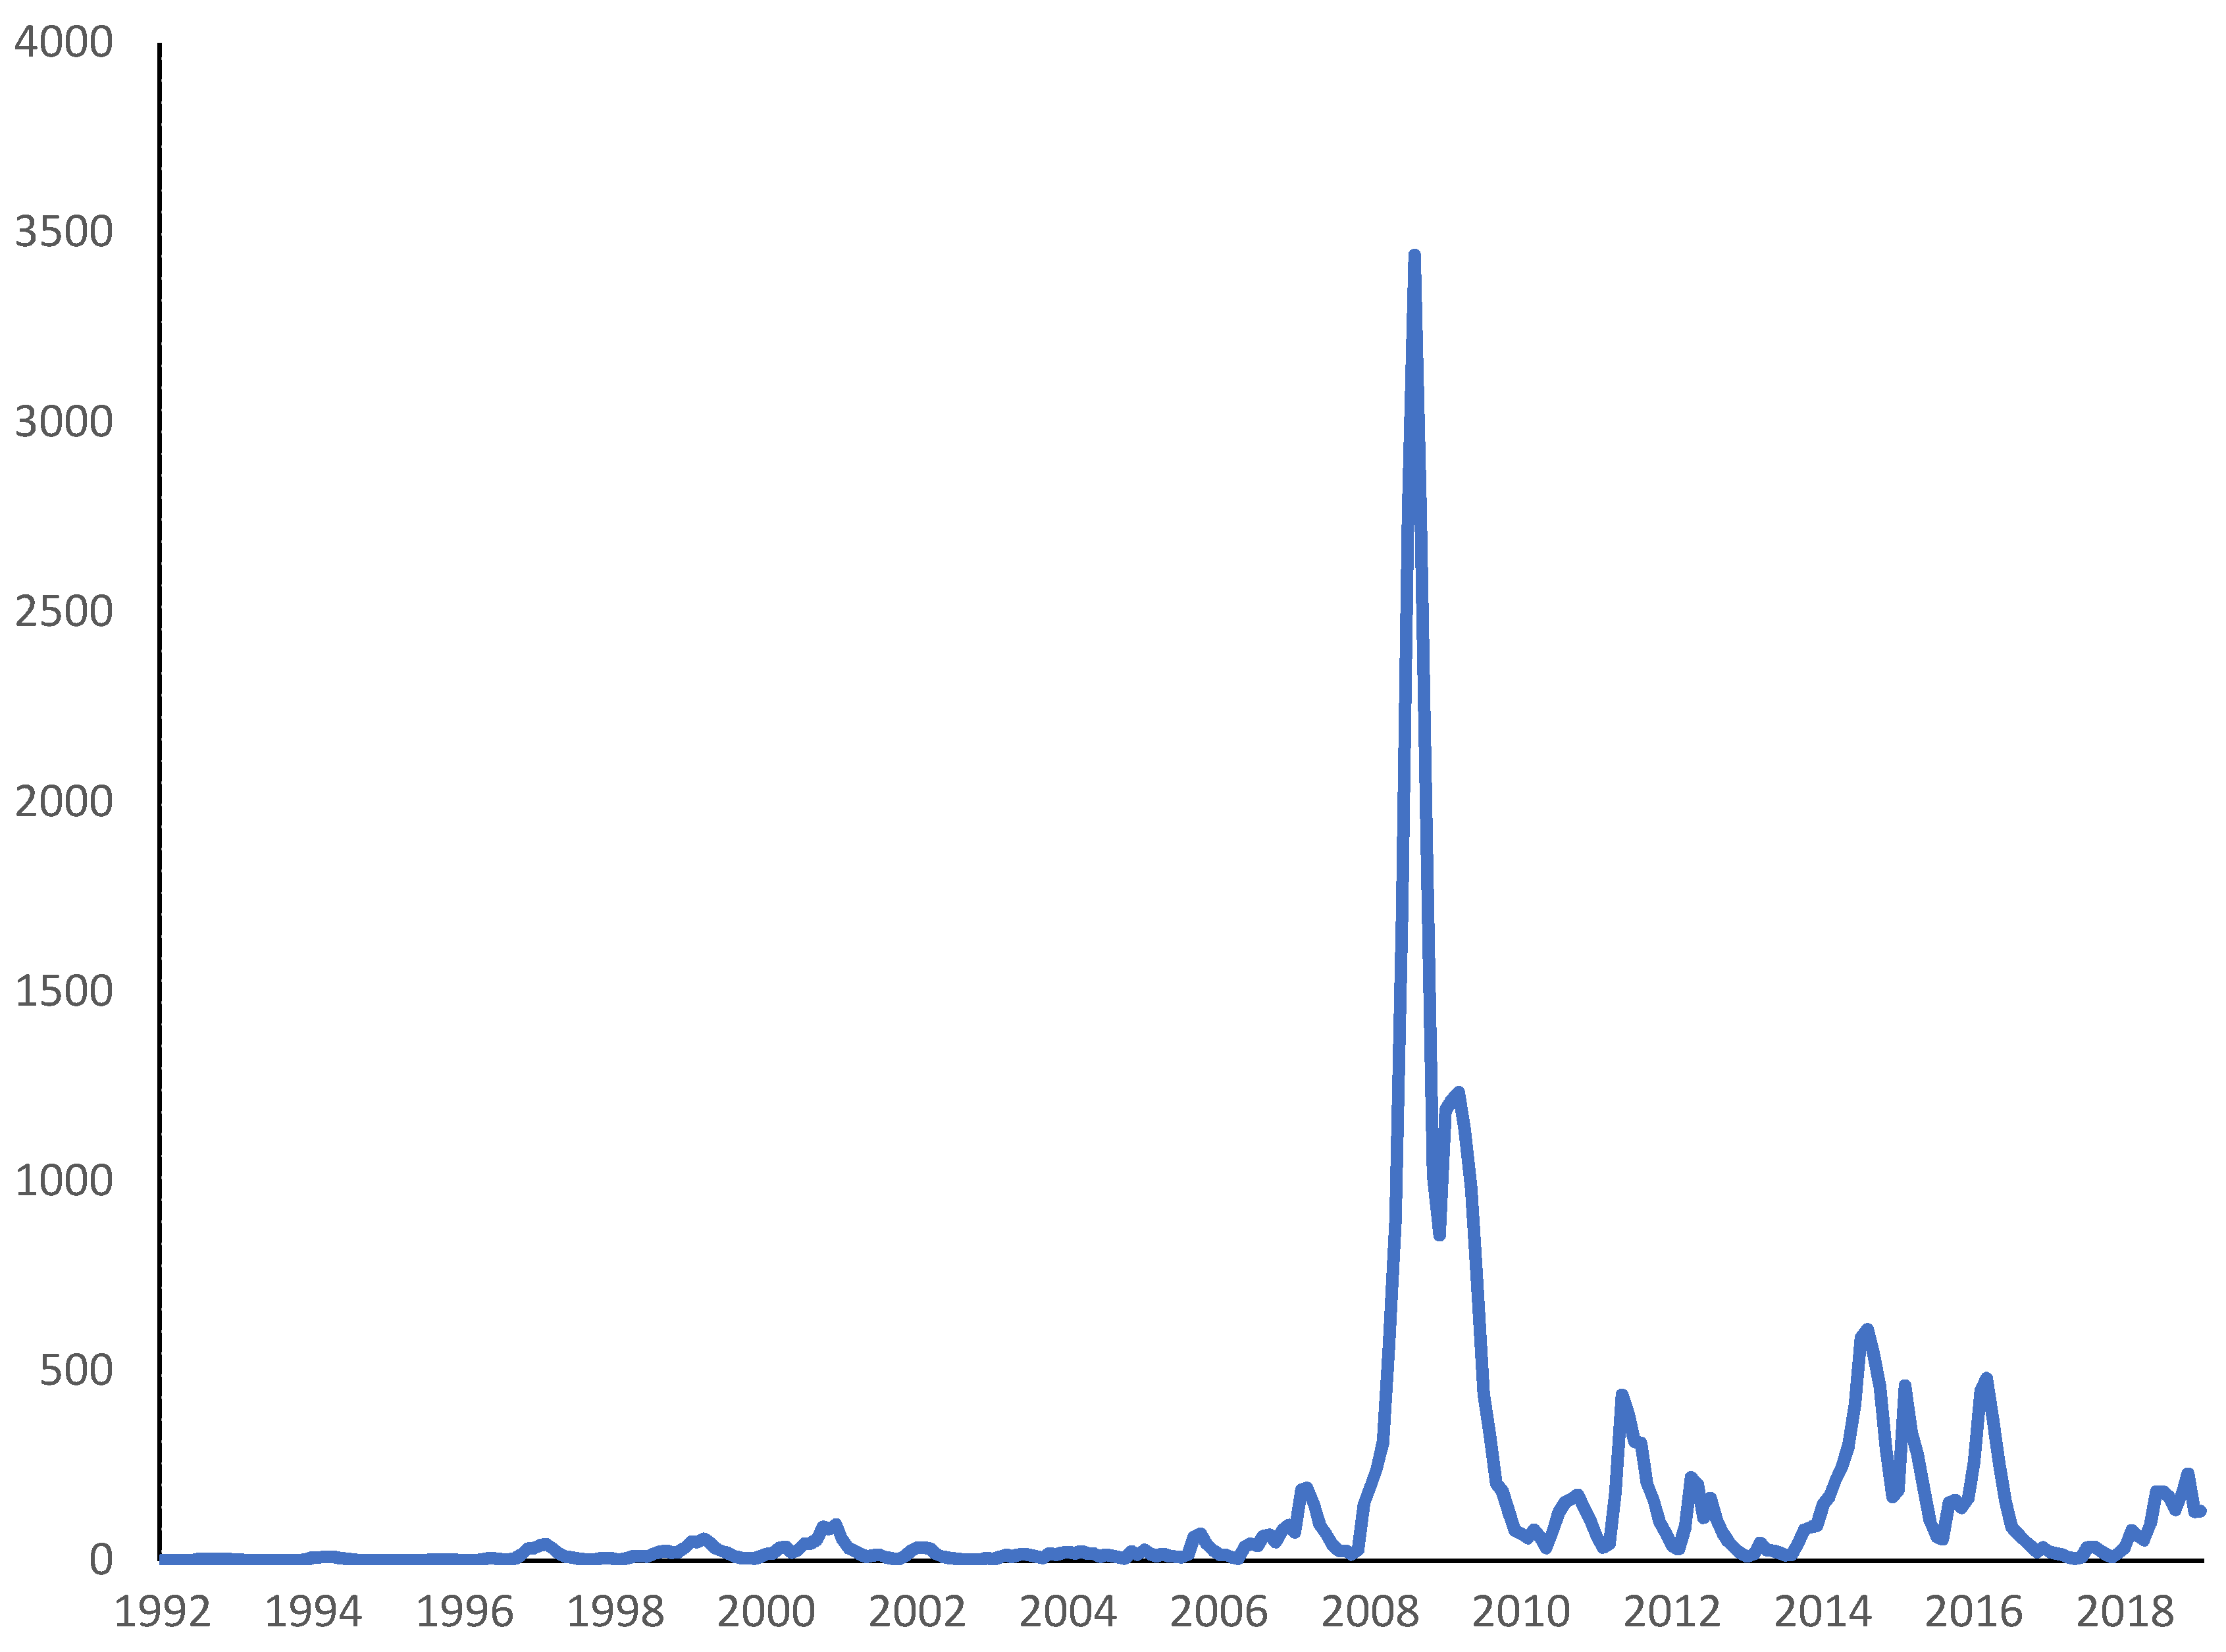
We obtain a one-period ahead forecast of monthly volatility from the GARCH-M model (3). The volatility
VolT of the year
T is measured as the monthly average of the one-year window:
where
is an estimate of the GARH component of Equation (3) for year
T at month
j. We plot the obtained data in
Figure 3. The sharp peak corresponds to the most significant uncertainty in oil and financial markets during the global financial crisis. This peak is closely associated with the consecutive steep decline in TFP growth of EU countries (see
Figure 1).
The model key variables’ description and summary statistics are reported in
Table 1.
Before running the regression model, we proceed with unit root tests for panel data. We use the the Levin, Lin, and Chu [
27] test, assuming a common unit root proccess, and the Im, Pesaran, and Shin [
28] ADF test, assuming individual unit root process in the considered time-series. Results are reported in
Table 2.
4.2. Estimation Results
The empirical analysis is conducted for 28 EU countries. Firstly, we estimate our model (2) with a single variable in vector X, namely the growth rate of real R&D expenditures, and oil price volatility, assuming the cross-section fixed effect. The Haussman test has shown that the random effects do not over-perform the fixed effects specification. The fixed effects specification suits better our analysis as we are interested in the country-specific part of the growth rate of TFP (parameter in Equation (2)).
Then, we check whether the growth rate of international trade and changes in FDI inflows and outflows could improve the model specification. To reflect the impact of knowledge spillovers on total factor productivity growth, we include the royalty variable. It is calculated as the sum of receipts and payments for the use of intellectual property rights.
Table 3 summarizes the estimated impact of R&D expenditures, international trade and royalties, changes in FDI flows and oil price volatility on TFP growth.
In order to analyze whether the effects of technological innovations, openness and knowledge spillovers differ between countries with different historical and economic development, the countries are divided into two groups: “old” and “new” EU members, which is relatively common in empirical analyses.
To test for equality of means of TFP growth rates between the EU15 and EU13 countries for the 1990–2018 period, we run the Satterthwaite–Welch t-test, which allows for unequal variances. We cannot reject the null hypothesis that the mean growth rate is equal for these two groups at the 5% significance level (the test statistic is equal to 1.9 with a p-value of 0.056). However, we assume that the impact of different factors on total factor productivity differs between countries with mature and developing markets.
4.3. Discussion
All “old” EU countries (except Finland) have negative country-specific “fixed” growth rates of TFP, although, in the case of Austria and Germany, the coefficients are very close to zero. All “new” EU countries have positive country-specific ‘fixed’ growth rates of TFP, with Latvia and Lithuania having the highest values. The effect is partly due to a “low base” TFP in the former Soviet countries.
R&D expenditure growth has an impact on productivity in all EU countries. The openness of the economy also helps to boost productivity growth in all EU countries. This is in line with the findings of the “Globalization Report 2018: Who Benefits Most from Globalization?” It was shown that “for the third time in a row, as in 2014 and 2016, when measured in terms of real gross domestic product (GDP) per capita, industrialized countries continue to be the biggest winners of increasing globalization, while developing and emerging economies lag behind”.
Our findings of the positive impact of FDI outflows on productivity growth are consistent with the results obtained by Altomonte and Ottaviano [
29] in their study of the role of international production sharing in EU productivity at the micro-level. Royalties are more important for the EU13 countries than for the EU15 countries. Among the EU13 countries, almost all countries except Hungary, pay a lot more for the intellectual property rights than they receive from other countries.
5. Conclusions
Total factor productivity measures the overall efficiency of labour and capital in the production process. During the examined period, from the early 1990s to the late 2010s, the EU countries showed a growth trend in the total factor productivity on average.
We assume that the total factor productivity is influenced by several groups of factors. Firstly, it is research and development carried out in a given country. For developed countries (most EU countries belong to this group), innovation is the most important driver of economic growth. We use internal R&D expenditure as a proxy variable for assessing the scale of research and innovation. We find that growth in R&D spending is associated with an increase in the TFP growth rate, all other things being equal.
The second group of factors includes indicators of the openness of the economy. These include the volume of foreign trade and inbound and outbound foreign direct investment. High competition in international markets increases the demands on companies to be more efficient and productive. Thus, it contributes to an increase in the overall productivity of the economy. We find a significant positive effect of international trade on TFP growth.
The impact of FDI inflow on productivity in developing countries is well documented in the literature. The positive effect of FDI-trade linkage lies in its contribution to integrating the host country into the world economy. The same is relevant for the former communist European countries which experienced a transition to a capitalist economic system during the 1990s. The impact of FDI outflow on the productivity of the home country is less examined in the empirical literature. Our estimates show that, controlling other variables, the impact of FDI inflow on TFP growth is not significant; however, the impact of FDI outflow is positive and significant.
However, it is not only innovation, technology and the overall efficiency of companies that drive productivity growth. Uncertainty on world commodity and financial markets plays a significant role and can have negative effects on economic growth. The volatility of the oil market, which is closely related to the volatility of other markets, inhibits the growth of total factor productivity, as shown in the study.
In this paper, we have focused on the effects of oil price shocks and oil price uncertainty on total factor productivity. Assessing the importance of oil price shocks, by simultaneously evaluating the effects monetary policy shocks, fiscal shocks, and other measures of risk and uncertainty, is an area for potentially productive research.


