
An Innovative System for the Treatment of Rising Dampness in Buildings Located in Cold Climates


Abstract
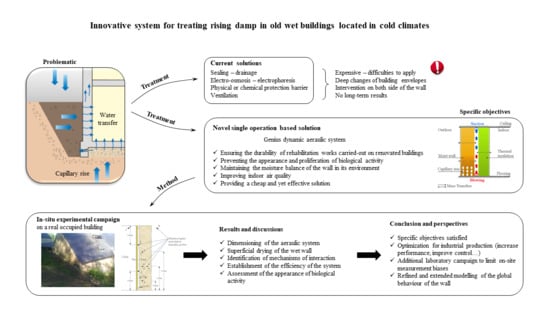
1. Introduction
- Ensuring the durability of rehabilitation works carried-out on renovated buildings;
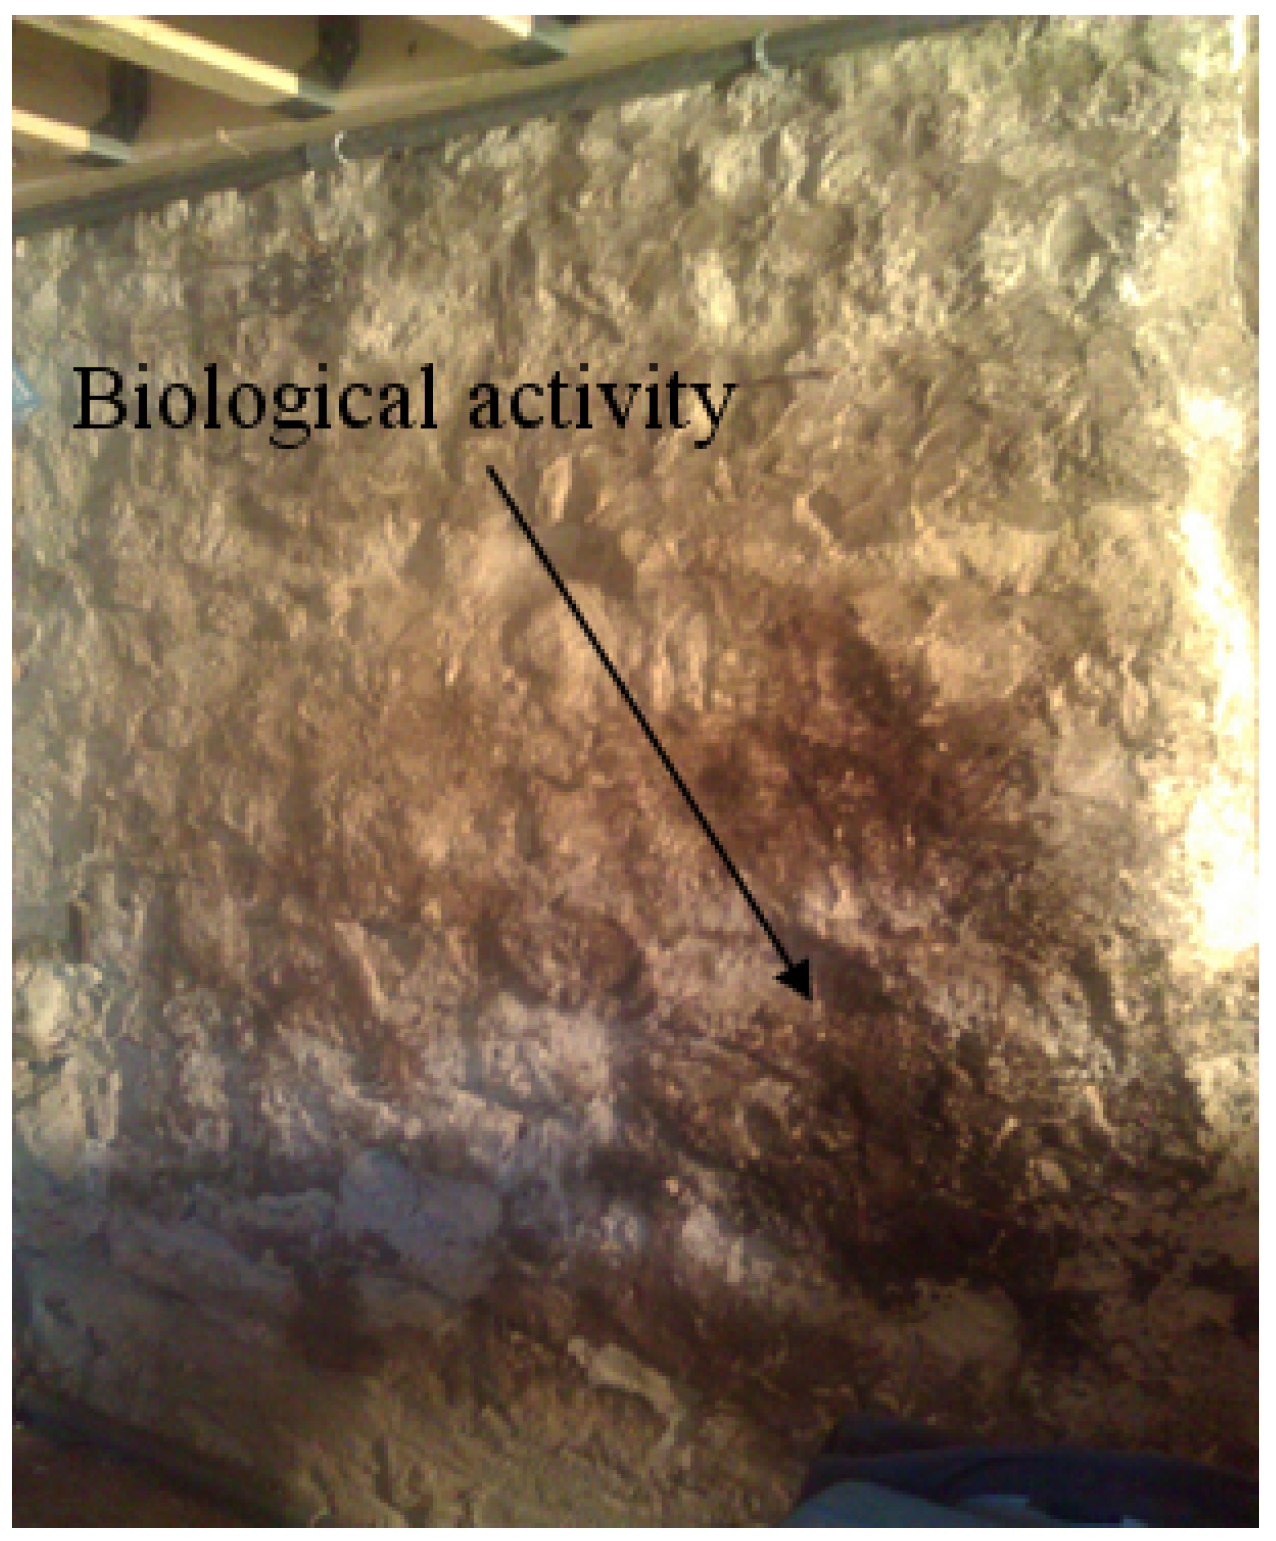
- Preventing the appearance and proliferation of biological activity;
- Maintaining the moisture balance of the wall in its environment;
- Providing a cheap and yet effective solution.
2. Materials and Methods
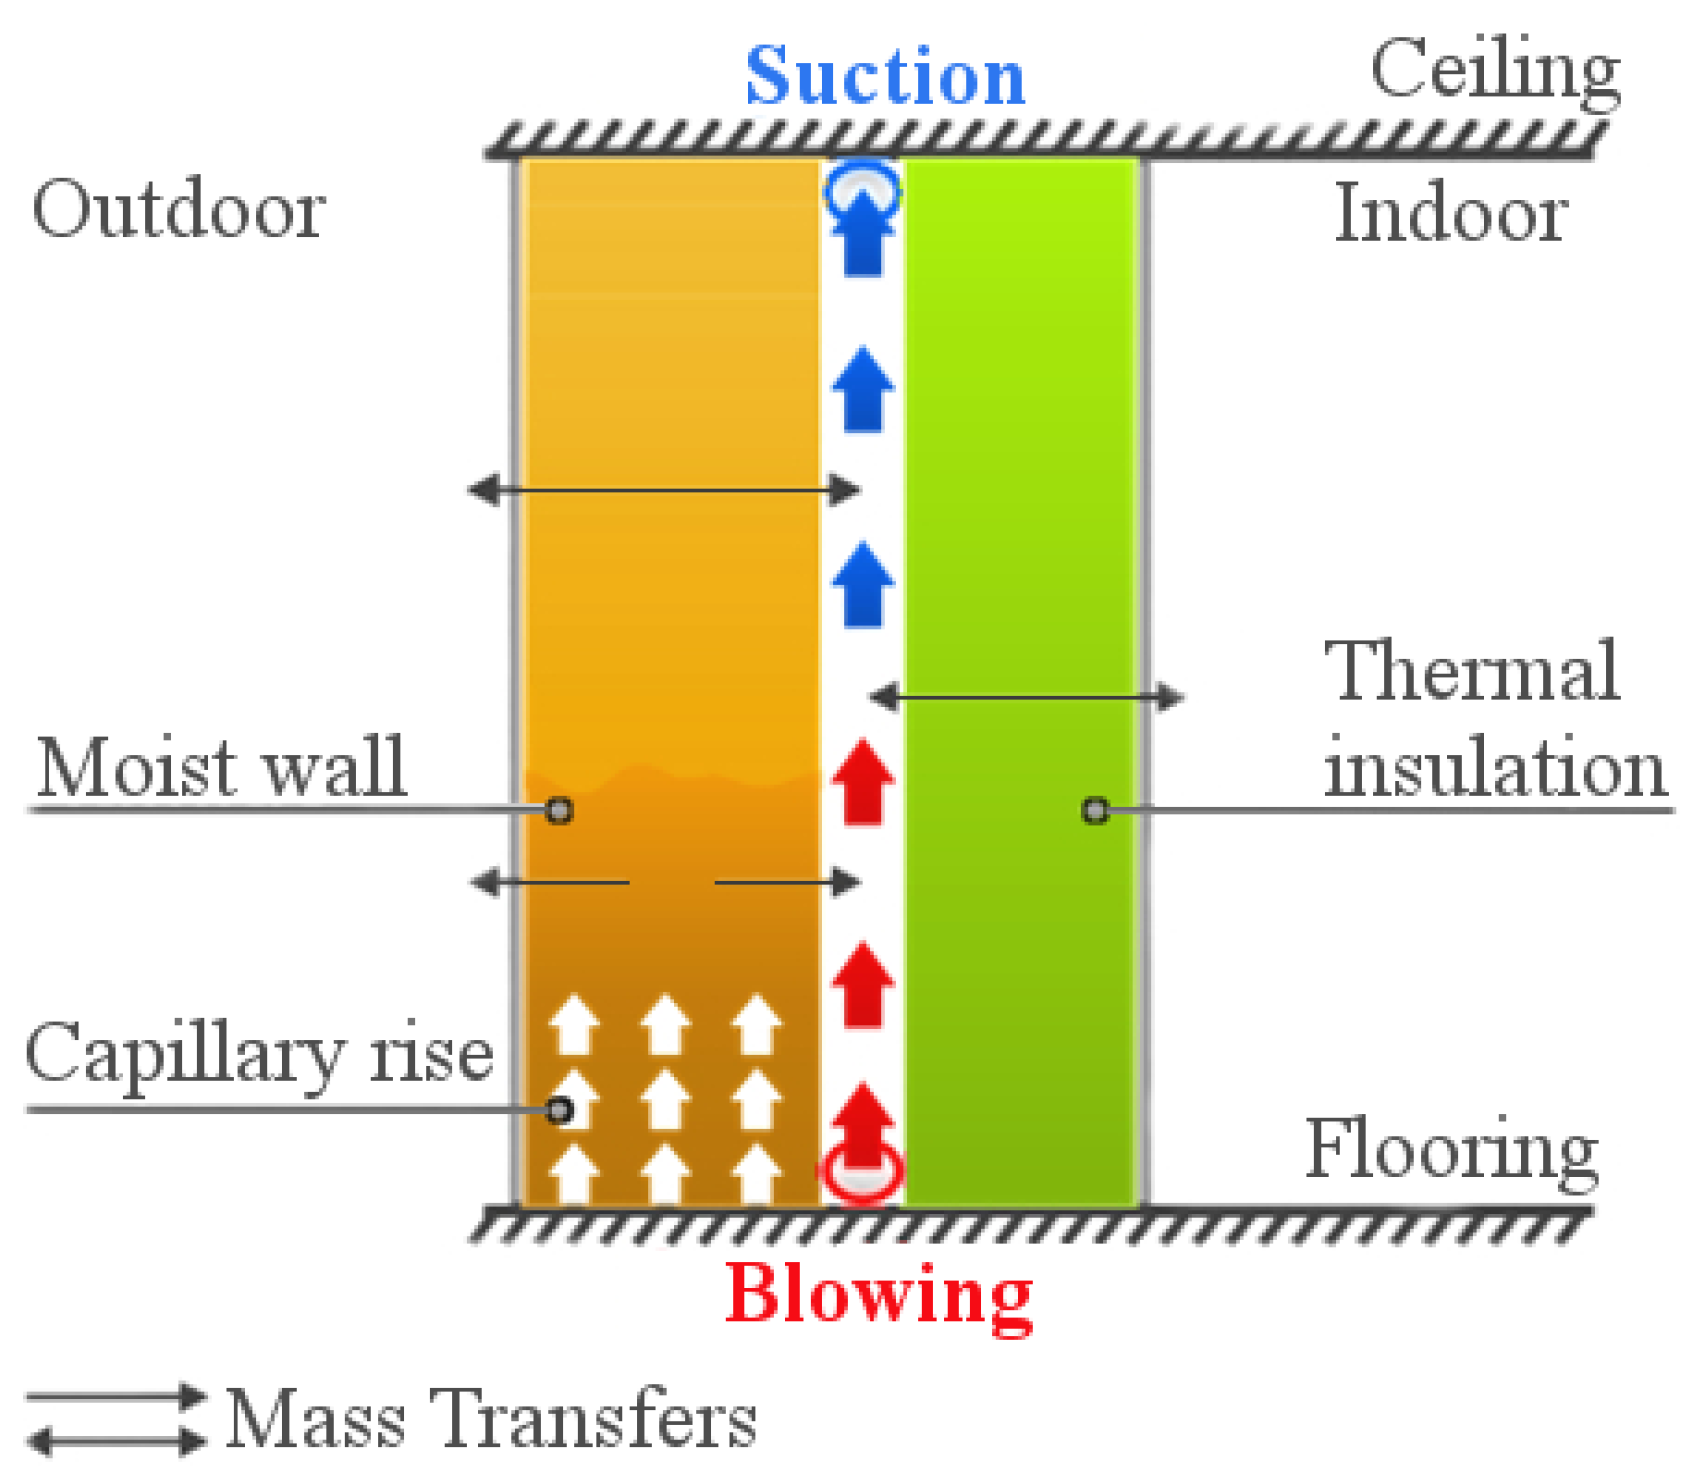
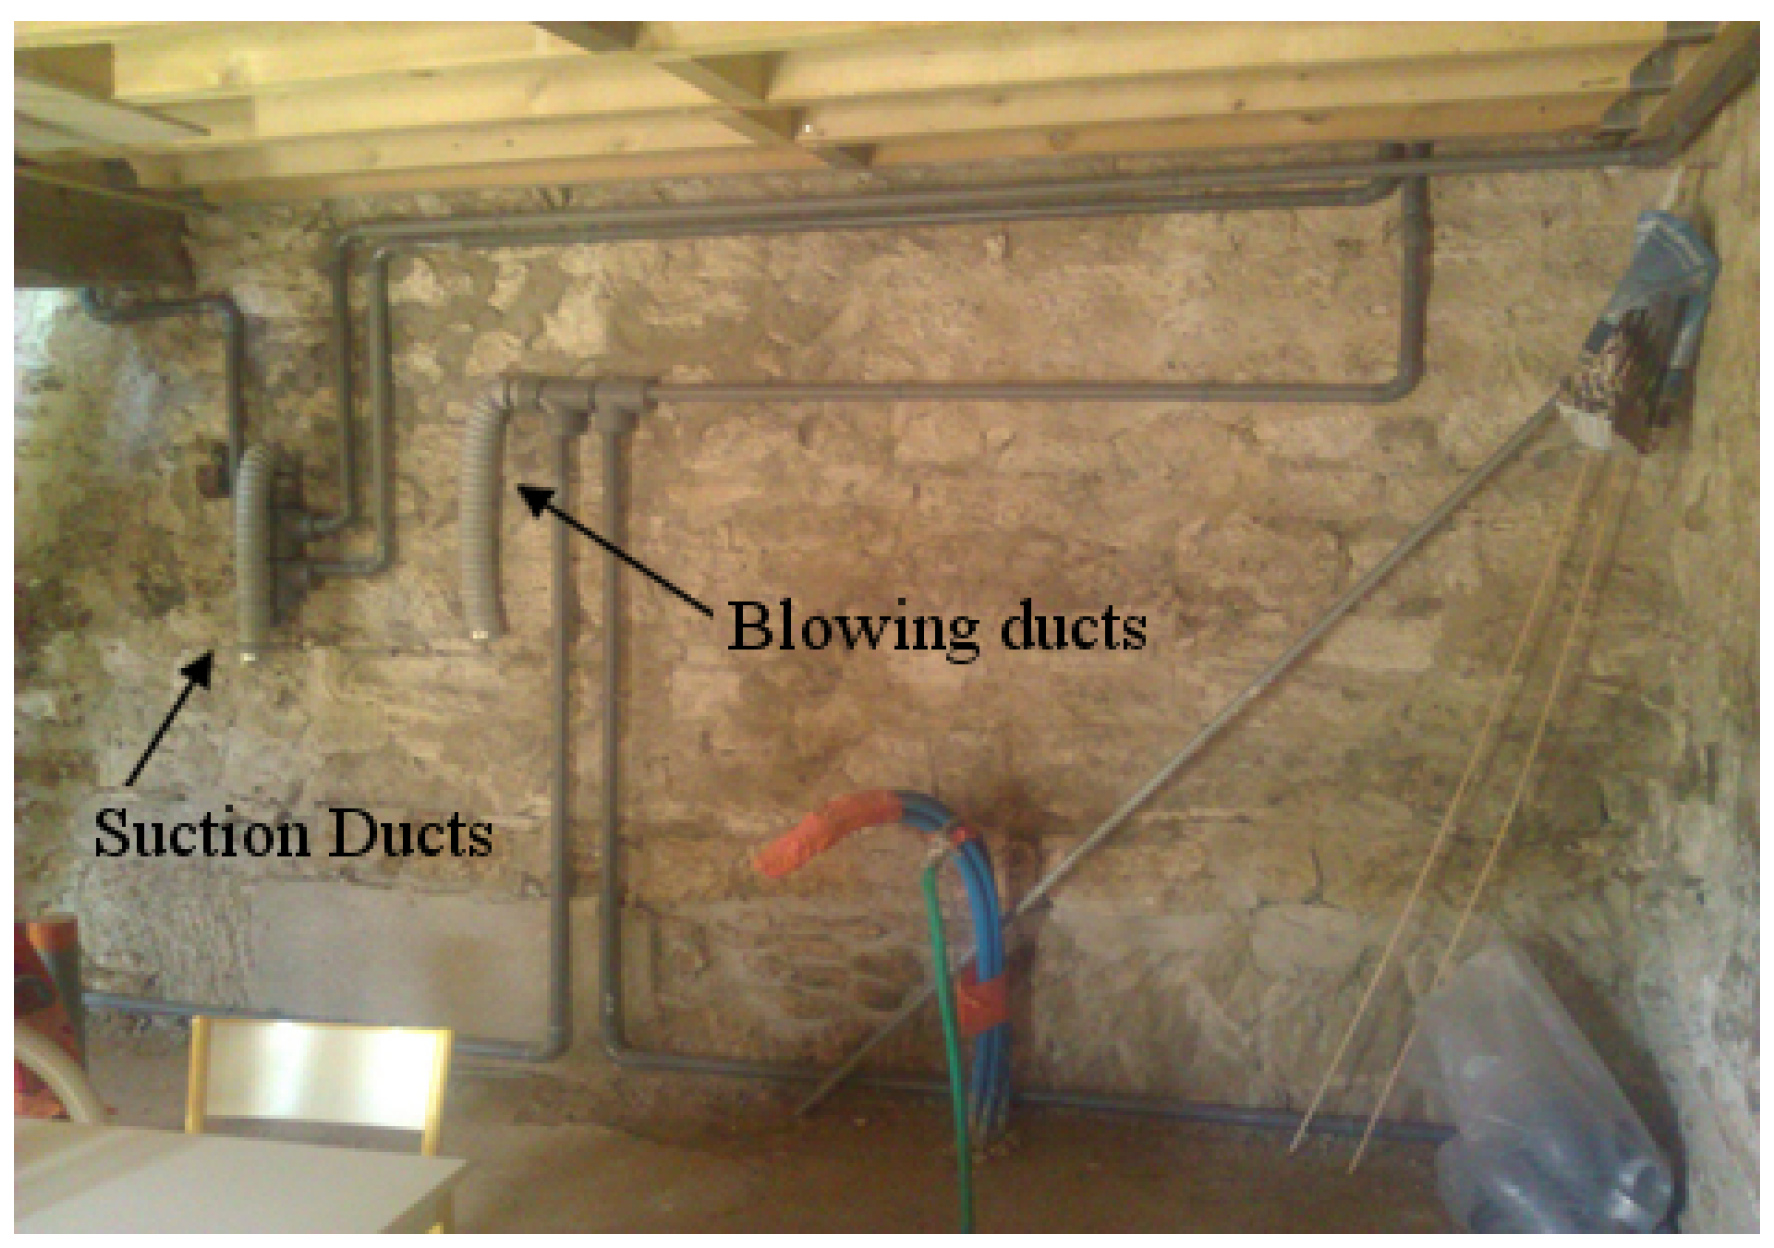
2.1. Principle of the Ventilation System
- Wet walls retain their hygroscopic balance, and their operation is preserved. Specialists in sustainable rehabilitation advocate for letting these walls “breathe” to preserve the integrity of old buildings and thus ensure their sustainability (the drying of some old walls is sometimes detrimental and may even lead to premature collapse).
- In hot weather, especially during heatwaves, cooling should be ensured in the premises by evaporation of moisture from the walls. The discomfort to occupants, which is usually created by the moisture produced by evaporation and by the direct presence of the cold wall surfaces, should not exist. The effective cooling is of course less than that produced by air conditioning installation, but the energy consumed is negligible with respect to such systems.
2.2. Aeraulic Dimensioning
- Calculation of each perforated pipe of the network carried out “step by step” for each of its segments, taking into consideration the air side pressure losses caused by the blowing and suction networks;
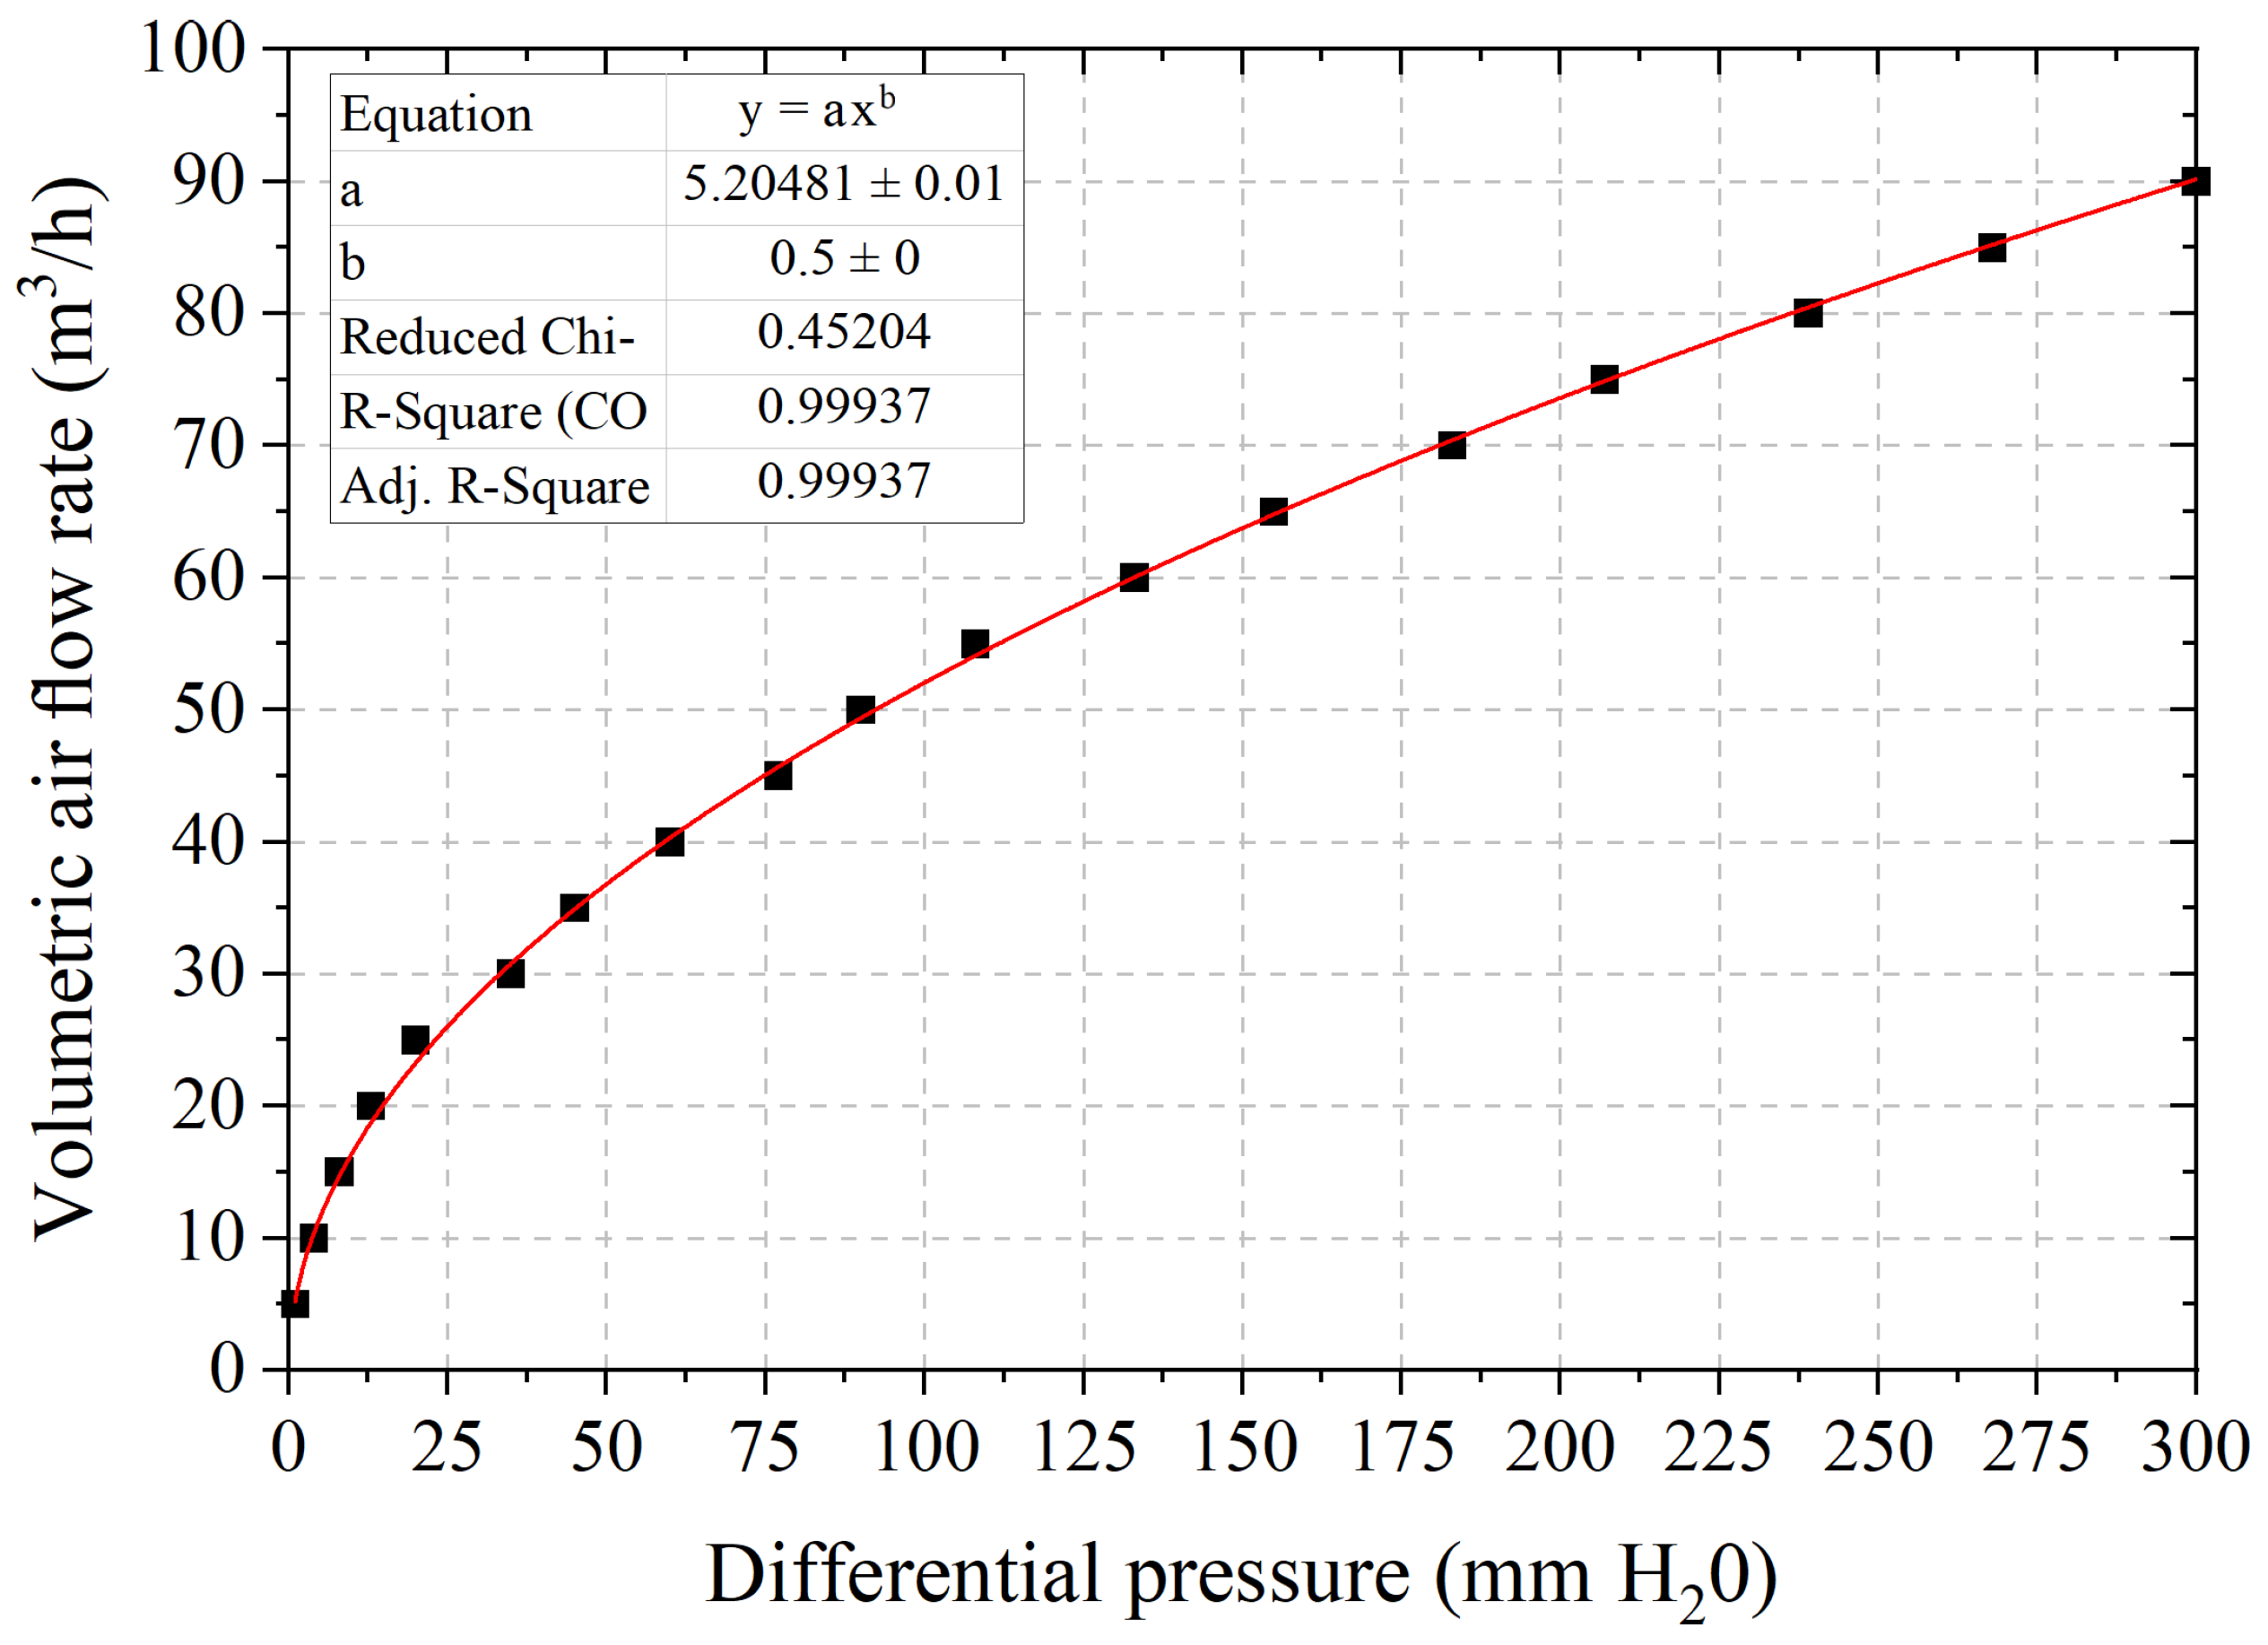
- Calculation of the overall aeraulic characteristics of the pipes thanks to series and parallel approaches, in particular the characteristic of the volumetric air flow rate Q at the inlet as a function of applied input pressure P: ;
- Direct calculation of the whole network flows, , for pressures of 100 Pa and 400 Pa;
- Direct calculation of global characteristics of the whole network ;
- Establishment of the operating point , and of the associated volumetric air flow rate regarding the choice of the fan;
- Direct calculation of the pressure P and the volumetric air flow rate Q for each segment regarding operation of the current network;
- “Step-by-step” calculation of blowing and suction air flows with respect to the operation of the current network during sweep scan;
- Determination of the daily sweep time for the whole network.
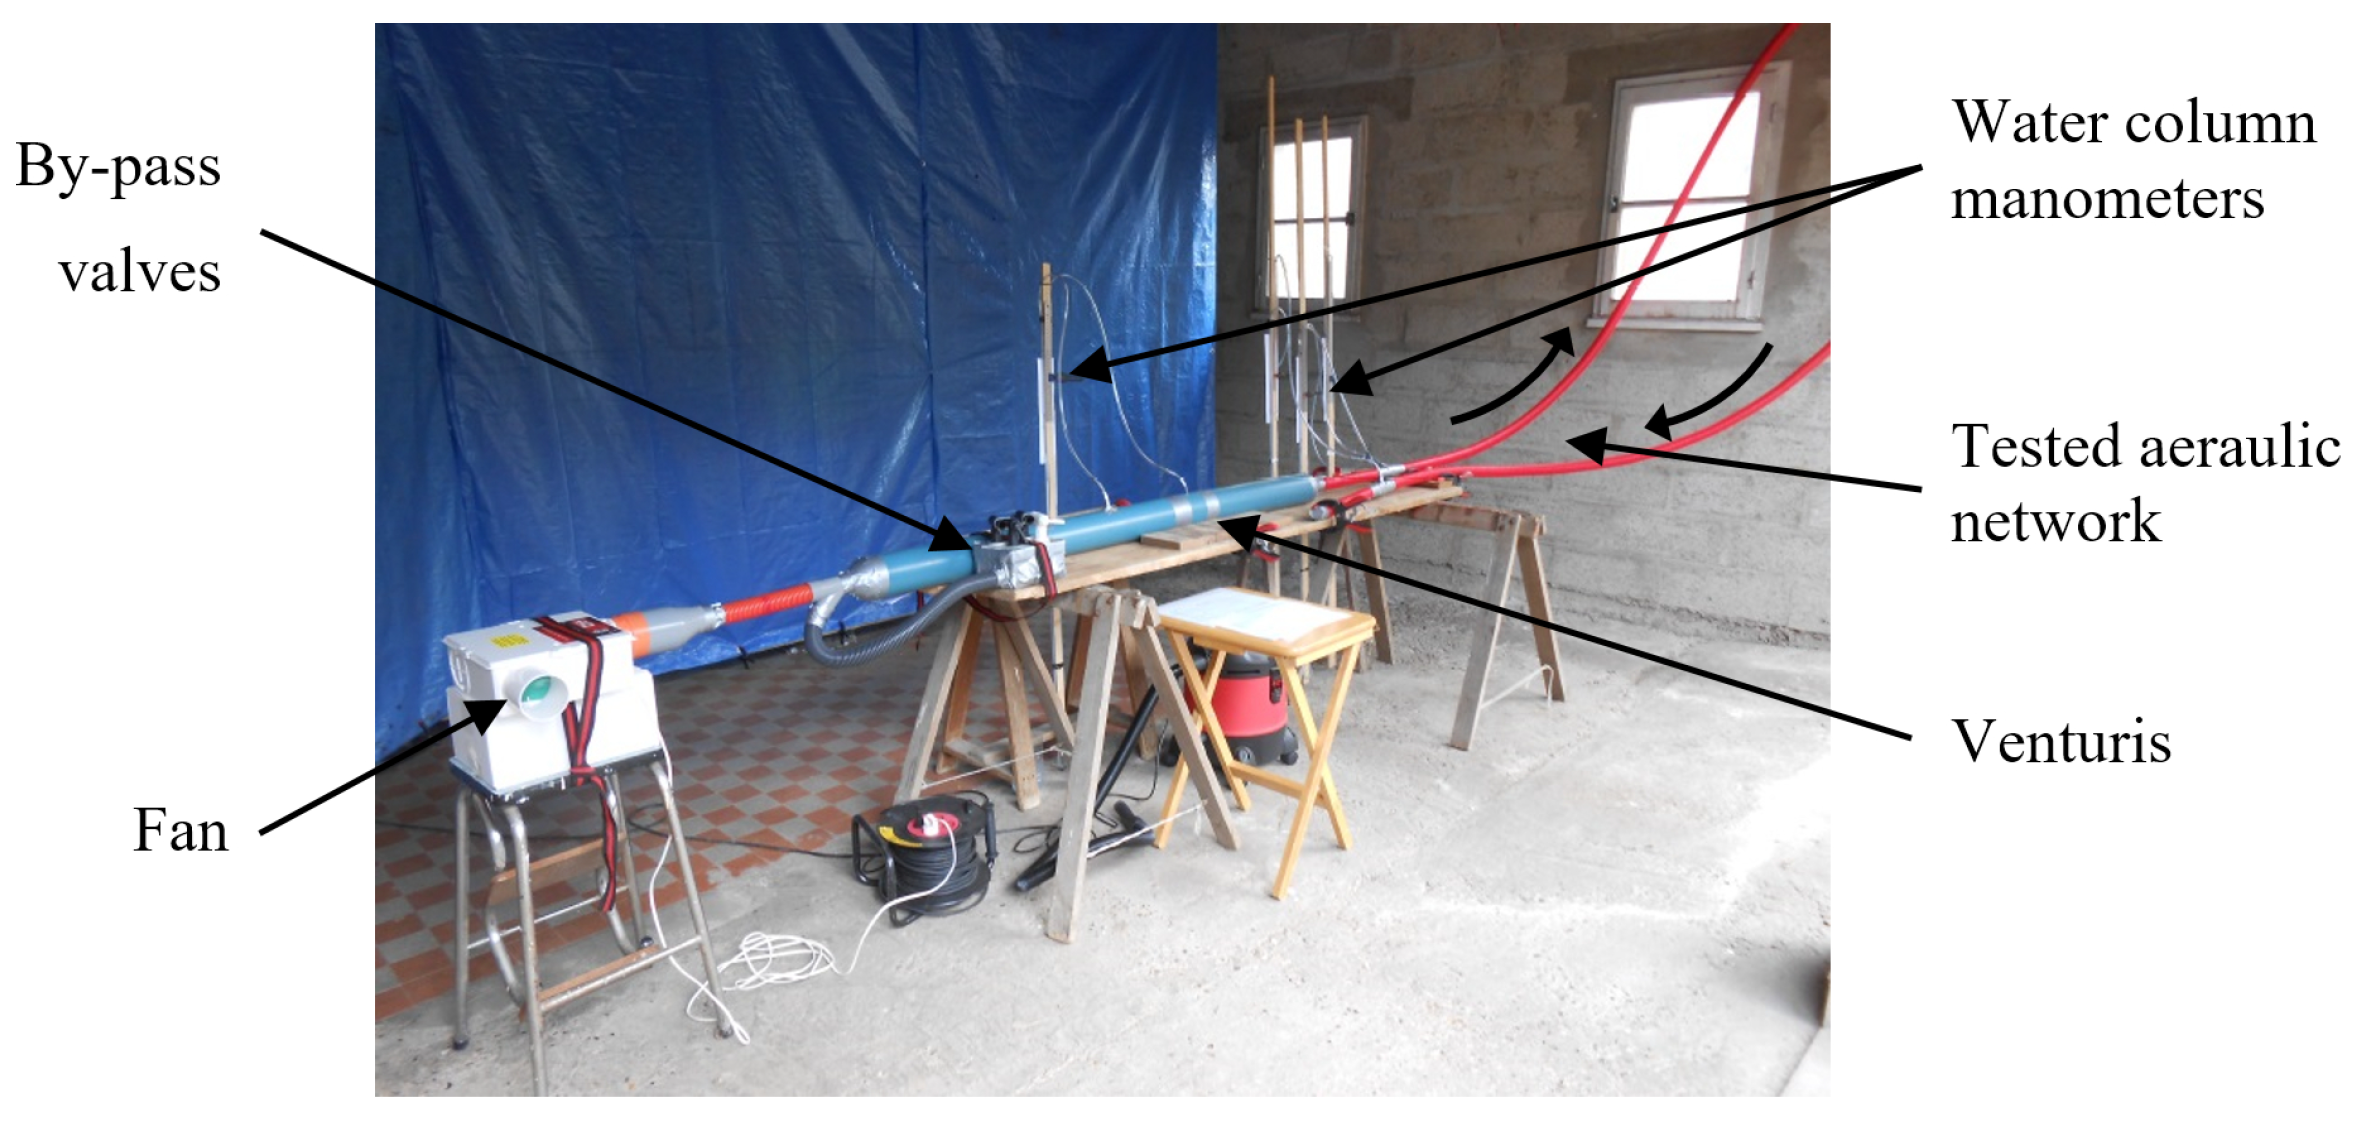
2.3. Experimental Validation
- IRL 25 tube unperforated (Length = 1 m, external diameter = 25 mm and internal diameter = 21.7 mm)
- IRL 25 tube with a length of 1.8 m consisting of 30 sections of 6 cm delimited by 5 mm diameter holes.
- TPC 40 unperforated ringed sheath (length = 24 m, external diameter = 40 mm and internal diameter = 32 mm)
- TPC 40 ringed sheath (4.5 m long unperforated followed by 15 m made up of 30 sections of 50 cm delimited by 5 mm diameter holes)
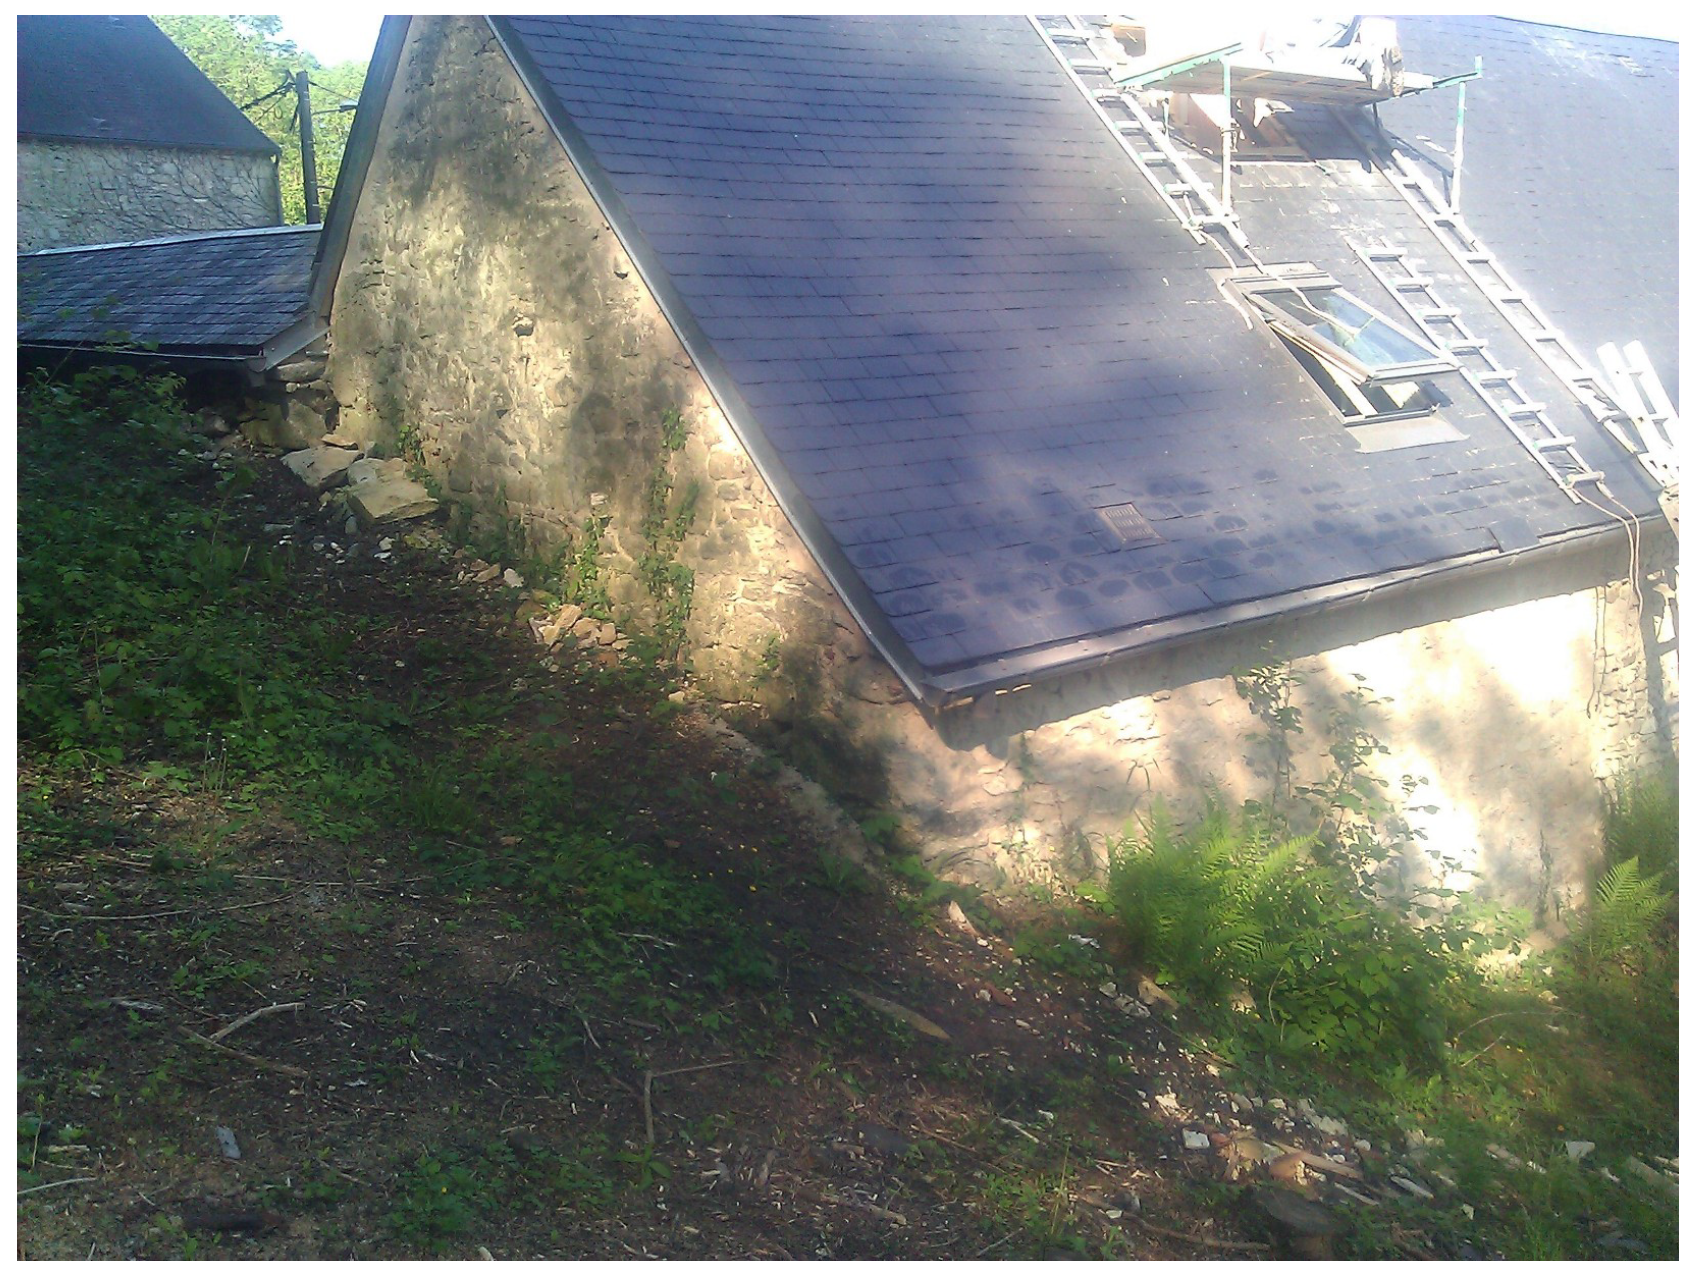
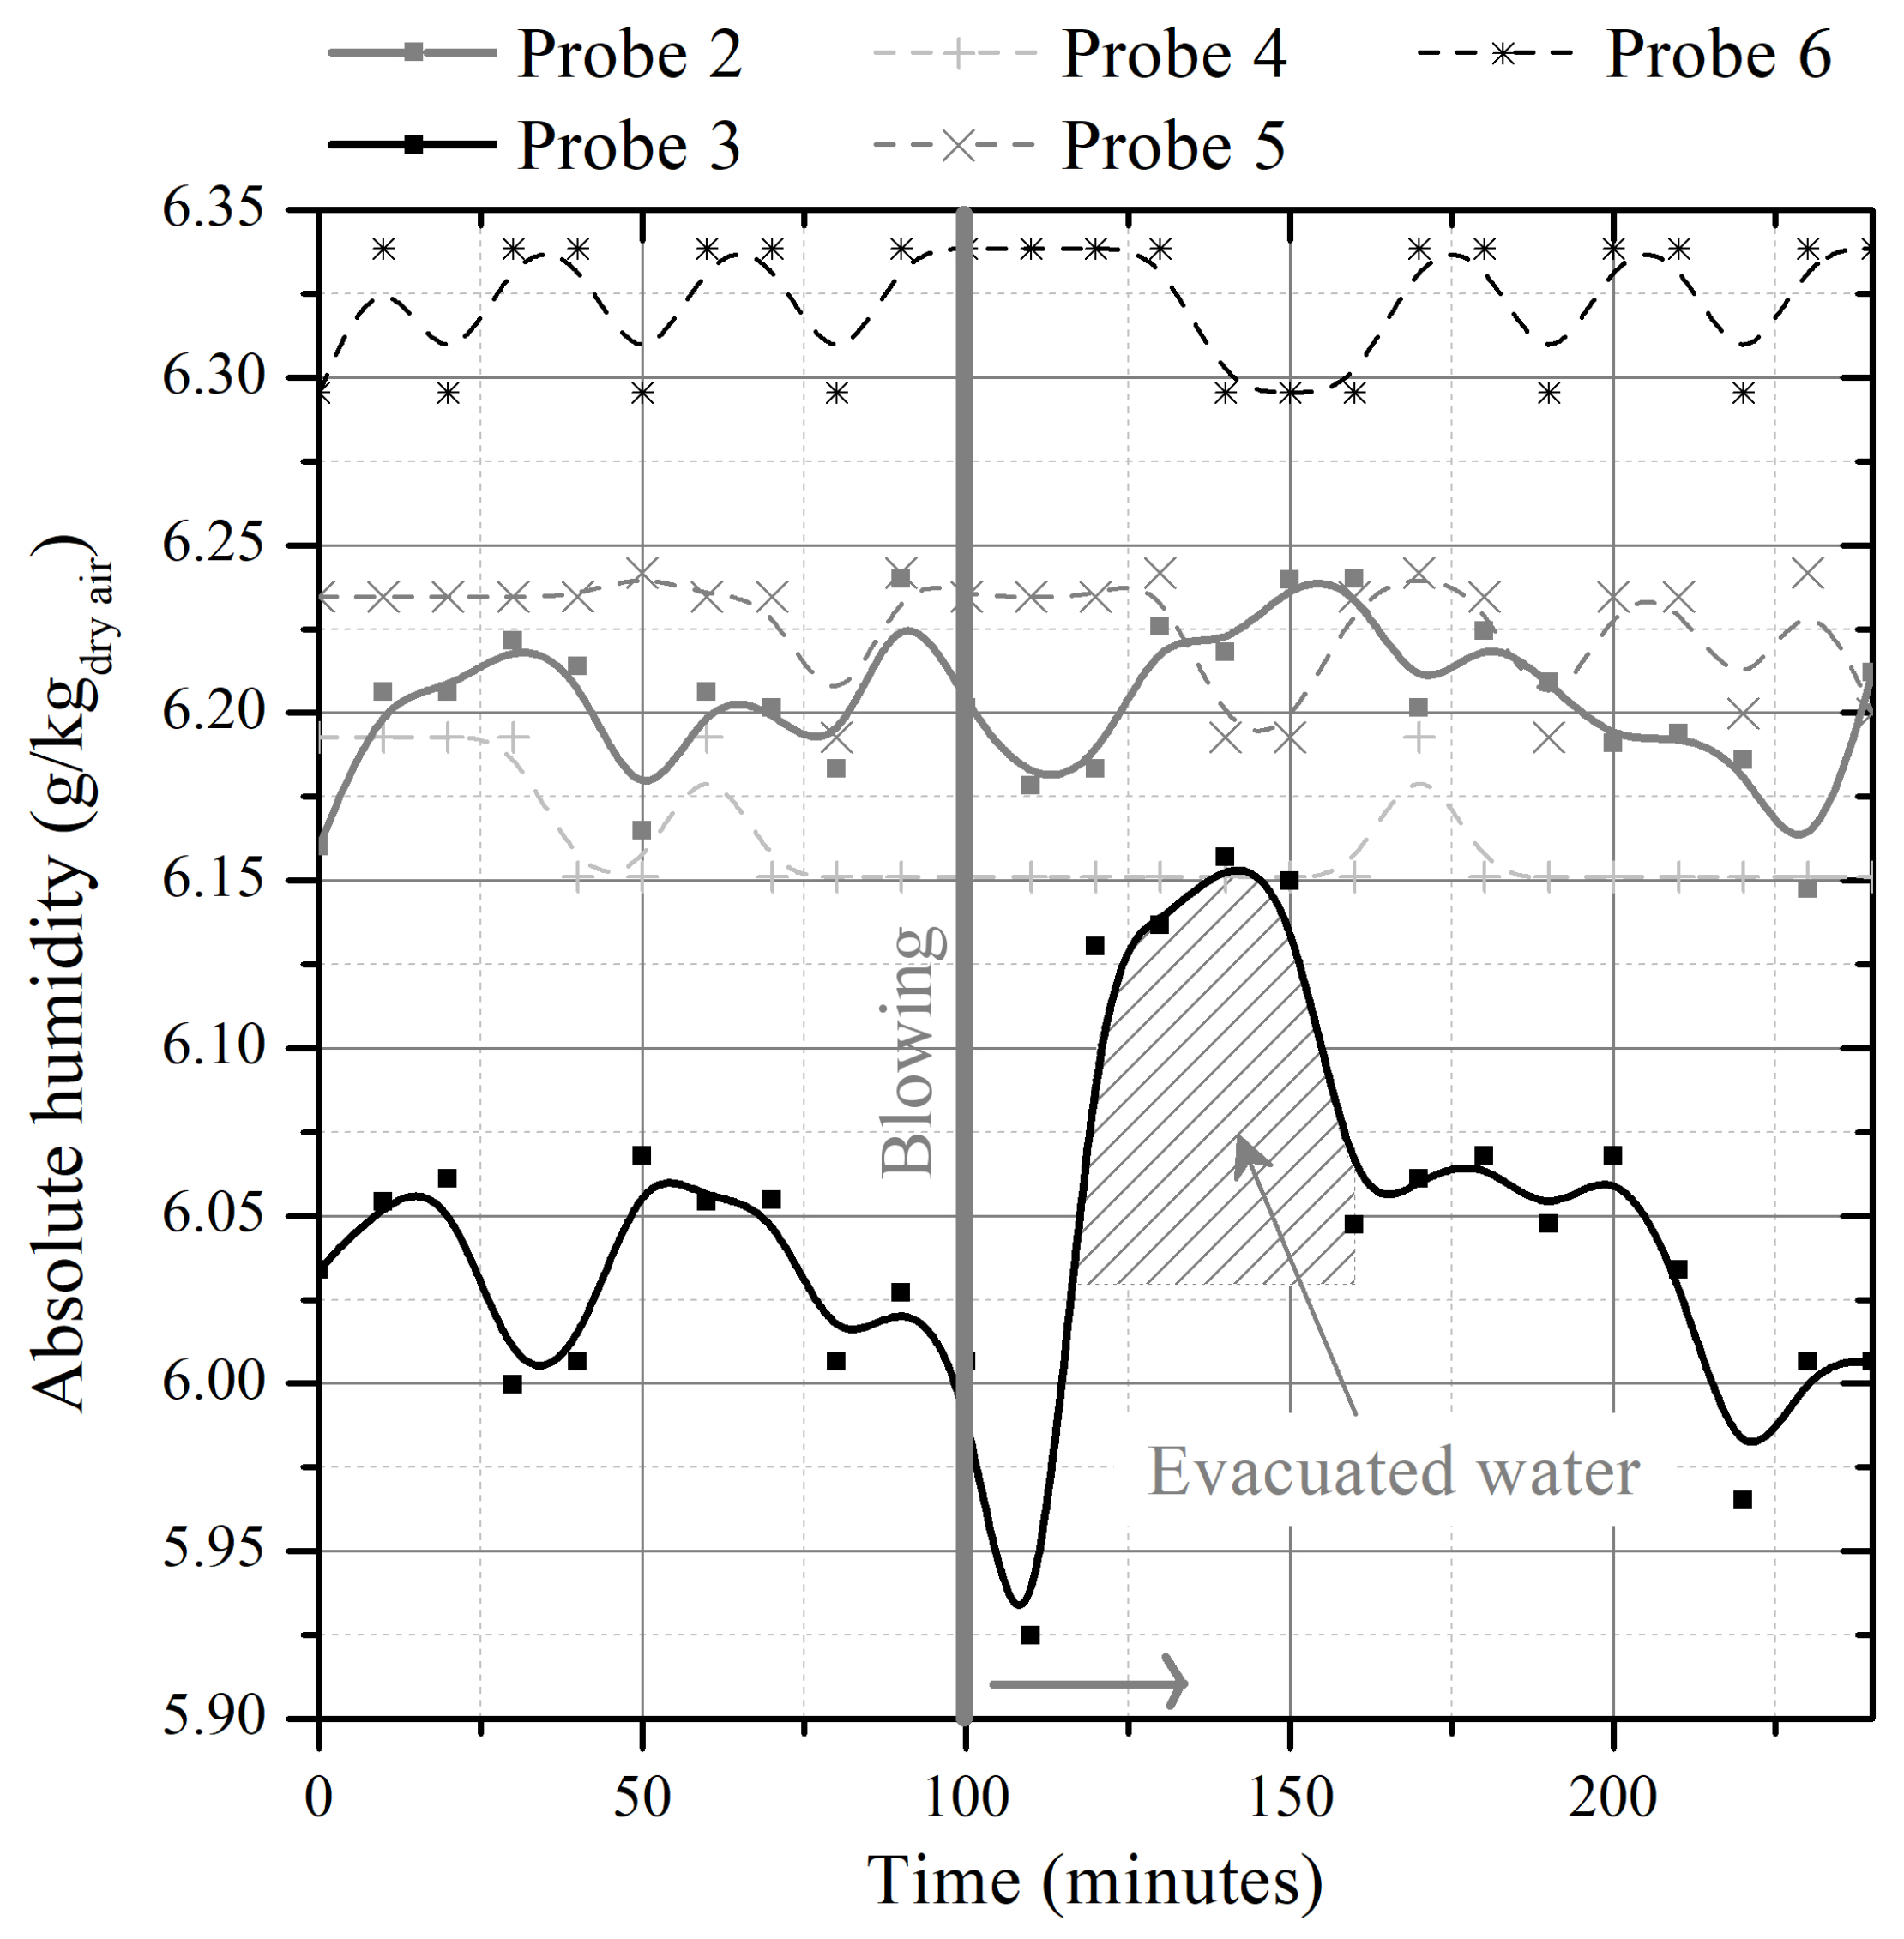
2.4. Case Study Using the Ventilation Device
3. Results and Discussion
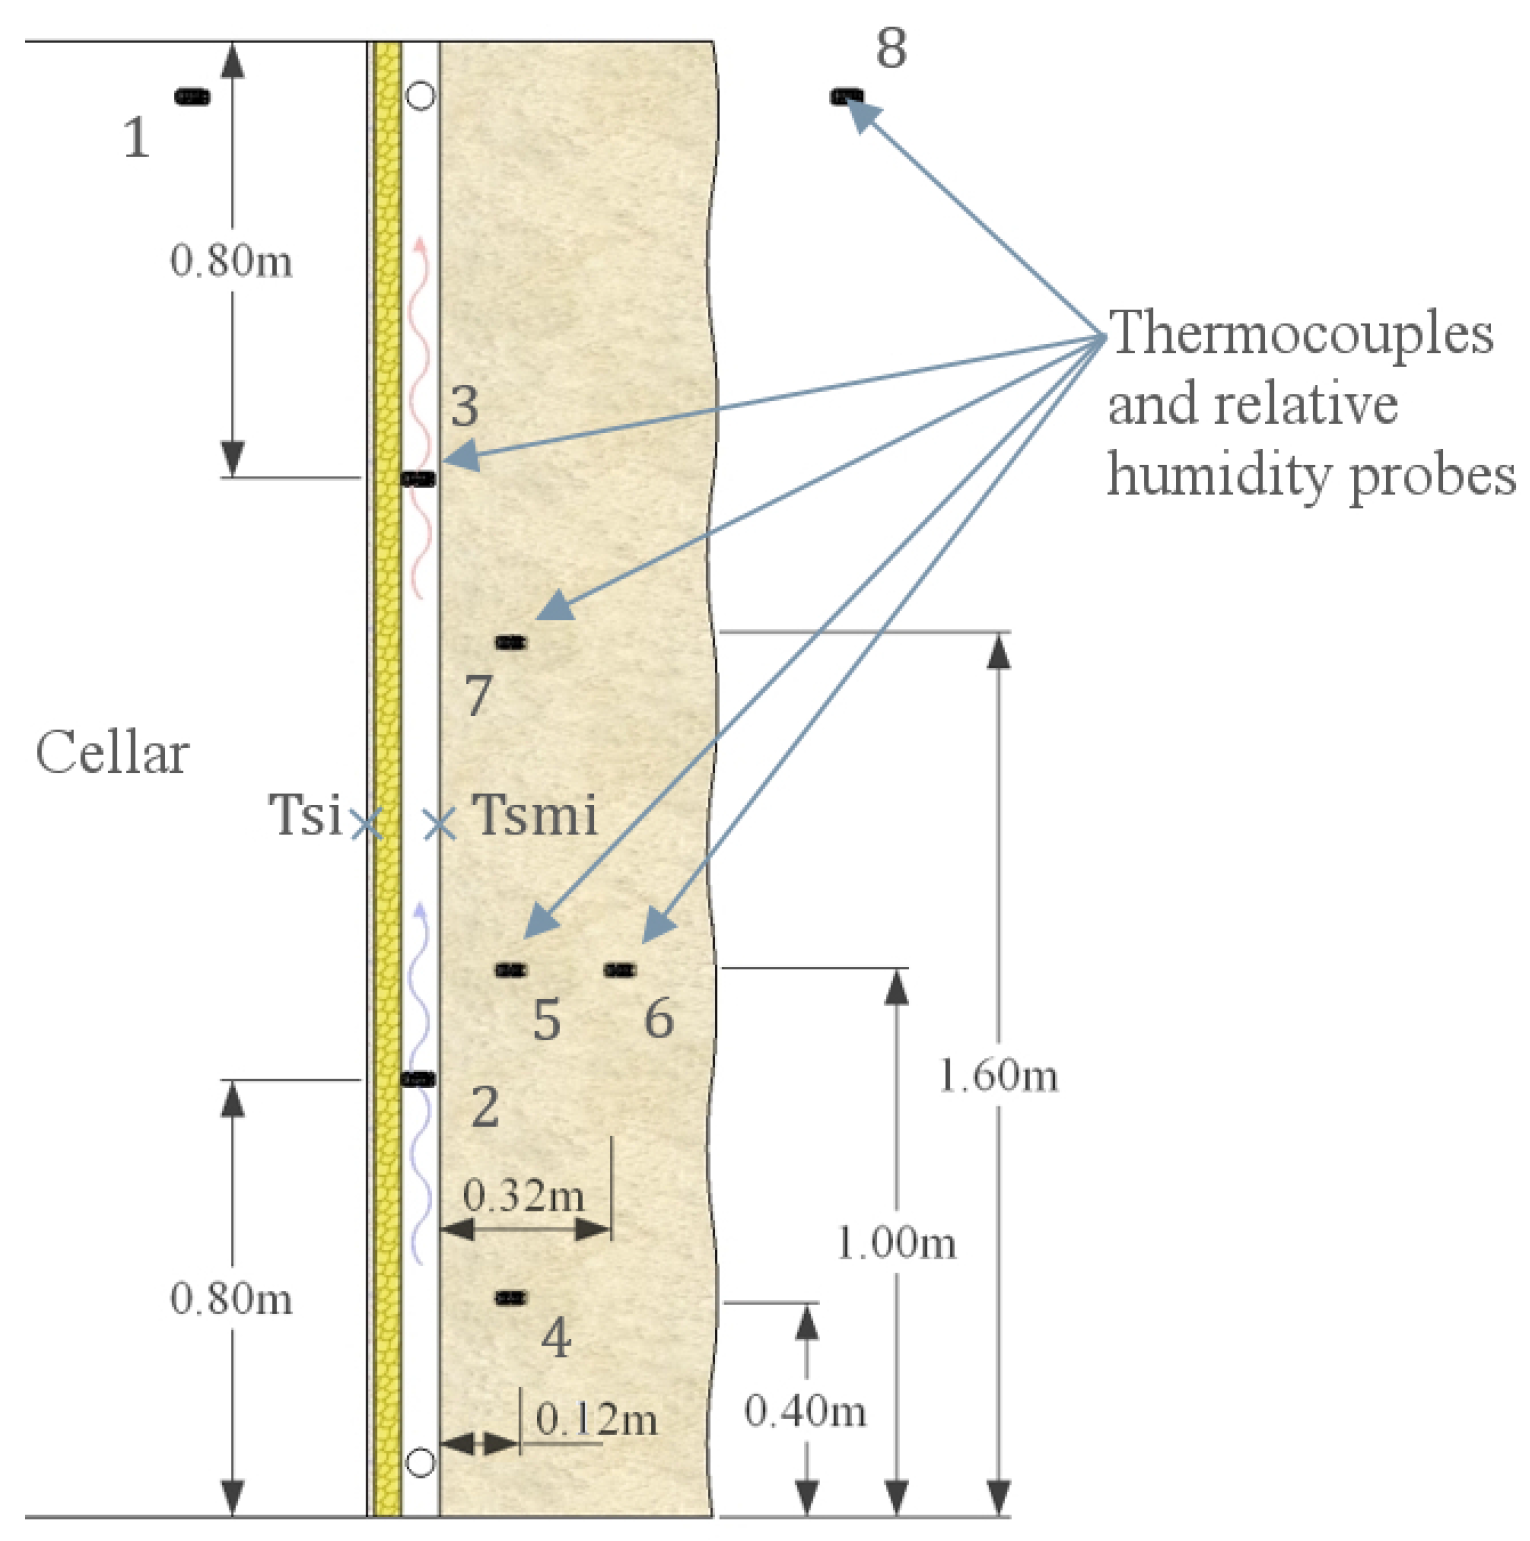
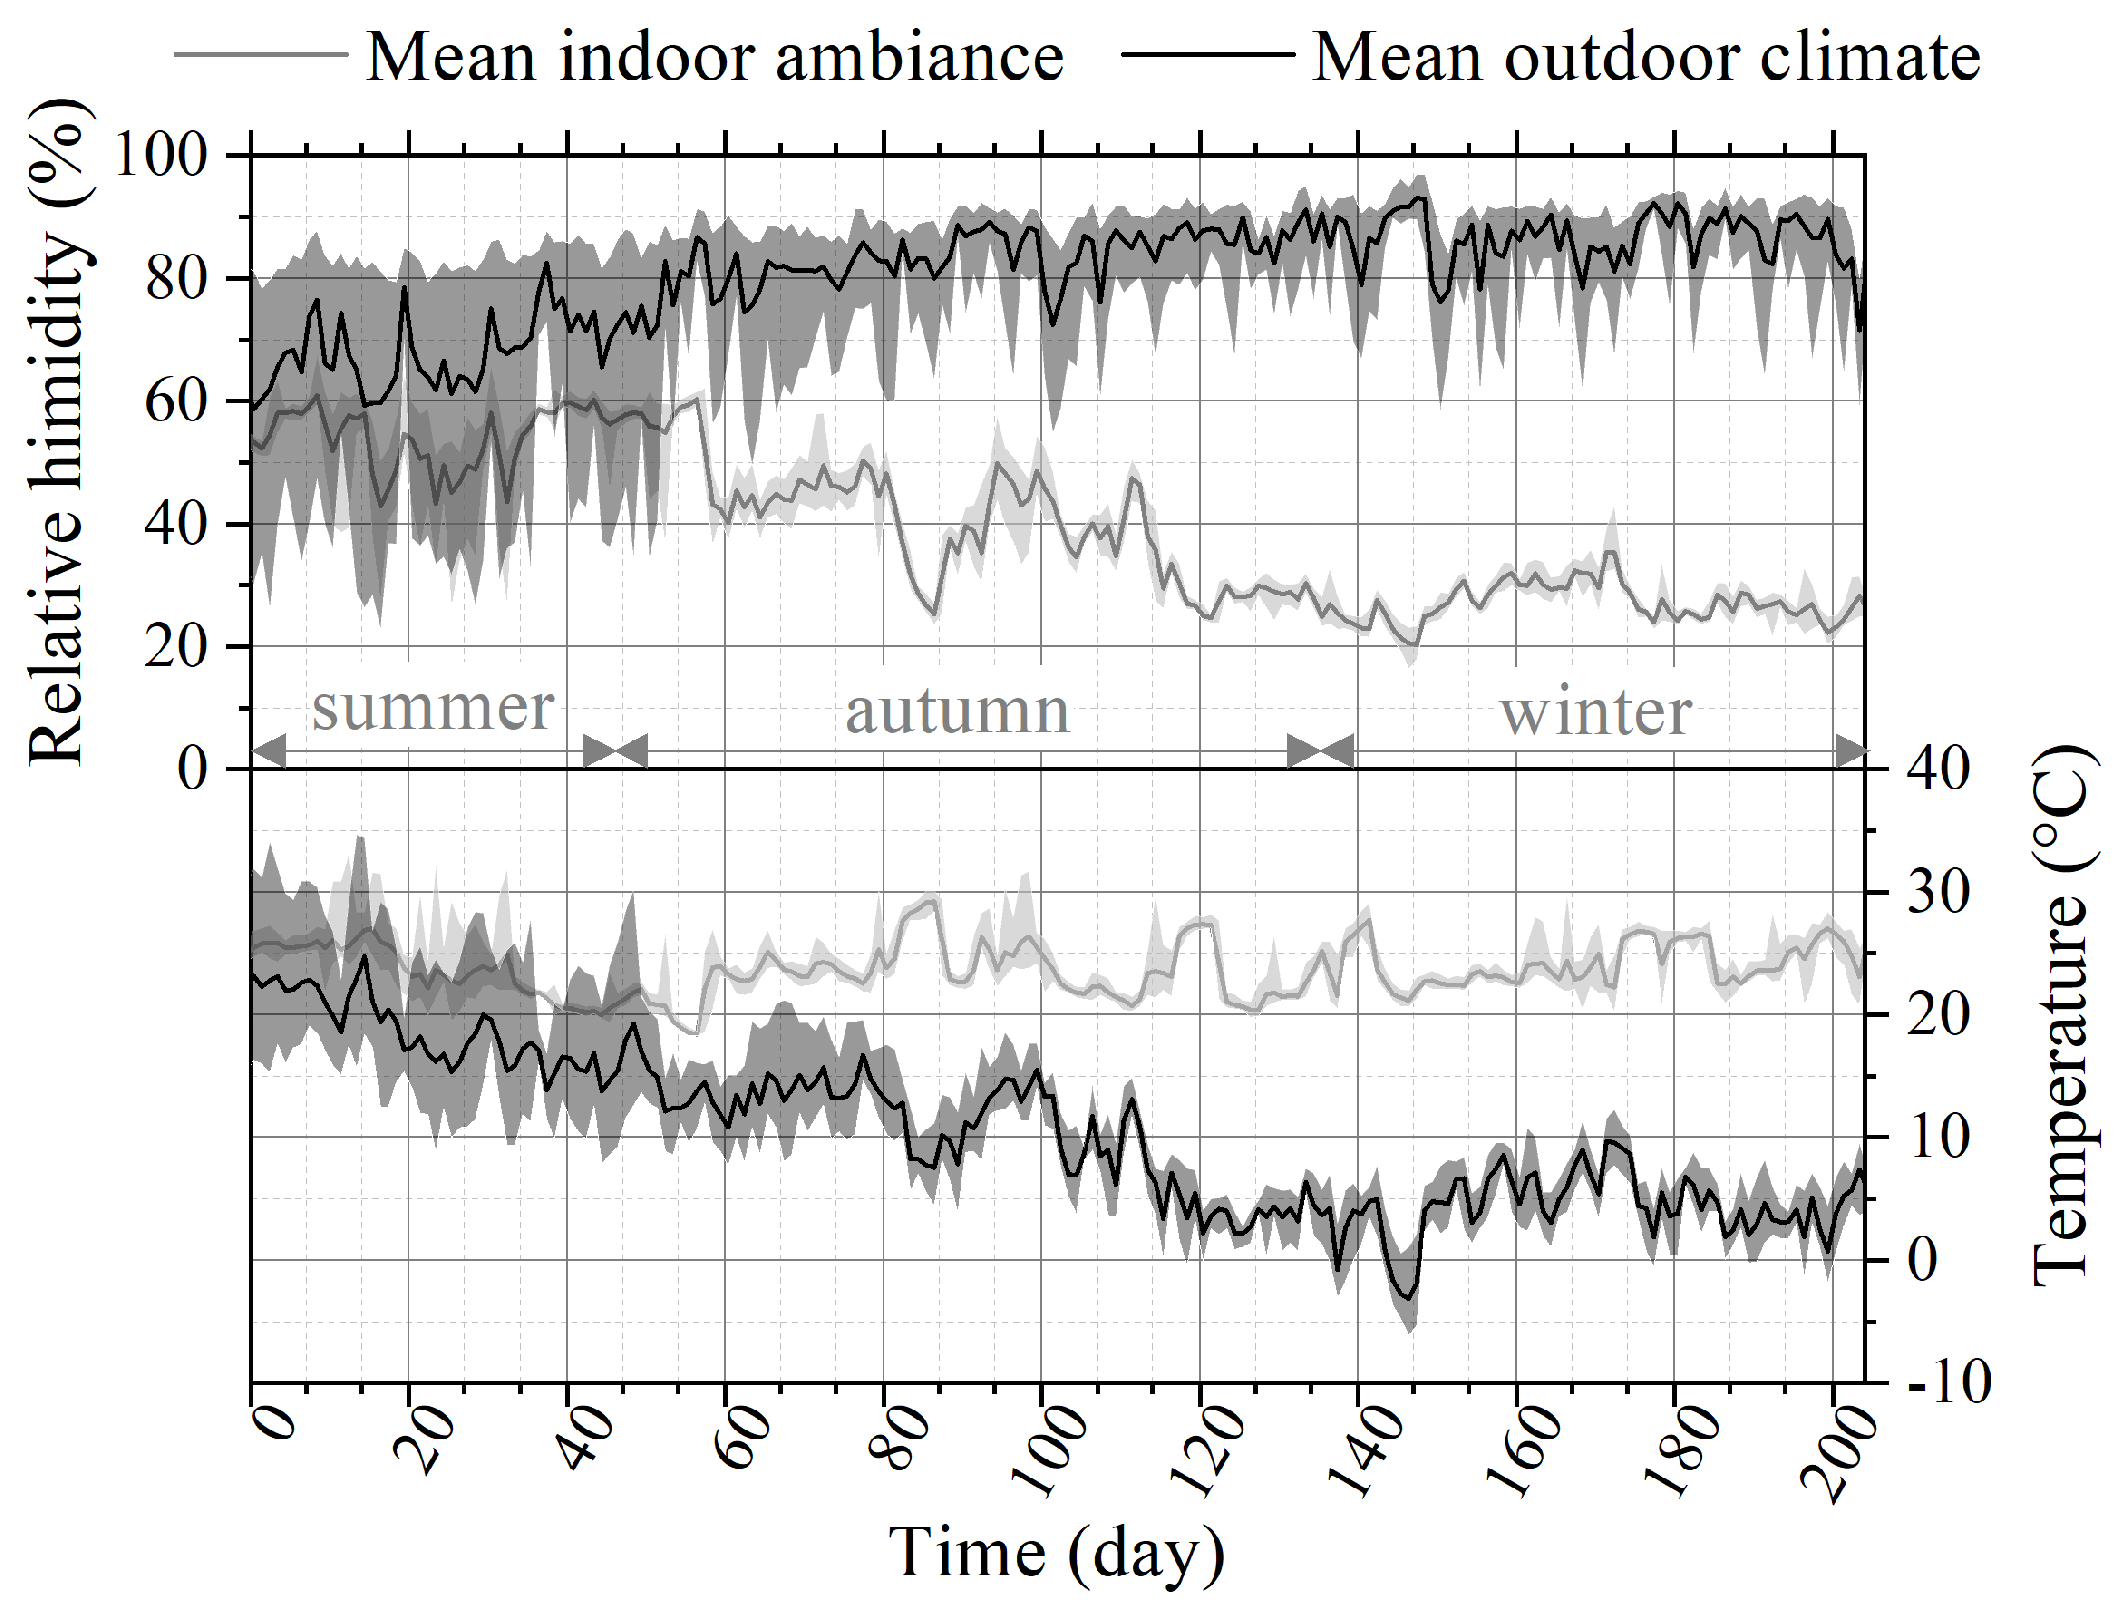
3.1. Outdoor Climate and Indoor Ambiance
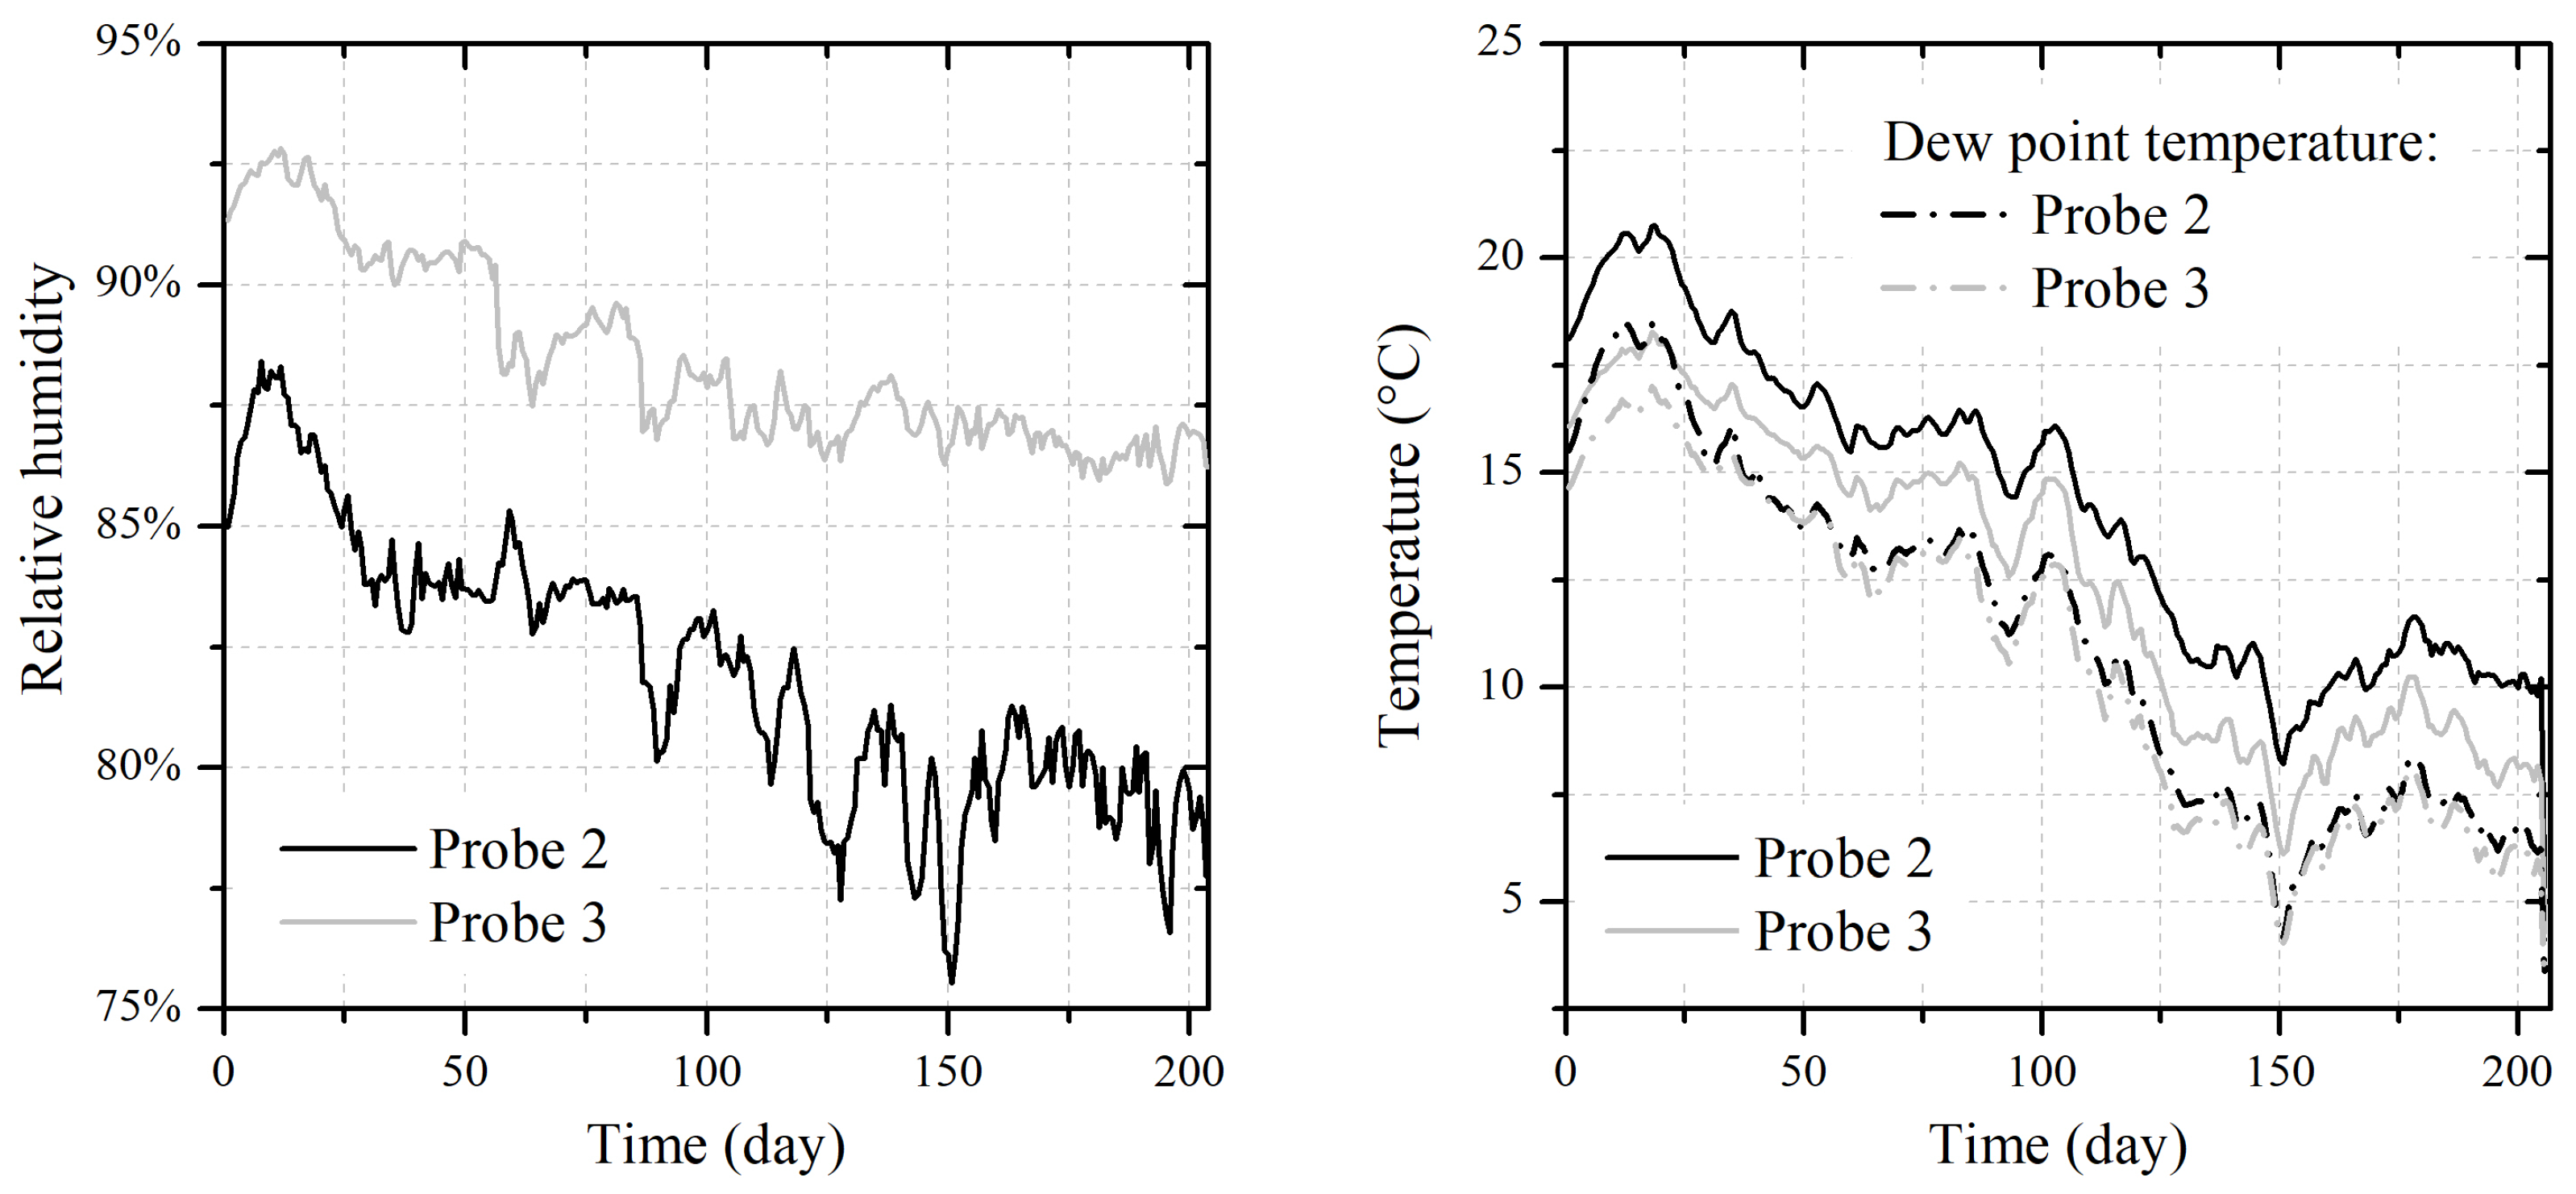
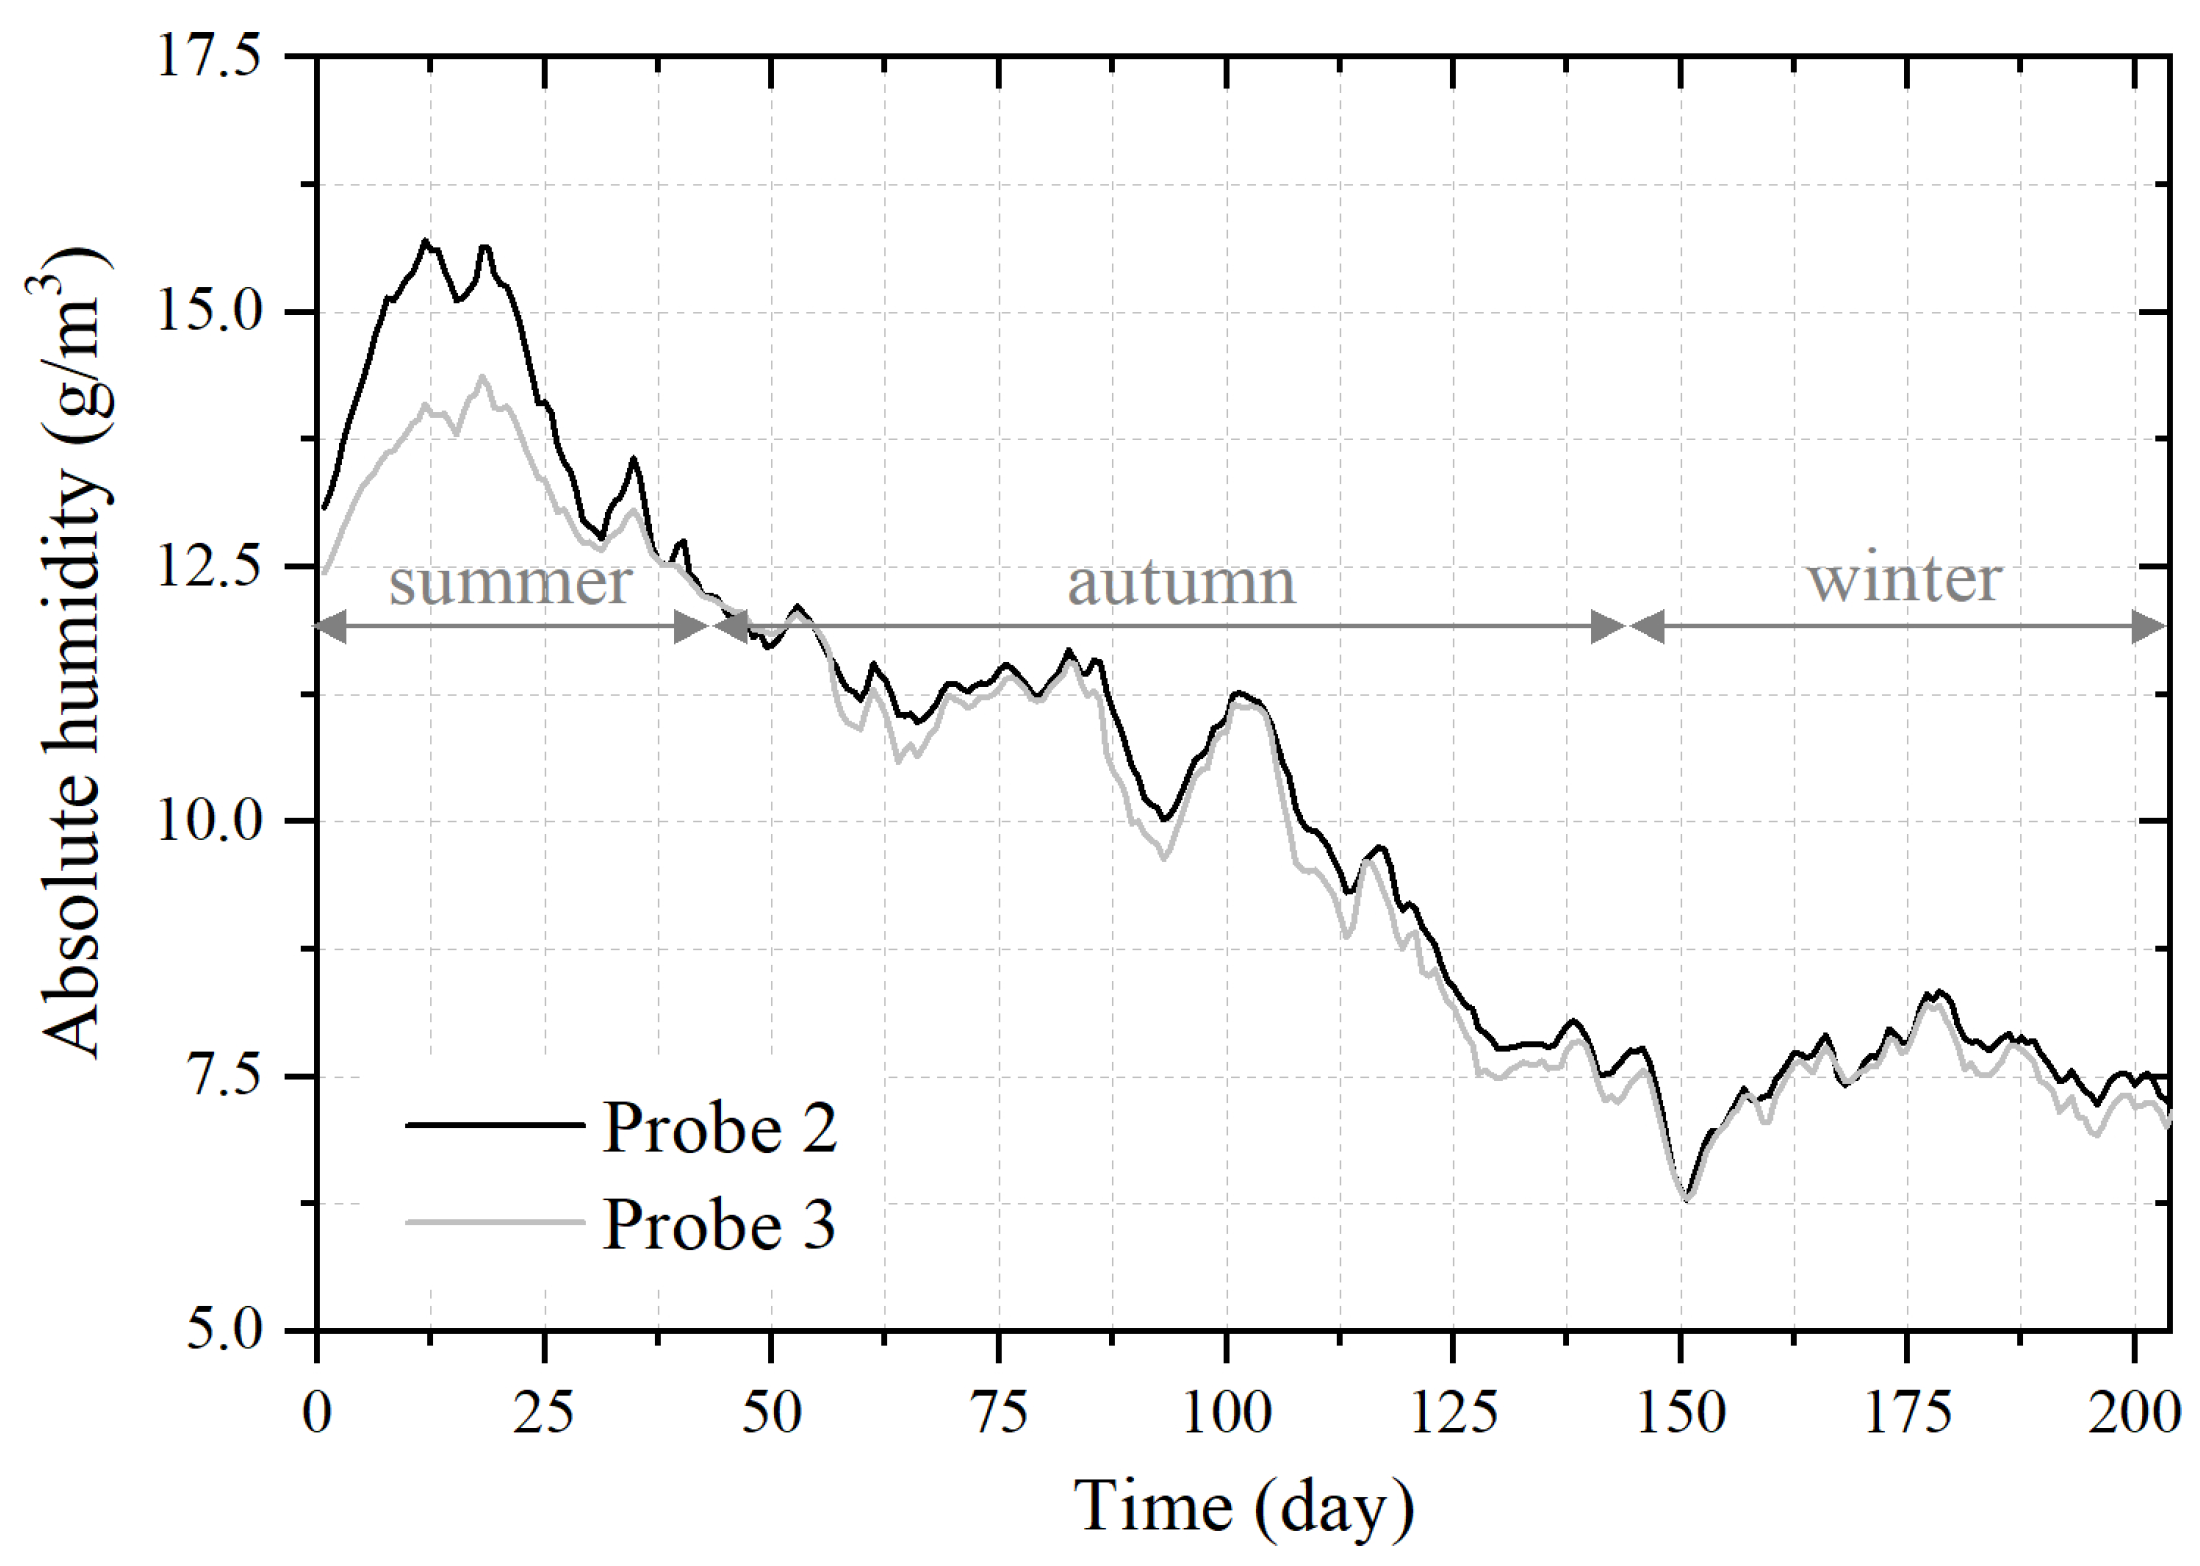
3.2. Analysis of the Hygrothermal Behavior of the Wall: Efficiency against Water Transfers
3.3. Approach of the Health Sustainability: Mould Growth and Development
4. Conclusions and Perspectives
Author Contributions
Funding
Institutional Review Board Statement
Informed Consent Statement
Acknowledgments
Conflicts of Interest
Nomenclature
| Greek | |
| head loss coefficient | |
| air density, kg/m3 | |
| relative humidity, % | |
| absolute humidity, g/kg | |
| Roman | |
| D | segment inner diameter, m |
| sweep time, s | |
| L | segments length, m |
| M | molar mass, g/mol |
| P | pressure, Pa |
| vapor partial pressure, Pa | |
| vapor saturation pressure, Pa | |
| static pressure, Pa | |
| operating point | |
| Q | volumetric air flow rate, m3/s |
| T | temperature, K |
| V | mean air velocity, m/s |
| Subscripts | |
| a | air |
| i | indoor |
| m | wall |
| s | surface |
| w | water |
References
- Johansson, P.; Ekstrand-Tobin, A.; Svensson, T.; Bok, G. Laboratory study to determine the critical moisture level for mould growth on building materials. Int. Biodeterior. Biodegrad. 2012, 73, 23–32. [Google Scholar] [CrossRef]
- Udawattha, C.; Galkanda, H.; Ariyarathne, I.S.; Jayasinghe, G.; Halwatura, R. Mold growth and moss growth on tropical walls. Build. Environ. 2018, 137, 268–279. [Google Scholar] [CrossRef]
- Yu, S.; Yu, Z.; Liu, P.; Feng, G. Influence of environmental factors on wall mold in underground buildings in Shenyang City, China. Sustain. Cities Soc. 2019, 46, 101452. [Google Scholar] [CrossRef]
- Cony Renaud Salis, L.; Abadie, M.; Wargocki, P.; Rode, C. Towards the definition of indicators for assessment of indoor air quality and energy performance in low-energy residential buildings. Energy Build. 2017, 152, 492–502. [Google Scholar] [CrossRef]
- D’Ayala, D.; Aktas, Y.D. Moisture dynamics in the masonry fabric of historic buildings subjected to wind-driven rain and flooding. Build. Environ. 2016, 104, 208–220. [Google Scholar] [CrossRef]
- You, S.; Li, W.; Ye, T.; Hu, F.; Zheng, W. Study on moisture condensation on the interior surface of buildings in high humidity climate. Build. Environ. 2017, 125, 39–48. [Google Scholar] [CrossRef]
- Annila, P.J.; Hellemaa, M.; Pakkala, T.A.; Lahdensivu, J.; Suonketo, J.; Pentti, M. Extent of moisture and mould damage in structures of public buildings. Case Stud. Constr. Mater. 2017, 6, 103–108. [Google Scholar] [CrossRef]
- Annila, P.J.; Lahdensivu, J.; Suonketo, J.; Pentti, M.; Vinha, J. Need to repair moisture- and mould damage in different structures in finnish public buildings. J. Build. Eng. 2018, 16, 72–78. [Google Scholar] [CrossRef]
- ANSES. Moisissures Dans le Bâti. 2016. Available online: https://www.anses.fr/fr/system/files/AIR2014SA0016Ra.pdf (accessed on 30 March 2020).
- Kim, K.H.; Jahan, S.A.; Kabir, E. A review on human health perspective of air pollution with respect to allergies and asthma. Environ. Int. 2013, 59, 41–52. [Google Scholar] [CrossRef] [PubMed]
- Lee, H.; Ozaki, A.; Lee, M.; Cho, W. A fundamental study of intelligent building envelope systems capable of passive dehumidification and solar heat collection utilizing renewable energy. Energy Build. 2019, 195, 139–148. [Google Scholar] [CrossRef]
- Li, B.; Hua, L.; Tu, Y.; Wang, R. A Full-Solid-State Humidity Pump for Localized Humidity Control. Joule 2019, 3, 1427–1436. [Google Scholar] [CrossRef]
- Kreiger, B.K.; Srubar, W.V. Moisture buffering in buildings: A review of experimental and numerical methods. Energy Build. 2019, 202, 109394. [Google Scholar] [CrossRef]
- Lubelli, B.; van Hees, R.P.; Bolhuis, J. Effectiveness of methods against rising damp in buildings: Results from the EMERISDA project. J. Cult. Herit. 2018, 31, S15–S22. [Google Scholar] [CrossRef]
- de Freitas, V.P. Humidade Ascencional, FEUP ed.; Faculdade de Engenharia da Universidade do Porto: Porto, Portugal, 2008; Volume 3, ISBN 9789727521012. [Google Scholar]
- af Klintberg, T.; Björk, F. Air Gap Method: Dependence of water removal on RH in room and height of floor air gap. Build. Environ. 2012, 56, 1–7. [Google Scholar] [CrossRef]
- af Klintberg, T.; Björk, F. Air Gap Method: Drying of a concrete slab on ground construction. Struct. Surv. 2010, 28, 281–299. [Google Scholar] [CrossRef]
- af Klintberg, T.; Björk, F. Air Gap Method: Measurements of airflow inside air gaps of walls. Struct. Surv. 2008, 26, 343–363. [Google Scholar] [CrossRef]
- af Klintberg, T.; Johannesson, G.; Björk, F. Air gaps in building construction avoiding dampness and mould. Struct. Surv. 2008, 26, 242–255. [Google Scholar] [CrossRef]
- Delgado, J.M.P.Q.; Guimarães, A.S.; de Freitas, V.P. Air Drying Technologies Applied to Buildings Treatment; Springer: Cham, Switzerland, 2014; pp. 1–26. [Google Scholar]
- Guimarães, A.S.; de Freitas, V.P. Wall base ventilation system as a new technique to treat rising damp in existent buildings. J. Build. Apprais. 2009, 5, 187–195. [Google Scholar] [CrossRef][Green Version]
- Guimarães, A.S.; Delgado, J.M.P.Q.; de Freitas, V.P. Rising damp in building walls: The wall base ventilation system. Heat Mass Transf. 2012, 48, 2079–2085. [Google Scholar] [CrossRef]
- Guimarães, A.S.; Delgado, J.M.; de Freitas, V.P. Treatment of rising damp in historic buildings: Experimental campaign of wall base ventilation and interface effect analysis. J. Cult. Herit. 2016, 20, 733–738. [Google Scholar] [CrossRef]
- Torres, M.I.M.; Peixoto de Freitas, V. Treatment of rising damp in historical buildings: Wall base ventilation. Build. Environ. 2007, 42, 424–435. [Google Scholar] [CrossRef]
- Torres, I.; de Freitas, V.P. The influence of the thickness of the walls and their properties on the treatment of rising damp in historic buildings. Constr. Build. Mater. 2010, 24, 1331–1339. [Google Scholar] [CrossRef]
- Kantoush, S.A.; Schleiss, A.J.; Sumi, T.; Murasaki, M. LSPIV implementation for environmental flow in various laboratory and field cases. J. Hydro-Environ. Res. 2011, 5, 263–276. [Google Scholar] [CrossRef]
- Gornicki, K.; Winiczenko, R.; Kaleta, A.; Choinska, A. Evaluation of models for the dew point temperature determination. Tech. Sci. 2017, 20, 241–257. [Google Scholar] [CrossRef]
- Rahim, M.; Douzane, O.; Tran Le, A.; Promis, G.; Langlet, T. Characterization and comparison of hygric properties of rape straw concrete and hemp concrete. Constr. Build. Mater. 2016, 102, 679–687. [Google Scholar] [CrossRef]
- Hens, H. IEA Annexe 14. Condensation and energy. J. Build. Phys. 1992, 15, 261–273. [Google Scholar] [CrossRef]
- Adan, O. On the Fungal Defacement of Interior Finished. Ph.D. Thesis, Eindhoven University of Technology, Eindhoven, The Netherlands, 1994. [Google Scholar]
- Johansson, S.; Wadso, L.; Sandin, K. Estimation of mould growth levels on rendered façaces on surface relative humidity and surface temperature measurements. Build. Environ. 2010, 45, 1153–1160. [Google Scholar] [CrossRef]
- Hukka, A.; Viitanen, H. A mathematical model of mould growth on wooden materials. Wood Sci. Technol. 1999, 33, 475–485. [Google Scholar] [CrossRef]
- Ojanen, T.; Peuhkuri, R.; Viitanen, H.; Lahdesmaki, K.; Vinha, J.; Salminen, K. Classification of materials sensitivity—New approach for mould growth modeling. In Proceedings of the 9th Nordic Symposium on Building Physics, Tampere, Finland, 29 May–2 June 2011; Volume 2, pp. 867–874. [Google Scholar]
- Ayerst, G. The effects of moisture and temperature on growth and spore germination in some fungi. J. Stored Prod. Res. 1969, 5, 127–141. [Google Scholar] [CrossRef]
- Smith, S.; Hill, S. Influence of temperature and water activity on germination and growth of Aspergillus restrictus and A. versicolor. Trans. Br. Mycol. Soc. 1982, 79, 558–560. [Google Scholar] [CrossRef]
- Clarke, J.; Johnstone, C.; Kelly, N.; McLean, R.; Anderson, J.; Rowan, N.; Smith, J. A technique for the prediction of the conditions leading to mould growth in buildings. Build. Environ. 1999, 34, 515–521. [Google Scholar] [CrossRef]
- Hens, H. Fungal Defacement in Buildings: A Performance Related Approach. HVAC&R Res. 1999, 5, 265–280. [Google Scholar]
- Wufi. 2005. Available online: www.hoki.ibp.fhg.de/wufi/downloads_e.html (accessed on 25 April 2019).
- Vereecken, E.; Roels, S. Review of mould prediction models and their influence on mould risk evaluation. Build. Environ. 2012, 51, 296–310. [Google Scholar] [CrossRef]


| Blowing | Suction | |
|---|---|---|
| Ducts | PVC DN 40 | |
| - Lenght (m) | 25.5 | 25.5 |
| - Internal diameter (mm) | 34 | 34 |
| - Spacing between holes (cm) | 50 | 50 |
| - Hole diameter (mm) | 5 | 5 |
| - Average air flow rate (m3/h) | 0.65 | 0.65 |
| Fans | SlimVent SVV80 (HELIOS) | |
| - Operating pressure (Pa) | 286 | 286 |
| - Volumetric air flow rate (m3/h) | 33 | 33 |
| - Operating time (min/day) | 30 | 30 |
| - Consumed energy (kWh/scan) | 0.017 | 0.017 |
| - Consumed energy (kWh/year) | 6.3 | 6.3 |
| Ventilation Operating | I3 | Coverage Area | |
|---|---|---|---|
| Summer | off | 2.9 | 10% < Coverage < 30% |
| Summer | on | 0.9 | Coverage < 1% |
| Autumn | on | 0.8 | Coverage < 1% |
| Winter | on | 0.5 | No mould growth |
Publisher’s Note: MDPI stays neutral with regard to jurisdictional claims in published maps and institutional affiliations. |
© 2021 by the authors. Licensee MDPI, Basel, Switzerland. This article is an open access article distributed under the terms and conditions of the Creative Commons Attribution (CC BY) license (https://creativecommons.org/licenses/by/4.0/).
Share and Cite
Promis, G.; Douzane, O.; Rousse, D.R.; Langlet, T. An Innovative System for the Treatment of Rising Dampness in Buildings Located in Cold Climates. Energies 2021, 14, 3421. https://doi.org/10.3390/en14123421
Promis G, Douzane O, Rousse DR, Langlet T. An Innovative System for the Treatment of Rising Dampness in Buildings Located in Cold Climates. Energies. 2021; 14(12):3421. https://doi.org/10.3390/en14123421
Chicago/Turabian StylePromis, Geoffrey, Omar Douzane, Daniel R. Rousse, and Thierry Langlet. 2021. "An Innovative System for the Treatment of Rising Dampness in Buildings Located in Cold Climates" Energies 14, no. 12: 3421. https://doi.org/10.3390/en14123421
APA StylePromis, G., Douzane, O., Rousse, D. R., & Langlet, T. (2021). An Innovative System for the Treatment of Rising Dampness in Buildings Located in Cold Climates. Energies, 14(12), 3421. https://doi.org/10.3390/en14123421